Fayez Mohamood * Michael Healy Sung Kyu Lim Hsien-Hsin “Sean” Lee
Contents lists available at ScienceDirect
Journal of the Mechanics and Physics of Solids
Journal of the Mechanics and Physics of Solids 95 (2016) 393–410
http://d0022-50
n CorrE-m
journal homepage: www.elsevier.com/locate/jmps
Determination of Ti-6242 α and β slip properties usingmicro-pillar test and computational crystal plasticity
Zhen Zhang n, Tea-Sung Jun, T. Benjamin Britton, Fionn P.E. DunneDepartment of Materials, Royal School of Mines, Imperial College London, London, SW7 2AZ, UK
a r t i c l e i n f o
Article history:Received 7 April 2016Received in revised form7 June 2016Accepted 10 June 2016Available online 16 June 2016
Keywords:β phaseTi-6242Micro-compressionStress relaxationStrain rate sensitivitySlip transferBurgers orientation relationship
x.doi.org/10.1016/j.jmps.2016.06.00796/& 2016 Elsevier Ltd. All rights reserved.
esponding author.ail address: [email protected] (Z. Z
a b s t r a c t
The properties and behaviour of an α�β colony Ti-6242 alloy have been investigated at20 °C utilising coupled micro-pillar stress relaxation tests and computational crystalplasticity. The β-phase slip strength and intrinsic slip system strain rate sensitivity havebeen determined, and the β-phase shown to have stronger rate sensitivity than that forthe α phase. Close agreement of experimental observations and crystal plasticity pre-dictions of micro-pillar elastic-plastic response, stress relaxation, slip activation in both αand β-phases, and strain localisation within the α�β pillars with differing test strain rate,β morphology, and crystal orientations is achieved, supporting the validity of the prop-erties extracted. The β-lath thickness is found to affect slip transfer across the α�β�αcolony, but not to significantly change the nature of the slip localisation when comparedto pure α-phase pillars with the same crystallographic orientation. These results areconsidered in relation to rate-dependent deformation, such as dwell fatigue, in complexmultiphase titanium alloys.
& 2016 Elsevier Ltd. All rights reserved.
1. Introduction
Dual phase (α–β) titanium alloys have been widely utilised in aerospace and energy industries owing to their highstrength to weight ratio, excellent fracture toughness and corrosion resistance (Banerjee and Williams, 2013; Boyer, 1996).The mechanical properties of these alloys are strongly affected by their microstructures, which are controlled throughthermo-mechanical processing (Donachie, 2000; Lutjering, 1998; Weiss and Semiatin, 1998, 1999). A key feature of theirmicrostructure is the Burgers orientation relationship (BOR) which defines the crystallographic relationship between thehcp alpha (α) and bcc beta (β) phases and is found largely to be invariant (Bhattacharyya et al., 2003). This, together withcrystallography and α�β morphological arrangements, such as in effective structure units (ESU), macrozones or micro-textured regions (MTRs), are thought to be important in controlling the mechanical response of these alloys (Bhattacharyyaet al., 2003). A critical factor in the α–β titanium alloys is argued to be that of their rate-sensitive response under strain andstress-controlled loading, with the former leading to stress relaxation and the latter to creep, both of which occur even atlow (20 °C and lower) temperature and under low stresses (Adenstedt, 1949; Chu, 1970; Neeraj et al., 2000). The phe-nomenon of local stress relaxation within a soft grain leading to load shedding onto an adjacent harder grain is argued to beimportant for cold dwell fatigue in aero-engine components (Bache, 2003; Dunne and Rugg, 2008), potentially leading tosignificant dwell debit in component life, resulting from the nucleation of fatigue facets on basal planes (Bridier et al., 2008;
hang).
Z. Zhang et al. / J. Mech. Phys. Solids 95 (2016) 393–410394
Sinha et al., 2006). Experimental observations have indicated that slip transfer from α to β phases appears to be anisotropicand crystallographically dependent (Suri et al., 1999) and this is critical in considering key microstructural features thatcontrol dwell fatigue in formed aerospace components.
Creep and rate-sensitive behaviour of dual phase titanium alloys have been found to be dependent on microstructure andα�β colony structure leading to significant creep variability (Suri et al., 1999). Creep studies of titanium alloy have beenfocused mostly on α-titanium (Conrad, 1967, 1981; Paton et al., 1976; Williams et al., 2002), but have also included work onα–β dual phase alloys (Neeraj et al., 2000; Savage et al., 2001, 2004; Suri et al., 1999) addressing colony structures, and therole of the BOR in affecting α creep response. Ankem and Margolin (1980) have reported that the α phase gave a highercreep resistance than the β phase in a Ti–Mn alloy. More recent studies of the α phase in alloy Ti-6242 showed significantanisotropy in rate-sensitive behaviour depending on crystallographic orientation and slip system activation, and providedintrinsic rate sensitivities of basal and prismatic systems (Jun et al., 2016b; Zhang et al., 2016b). The creep behaviour of βphase Ti has been investigated in experimental studies from eight independent tests (Schuh and Dunand, 2001) because ofits relevance to the properties and behaviour of α�β colonies. The creep behaviour of β titanium was found to follow atypical power-law in stress over 0.5–50 MPa, giving strain rates from 10�7 to 102 s�1 over temperature range 900–1300 °C.Unfortunately, information on the creep and rate sensitivity of β phase Ti at temperatures around 20 °C is not available inthe literature despite its importance in understanding dual phase Ti alloys.
The direct determination of β phase properties from dual phase titanium alloys such as Ti-6242 is challenging since thecolony structures comprise β laths which are very thin (�2 μm or less), thereby making the manufacture of mechanicalspecimens, eg by FIB of micro-pillar samples, in β alone difficult. Micro-pillar technology allows investigation of creepbehaviour using specimens of multiple microns (Choi et al., 2013; Gu and Ngan, 2014; Zhang et al., 2013) and recent studieshave utilised micro-pillars for the extraction of α-Ti creep properties (Zhang et al., 2016b). This work also made clear theimportance of explicit representation of rig, sample base and epoxy substrate effects on stiffness to ensure the extraction ofintrinsic α-Ti properties, which required the integration of micro-pillar test with crystal plasticity modelling. Ignoring thecontribution of external compliance to the total deformation during stress relaxation potentially led to a different inter-pretation of strain rate sensitivity in individual slip systems, as found in Jun et al. (2016b).
Crystal plasticity modelling affords explicit representation of the micromechanical performance of individual micro-structural components and enables the structural response of components to be represented accurately. Ardeljan et al.(2014) used a dislocation density based crystal plasticity model for monotonic large plastic deformations up to 30% in a Zr/Nb (HCP-BCC) two-phase layered composite for the purposes of deformation and texture evolution in both phases. Dekaet al. (2006) presented experimentally validated crystal plasticity modelling to analyse constant strain rate and creep tests incompression and tension of polycrystalline Ti-6242. The plastic shearing rate was represented by a power-law relation(Asaro and Needleman, 1985) and a constant strain rate sensitivity was assumed across α phase basal oa4 , prismaticoa4 and all β systems. The polycrystalline Ti-6242 model incorporated accurate phase volume fractions, as well as sta-tistically equivalent orientation distributions to those obtained from orientation image microscopy scans. This approach wasadopted in studying size-dependent yield strength in Ti-6242 (Venkatramani et al., 2007) in which a Hall–Patch type re-lation was introduced for slip strength such that the strength in each slip system depends on a characteristic length scale.Linear relations were obtained between the yield strength and the inverse square root of characteristic length (i.e. colonysize and grain size) and thickness of α phase lath. The size dependent crystal plasticity model was then applied to studycreep-induced load shedding in Ti-6242 (Venkataramani et al., 2008). Recent integrated experimental and crystal plasticitymodelling studies (Jun et al., 2016b; Zhang et al., 2016b) have shown that the strain rate sensitivities for α phase basal andprismatic slip systems in Ti-6242 are different. The rate sensitivity and creep properties of the β phase in Ti-6242 remainunknown and this limits use of these properties in dual phase alloys.
In addition, it is also important to understand slip activity during stress relaxation, particularly in relation to loadshedding (Dunne and Rugg, 2008; Venkataramani et al., 2008; Zhang et al., 2015). Slip transfer across the α�β interfaces,and the role of the BOR, remains an area of importance with slip transmission from one phase to another (Bhattacharyyaet al., 2003) dependent upon crystallographic orientation combinations of the α and β phases. Ambard et al. (2001) foundthat the nature of α slip depended upon α grain morphology with globular grains giving rise predominantly to prismatic slipand colonies leading to more basal activation. The study by Seal et al. (2012) on Ti–5Al–2.5Sn alloy revealed that whenneighbouring β phase exhibited a high Schmid factor, slip transfer across the phase boundary was more likely to be ob-served. The boundaries having { } { }α β0001 / 110 BOR were not necessarily favourable for α β− slip transfer.
The present paper focuses on the behaviour of α–β colony structures in α–β Ti-6242 alloy. An coupled micro-pillar andcrystal plasticity modelling methodology is utilised in order to extract out the intrinsic properties of the β phase, recognisingthat this phase may also show strong rate sensitivity even at low (20 °C) temperatures. This is accomplished with existingknowledge of the α phase properties Zhang et al. (2016b). Experiments and simulations of micro-pillar compression testshave been carried out on α�β colony structures generating α basal and prismatic slip, and β slip. Displacement hold testsare implemented at strain rates from 2�10�3 s�1 to 1�10�2 s�1 in order to investigate stress relaxation in the colonystructures. Direct crystal plasticity modelling of the tested samples is used to obtain the β phase properties, including itsstrain rate sensitivity. With knowledge of the properties of the α and β phases, the Ti-6242 colonies are modelled usingcrystal plasticity to investigate slip activity, and the inhomogeneous deformation established and direct comparisons withexperiments are given. In passing, lattice rotation, and the BOR after deformation are also examined. Extraction of materialsproperties using coupled experiments and simulations enables direct determination and validation of the crystal plasticity
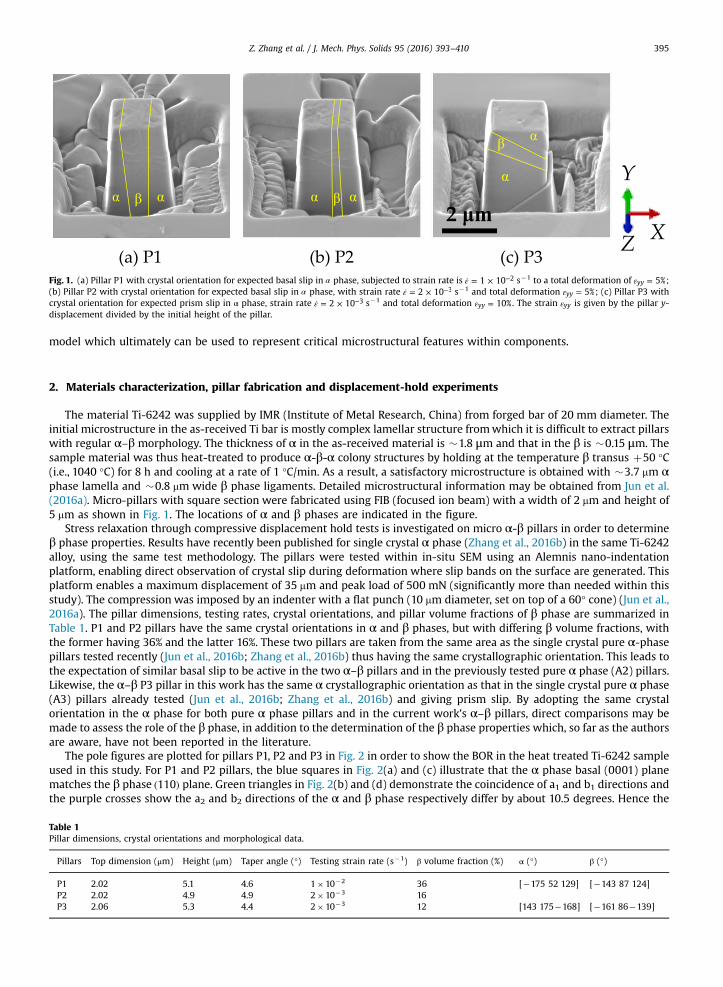
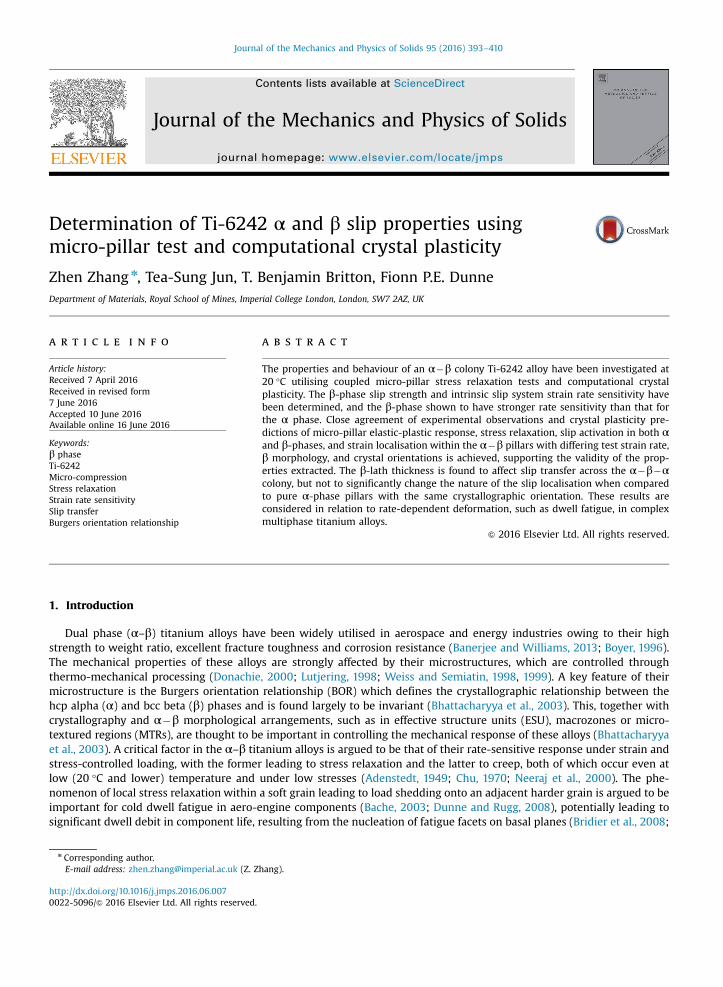
Fig. 1. (a) Pillar P1 with crystal orientation for expected basal slip in α phase, subjected to strain rate is ε = × −1 10 2 s�1 to a total deformation of ε = 5%yy ;(b) Pillar P2 with crystal orientation for expected basal slip in α phase, with strain rate ε = × −2 10 3 s�1 and total deformation ε = 5%yy ; (c) Pillar P3 withcrystal orientation for expected prism slip in α phase, strain rate ε = × −2 10 3 s�1 and total deformation ε = 10%yy . The strain εyy is given by the pillar y-displacement divided by the initial height of the pillar.
Z. Zhang et al. / J. Mech. Phys. Solids 95 (2016) 393–410 395
model which ultimately can be used to represent critical microstructural features within components.
2. Materials characterization, pillar fabrication and displacement-hold experiments
The material Ti-6242 was supplied by IMR (Institute of Metal Research, China) from forged bar of 20 mm diameter. Theinitial microstructure in the as-received Ti bar is mostly complex lamellar structure fromwhich it is difficult to extract pillarswith regular α–β morphology. The thickness of α in the as-received material is �1.8 μm and that in the β is �0.15 μm. Thesample material was thus heat-treated to produce α-β-α colony structures by holding at the temperature β transus þ50 °C(i.e., 1040 °C) for 8 h and cooling at a rate of 1 °C/min. As a result, a satisfactory microstructure is obtained with �3.7 mm αphase lamella and �0.8 mm wide β phase ligaments. Detailed microstructural information may be obtained from Jun et al.(2016a). Micro-pillars with square section were fabricated using FIB (focused ion beam) with a width of 2 mm and height of5 mm as shown in Fig. 1. The locations of α and β phases are indicated in the figure.
Stress relaxation through compressive displacement hold tests is investigated on micro α-β pillars in order to determineβ phase properties. Results have recently been published for single crystal α phase (Zhang et al., 2016b) in the same Ti-6242alloy, using the same test methodology. The pillars were tested within in-situ SEM using an Alemnis nano-indentationplatform, enabling direct observation of crystal slip during deformation where slip bands on the surface are generated. Thisplatform enables a maximum displacement of 35 mm and peak load of 500 mN (significantly more than needed within thisstudy). The compression was imposed by an indenter with a flat punch (10 mm diameter, set on top of a 60° cone) (Jun et al.,2016a). The pillar dimensions, testing rates, crystal orientations, and pillar volume fractions of β phase are summarized inTable 1. P1 and P2 pillars have the same crystal orientations in α and β phases, but with differing β volume fractions, withthe former having 36% and the latter 16%. These two pillars are taken from the same area as the single crystal pure α-phasepillars tested recently (Jun et al., 2016b; Zhang et al., 2016b) thus having the same crystallographic orientation. This leads tothe expectation of similar basal slip to be active in the two α–β pillars and in the previously tested pure α phase (A2) pillars.Likewise, the α–β P3 pillar in this work has the same α crystallographic orientation as that in the single crystal pure α phase(A3) pillars already tested (Jun et al., 2016b; Zhang et al., 2016b) and giving prism slip. By adopting the same crystalorientation in the α phase for both pure α phase pillars and in the current work's α–β pillars, direct comparisons may bemade to assess the role of the β phase, in addition to the determination of the β phase properties which, so far as the authorsare aware, have not been reported in the literature.
The pole figures are plotted for pillars P1, P2 and P3 in Fig. 2 in order to show the BOR in the heat treated Ti-6242 sampleused in this study. For P1 and P2 pillars, the blue squares in Fig. 2(a) and (c) illustrate that the α phase basal (0001) planematches the β phase ( )110 plane. Green triangles in Fig. 2(b) and (d) demonstrate the coincidence of a1 and b1 directions andthe purple crosses show the a2 and b2 directions of the α and β phase respectively differ by about 10.5 degrees. Hence the
Table 1Pillar dimensions, crystal orientations and morphological data.
Pillars Top dimension (μm) Height (μm) Taper angle (°) Testing strain rate (s�1) β volume fraction (%) α (°) β (°)
P1 2.02 5.1 4.6 1�10�2 36 [�175 52 129] [�143 87 124]P2 2.02 4.9 4.9 2�10�3 16P3 2.06 5.3 4.4 2�10�3 12 [143 175�168] [�161 86�139]
Fig. 2. Pole figures indicating Burgers orientation relationship in P1 and P2 pillars: (a)–(d) and P3 pillar: (e)–(h); Plane pole figures in (a) and (c) show the{ }α0001 ||{ }β110 planes by overlapping poles highlighted by blue squares; Slip directions< ¯ >α1120 ||< >β111 are identified by the coincidence of green trianglesin (b) and (d) and the a2 and b2 directions differ by about 10.5° shown by the purple crosses. Likewise, the BORs are also shown for P3, i.e. (e) and (g) for theplanes and (f) and (h) for the directions. Loading is along the Y-axis. (For interpretation of the references to color in this figure legend, the reader is referredto the web version of this article.)
Z. Zhang et al. / J. Mech. Phys. Solids 95 (2016) 393–410396
BOR is satisfied in the P1 and P2 pillars, i.e. ( )α0001 ||( )β110 plane, and slip directions [ ¯ ]α1120 ||[¯ ]β111 , and simultaneously a2 andb2 directions differ by about 10.5°. This BOR is also found in pillar P3 as shown in Fig. 2(e) and (g) for planes and (f) and(h) for slip directions.
3. Crystal plasticity modelling for α–β phase titanium alloys in stress relaxation
Crystal plasticity modelling is utilised primarily in this study to quantify the strain rate sensitivities of the α–β pillars. Thecrystal models developed explicitly include the effects of the pillar substrate and therefore account for the compliancecontribution from the titanium base, epoxy adhesive and testing frame. Recent studies by the authors (Jun et al., 2016b;Zhang et al., 2016b) show that these external compliances are significant and have to be explicitly recognised in order toseparate structural response, often including the indentation frame, from implicit material rate sensitivity.
The modelling methodology for the α–β phase pillars utilises the α phase properties previously extracted from micro-pillar tests carried out on pure α phase single crystal pillars of similar size (Zhang et al., 2016b). The assumption, therefore, isthat the α properties in the α�β pillars considered in this paper are the same as those obtained for the pure α pillars in thesame Ti-6242 material. The size effect due to the α–β interface strengthening is a possible factor but it is shown later that noobvious strain hardening is observed in pillars 1 and 2. In addition, the primary focus in this paper is the rate sensitivity ofthe β phase, for which size effects are unlikely to be important. The phase boundaries are taken to be coherent such thatkinematic constraint is maintained (no interface sliding). Note that the α–β phase boundary in dual phase titanium hasoften classified as a semi-coherent boundary due to the presence of BOR relations (Bhattacharyya et al., 2003; Shi et al.,2014). The variant selection process during heat treatment often leads to minimum interfacial free energy so as to bettermatch the two phases. This is different from an incoherent interface for which easier mobility/sliding is anticipated becausethere is no lattice plane which is continuous across the interface. The geometric pillar model is established as illustrated inFig. 3(a) with the external compliance from the titanium base, epoxy glue and testing frame simulated as an elastic blockwith a width five times that of the pillars. Convergence studies on the mesh size and integration time steps have beenconducted in previous studies (Zhang et al., 2016b). The global coordinate system is taken as in Fig. 3 and the front, back andside faces of the pillar are labelled in Fig. 3(b). This convention is used throughout the current work.
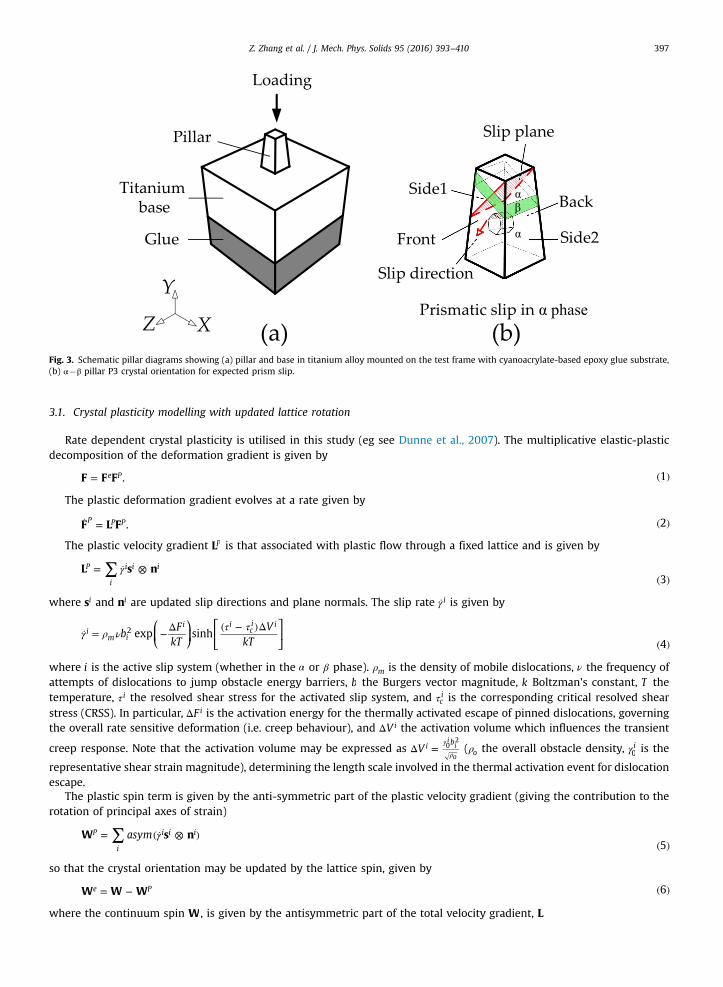
Fig. 3. Schematic pillar diagrams showing (a) pillar and base in titanium alloy mounted on the test frame with cyanoacrylate-based epoxy glue substrate,(b) α�β pillar P3 crystal orientation for expected prism slip.
Z. Zhang et al. / J. Mech. Phys. Solids 95 (2016) 393–410 397
3.1. Crystal plasticity modelling with updated lattice rotation
Rate dependent crystal plasticity is utilised in this study (eg see Dunne et al., 2007). The multiplicative elastic-plasticdecomposition of the deformation gradient is given by
= ( )F F F . 1e P
The plastic deformation gradient evolves at a rate given by
= ( )F L F . 2P P P
The plastic velocity gradient LP is that associated with plastic flow through a fixed lattice and is given by
∑ γ= ⊗( )
L s n3
P
i
i i i
where si and ni are updated slip directions and plane normals. The slip rate γ i is given by
γ ρ ν τ τ = − Δ ( − )Δ
( )
⎛⎝⎜
⎞⎠⎟
⎡⎣⎢
⎤⎦⎥b
FkT
VkT
exp sinh4
im i
i ici i
2
where i is the active slip system (whether in the α or β phase). ρm is the density of mobile dislocations, ν the frequency ofattempts of dislocations to jump obstacle energy barriers, b the Burgers vector magnitude, k Boltzman's constant, T thetemperature, τ i the resolved shear stress for the activated slip system, and τc
i is the corresponding critical resolved shearstress (CRSS). In particular, ΔF i is the activation energy for the thermally activated escape of pinned dislocations, governingthe overall rate sensitive deformation (i.e. creep behaviour), and ΔV i the activation volume which influences the transient
creep response. Note that the activation volume may be expressed as Δ =γ
ρV i bi
i
o
02(ρo the overall obstacle density, γ i
0 is the
representative shear strain magnitude), determining the length scale involved in the thermal activation event for dislocationescape.
The plastic spin term is given by the anti-symmetric part of the plastic velocity gradient (giving the contribution to therotation of principal axes of strain)
∑ γ= ( ⊗ )( )
asymW s n5
P
i
i i i
so that the crystal orientation may be updated by the lattice spin, given by
= − ( )W W W 6e P
where the continuum spin W , is given by the antisymmetric part of the total velocity gradient, L
Z. Zhang et al. / J. Mech. Phys. Solids 95 (2016) 393–410398
= ( ) ( )asymW L 7
where = = + − −L FF F F F F F Fe e e P P e1 1T T , and F is the current deformation gradient.The rate of crystal plastic deformation is
= − ( )D L W 8P P P
such that the Jaumann stress rate through Hooke's law is given by
σ = ( − ) ( )∇
C D D: 9P
where the deformation rate is
= ( ) ( )symD L 10
and C is the rotated elastic stiffness tensor due to the updated crystal orientation.Finally, the material rate of stress is
σ σ σ σ = + − ( )∇W W 11
where σ is the current stress state.Therefore the incremental stress is given by
σ σ σ σΔ = Δ∇ + ( − )Δ ( )tW W 12
This stress increment is used to determine the increment of plastic strain such that the consistency condition, defined byan implicit time-integration procedure, is satisfied through Newton iteration. Further detail of the evaluation of incrementalplastic strain is given in Dunne et al. (2007).
4. Coupled α�β micro-pillar test and crystal plasticity modelling
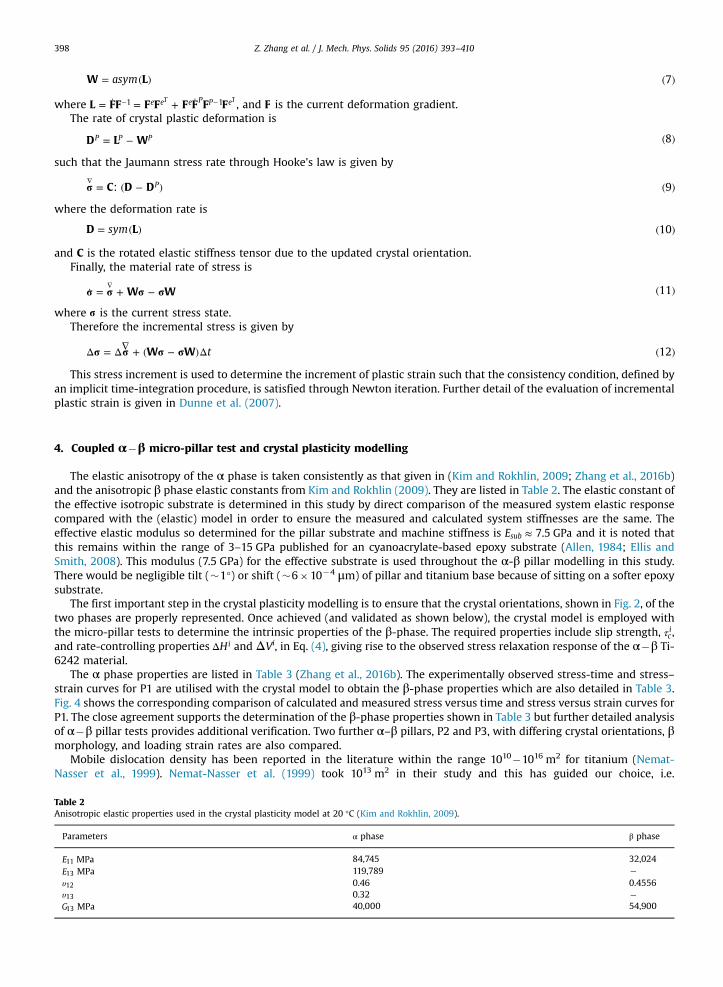
The elastic anisotropy of the α phase is taken consistently as that given in (Kim and Rokhlin, 2009; Zhang et al., 2016b)and the anisotropic β phase elastic constants from Kim and Rokhlin (2009). They are listed in Table 2. The elastic constant ofthe effective isotropic substrate is determined in this study by direct comparison of the measured system elastic responsecompared with the (elastic) model in order to ensure the measured and calculated system stiffnesses are the same. Theeffective elastic modulus so determined for the pillar substrate and machine stiffness is ≈E 7.5 GPasub and it is noted thatthis remains within the range of 3–15 GPa published for an cyanoacrylate-based epoxy substrate (Allen, 1984; Ellis andSmith, 2008). This modulus (7.5 GPa) for the effective substrate is used throughout the α-β pillar modelling in this study.There would be negligible tilt (�1°) or shift (�6�10�4 μm) of pillar and titanium base because of sitting on a softer epoxysubstrate.
The first important step in the crystal plasticity modelling is to ensure that the crystal orientations, shown in Fig. 2, of thetwo phases are properly represented. Once achieved (and validated as shown below), the crystal model is employed withthe micro-pillar tests to determine the intrinsic properties of the β-phase. The required properties include slip strength, τc
i,and rate-controlling properties ΔHi and ΔVi, in Eq. (4), giving rise to the observed stress relaxation response of the α�β Ti-6242 material.
The α phase properties are listed in Table 3 (Zhang et al., 2016b). The experimentally observed stress-time and stress–strain curves for P1 are utilised with the crystal model to obtain the β-phase properties which are also detailed in Table 3.Fig. 4 shows the corresponding comparison of calculated and measured stress versus time and stress versus strain curves forP1. The close agreement supports the determination of the β-phase properties shown in Table 3 but further detailed analysisof α�β pillar tests provides additional verification. Two further α–β pillars, P2 and P3, with differing crystal orientations, βmorphology, and loading strain rates are also compared.
Mobile dislocation density has been reported in the literature within the range 1010�1016 m2 for titanium (Nemat-Nasser et al., 1999). Nemat-Nasser et al. (1999) took 1013 m2 in their study and this has guided our choice, i.e.
Table 2Anisotropic elastic properties used in the crystal plasticity model at 20 °C (Kim and Rokhlin, 2009).
Parameters α phase β phase
E11 MPa 84,745 32,024E13 MPa 119,789 �υ12 0.46 0.4556υ13 0.32 �G13 MPa 40,000 54,900
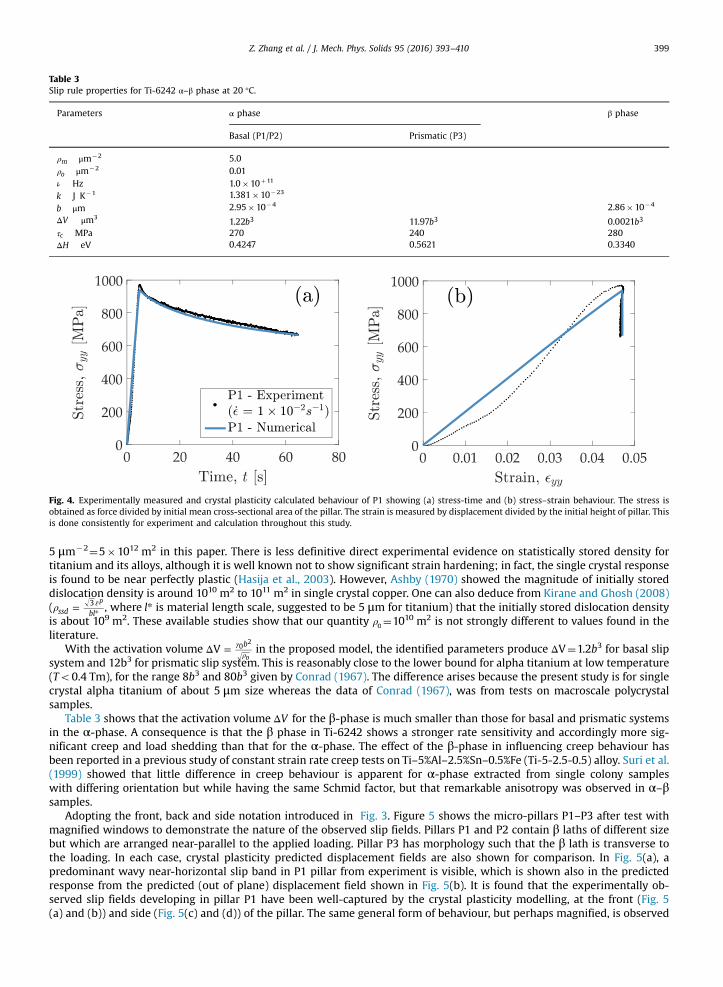
Table 3Slip rule properties for Ti-6242 α–β phase at 20 °C.
Parameters α phase β phase
Basal (P1/P2) Prismatic (P3)
ρm μm�2 5.0ρo μm�2 0.01ν Hz 1.0�10þ11
k J K�1 1.381�10�23
b μm 2.95�10�4 2.86�10�4
ΔV μm31.22b3 11.97b3 0.0021b3
τc MPa 270 240 280ΔH eV 0.4247 0.5621 0.3340
Fig. 4. Experimentally measured and crystal plasticity calculated behaviour of P1 showing (a) stress-time and (b) stress–strain behaviour. The stress isobtained as force divided by initial mean cross-sectional area of the pillar. The strain is measured by displacement divided by the initial height of pillar. Thisis done consistently for experiment and calculation throughout this study.
Z. Zhang et al. / J. Mech. Phys. Solids 95 (2016) 393–410 399
5 μm�2¼5�1012 m2 in this paper. There is less definitive direct experimental evidence on statistically stored density fortitanium and its alloys, although it is well known not to show significant strain hardening; in fact, the single crystal responseis found to be near perfectly plastic (Hasija et al., 2003). However, Ashby (1970) showed the magnitude of initially storeddislocation density is around 1010 m2 to 1011 m2 in single crystal copper. One can also deduce from Kirane and Ghosh (2008)(ρ = ε
*ssd bl3 p
, where *l is material length scale, suggested to be 5 μm for titanium) that the initially stored dislocation densityis about 109 m2. These available studies show that our quantity ρo¼1010 m2 is not strongly different to values found in theliterature.
With the activation volume Δ = γρ
V b
o
02in the proposed model, the identified parameters produce ΔV¼1.2b3 for basal slip
system and 12b3 for prismatic slip system. This is reasonably close to the lower bound for alpha titanium at low temperature(To0.4 Tm), for the range 8b3 and 80b3 given by Conrad (1967). The difference arises because the present study is for singlecrystal alpha titanium of about 5 μm size whereas the data of Conrad (1967), was from tests on macroscale polycrystalsamples.
Table 3 shows that the activation volume ΔV for the β-phase is much smaller than those for basal and prismatic systemsin the α-phase. A consequence is that the β phase in Ti-6242 shows a stronger rate sensitivity and accordingly more sig-nificant creep and load shedding than that for the α-phase. The effect of the β-phase in influencing creep behaviour hasbeen reported in a previous study of constant strain rate creep tests on Ti–5%Al–2.5%Sn–0.5%Fe (Ti-5-2.5-0.5) alloy. Suri et al.(1999) showed that little difference in creep behaviour is apparent for α-phase extracted from single colony sampleswith differing orientation but while having the same Schmid factor, but that remarkable anisotropy was observed in α–βsamples.
Adopting the front, back and side notation introduced in Fig. 3. Figure 5 shows the micro-pillars P1–P3 after test withmagnified windows to demonstrate the nature of the observed slip fields. Pillars P1 and P2 contain β laths of different sizebut which are arranged near-parallel to the applied loading. Pillar P3 has morphology such that the β lath is transverse tothe loading. In each case, crystal plasticity predicted displacement fields are also shown for comparison. In Fig. 5(a), apredominant wavy near-horizontal slip band in P1 pillar from experiment is visible, which is shown also in the predictedresponse from the predicted (out of plane) displacement field shown in Fig. 5(b). It is found that the experimentally ob-served slip fields developing in pillar P1 have been well-captured by the crystal plasticity modelling, at the front (Fig. 5(a) and (b)) and side (Fig. 5(c) and (d)) of the pillar. The same general form of behaviour, but perhaps magnified, is observed
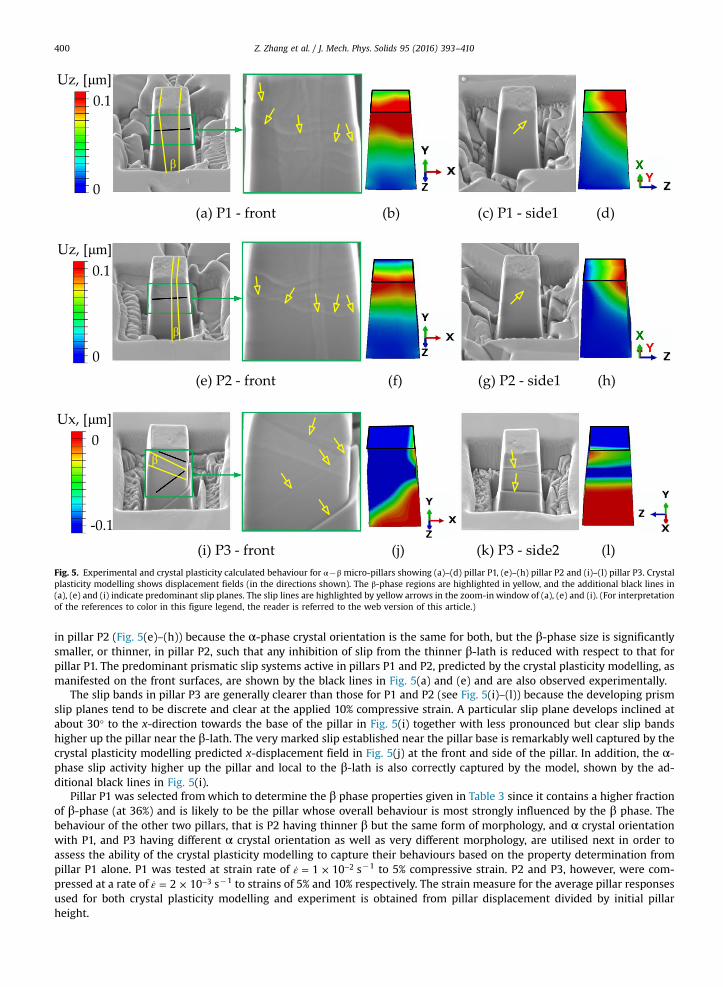
Fig. 5. Experimental and crystal plasticity calculated behaviour for α�β micro-pillars showing (a)–(d) pillar P1, (e)–(h) pillar P2 and (i)–(l) pillar P3. Crystalplasticity modelling shows displacement fields (in the directions shown). The β-phase regions are highlighted in yellow, and the additional black lines in(a), (e) and (i) indicate predominant slip planes. The slip lines are highlighted by yellow arrows in the zoom-in window of (a), (e) and (i). (For interpretationof the references to color in this figure legend, the reader is referred to the web version of this article.)
Z. Zhang et al. / J. Mech. Phys. Solids 95 (2016) 393–410400
in pillar P2 (Fig. 5(e)–(h)) because the α-phase crystal orientation is the same for both, but the β-phase size is significantlysmaller, or thinner, in pillar P2, such that any inhibition of slip from the thinner β-lath is reduced with respect to that forpillar P1. The predominant prismatic slip systems active in pillars P1 and P2, predicted by the crystal plasticity modelling, asmanifested on the front surfaces, are shown by the black lines in Fig. 5(a) and (e) and are also observed experimentally.
The slip bands in pillar P3 are generally clearer than those for P1 and P2 (see Fig. 5(i)–(l)) because the developing prismslip planes tend to be discrete and clear at the applied 10% compressive strain. A particular slip plane develops inclined atabout 30° to the x-direction towards the base of the pillar in Fig. 5(i) together with less pronounced but clear slip bandshigher up the pillar near the β-lath. The very marked slip established near the pillar base is remarkably well captured by thecrystal plasticity modelling predicted x-displacement field in Fig. 5(j) at the front and side of the pillar. In addition, the α-phase slip activity higher up the pillar and local to the β-lath is also correctly captured by the model, shown by the ad-ditional black lines in Fig. 5(i).
Pillar P1 was selected fromwhich to determine the β phase properties given in Table 3 since it contains a higher fractionof β-phase (at 36%) and is likely to be the pillar whose overall behaviour is most strongly influenced by the β phase. Thebehaviour of the other two pillars, that is P2 having thinner β but the same form of morphology, and α crystal orientationwith P1, and P3 having different α crystal orientation as well as very different morphology, are utilised next in order toassess the ability of the crystal plasticity modelling to capture their behaviours based on the property determination frompillar P1 alone. P1 was tested at strain rate of ε = × −1 10 2 s�1 to 5% compressive strain. P2 and P3, however, were com-pressed at a rate of ε = × −2 10 3 s�1 to strains of 5% and 10% respectively. The strain measure for the average pillar responsesused for both crystal plasticity modelling and experiment is obtained from pillar displacement divided by initial pillarheight.
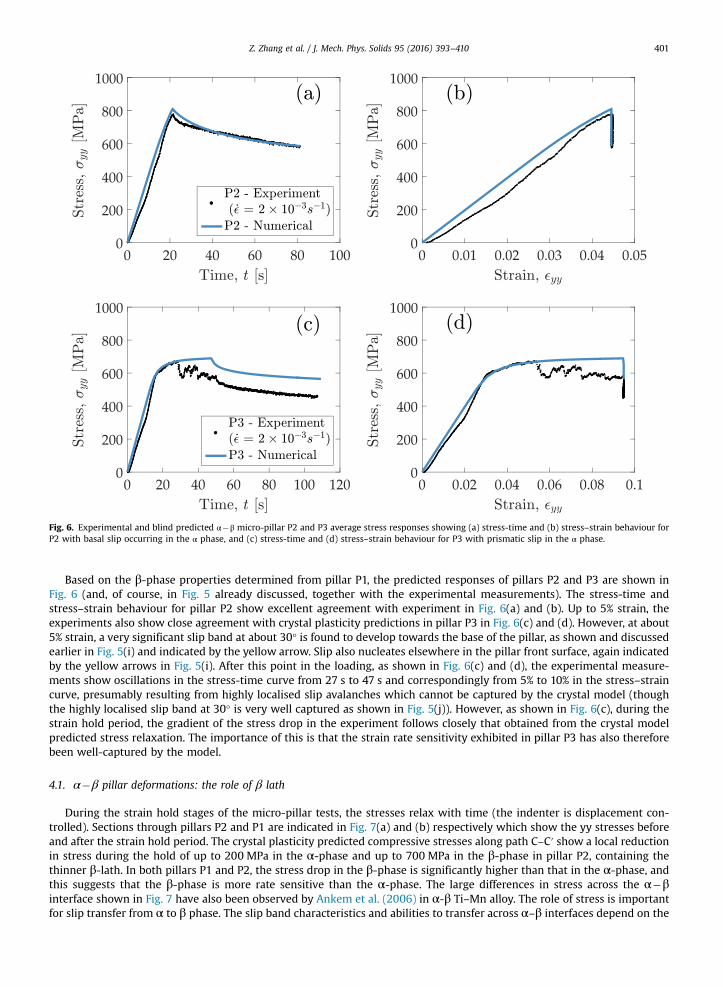
Fig. 6. Experimental and blind predicted α�β micro-pillar P2 and P3 average stress responses showing (a) stress-time and (b) stress–strain behaviour forP2 with basal slip occurring in the α phase, and (c) stress-time and (d) stress–strain behaviour for P3 with prismatic slip in the α phase.
Z. Zhang et al. / J. Mech. Phys. Solids 95 (2016) 393–410 401
Based on the β-phase properties determined from pillar P1, the predicted responses of pillars P2 and P3 are shown inFig. 6 (and, of course, in Fig. 5 already discussed, together with the experimental measurements). The stress-time andstress–strain behaviour for pillar P2 show excellent agreement with experiment in Fig. 6(a) and (b). Up to 5% strain, theexperiments also show close agreement with crystal plasticity predictions in pillar P3 in Fig. 6(c) and (d). However, at about5% strain, a very significant slip band at about 30° is found to develop towards the base of the pillar, as shown and discussedearlier in Fig. 5(i) and indicated by the yellow arrow. Slip also nucleates elsewhere in the pillar front surface, again indicatedby the yellow arrows in Fig. 5(i). After this point in the loading, as shown in Fig. 6(c) and (d), the experimental measure-ments show oscillations in the stress-time curve from 27 s to 47 s and correspondingly from 5% to 10% in the stress–straincurve, presumably resulting from highly localised slip avalanches which cannot be captured by the crystal model (thoughthe highly localised slip band at 30° is very well captured as shown in Fig. 5(j)). However, as shown in Fig. 6(c), during thestrain hold period, the gradient of the stress drop in the experiment follows closely that obtained from the crystal modelpredicted stress relaxation. The importance of this is that the strain rate sensitivity exhibited in pillar P3 has also thereforebeen well-captured by the model.
4.1. α�β pillar deformations: the role of β lath
During the strain hold stages of the micro-pillar tests, the stresses relax with time (the indenter is displacement con-trolled). Sections through pillars P2 and P1 are indicated in Fig. 7(a) and (b) respectively which show the yy stresses beforeand after the strain hold period. The crystal plasticity predicted compressive stresses along path C–C′ show a local reductionin stress during the hold of up to 200 MPa in the α-phase and up to 700 MPa in the β-phase in pillar P2, containing thethinner β-lath. In both pillars P1 and P2, the stress drop in the β-phase is significantly higher than that in the α-phase, andthis suggests that the β-phase is more rate sensitive than the α-phase. The large differences in stress across the α�βinterface shown in Fig. 7 have also been observed by Ankem et al. (2006) in α-β Ti–Mn alloy. The role of stress is importantfor slip transfer from α to β phase. The slip band characteristics and abilities to transfer across α–β interfaces depend on the
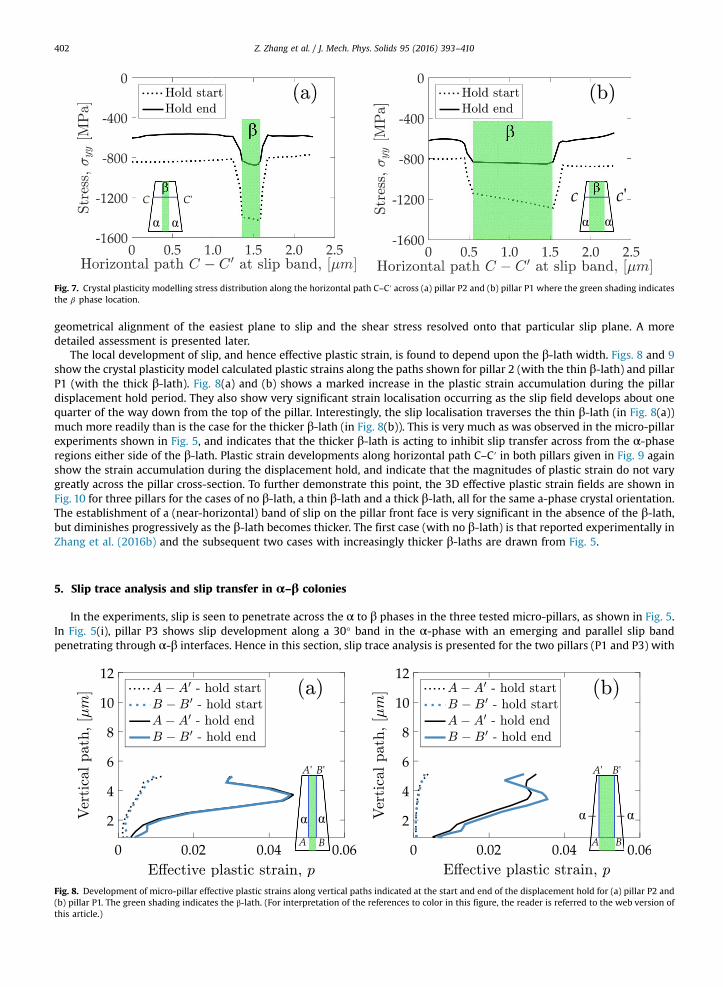
Fig. 7. Crystal plasticity modelling stress distribution along the horizontal path C–C′ across (a) pillar P2 and (b) pillar P1 where the green shading indicatesthe β phase location.
Z. Zhang et al. / J. Mech. Phys. Solids 95 (2016) 393–410402
geometrical alignment of the easiest plane to slip and the shear stress resolved onto that particular slip plane. A moredetailed assessment is presented later.
The local development of slip, and hence effective plastic strain, is found to depend upon the β-lath width. Figs. 8 and 9show the crystal plasticity model calculated plastic strains along the paths shown for pillar 2 (with the thin β-lath) and pillarP1 (with the thick β-lath). Fig. 8(a) and (b) shows a marked increase in the plastic strain accumulation during the pillardisplacement hold period. They also show very significant strain localisation occurring as the slip field develops about onequarter of the way down from the top of the pillar. Interestingly, the slip localisation traverses the thin β-lath (in Fig. 8(a))much more readily than is the case for the thicker β-lath (in Fig. 8(b)). This is very much as was observed in the micro-pillarexperiments shown in Fig. 5, and indicates that the thicker β-lath is acting to inhibit slip transfer across from the α-phaseregions either side of the β-lath. Plastic strain developments along horizontal path C–C′ in both pillars given in Fig. 9 againshow the strain accumulation during the displacement hold, and indicate that the magnitudes of plastic strain do not varygreatly across the pillar cross-section. To further demonstrate this point, the 3D effective plastic strain fields are shown inFig. 10 for three pillars for the cases of no β-lath, a thin β-lath and a thick β-lath, all for the same a-phase crystal orientation.The establishment of a (near-horizontal) band of slip on the pillar front face is very significant in the absence of the β-lath,but diminishes progressively as the β-lath becomes thicker. The first case (with no β-lath) is that reported experimentally inZhang et al. (2016b) and the subsequent two cases with increasingly thicker β-laths are drawn from Fig. 5.
5. Slip trace analysis and slip transfer in α–β colonies
In the experiments, slip is seen to penetrate across the α to β phases in the three tested micro-pillars, as shown in Fig. 5.In Fig. 5(i), pillar P3 shows slip development along a 30° band in the α-phase with an emerging and parallel slip bandpenetrating through α-β interfaces. Hence in this section, slip trace analysis is presented for the two pillars (P1 and P3) with
Fig. 8. Development of micro-pillar effective plastic strains along vertical paths indicated at the start and end of the displacement hold for (a) pillar P2 and(b) pillar P1. The green shading indicates the β-lath. (For interpretation of the references to color in this figure, the reader is referred to the web version ofthis article.)

Fig. 9. Development of micro-pillar effective plastic strains along horizontal paths indicated at the start and end of the displacement hold for (a) pillar P2and (b) pillar P1. The green shading indicates the β-lath.
Fig. 10. Effective plastic strain development in pillars with differing β-lath thickness: (a) no β phase (A2P15), after Zhang et al. (2016b), (b) thin β phase (P2),and (c) thick β phase (P1). All pillars have the same α crystal orientation. (For interpretation of the references to color in this figure legend, the reader isreferred to the web version of this article.)
Z. Zhang et al. / J. Mech. Phys. Solids 95 (2016) 393–410 403
very different β-phase morphological orientations, and this is followed by a discussion of slip transfer criteria in α�βcolonies. Note that in the crystal plasticity model formulation, slip is treated in the continuum sense and therefore transferis modelled only through adherence to compatibility and equilibrium conditions, and not due to discrete slip transferphenomena.
Pillar P1 is considered first and example slip accumulation determined from the crystal plasticity model and slip acti-vation determined from experiment are shown in Figs. 11 and 12 respectively. The accumulated slip is given for eachactivated slip system in both the α and β phases. The red lines with circular symbols in Fig. 11 indicate the predictedmanifestation of active slip planes emerging at the pillar front free surface; that is, the intersecting line between an activatedslip plane and the front free surface, where the front free surfaces are shown in Fig. 5(a), (e) and (i). The black lines in Fig. 12are the visible slip lines taken from the experimental images from the pillar front faces. The free surface-intersecting lines ccan be determined from = (( ) × )c gm n and their orientation given by
ϕ = [ ⋅( )] ( )− c gLcos 131
where L is the loading direction, m the normal to the front free surface, and g is the current, updated crystal rotation matrix.Note that vectors m, n and L are normalized.
Fig. 11 shows the accumulated slip in each activated slip system in the (hcp) α phase (a)–(c), and in the (bcc) β phase, (d)–(h). The a1 system has been activated in the α phase on both sides of the β-lath while the a2 and a3 systems show lessactivity. The in-sets in Fig. 11 show the predicted intersections (red lines) of the slip systems with the free pillar surface. Thea1 and a2 systems generate the same intersecting line on the front free surface of the pillar since they share the same planenormal. The b1 and b2 slip systems in the β-lath dominate the slip, as shown from the crystal plasticity modelling in Fig. 11
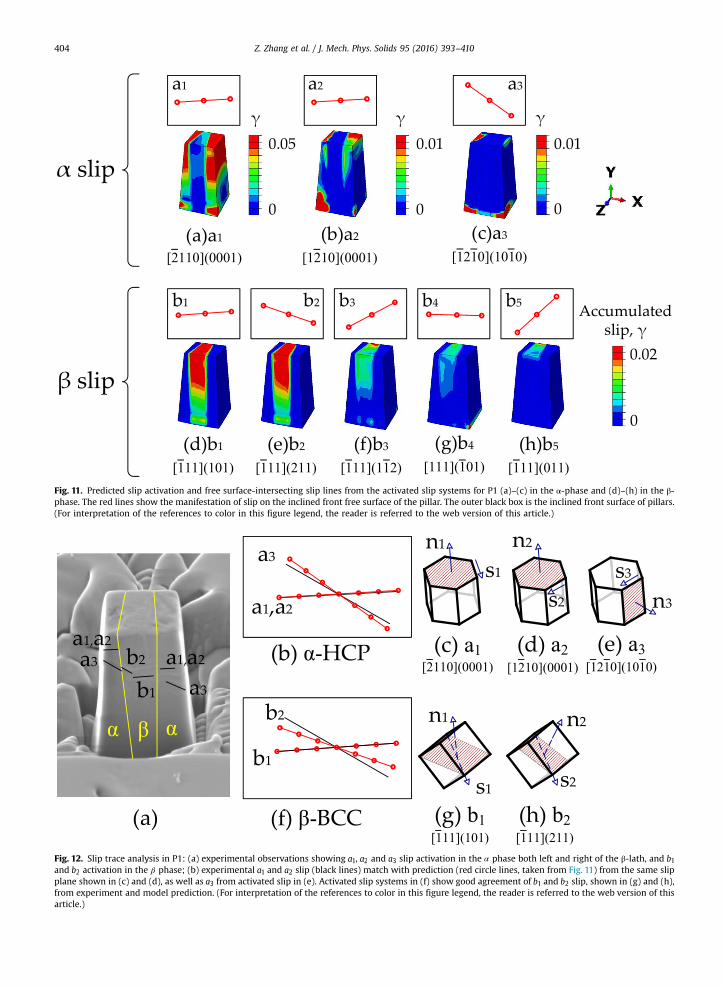
Fig. 11. Predicted slip activation and free surface-intersecting slip lines from the activated slip systems for P1 (a)–(c) in the α-phase and (d)–(h) in the β-phase. The red lines show the manifestation of slip on the inclined front free surface of the pillar. The outer black box is the inclined front surface of pillars.(For interpretation of the references to color in this figure legend, the reader is referred to the web version of this article.)
Fig. 12. Slip trace analysis in P1: (a) experimental observations showing a1, a2 and a3 slip activation in the α phase both left and right of the β-lath, and b1and b2 activation in the β phase; (b) experimental a1 and a2 slip (black lines) match with prediction (red circle lines, taken from Fig. 11) from the same slipplane shown in (c) and (d), as well as a3 from activated slip in (e). Activated slip systems in (f) show good agreement of b1 and b2 slip, shown in (g) and (h),from experiment and model prediction. (For interpretation of the references to color in this figure legend, the reader is referred to the web version of thisarticle.)
Z. Zhang et al. / J. Mech. Phys. Solids 95 (2016) 393–410404
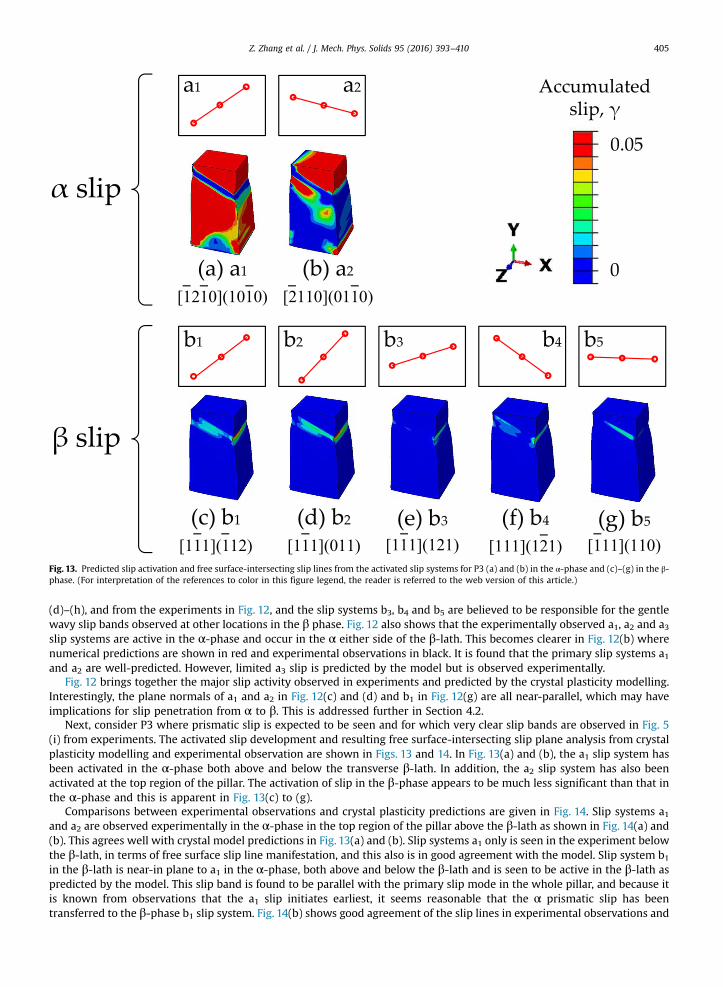
Fig. 13. Predicted slip activation and free surface-intersecting slip lines from the activated slip systems for P3 (a) and (b) in the α-phase and (c)–(g) in the β-phase. (For interpretation of the references to color in this figure legend, the reader is referred to the web version of this article.)
Z. Zhang et al. / J. Mech. Phys. Solids 95 (2016) 393–410 405
(d)–(h), and from the experiments in Fig. 12, and the slip systems b3, b4 and b5 are believed to be responsible for the gentlewavy slip bands observed at other locations in the β phase. Fig. 12 also shows that the experimentally observed a1, a2 and a3slip systems are active in the α-phase and occur in the α either side of the β-lath. This becomes clearer in Fig. 12(b) wherenumerical predictions are shown in red and experimental observations in black. It is found that the primary slip systems a1and a2 are well-predicted. However, limited a3 slip is predicted by the model but is observed experimentally.
Fig. 12 brings together the major slip activity observed in experiments and predicted by the crystal plasticity modelling.Interestingly, the plane normals of a1 and a2 in Fig. 12(c) and (d) and b1 in Fig. 12(g) are all near-parallel, which may haveimplications for slip penetration from α to β. This is addressed further in Section 4.2.
Next, consider P3 where prismatic slip is expected to be seen and for which very clear slip bands are observed in Fig. 5(i) from experiments. The activated slip development and resulting free surface-intersecting slip plane analysis from crystalplasticity modelling and experimental observation are shown in Figs. 13 and 14. In Fig. 13(a) and (b), the a1 slip system hasbeen activated in the α-phase both above and below the transverse β-lath. In addition, the a2 slip system has also beenactivated at the top region of the pillar. The activation of slip in the β-phase appears to be much less significant than that inthe α-phase and this is apparent in Fig. 13(c) to (g).
Comparisons between experimental observations and crystal plasticity predictions are given in Fig. 14. Slip systems a1and a2 are observed experimentally in the α-phase in the top region of the pillar above the β-lath as shown in Fig. 14(a) and(b). This agrees well with crystal model predictions in Fig. 13(a) and (b). Slip systems a1 only is seen in the experiment belowthe β-lath, in terms of free surface slip line manifestation, and this also is in good agreement with the model. Slip system b1in the β-lath is near-in plane to a1 in the α-phase, both above and below the β-lath and is seen to be active in the β-lath aspredicted by the model. This slip band is found to be parallel with the primary slip mode in the whole pillar, and because itis known from observations that the a1 slip initiates earliest, it seems reasonable that the α prismatic slip has beentransferred to the β-phase b1 slip system. Fig. 14(b) shows good agreement of the slip lines in experimental observations and
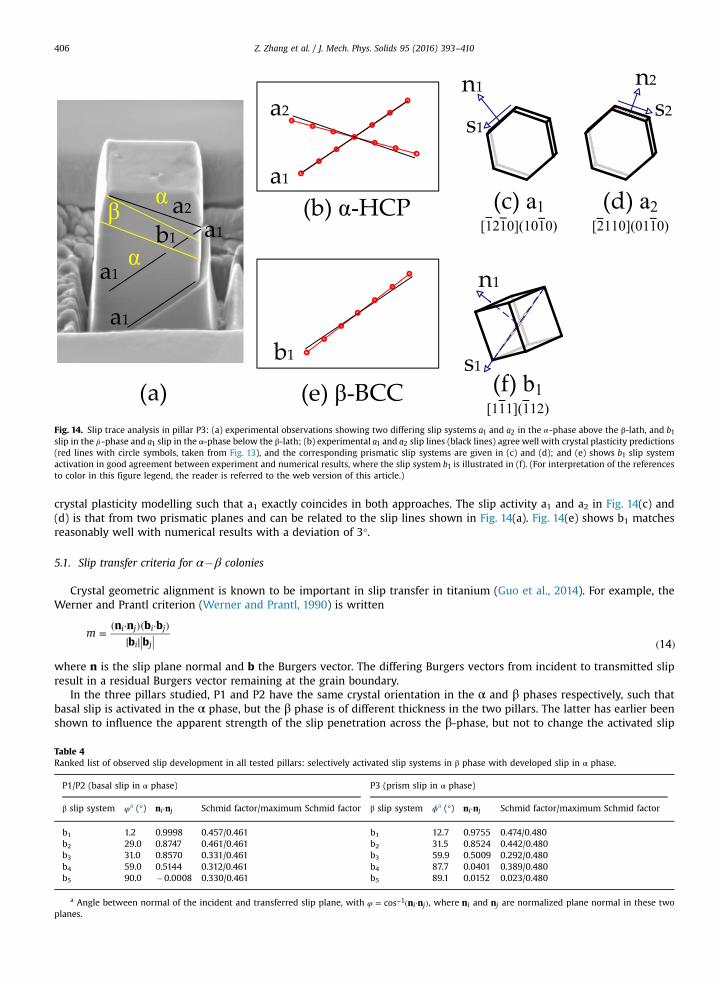
Fig. 14. Slip trace analysis in pillar P3: (a) experimental observations showing two differing slip systems a1 and a2 in the α-phase above the β-lath, and b1slip in the β-phase and a1 slip in the α-phase below the β-lath; (b) experimental a1 and a2 slip lines (black lines) agree well with crystal plasticity predictions(red lines with circle symbols, taken from Fig. 13), and the corresponding prismatic slip systems are given in (c) and (d); and (e) shows b1 slip systemactivation in good agreement between experiment and numerical results, where the slip system b1 is illustrated in (f). (For interpretation of the referencesto color in this figure legend, the reader is referred to the web version of this article.)
Z. Zhang et al. / J. Mech. Phys. Solids 95 (2016) 393–410406
crystal plasticity modelling such that a1 exactly coincides in both approaches. The slip activity a1 and a2 in Fig. 14(c) and(d) is that from two prismatic planes and can be related to the slip lines shown in Fig. 14(a). Fig. 14(e) shows b1 matchesreasonably well with numerical results with a deviation of 3°.
5.1. Slip transfer criteria for α�β colonies
Crystal geometric alignment is known to be important in slip transfer in titanium (Guo et al., 2014). For example, theWerner and Prantl criterion (Werner and Prantl, 1990) is written
=( ⋅ )( ⋅ )
( )m
n n b bb b 14
i j i j
i j
where n is the slip plane normal and b the Burgers vector. The differing Burgers vectors from incident to transmitted slipresult in a residual Burgers vector remaining at the grain boundary.
In the three pillars studied, P1 and P2 have the same crystal orientation in the α and β phases respectively, such thatbasal slip is activated in the α phase, but the β phase is of different thickness in the two pillars. The latter has earlier beenshown to influence the apparent strength of the slip penetration across the β-phase, but not to change the activated slip
Table 4Ranked list of observed slip development in all tested pillars: selectively activated slip systems in β phase with developed slip in α phase.
P1/P2 (basal slip in α phase) P3 (prism slip in α phase)
β slip system φa (°) ⋅n ni j Schmid factor/maximum Schmid factor β slip system ϕa (°) ⋅n ni j Schmid factor/maximum Schmid factor
b1 1.2 0.9998 0.457/0.461 b1 12.7 0.9755 0.474/0.480b2 29.0 0.8747 0.461/0.461 b2 31.5 0.8524 0.442/0.480b3 31.0 0.8570 0.331/0.461 b3 59.9 0.5009 0.292/0.480b4 59.0 0.5144 0.312/0.461 b4 87.7 0.0401 0.389/0.480b5 90.0 �0.0008 0.330/0.461 b5 89.1 0.0152 0.023/0.480
a Angle between normal of the incident and transferred slip plane, with φ = ( ⋅ )− n ncos i j1 , where ni and nj are normalized plane normal in these two
planes.
Z. Zhang et al. / J. Mech. Phys. Solids 95 (2016) 393–410 407
systems in the β phase in either pillar. The third pillar P3 has different α crystal orientation and prismatic slip is active. Ananalysis has been carried out to assess all of the possible β-phase slip systems in relation to the α slip activation in thecurrent pillar analysis and the results are summarised in Table 4. It is found from Table 4 that the observed activated bi slipsystem in the β-phase is the one whose normal is best aligned with the corresponding normal of the adjacent active α-phase ai slip system. That is, the combination of α and β slip system normals giving rise to the smallest misorientation angle,ϕ, among all the slip system combinations correlates with the slip activation observed in the β-phase. However, the active βslip system is found not to be that with the highest global Schmid factor for the case of pillars P1 and P2 (though it is close tothe maximum global Schmid factor for pillar P3), where the global Schmid factor is given by resolving the remote uniaxialloading vector into the activated slip plane. These findings are in accord with the recent results by Guo et al. (2014) in thatthe alignment factor M takes the priority in governing slip transfer though both M and Schmid factor could play roles in thisevent. Note that their results were based on single α phase commercial-purity titanium. The importance of good alignmentof grains for slip has also been shown in developing or inhibiting adiabatic shear bands (Zhang et al., 2016a). Slip transferwas found (Savage et al., 2004) to be encouraged with good alignment of < >a prismatic or < >a pyramidal slip systems. TEMstudies by Savage et al. also showed that the α–β interface in Ti-6242–0.1Si provided little impedance to slip for the slipsystem with the smallest misorientation between dislocations in two phases.
Both geometrical alignment and Schmid factor are potentially significant for slip transfer, since they govern the mag-nitude of resolved shear stress acting on a given slip system. The results obtained suggest that the geometrical alignment/misorientation takes precedence over Schmid factor in the slip transfer criterion.
There are a number of grain boundary slip transfer criteria available in the literature (Bieler et al., 2014). Geometricalcriteria, including that of Werner and Prantl, appear to be favoured, and have been verified by many researchers in-dependently (Guo et al., 2014; Savage et al., 2004; Suri et al., 1999).
Slip transfer across phase boundaries, however, is less clear, since the Burgers vector differs in the two phases, andmobility across phase boundaries is apparently different to that for a grain boundary shared by two grains of the samephase. Suri et al. (1999) reported that two Ti-5-2.5-0.5 (Ti–5%Al–2.5%Sn–0.5%Fe) colony structures, complying with the BORrelation in the α–β phases, had different slip transfer behaviour. One had Schmid factors of 0.5 in both α-prismatic and βphases and the other 0.5 in α-prismatic and 0.48 in β phases. The former α–β interface provided little resistance to sliptransmission from α to β and the latter showed dislocation pile-up at the α–β interface. They found that in the first case, theactive slip systems in α and β phase had relatively small misalignment. Therefore the required residual interfacial dis-location for slip transmission event was much smaller in the former than that in the latter case. Savage et al. (2004) foundsimilar easy slip transmission in Ti-6242 colonies which had BOR relations in α and β orientations. Non-planar slip withinthe β phase was likely to cause more difficult slip transmission from the β phase back into the α phase. Suri et al. (1999)proposed that a geometrical based slip transmission could be general through α-β interface exhibiting BOR relations, such asTi–Al, Ti–Mn (Greene et al., 1996), and Ti–V (Greene et al., 1996) based alloys.
6. Lattice rotation at α–β phase boundary and Burgers orientation relationship
Crystallographic relationships in heat-treated α–β titanium are known to comply with the Burgers orientation re-lationship. However, it has been shown that the relationship may not necessarily be maintained during deformation(Mironov et al., 2009) because of crystal reorientation with straining. The lattice rotation in each phase is therefore im-portant to understand deviations from the BOR and the evolution of the crystallography in the dual phase alloy. The crystalplasticity modelling and pillar study are utilised in order to assess briefly the potential for deviations from the BOR.
In the crystal plasticity modelling, the crystal orientation is updated based on the lattice spin such that
= ( )g W g 15e
where g is the current updated crystal orientation and We is the lattice spin.The change of lattice orientation is measured by the incremental rotation θ as deformation proceeds and may be ex-
pressed
θ = (Δ ) −( )
tr gcos
12 16
where Δ = −g g g01 and g0 is the initial crystal orientation. Note that the axis of the rotation may also progressively change
during the incremental deformation (as per Taylor rotations due to crystal slip).For the ease of demonstration, pillar P3 is assessed since it has been deformed to 10% strain and thus most likely to give
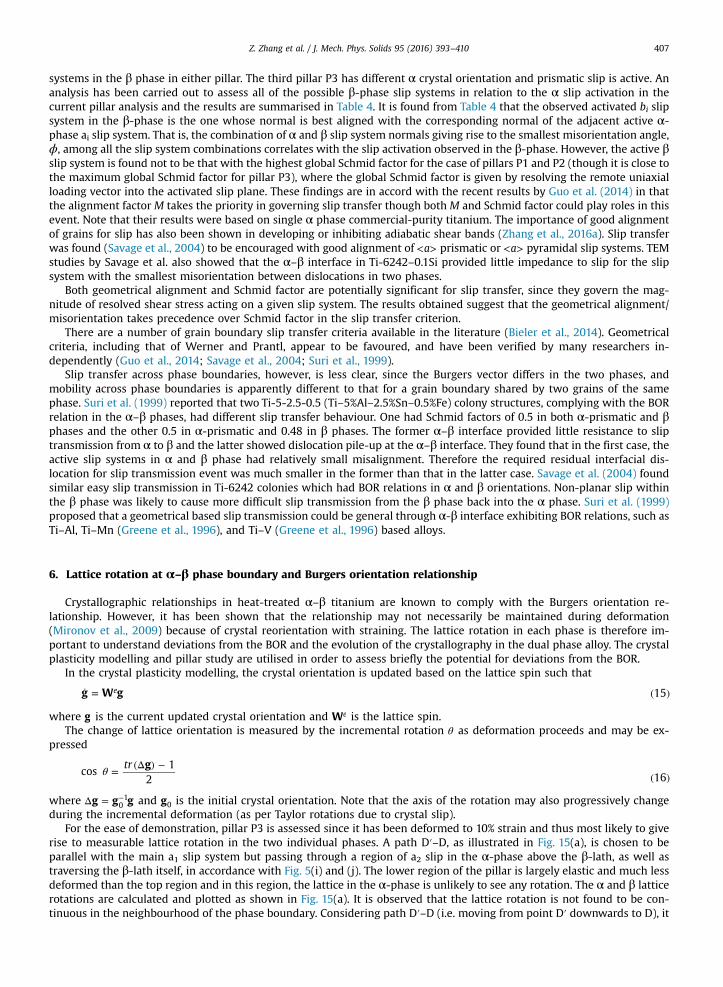
rise to measurable lattice rotation in the two individual phases. A path D′–D, as illustrated in Fig. 15(a), is chosen to beparallel with the main a1 slip system but passing through a region of a2 slip in the α-phase above the β-lath, as well astraversing the β-lath itself, in accordance with Fig. 5(i) and (j). The lower region of the pillar is largely elastic and much lessdeformed than the top region and in this region, the lattice in the α-phase is unlikely to see any rotation. The α and β latticerotations are calculated and plotted as shown in Fig. 15(a). It is observed that the lattice rotation is not found to be con-tinuous in the neighbourhood of the phase boundary. Considering path D′–D (i.e. moving from point D′ downwards to D), it
Fig. 15. (a) Lattice rotation in P3 under ε = 10%yy showing (b) orientaiton relationship before deformation and (c) after deformation. The orientationrelationships in (b) and (c) show that the a2 (red symbol) and b2 (purple cross) direction difference of 10.5° before deformation no longer holds afterdeformation. (For interpretation of the references to color in this figure, the reader is referred to the web version of this article.)
Z. Zhang et al. / J. Mech. Phys. Solids 95 (2016) 393–410408
is surprising to find that the development of lattice rotation from point D′ towards the first α–β interface is discontinuousbefore the α–β interface is reached. This is the result of another slip band a2 which has formed in this region intersectingwith path D′–D, developing a discontinuity in the lattice rotation curve before the first α–β interface. After the discontinuityalong D′–D the lattice rotation continues to evolve in order to accommodate the deformation in the β phase.
The lattice rotation in Fig. 15(a), and particularly at the discontinuity at α–β interfaces, indicates that the BOR may nolonger hold. The existence of the BOR has been well documented in dual phase titanium alloys (Bhattacharyya et al., 2003).However, some studies have indicated that this crystal orientation relationship may be altered during deformation (Mironovet al., 2009), and this idea is supported by the present study which shows that the undeformed Burgers vector directionrelationship between a2 and b2 (10.5°) has in fact been violated after deformation, as shown by comparing Fig. 15(b) in theundeformed state with that in (c) after deformation.
7. Conclusion
The β phase slip strength and rate-dependent properties in Ti-6242 have been determined in this study through coupledmicro-pillar stress relaxation testing and crystal plasticity modelling. Investigation of three α-β pillars is carried out forwhich the single crystal α phase strain rate sensitivity has already been determined from related earlier work. The validity ofthe β phase properties so determined is demonstrated through close comparison of experimental observations and crystalplasticity predictions of micro-pillar elastic-plastic response, stress relaxation, slip activation in both α and β-phases, andstrain localisation in pillars with differing test strain rate, β morphology, and crystal orientations. The β-phase is shown toundergo slip which, as for the α phase, is demonstrated to be rate sensitive at 20 °C. Considering the intrinsic slip systemactivation energies, which control their respective rate sensitivities, it has been found that the β-phase shows the strongestrate sensitivity, followed by that for α basal, in turn followed by the α prism systems with respective active energies of 0.33,0.42, 0.56 eV. The β-phase slip strength (280 MPa) is not notably different to that for either prism or basal α-slip at 20 °C,and the former and latter results suggest that depending upon morphological and crystallographic arrangement, the β-phase may not act as a significant barrier to straining in the adjacent α-phase regions.
However, during stress relaxation, the β phase is revealed to impede the slip transfer within the α�β�α colony from theα phase through the β lath and on to the adjacent α region. The impediment to slip is found to increase with β lath thicknessand to depend on the geometrical relationship between the adjacent active α and β slip planes. Detailed slip trace analysissuggests that slip transfer across α�β interfaces is favoured by closely aligned slip plane normals in the adjacent phases,and that global Schmid factors (calculated with reference to the remote loading direction) are not appropriate to determinelocal slip initiation in either phase. The lattice rotations which occur at the α–β interface have been found not to conservethe initial Burgers orientation relationship.
Acknowledgement
The authors gratefully acknowledge the Engineering & Physical Science Research Council for funding through HexMat(EP/K034332). Further details of the HexMat grant can be found at http://www.imperial.ac.uk/hexmat. TBB and FPED wouldlike to acknowledge the Royal Academic of Engineering for additional funding for their Research Fellowship and Chairrespectively.
Z. Zhang et al. / J. Mech. Phys. Solids 95 (2016) 393–410 409
In compliance with the EPSRC's open access initiative, the data in this paper is available from http://dx.doi.org/10.5281/zenodo.56353.
References
Adenstedt, H., 1949. Creep of titanium at room temperature. Met. Prog. 56, 658–660.Allen, K.W., 1984. Adhesion. 12. Springer Verlag, New York.Ambard, A., Guetaz, L., Louchet, F., Guichard, D., 2001. Role of interphases in the deformation mechanisms of an alpha/beta titanium alloy at 20 K. Mat. Sci.
Eng. A 319, 404–408.Ankem, S., Margolin, H., 1980. The role of elastic interaction stresses on the onset of plastic flow for oriented two ductile phase structures. Metall. Trans. A
11, 963–972.Ankem, S., Margolin, H., Greene, C.A., Neuberger, B.W., Oberson, P.G., 2006. Mechanical properties of alloys consisting of two ductile phases. Prog. Mater. Sci.
51, 632–709.Ardeljan, M., Beyerlein, I.J., Knezevic, M., 2014. A dislocation density based crystal plasticity finite element model: application to a two-phase poly-
crystalline HCP/BCC composites. J. Mech. Phys. Solids 66, 16–31.Asaro, R.J., Needleman, A., 1985. Texture development and strain hardening in rate dependent polycrystals. Acta Metall. 33, 923–953.Ashby, M., 1970. The deformation of plastically non-homogeneous materials. Philos. Mag. 21, 399–424.Bache, M.R., 2003. A review of dwell sensitive fatigue in titanium alloys: the role of microstructure, texture and operating conditions. Int. J. Fatigue 25,
1079–1087.Banerjee, D., Williams, J.C., 2013. Perspectives on titanium science and technology. Acta Mater. 61, 844–879.Bhattacharyya, D., Viswanathan, G.B., Denkenberger, R., Furrer, D., Fraser, H.L., 2003. The role of crystallographic and geometrical relationships between
alpha and beta phases in an alpha/beta titanium alloy. Acta Mater. 51, 4679–4691.Bieler, T., Eisenlohr, P., Zhang, C., Phukan, H., Crimp, M., 2014. Grain boundaries and interfaces in slip transfer. Curr. Opin. Solid State Mater. Sci. 18, 212–226.Boyer, R.R., 1996. An overview on the use of titanium in the aerospace industry. Mat. Sci. Eng. A 213, 103–114.Bridier, F., Villechaise, P., Mendez, J., 2008. Slip and fatigue crack formation processes in an alpha/beta titanium alloy in relation to crystallographic texture
on different scales. Acta Mater. 56, 3951–3962.Choi, I.-C., Kim, Y.-J., Seok, M.-Y., Yoo, B.-G., Kim, J.-Y., Wang, Y., Jang, J.-i, 2013. Nanoscale room temperature creep of nanocrystalline nickel pillars at low
stresses. Int. J. Plast. 41, 53–64.Chu, H., 1970. Room temperature creep and stress relaxation of a titanium alloy. J. Mater. 5, 633–642.Conrad, H., 1967. Thermally activated deformation of alpha titanium below 0.4 Tm. Can. J. Phys. 45, 581–590.Conrad, H., 1981. Effect of interstitial solutes on the strength and ductility of titanium. Prog. Mater. Sci. 26, 123–404.Deka, D., Joseph, D.S., Ghosh, S., Mills, M.J., 2006. Crystal plasticity modeling of deformation and creep in polycrystalline Ti-6242. Metall. Mater. Trans. A
37A, 1371–1388.Donachie, M.J., 2000. Titanium: A Technical Guide. ASM International, Materials Park, OH.Dunne, F.P.E., Rugg, D., 2008. On the mechanisms of fatigue facet nucleation in titanium alloys. Fatigue Fract. Eng. M 31, 949–958.Dunne, F.P.E., Rugg, D., Walker, A., 2007. Lengthscale-dependent, elastically anisotropic, physically-based hcp crystal plasticity: application to cold-dwell
fatigue in Ti alloys. Int. J. Plast. 23, 1061–1083.Ellis, B., Smith, R., 2008. Polymers: A Property Database. CRC Press, Florida.Greene, C.A., Ankem, S., Singh, S., 1996. In: Blenkinsop, P.A., Evans, W.J., Flower, H.M. (Eds.), Titanium'95 Science and Technology. The Institute of Materials,
London, pp. 1315–1322.Gu, R., Ngan, A., 2014. Size-dependent creep of duralumin micro-pillars at room temperature. Int. J. Plast. 55, 219–231.Guo, Y., Britton, T.B., Wilkinson, A.J., 2014. Slip band-grain boundary interactions in commercial-purity titanium. Acta Mater. 76, 1–12.Hasija, V., Ghosh, S., Mills, M.J., Joseph, D.S., 2003. Deformation and creep modeling in polycrystalline Ti–6Al alloys. Acta Mater. 51, 4533–4549.Jun, T.-S., Sernicola, G., Dunne, F.P.E., Britton, T.B., 2016a. Local deformation mechanisms of two-phase Ti alloy. Mater. Sci. Eng. A 649, 39–47.Jun, T.-S., Zhang, Z., Sernicola, G., Dunne, F.P., Britton, T.B., 2016b. Local strain rate sensitivity of single α phase within a dual-phase Ti alloy. Acta Mater. 107,
298–309.Kim, J.-Y., Rokhlin, S.I., 2009. Determination of elastic constants of generally anisotropic inclined lamellar structure using line-focus acoustic microscopy. J.
Acoust. Soc. Am. 126, 2998–3007.Kirane, K., Ghosh, S., 2008. A cold dwell fatigue crack nucleation criterion for polycrystalline Ti-6242 using grain-level crystal plasticity FE model. Int. J.
Fatigue 30, 2127–2139.Lutjering, G., 1998. Influence of processing on microstructure and mechanical properties of (alphaþbeta) titanium alloys. Mater. Sci. Eng. A 243, 32–45.Mironov, S., Murzinova, M., Zherebtsov, S., Salishchev, G.A., Semiatin, S.L., 2009. Microstructure evolution during warm working of Ti–6Al–4V with a
colony-alpha microstructure. Acta Mater. 57, 2470–2481.Neeraj, T., Hou, D.H., Daehn, G.S., Mills, M.J., 2000. Phenonomenological and microstructural analysis of room temperature creep in titanium alloys. Acta
Mater. 48, 1225–1238.Nemat-Nasser, S., Guo, W., Cheng, J., 1999. Mechanical properties and deformation mechanisms of a commercially pure titanium. Acta Mater. 47,
3705–3720.Paton, N., Baggerly, R., Williams, J., 1976. Deformation and Solid Solution Strengthening of Titanium–Aluminum Single Crystals. US Air Force Office of
Scientific Research Final Report, Contract F44620-72-C-0043, Rockwell International Thousand Oaks Calif Science Center.Savage, M.F., Tatalovich, J., Mills, M.J., 2004. Anisotropy in the room-temperature deformation of alpha-beta colonies in titanium alloys: role of the alpha-
beta interface. Philos. Mag. 84, 1127–1154.Savage, M.F., Tatalovich, J., Zupan, M., Hemker, K.J., Mills, M.J., 2001. Deformation mechanisms and microtensile behavior of single colony Ti–6242Si. Mater.
Sci. Eng. A 319, 398–403.Schuh, C., Dunand, D.C., 2001. An overview of power-law creep in polycrystalline beta-titanium. Scr. Mater. 45, 1415–1421.Seal, J.R., Crimp, M.A., Bieler, T.R., Boehlert, C.J., 2012. Analysis of slip transfer and deformation behavior across the alpha/beta interface in Ti–5Al–2.5Sn
(wt%) with an equiaxed microstructure. Mater. Sci. Eng. A 552, 61–68.Shi, R., Dixit, V., Fraser, H., Wang, Y., 2014. Variant selection of grain boundary α by special prior β grain boundaries in titanium alloys. Acta Mater. 75,
156–166.Sinha, V., Mills, M., Williams, J., 2006. Crystallography of fracture facets in a near-alpha titanium alloy. Metall. Mater. Trans. A 37, 2015–2026.Suri, S., Viswanathan, G.B., Neeraj, T., Hou, D.H., Mills, M.J., 1999. Room temperature deformation and mechanisms of slip transmission in oriented single-
colony crystals of an alpha/beta titanium alloy. Acta Mater. 47, 1019–1034.Venkataramani, G., Kirane, K., Ghosh, S., 2008. Microstructural parameters affecting creep induced load shedding in Ti-6242 by a size dependent crystal
plasticity FE model. Int. J. Plast. 24, 428–454.Venkatramani, G., Ghosh, S., Mills, M., 2007. A size-dependent crystal plasticity finite-element model for creep and load shedding in polycrystalline
titanium alloys. Acta Mater. 55, 3971–3986.Weiss, I., Semiatin, S., 1998. Thermomechanical processing of beta titanium alloys – an overview. Mater. Sci. Eng. A 243, 46–65.

Z. Zhang et al. / J. Mech. Phys. Solids 95 (2016) 393–410410
Weiss, I., Semiatin, S., 1999. Thermomechanical processing of alpha titanium alloys – an overview. Mater. Sci. Eng. A 263, 243–256.Werner, E., Prantl, W., 1990. Slip transfer across grain and phase boundaries. Acta Metall. Mater. 38, 533–537.Williams, J., Baggerly, R., Paton, N., 2002. Deformation behavior of HCP Ti–Al alloy single crystals. Metall. Mater. Trans. A 33, 837–850.Zhang, J.Y., Liu, G., Sun, J., 2013. Strain rate effects on the mechanical response in multi- and single-crystalline Cu micropillars: grain boundary effects. Int. J.
Plast. 50, 1–17.Zhang, Z., Cuddihy, M., Dunne, F., 2015. On rate-dependent polycrystal deformation: the temperature sensitivity of cold dwell fatigue. Proc. R. Soc. A 471,
20150214.Zhang, Z., Eakins, D.E., Dunne, F.P., 2016a. On the formation of adiabatic shear bands in textured HCP polycrystals. Int. J. Plast. 79, 196–216.Zhang, Z., Jun, T.-S., Britton, T.B., Dunne, F.P.E., 2016b. Intrinsic anisotropy of strain rate sensitivity in single crystal alpha titanium, (in review).