![NaOCl [μM] - MDPI](https://static.fdocument.org/doc/165x107/62607d508c664043d559d161/naocl-m-mdpi.jpg)
JCMT - Stanford University ACT ACT SZ sim. James Beall Sherry Cho ... base temperature SQUID readout...
61
SLAC Advanced Instrumentation Seminar Kent Irwin NIST Superconducting detector arrays: from cosmology to nuclear non-proliferation ACT JCMT ACT SZ sim
-
Upload
dangnguyet -
Category
Documents
-
view
216 -
download
1
Transcript of JCMT - Stanford University ACT ACT SZ sim. James Beall Sherry Cho ... base temperature SQUID readout...
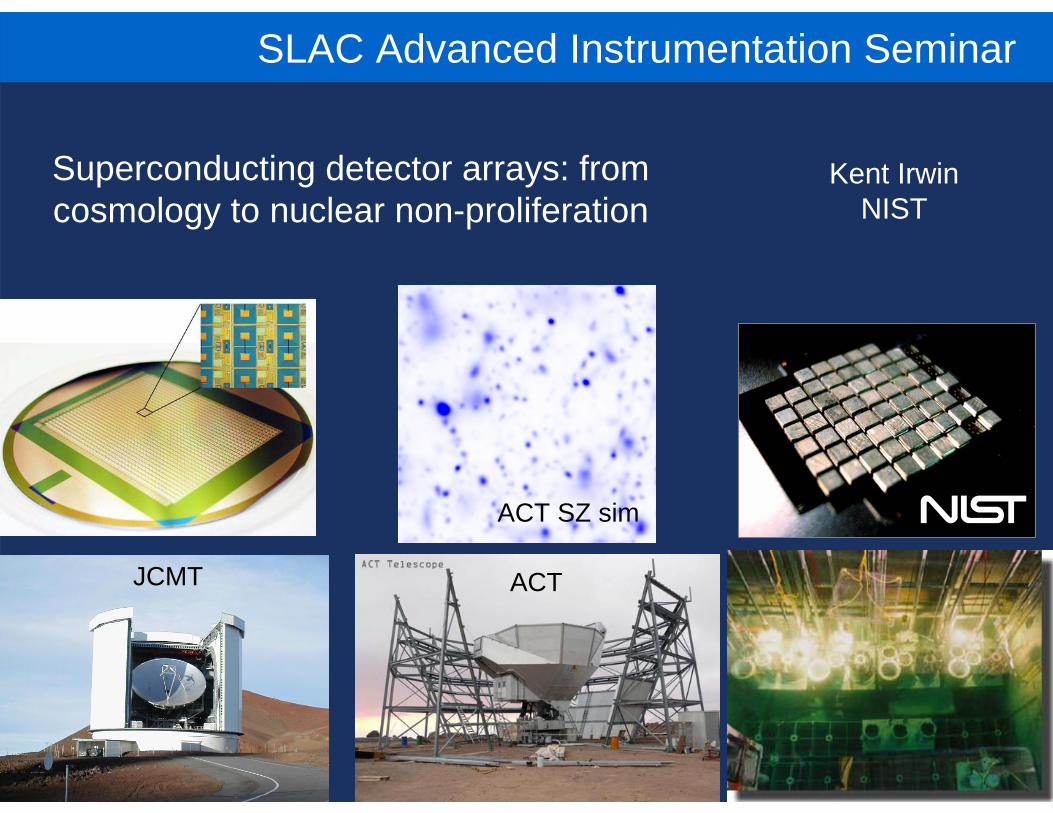
SLAC Advanced Instrumentation Seminar
Kent IrwinNIST
Superconducting detector arrays: from cosmology to nuclear non-proliferation
ACTJCMT
ACT SZ sim
James BeallSherry ChoRandy DorieseWilliam DuncanLisa FerreiraGene HiltonKent IrwinRob HoranskyBen Mates
Nathan MillerGalen O’NeilCarl ReintsemaDan SchmidtJoel UllomLeila ValeYizi XuKi Won YoonBarry Zink
The Quantum Sensors Project at NIST
• Breakthroughs in superconducting and cryogenic technology are enabling practical large superconducting cameras and spectrometers
Superconducting transition-edge sensorsMicromachiningSQUIDs multiplexersCryocoolers
• Astronomical and particle physics applications have driven the development of superconducting detector arrays, but a broader variety of fields are being impacted
CosmologyX-ray and submm astronomy Quantum informationElectron probe materials analysisSecurityNuclear materials Particle physics
Outline

Applications of TES arrays
WIMPs, neutrino mass
CDMS
Dark matter, neutrinosParticle physics
Nuclear non-proliferation, forensics
γ-ray, alpha, neutronNuclear materials
Concealed weapons, Suicide bombers, nuclear smuggling
THz, γ, neutronSecurity
Electron-probe materials analysis, synchrotron
x-rayMaterials analysis
Quantum key distribution, computing
opticalQuantum information
Planet/star/galaxy formation, WHIM, black holes…
submm, x-ray, γ-rayAstronomy
Dark energy, inflation, neutrino mass…
CMB, submm, x-rayCosmology
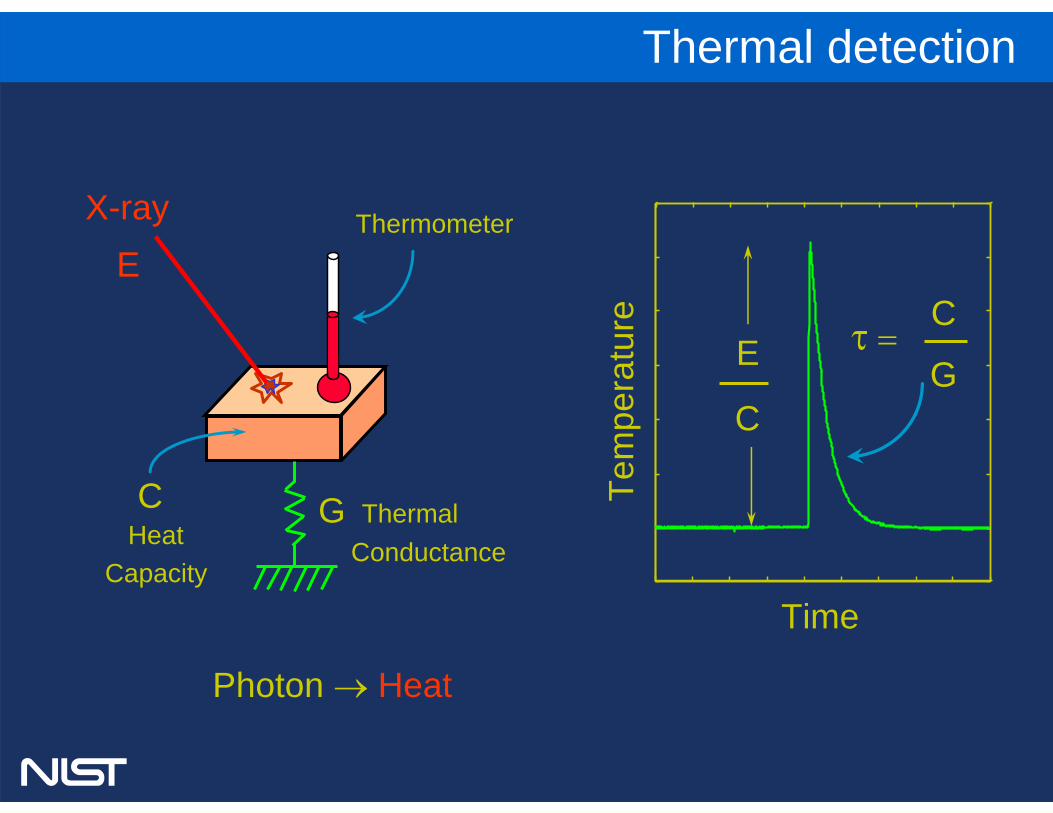
G ThermalConductance
E
CHeat
X-ray Thermometer
Capacity
Tem
pera
ture
Time
C
EC
Gτ =
Photon → Heat
Thermal detection
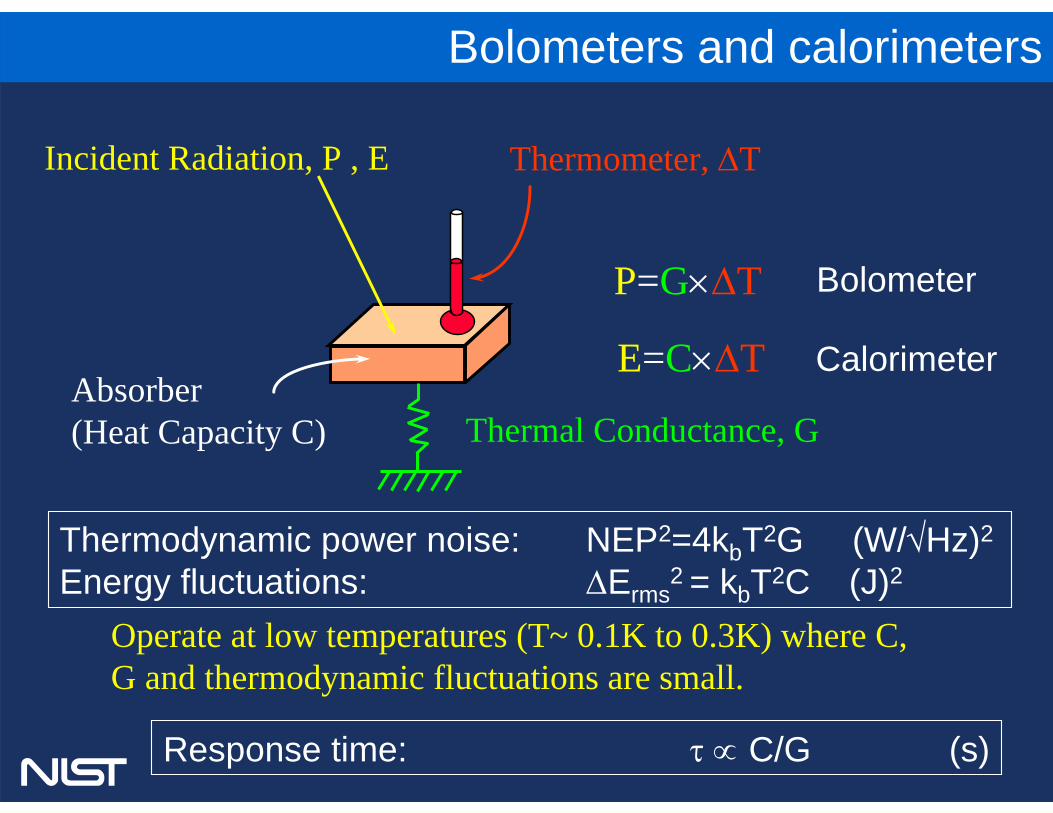
Thermodynamic power noise: NEP2=4kbT2G (W/√Hz)2
Energy fluctuations: ΔErms2 = kbT2C (J)2
Operate at low temperatures (T~ 0.1K to 0.3K) where C, G and thermodynamic fluctuations are small.
Thermal Conductance, G
Incident Radiation, P , E Thermometer, ΔT
Absorber(Heat Capacity C)
Bolometers and calorimeters
P=G×ΔT
E=C×ΔT
Bolometer
Calorimeter
Response time: τ ∝ C/G (s)
Si(Li) EDS
Cou
nts
Energy (eV)4300 4600 4900 5200 55000
500
1000
1500
2000
Ba Lγ1
Ba Lβ2
Ba Lβ3
Ti Kβ1,3
Ba Lβ1
Ti Kα1,2
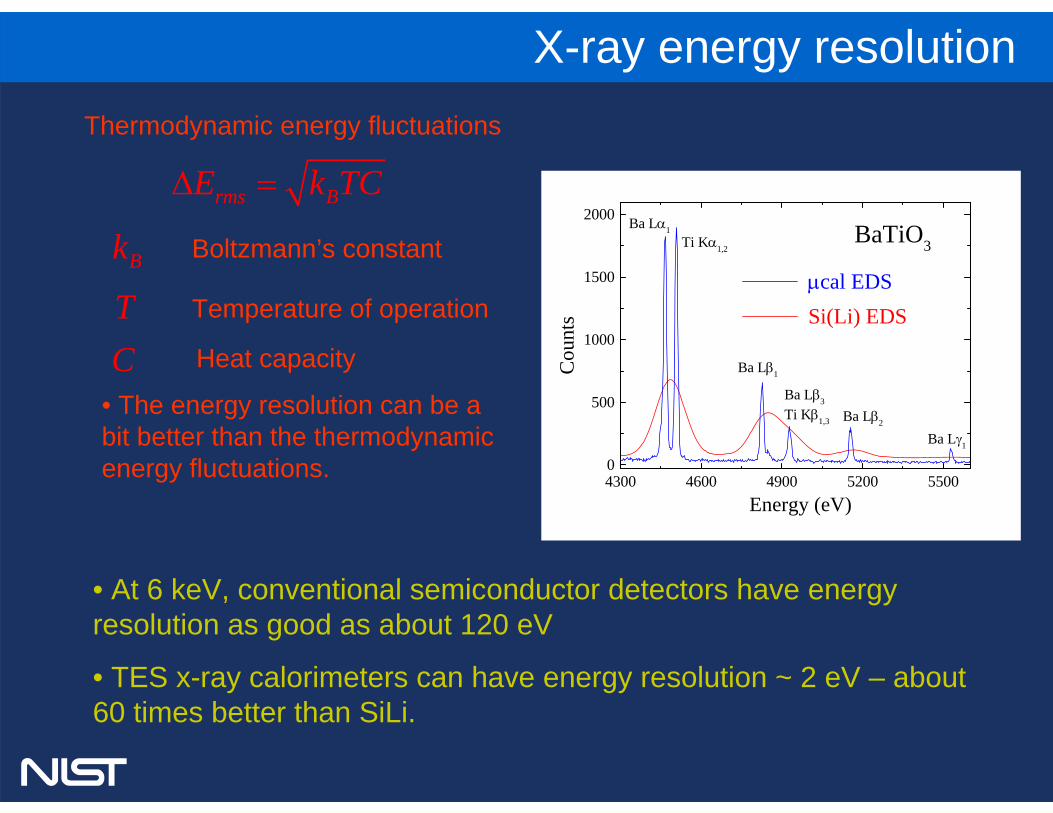
Ba Lα1 BaTiO3
μcal EDS
X-ray energy resolution
• At 6 keV, conventional semiconductor detectors have energy resolution as good as about 120 eV
• TES x-ray calorimeters can have energy resolution ~ 2 eV – about 60 times better than SiLi.
rms BE k TCΔ =
Bk Boltzmann’s constant
T Temperature of operation
C Heat capacity
Thermodynamic energy fluctuations
• The energy resolution can be a bit better than the thermodynamic energy fluctuations.
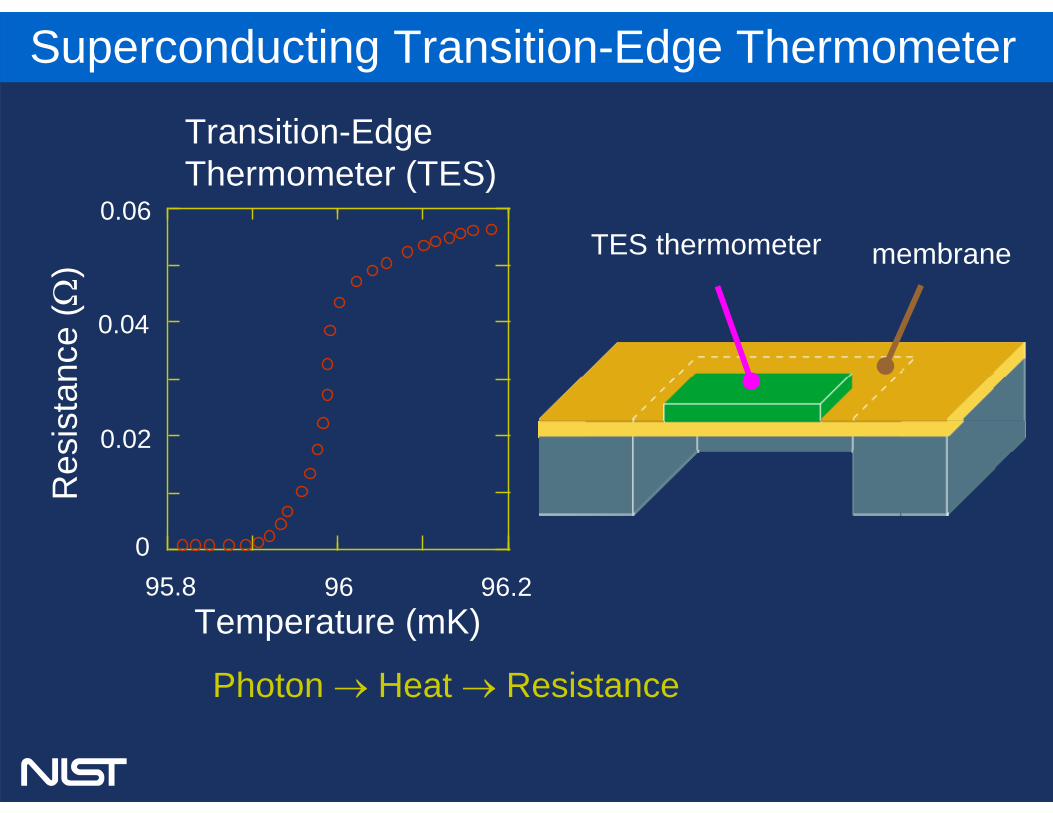
Superconducting Transition-Edge Thermometer
Photon → Heat → Resistance
0.02
0.04
0.06
095.8 96 96.2
Temperature (mK)
Res
ista
nce
(Ω)
Transition-Edge Thermometer (TES)
membraneTES thermometer
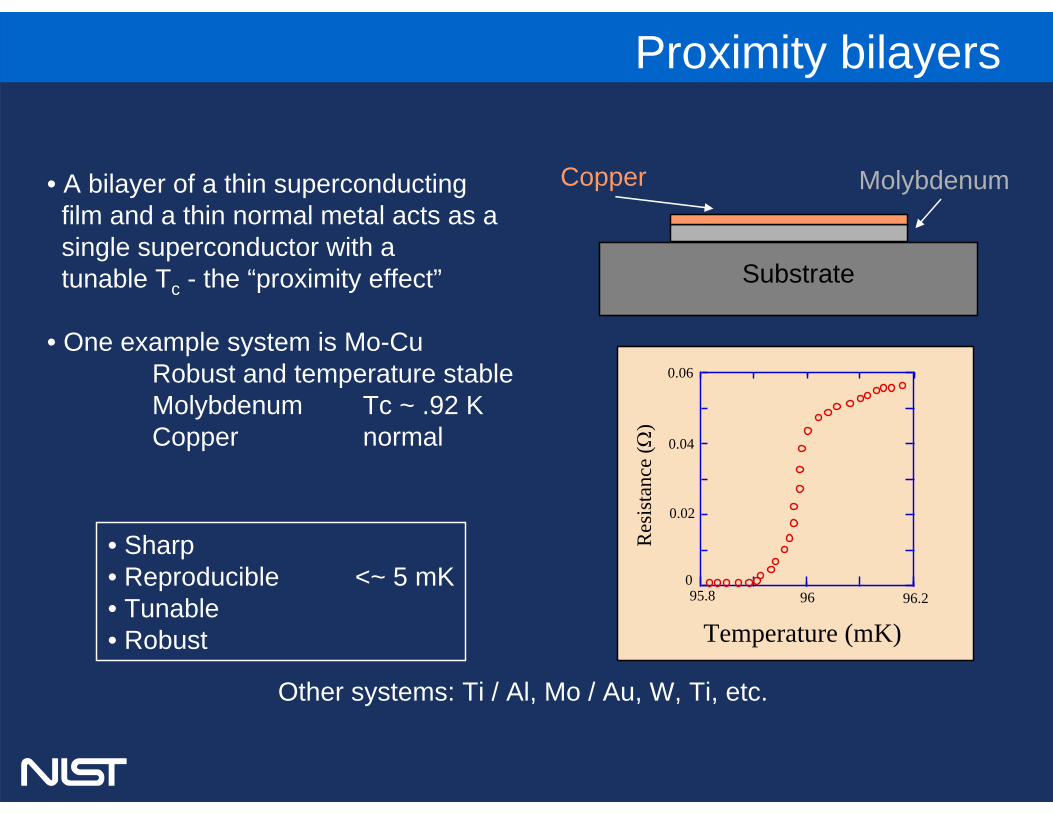
• A bilayer of a thin superconducting film and a thin normal metal acts as asingle superconductor with atunable Tc - the “proximity effect”
• One example system is Mo-CuRobust and temperature stableMolybdenum Tc ~ .92 KCopper normal
• Sharp• Reproducible <~ 5 mK• Tunable• Robust
0.02
0.04
0.06
095.8 96 96.2
Temperature (mK)R
esis
tanc
e (Ω
)
Copper Molybdenum
Substrate
Proximity bilayers
Other systems: Ti / Al, Mo / Au, W, Ti, etc.
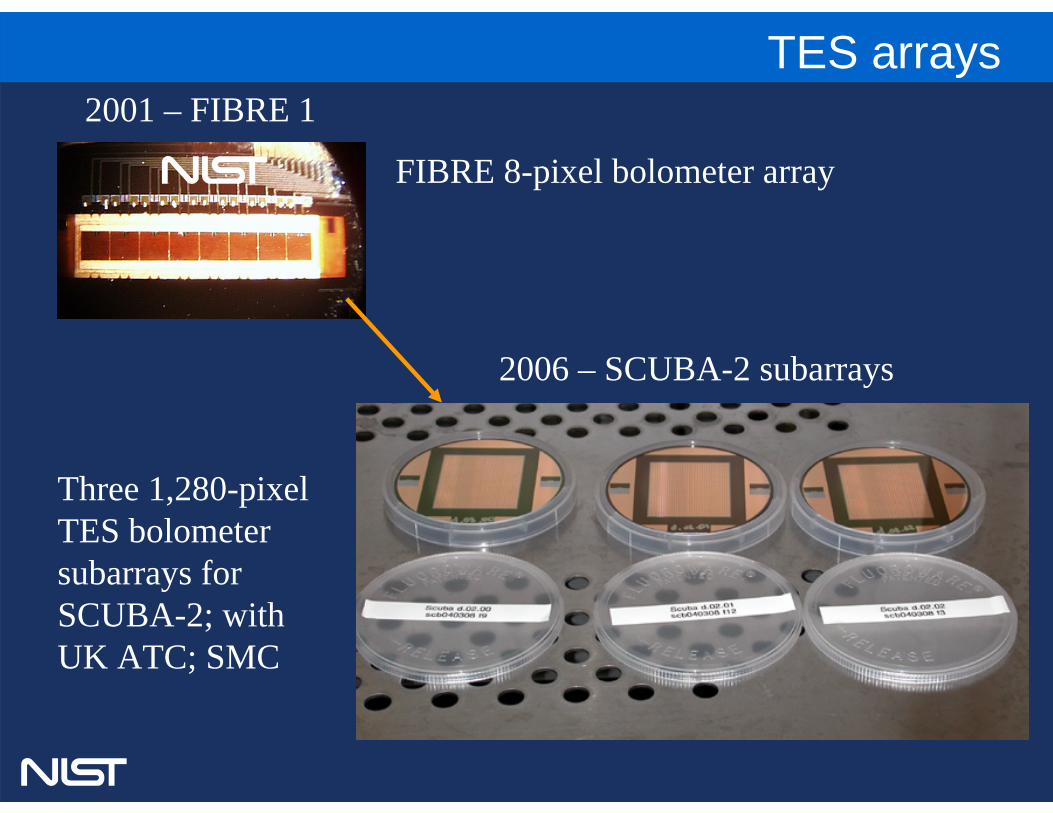
FIBRE 8-pixel bolometer array
Three 1,280-pixel TES bolometer subarrays for SCUBA-2; with UK ATC; SMC
TES arrays2001 – FIBRE 1
2006 – SCUBA-2 subarrays
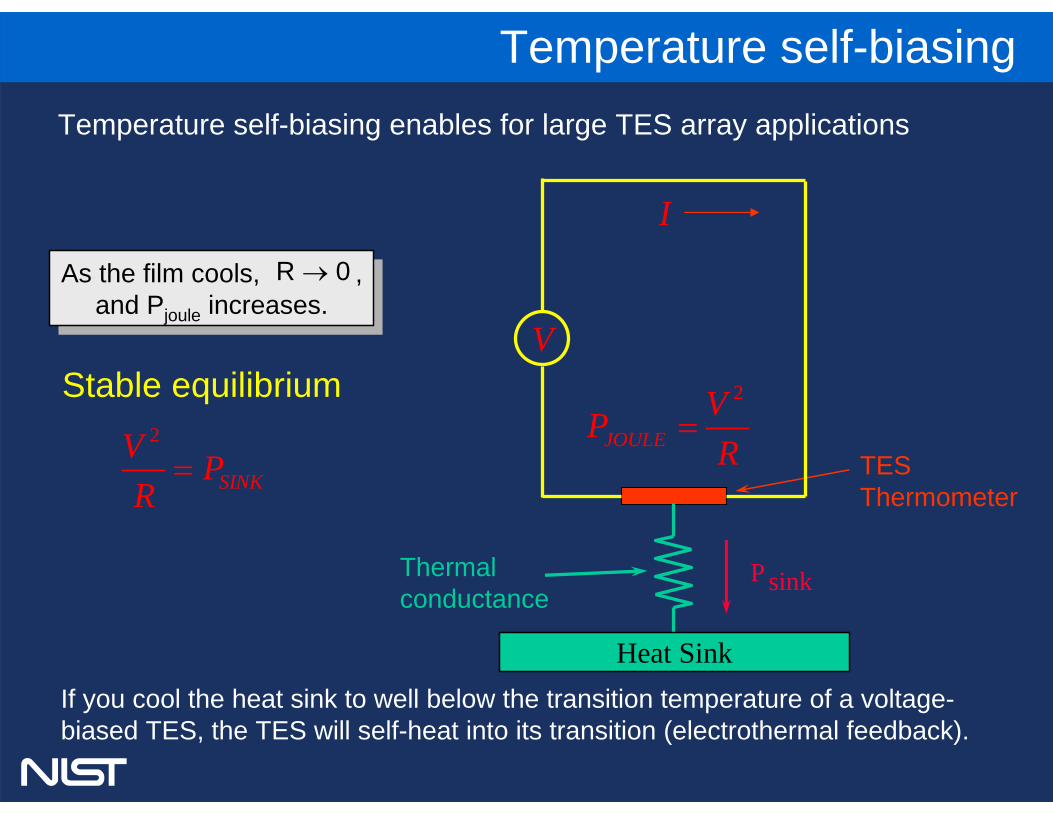
Stable equilibrium
As the film cools, , and Pjoule increases.
As the film cools, , and Pjoule increases.
R 0→
Thermalconductance
TESThermometer
P sink
Heat Sink
2
JOULEVPR
=2
SINKV PR
=
V
I
If you cool the heat sink to well below the transition temperature of a voltage-biased TES, the TES will self-heat into its transition (electrothermal feedback).
Temperature self-biasing enables for large TES array applications
Temperature self-biasing
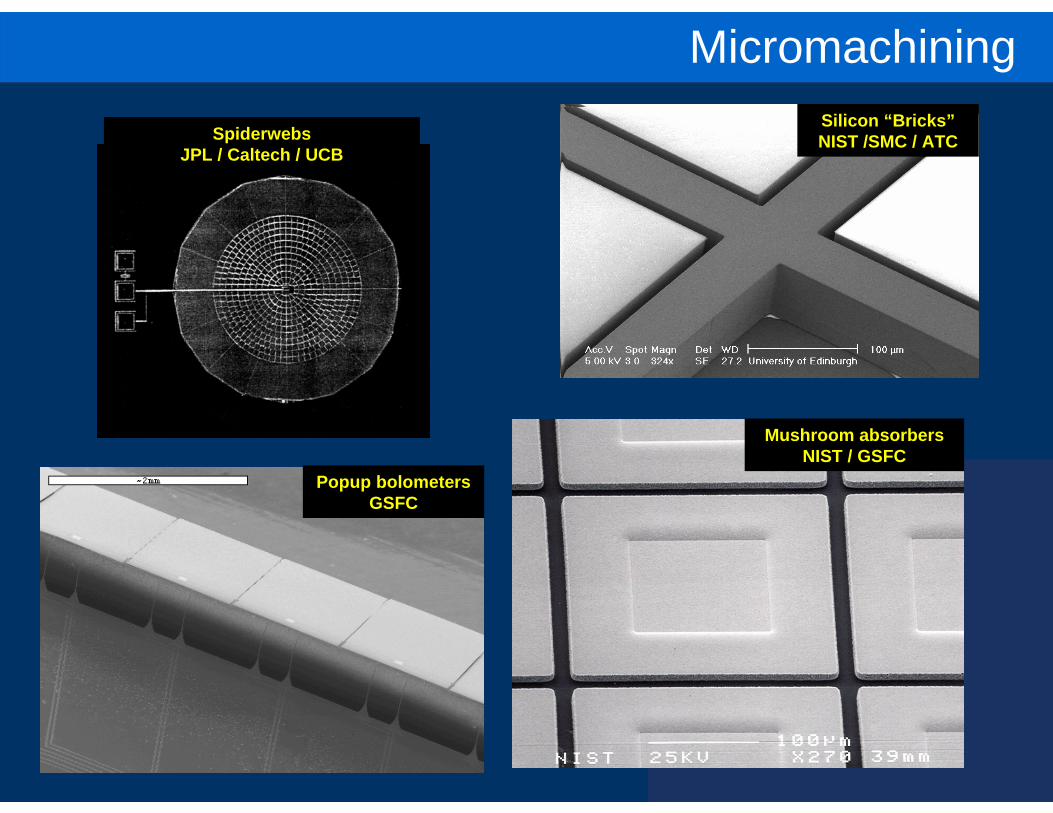
SpiderwebsJPL / Caltech / UCB
Popup bolometersGSFC
Silicon “Bricks”NIST /SMC / ATC
Micromachining
Mushroom absorbersNIST / GSFC
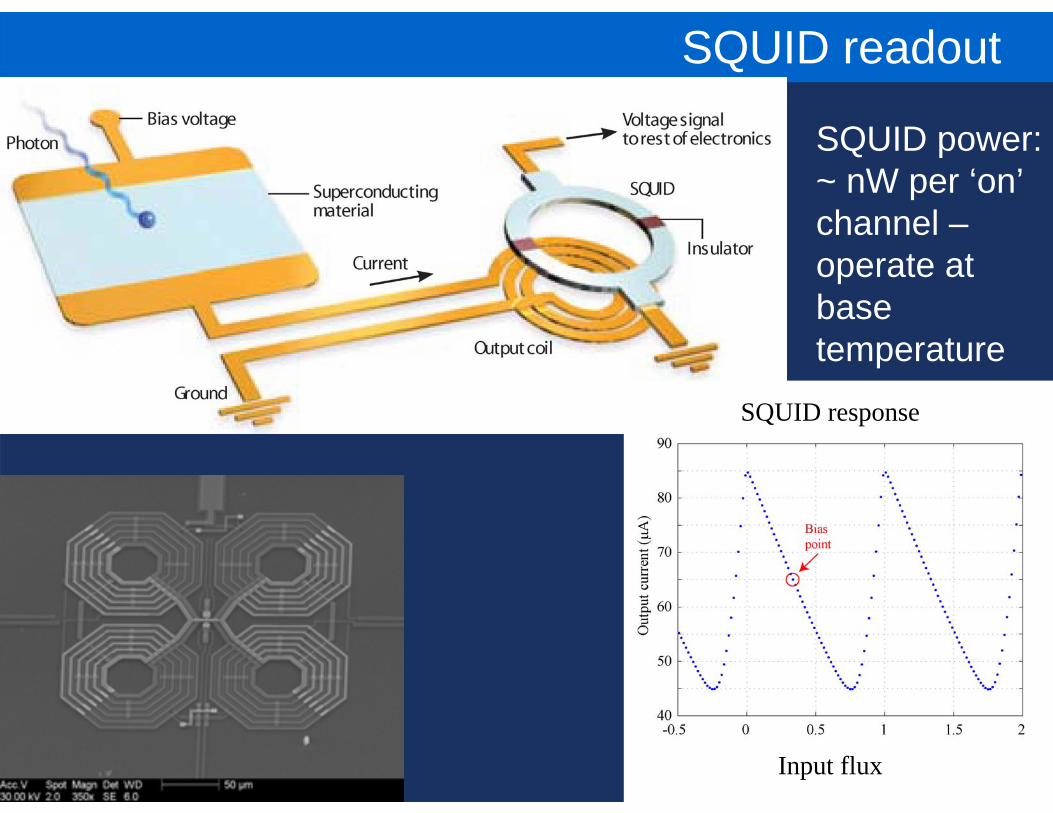
SQUID power: ~ nW per ‘on’channel –operate at base temperature
SQUID readout
NIST
SQUID response
Input flux
time
SQ
UID
Out
put
Δ Temperature
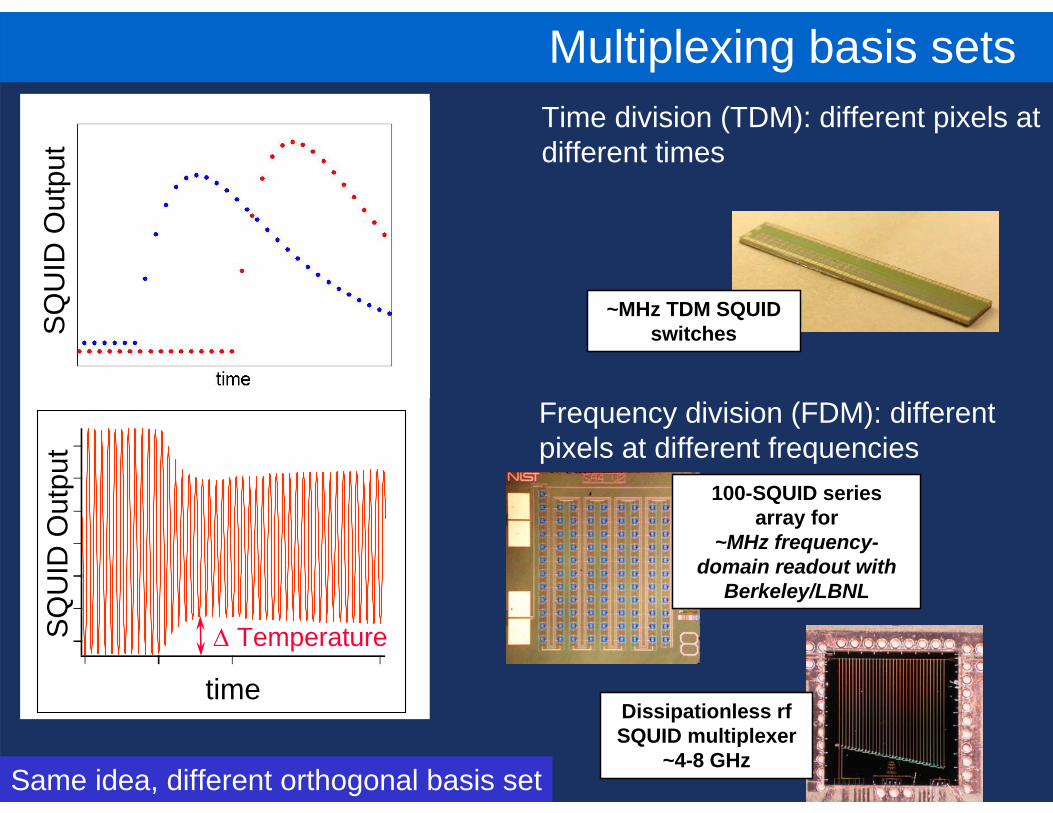
Same idea, different orthogonal basis set
SQ
UID
Out
put
Multiplexing basis sets
Frequency division (FDM): different pixels at different frequencies
100-SQUID series array for
~MHz frequency-domain readout with
Berkeley/LBNL
Dissipationless rfSQUID multiplexer
~4-8 GHz
Time division (TDM): different pixels at different times
~MHz TDM SQUID switches

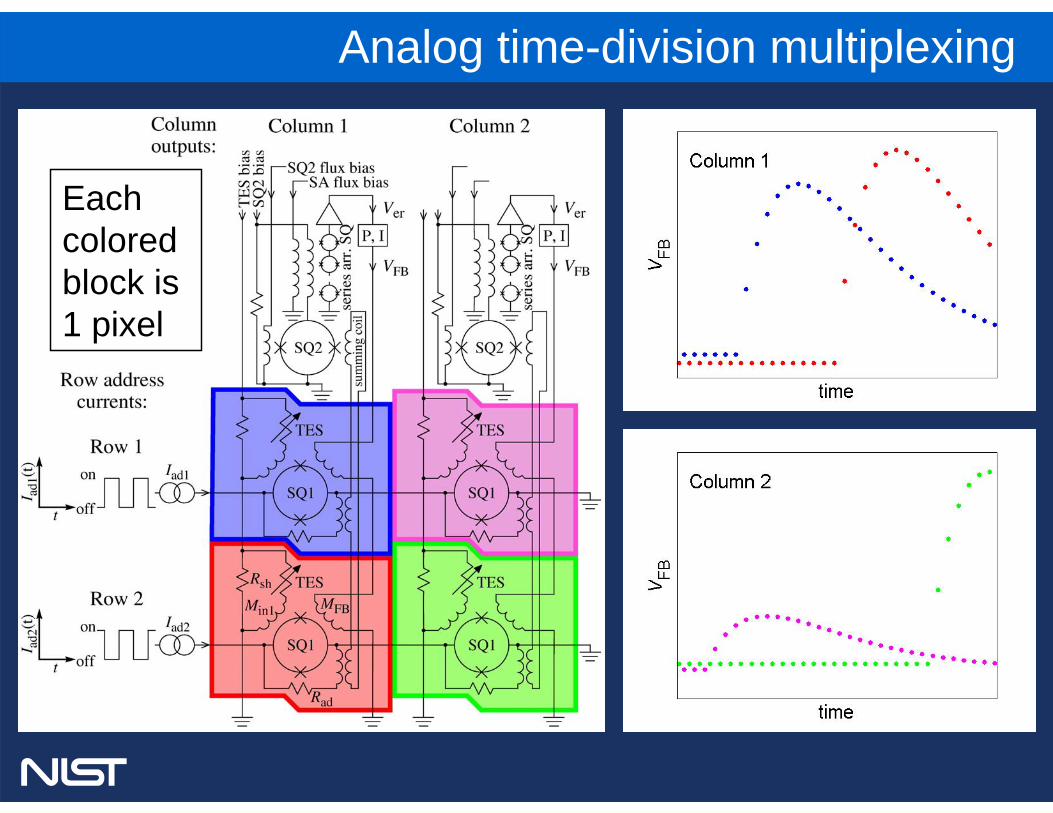
• 2 x 2 array is shown as example of N-row by M-column array
•TDM operation:– each TES coupled to its
own SQ1– TESs stay on all the
time– rows of SQ1s turned on
and off sequentially– SQUIDs are nonlinear
amplifiers, so use digital FB
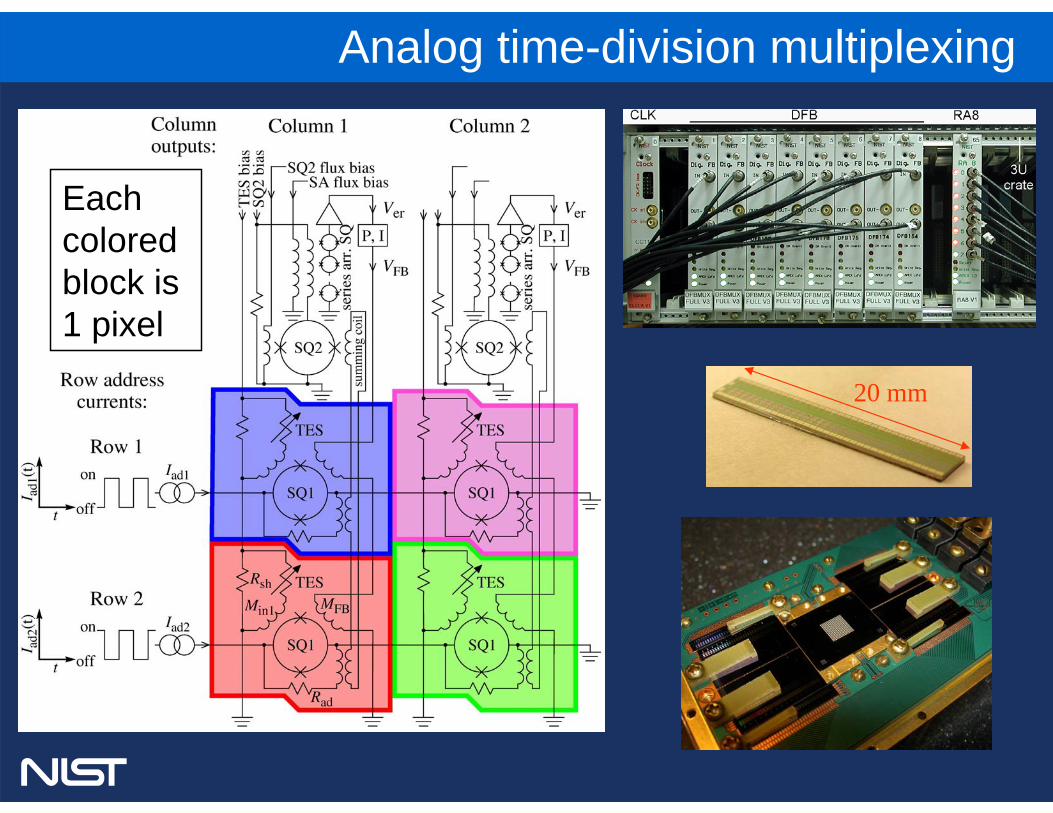
Each colored block is 1 pixel
Analog time-division multiplexing
Each colored block is 1 pixel
Analog time-division multiplexing
Each colored block is 1 pixel
Analog time-division multiplexing
20 mm
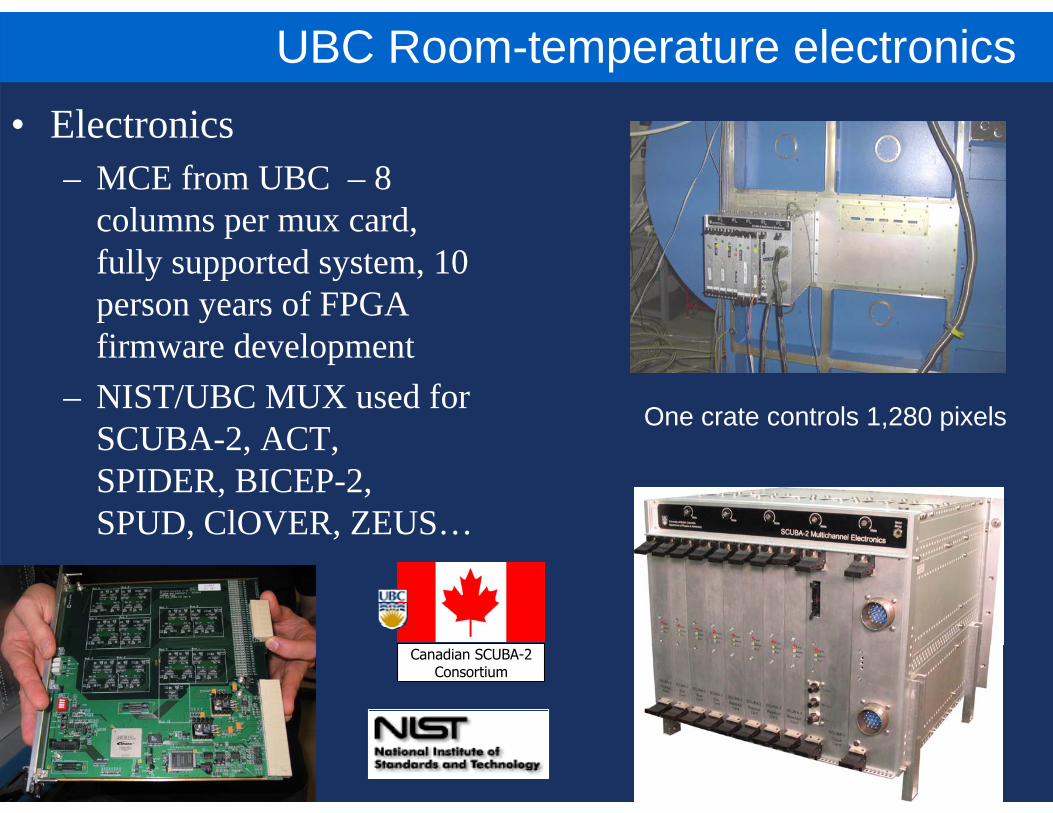
• Electronics– MCE from UBC – 8
columns per mux card, fully supported system, 10 person years of FPGA firmware development
– NIST/UBC MUX used for SCUBA-2, ACT, SPIDER, BICEP-2, SPUD, ClOVER, ZEUS…
Canadian SCUBA-2Consortium
UBC Room-temperature electronics
One crate controls 1,280 pixels
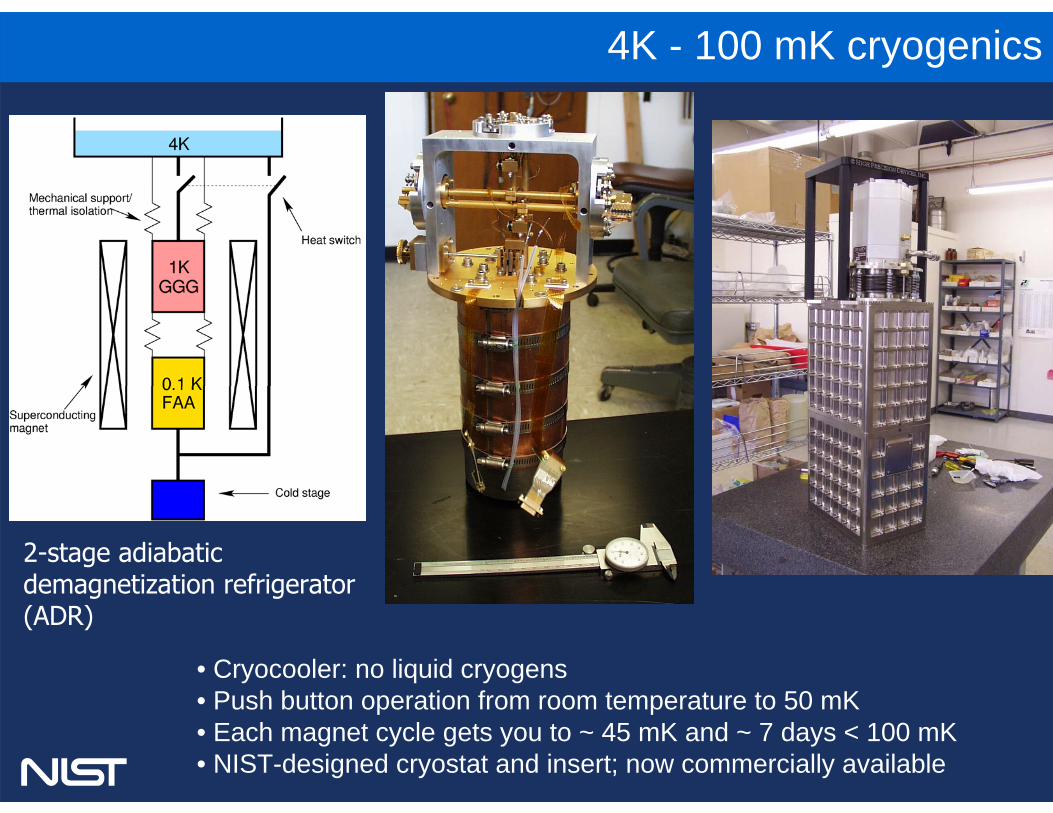
4K - 100 mK cryogenics
2-stage adiabaticdemagnetization refrigerator(ADR)
• Cryocooler: no liquid cryogens• Push button operation from room temperature to 50 mK• Each magnet cycle gets you to ~ 45 mK and ~ 7 days < 100 mK• NIST-designed cryostat and insert; now commercially available
1 mm
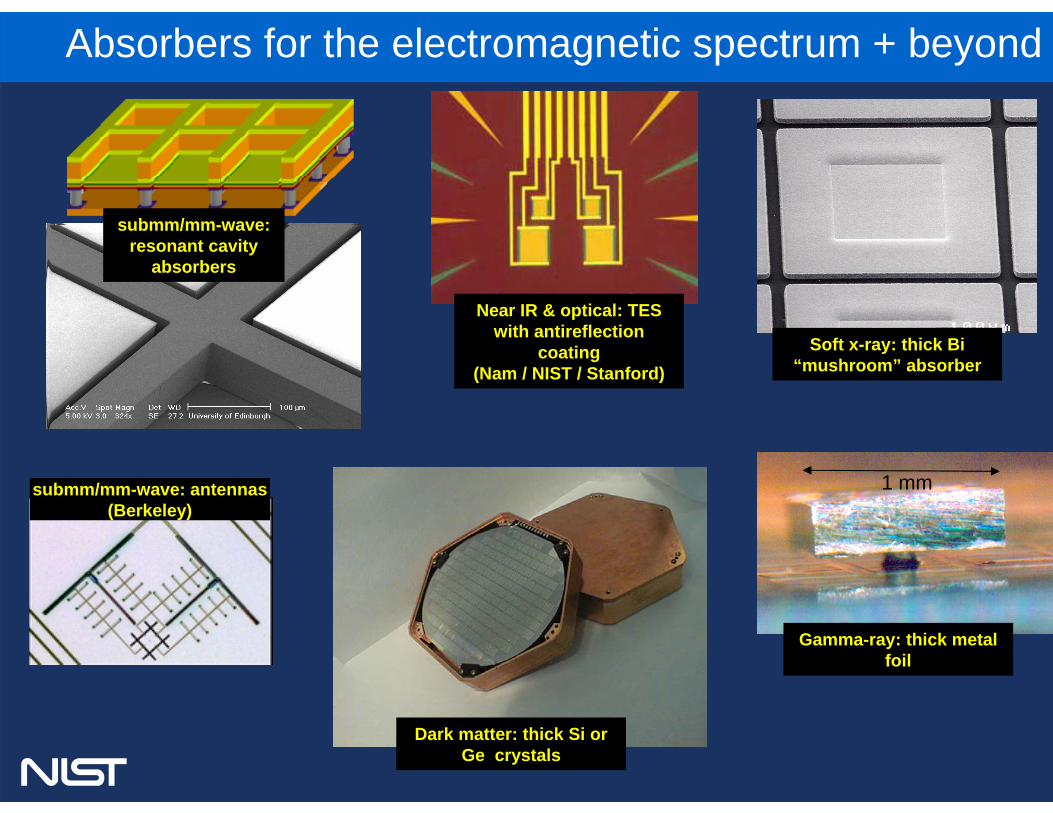
Absorbers for the electromagnetic spectrum + beyond
submm/mm-wave: resonant cavity
absorbers
submm/mm-wave: antennas(Berkeley)
Near IR & optical: TES with antireflection
coating(Nam / NIST / Stanford)
Soft x-ray: thick Bi “mushroom” absorber
Gamma-ray: thick metal foil
Dark matter: thick Si or Ge crystals
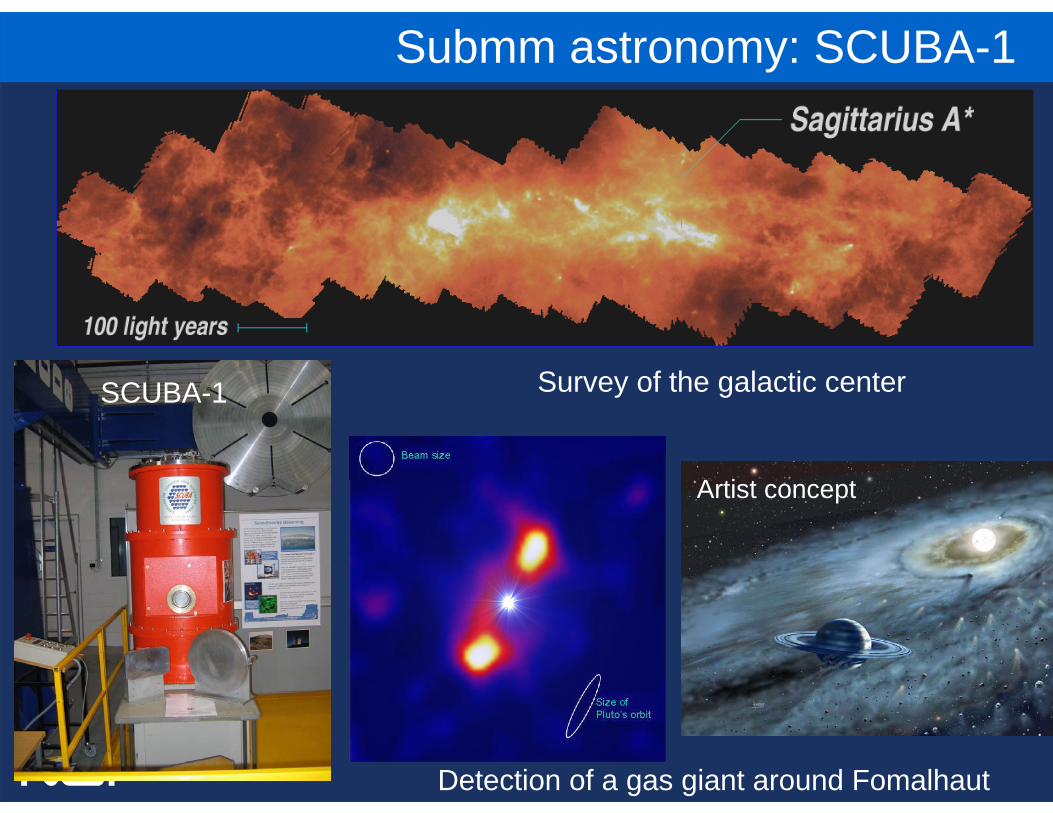
Submm astronomy: SCUBA-1
Detection of a gas giant around Fomalhaut
Survey of the galactic centerSCUBA-1
Artist concept
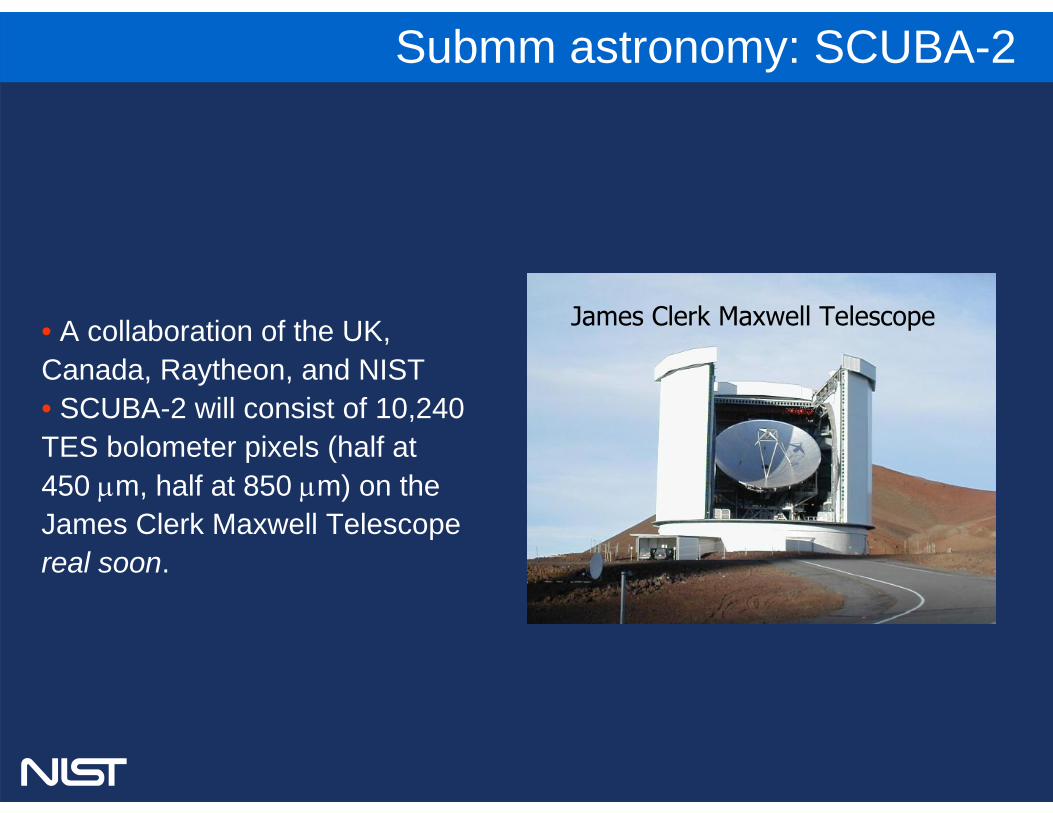
• A collaboration of the UK, Canada, Raytheon, and NIST• SCUBA-2 will consist of 10,240 TES bolometer pixels (half at 450 μm, half at 850 μm) on the James Clerk Maxwell Telescope real soon.
James Clerk Maxwell Telescope
Submm astronomy: SCUBA-2
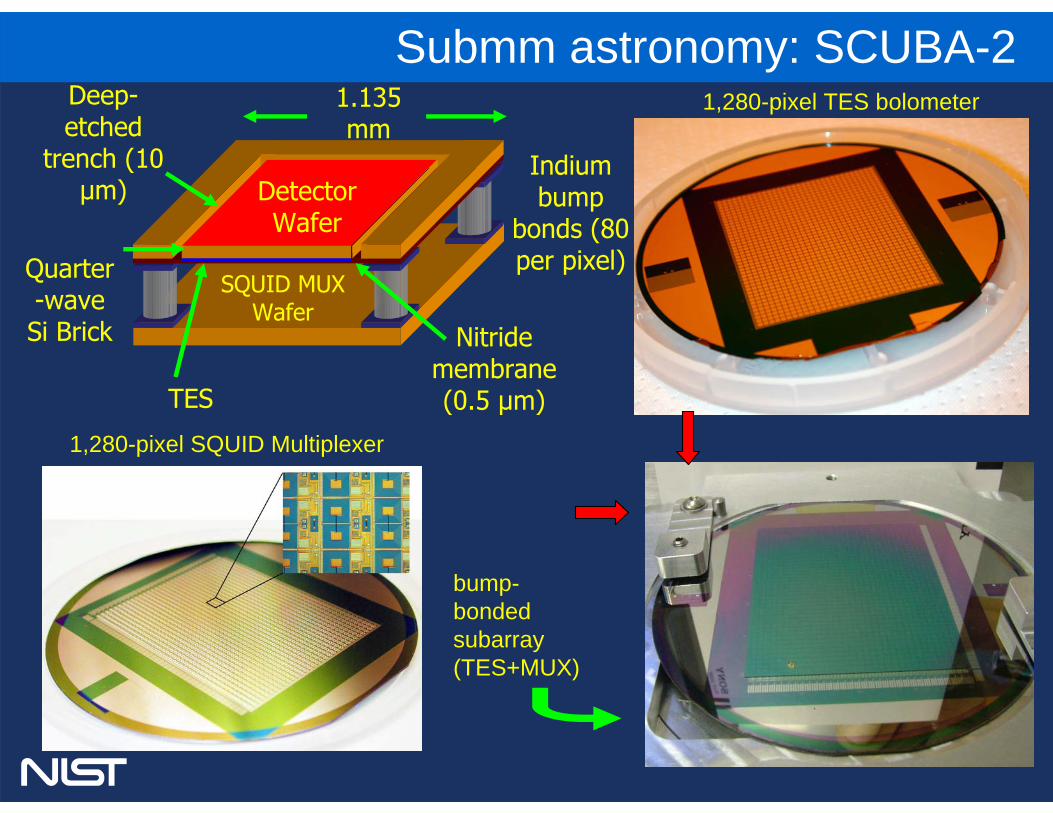
1,280-pixel TES bolometer
1,280-pixel SQUID Multiplexer
bump-bonded subarray (TES+MUX)
Deep-etched
trench (10 μm)
Indium bump
bonds (80 per pixel)
TES
Nitride membrane(0.5 μm)
Quarter-wave Si Brick
1.135 mm
SQUID MUX Wafer
Detector Wafer
Submm astronomy: SCUBA-2
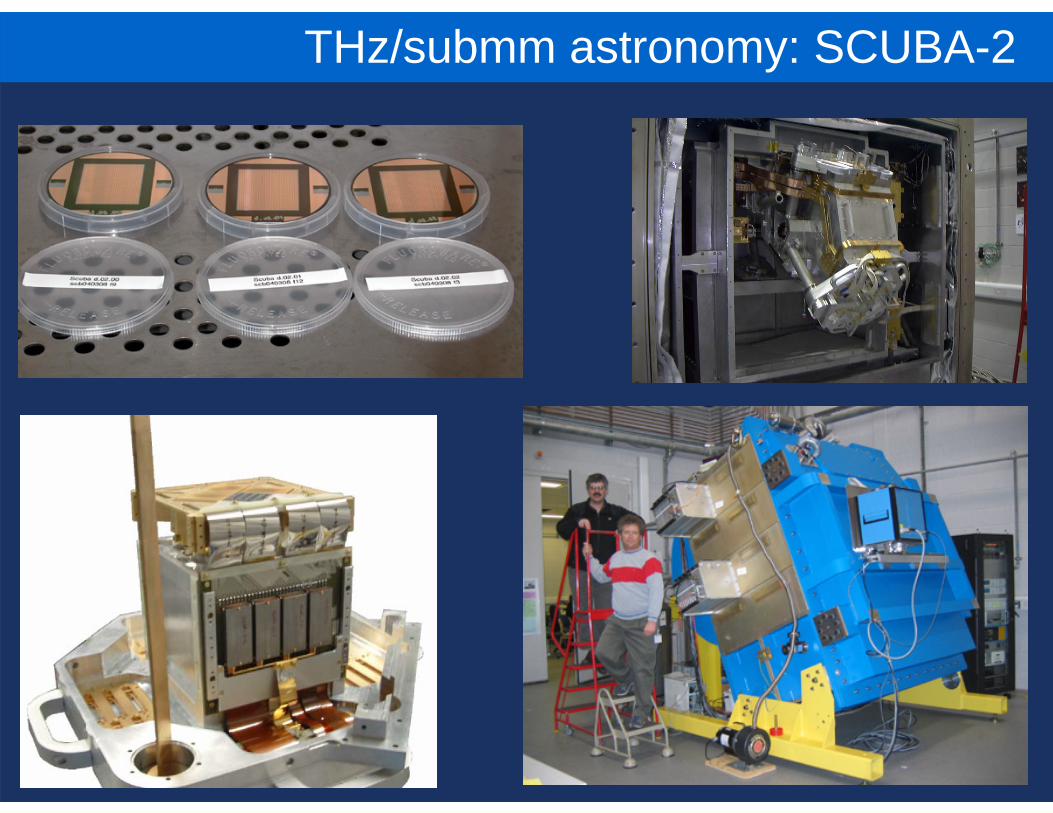
THz/submm astronomy: SCUBA-2
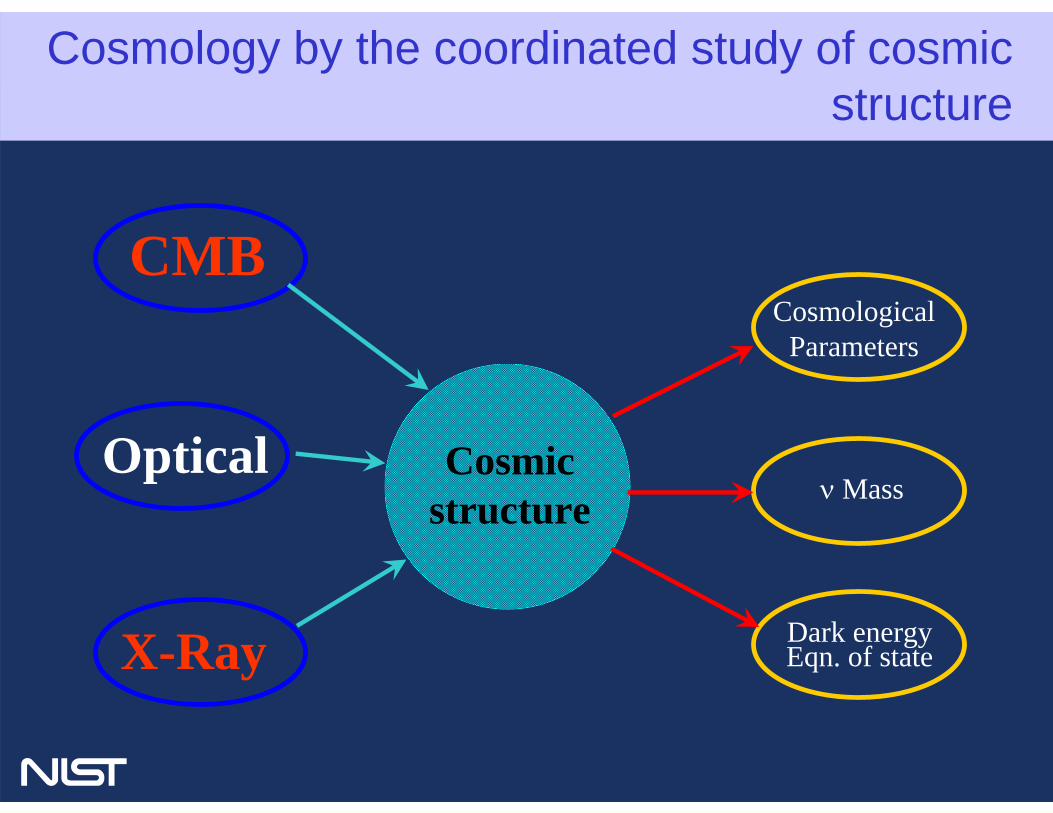
CMB
Optical
X-Ray
Cosmic structure
CosmologicalParameters
ν Mass
Dark energyEqn. of state
Cosmology by the coordinated study of cosmic structure
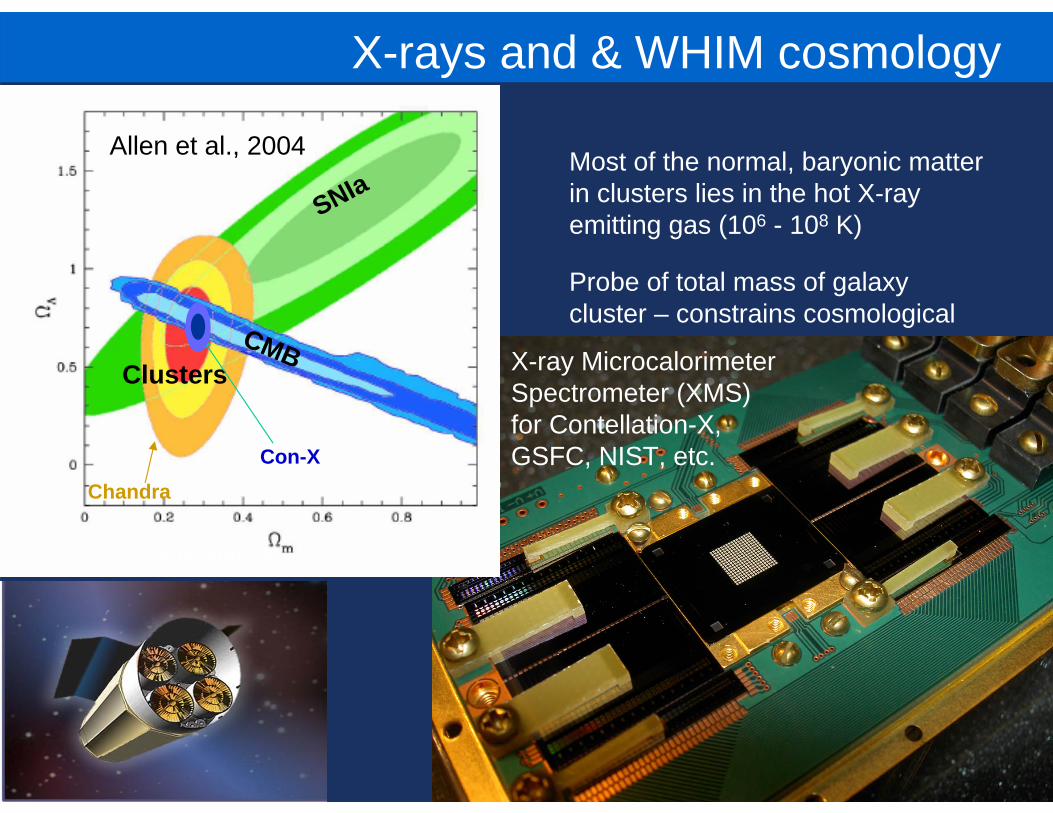
Most of the normal, baryonic matter in clusters lies in the hot X-ray emitting gas (106 - 108 K)
Probe of total mass of galaxy cluster – constrains cosmological parameters
X-rays and & WHIM cosmology
Clusters
SNIa
CMB
ChandraCon-X
Constellation-X
Allen et al., 2004
X-ray MicrocalorimeterSpectrometer (XMS) for Contellation-X, GSFC, NIST, etc.
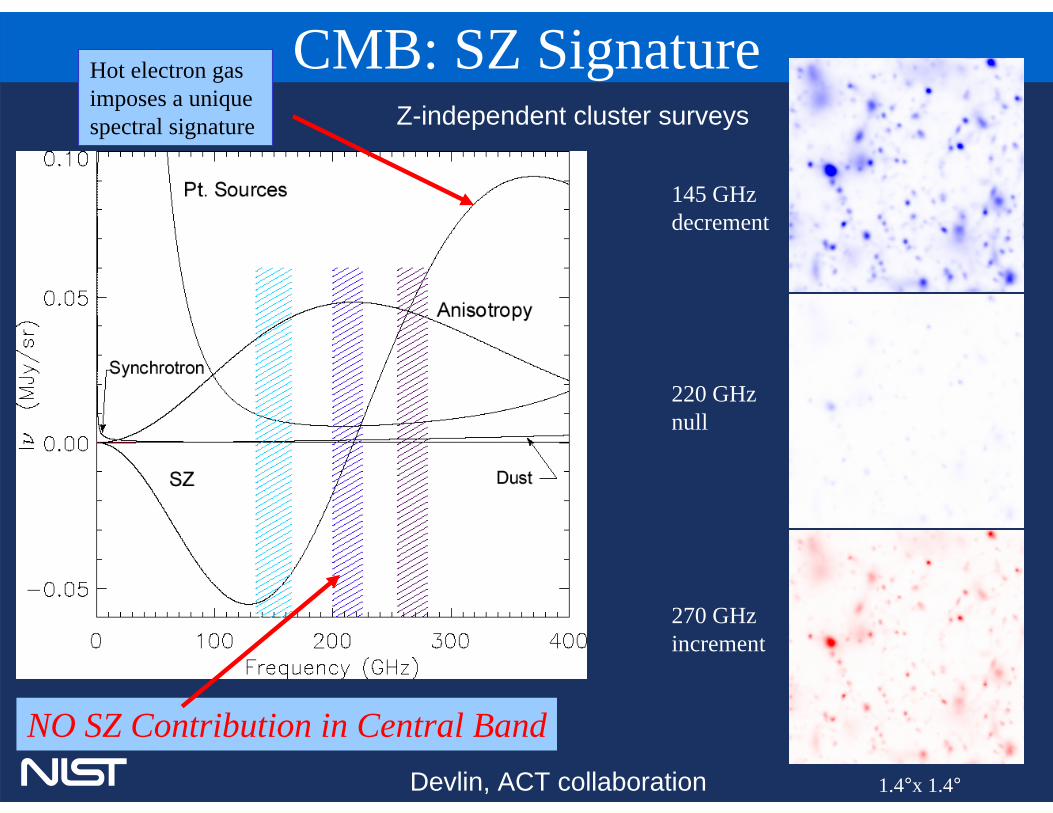
CMB: SZ SignatureHot electron gas imposes a unique spectral signature
NO SZ Contribution in Central Band
145 GHzdecrement
220 GHznull
270 GHzincrement
1.4°x 1.4°Devlin, ACT collaboration
Z-independent cluster surveys
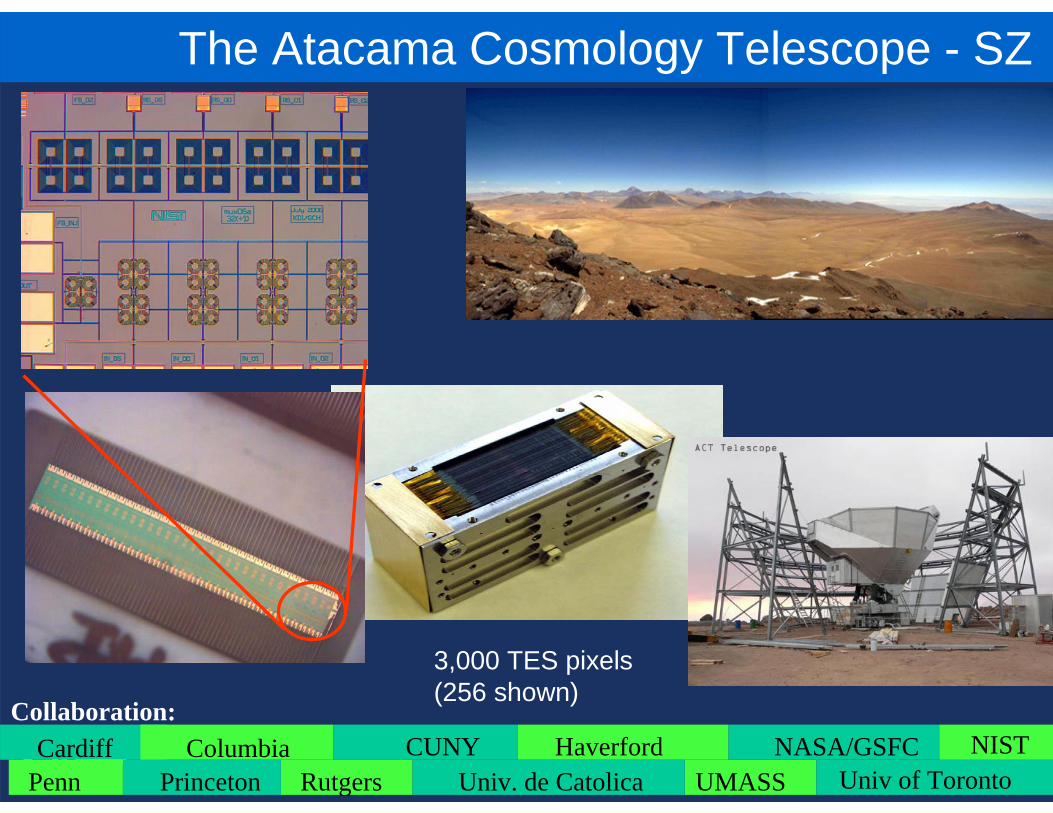
Columbia Haverford NASA/GSFCPenn Rutgers Univ of TorontoUniv. de CatolicaCardiff
UMASSCUNY
Princeton
Collaboration:NIST
The Atacama Cosmology Telescope - SZ
3,000 TES pixels(256 shown)
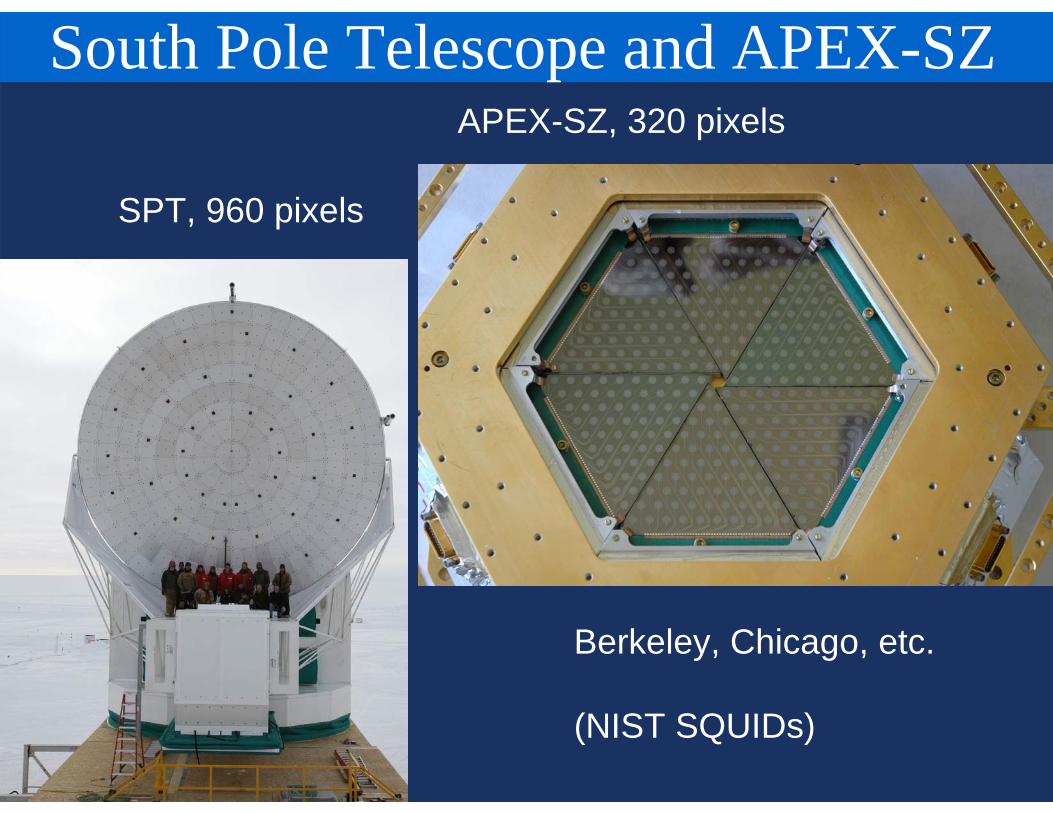
South Pole Telescope and APEX-SZAPEX-SZ, 320 pixels
SPT, 960 pixels
Berkeley, Chicago, etc.
(NIST SQUIDs)
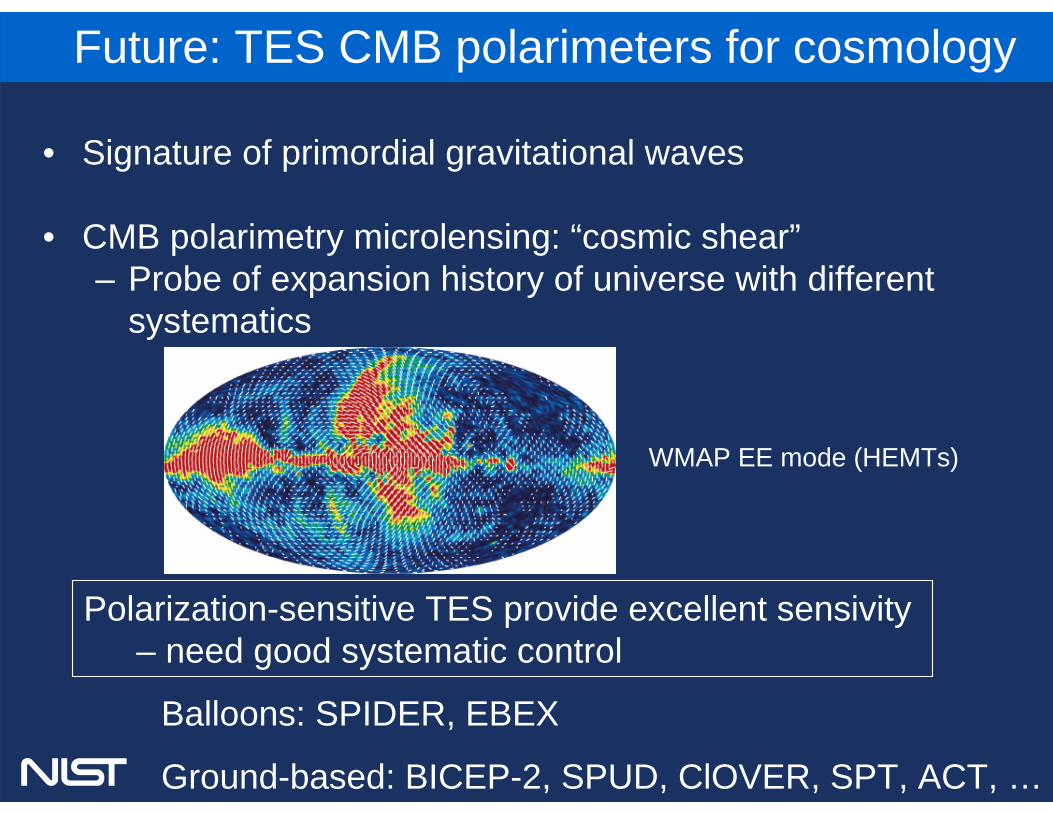
• Signature of primordial gravitational waves
• CMB polarimetry microlensing: “cosmic shear”– Probe of expansion history of universe with different
systematics
Future: TES CMB polarimeters for cosmology
Polarization-sensitive TES provide excellent sensivity – need good systematic control
Balloons: SPIDER, EBEX
Ground-based: BICEP-2, SPUD, ClOVER, SPT, ACT, …
WMAP EE mode (HEMTs)
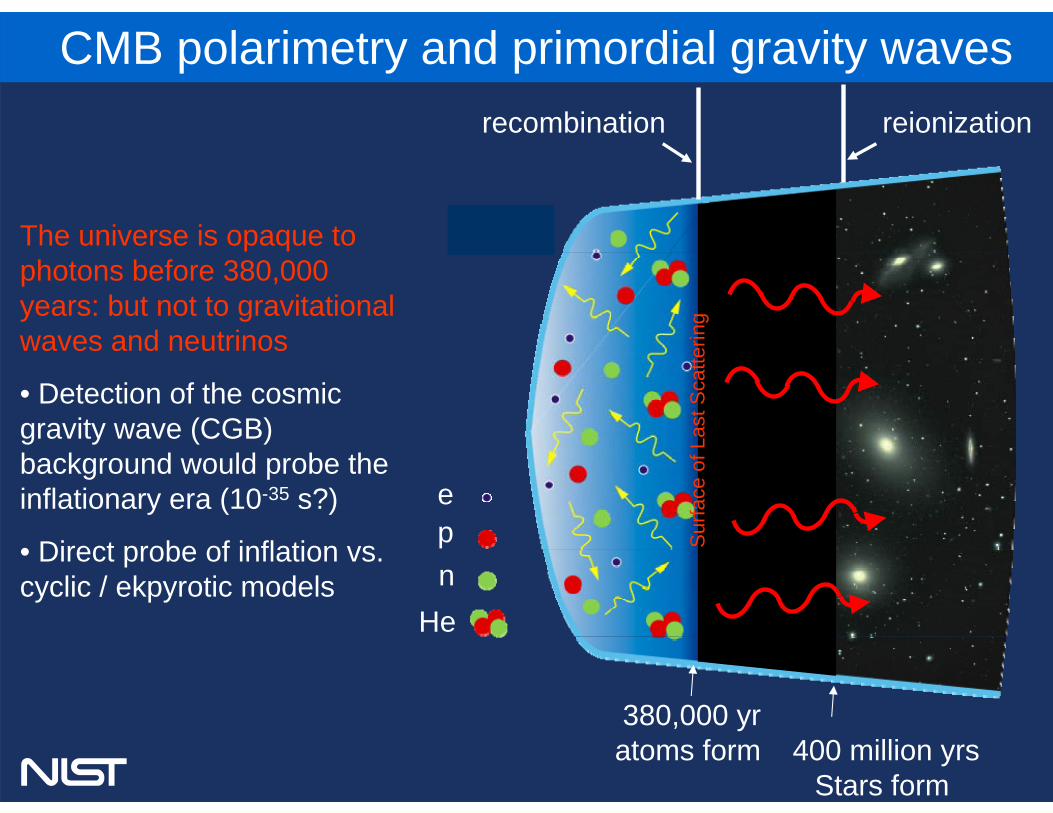
380,000 yratoms form
epn
He
The universe is opaque to photons before 380,000 years: but not to gravitational waves and neutrinos
• Detection of the cosmic gravity wave (CGB) background would probe the inflationary era (10-35 s?)
• Direct probe of inflation vs. cyclic / ekpyrotic models
reionizationrecombination
400 million yrsStars form
Surfa
ce o
f Las
t Sca
tterin
g
CMB polarimetry and primordial gravity waves
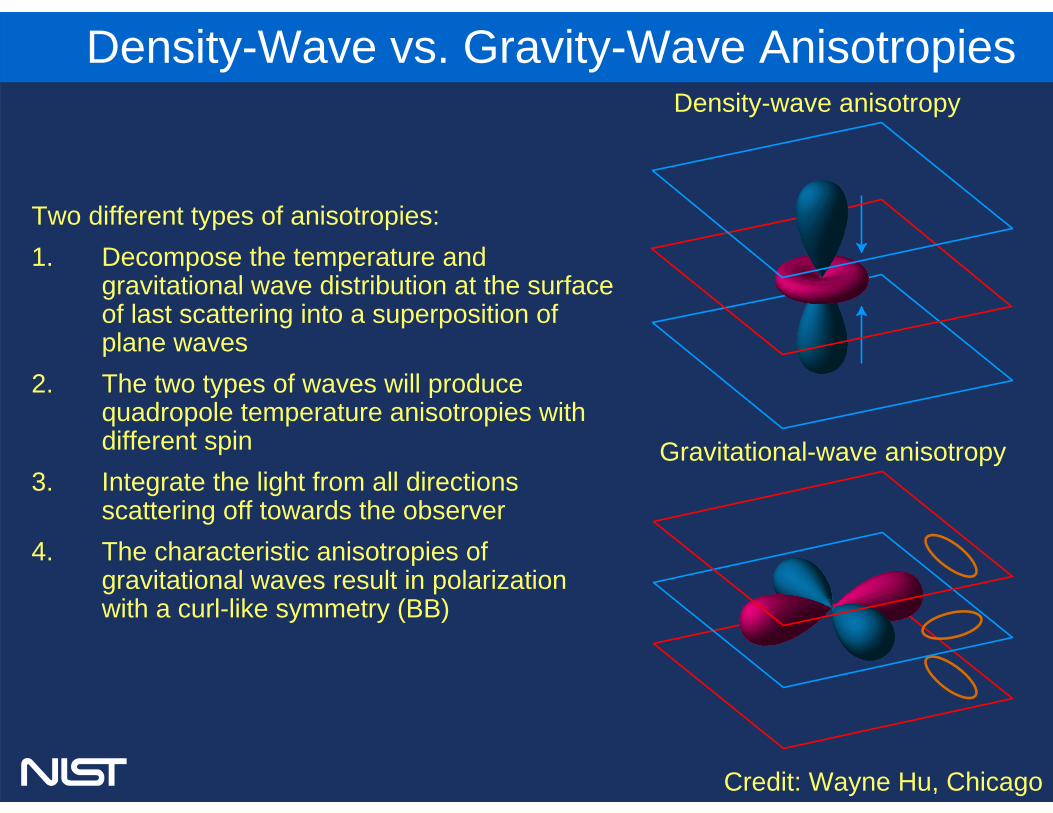
Two different types of anisotropies: 1. Decompose the temperature and
gravitational wave distribution at the surface of last scattering into a superposition of plane waves
2. The two types of waves will produce quadropole temperature anisotropies with different spin
3. Integrate the light from all directions scattering off towards the observer
4. The characteristic anisotropies of gravitational waves result in polarization with a curl-like symmetry (BB)
Density-wave anisotropy
Gravitational-wave anisotropy
Density-Wave vs. Gravity-Wave Anisotropies
Credit: Wayne Hu, Chicago
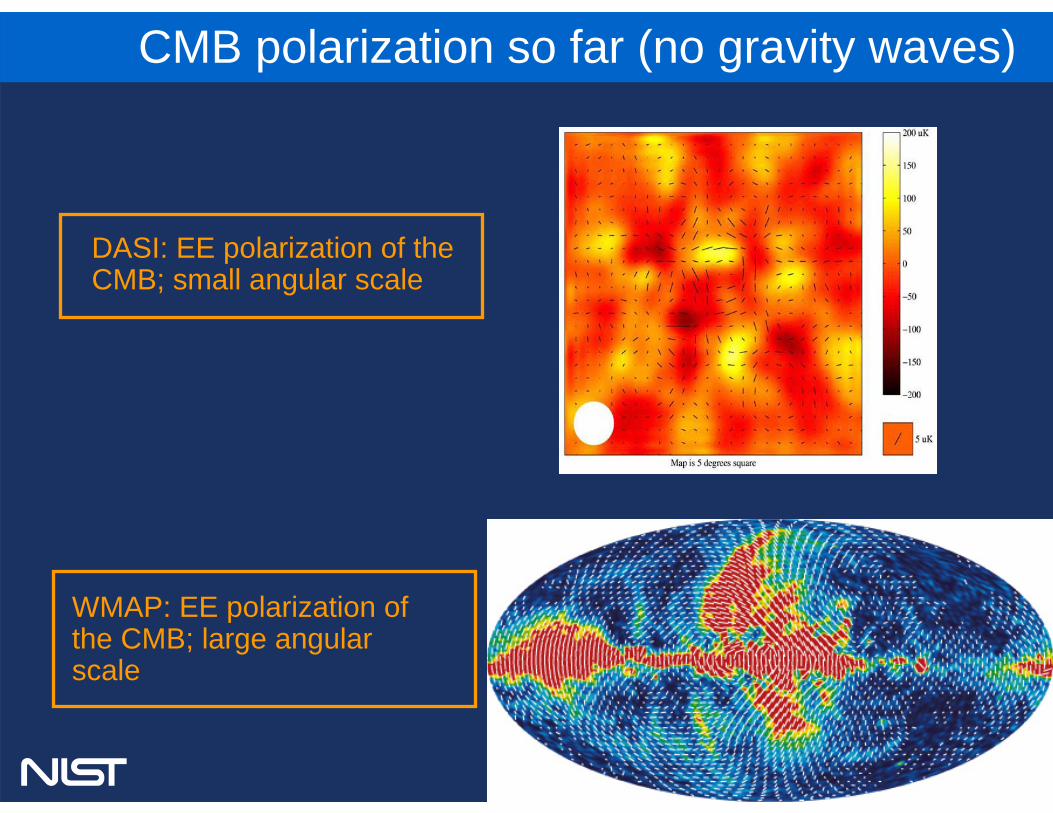
WMAP: EE polarization of the CMB; large angular scale
DASI: EE polarization of the CMB; small angular scale
CMB polarization so far (no gravity waves)
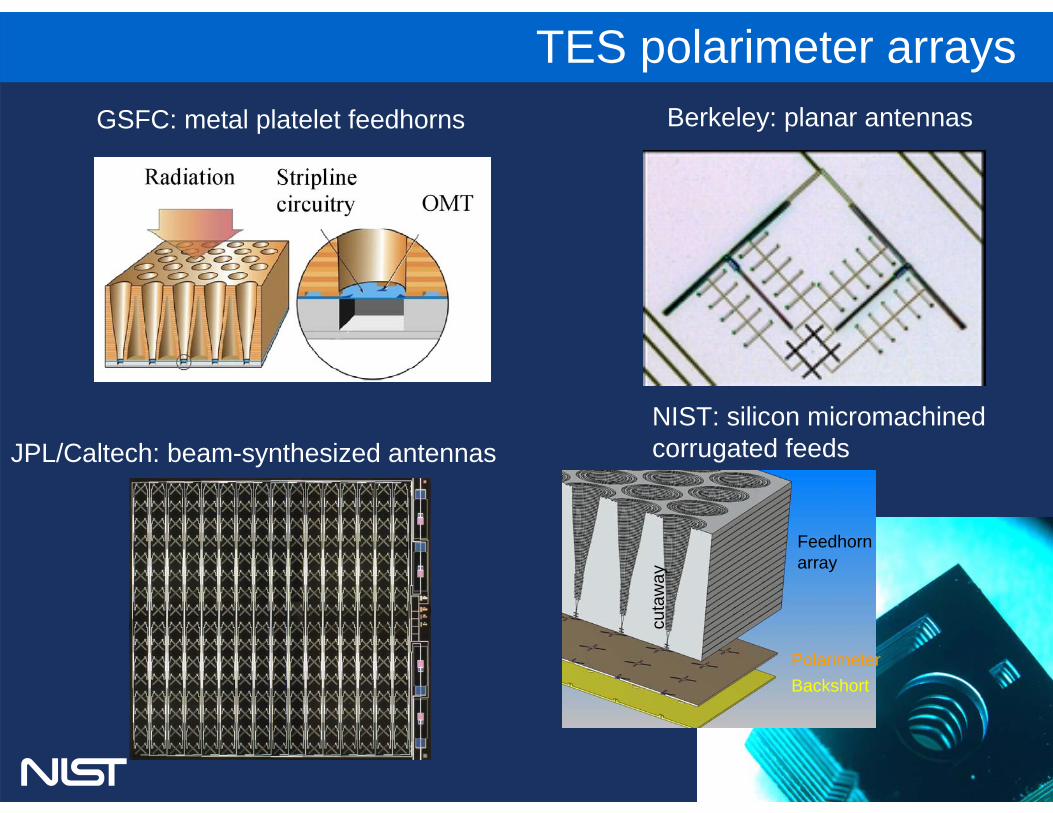
TES polarimeter arrays
Feedhorn array
PolarimeterBackshort
cuta
way
GSFC: metal platelet feedhorns Berkeley: planar antennas
JPL/Caltech: beam-synthesized antennasNIST: silicon micromachined corrugated feeds
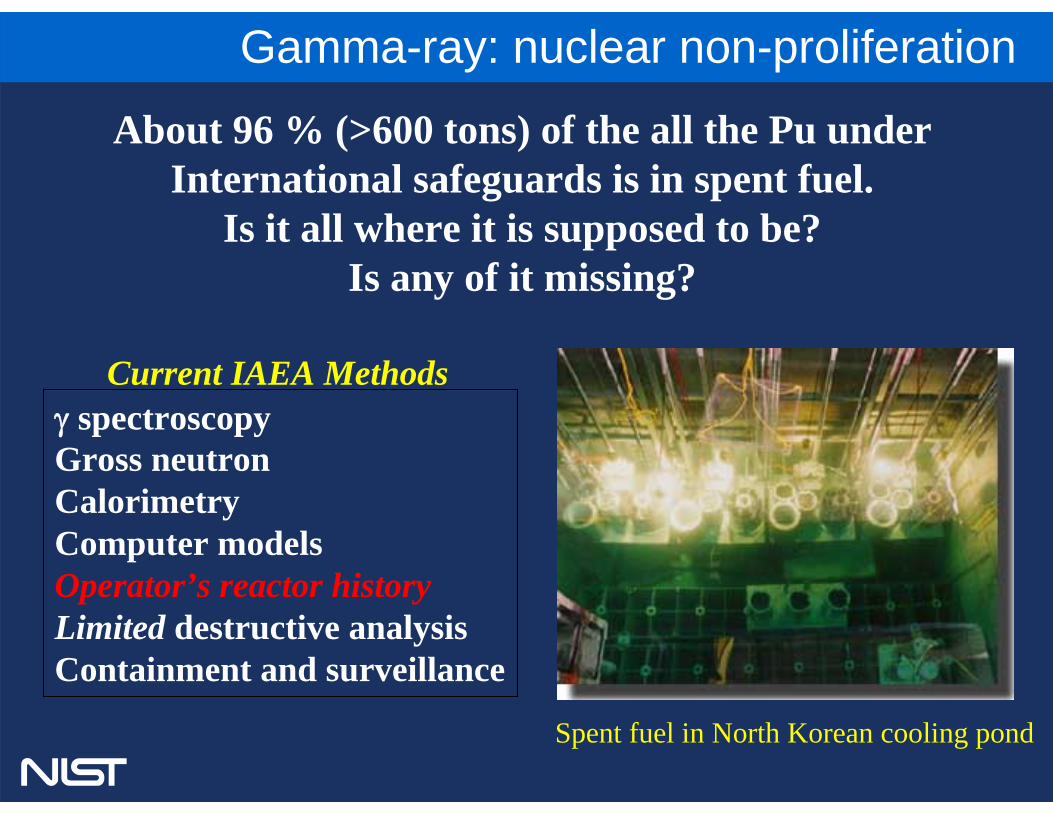
γ spectroscopyGross neutronCalorimetryComputer modelsOperator’s reactor historyLimited destructive analysisContainment and surveillance
Current IAEA Methods
About 96 % (>600 tons) of the all the Pu under International safeguards is in spent fuel.
Is it all where it is supposed to be? Is any of it missing?
Gamma-ray: nuclear non-proliferation
Spent fuel in North Korean cooling pond
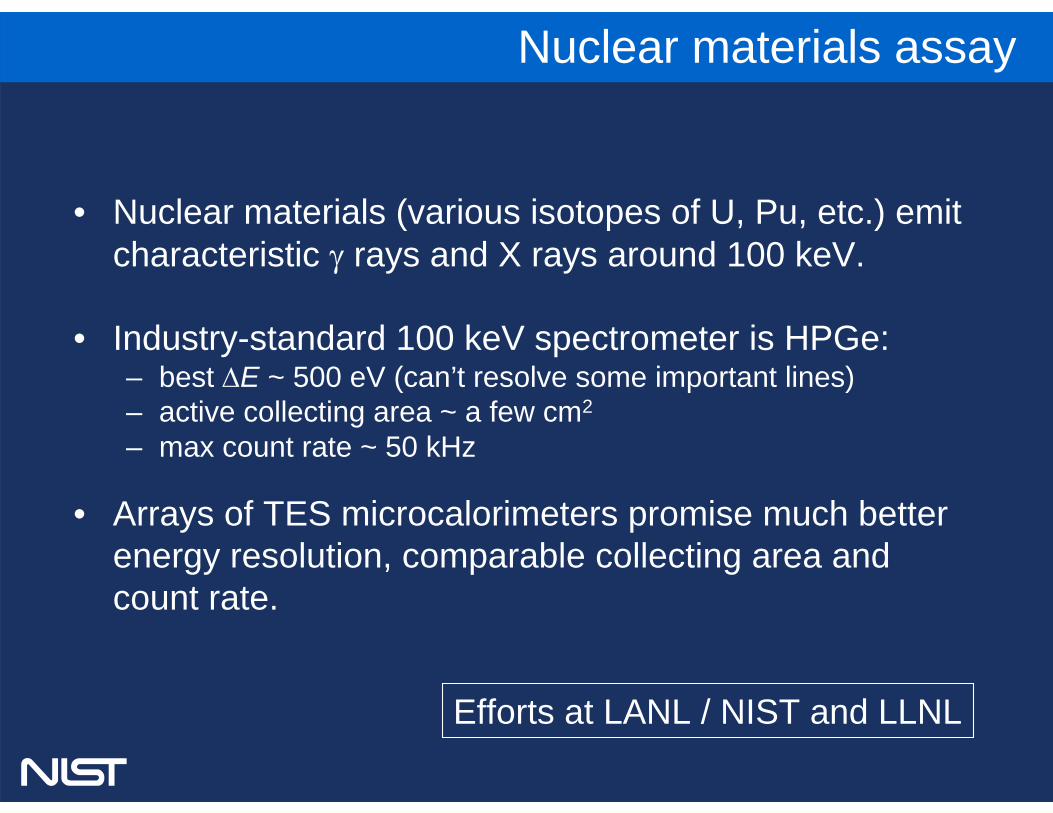
• Nuclear materials (various isotopes of U, Pu, etc.) emit characteristic γ rays and X rays around 100 keV.
• Industry-standard 100 keV spectrometer is HPGe:– best ΔE ~ 500 eV (can’t resolve some important lines)– active collecting area ~ a few cm2
– max count rate ~ 50 kHz
• Arrays of TES microcalorimeters promise much better energy resolution, comparable collecting area and count rate.
Nuclear materials assay
Efforts at LANL / NIST and LLNL
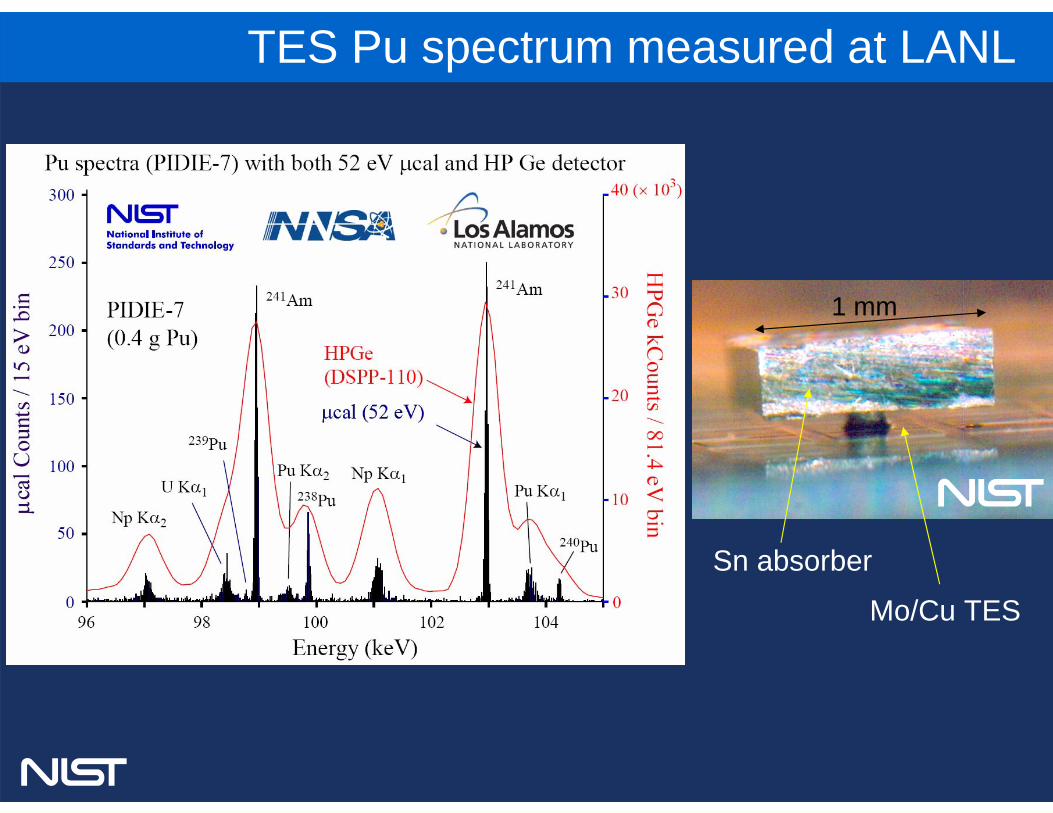
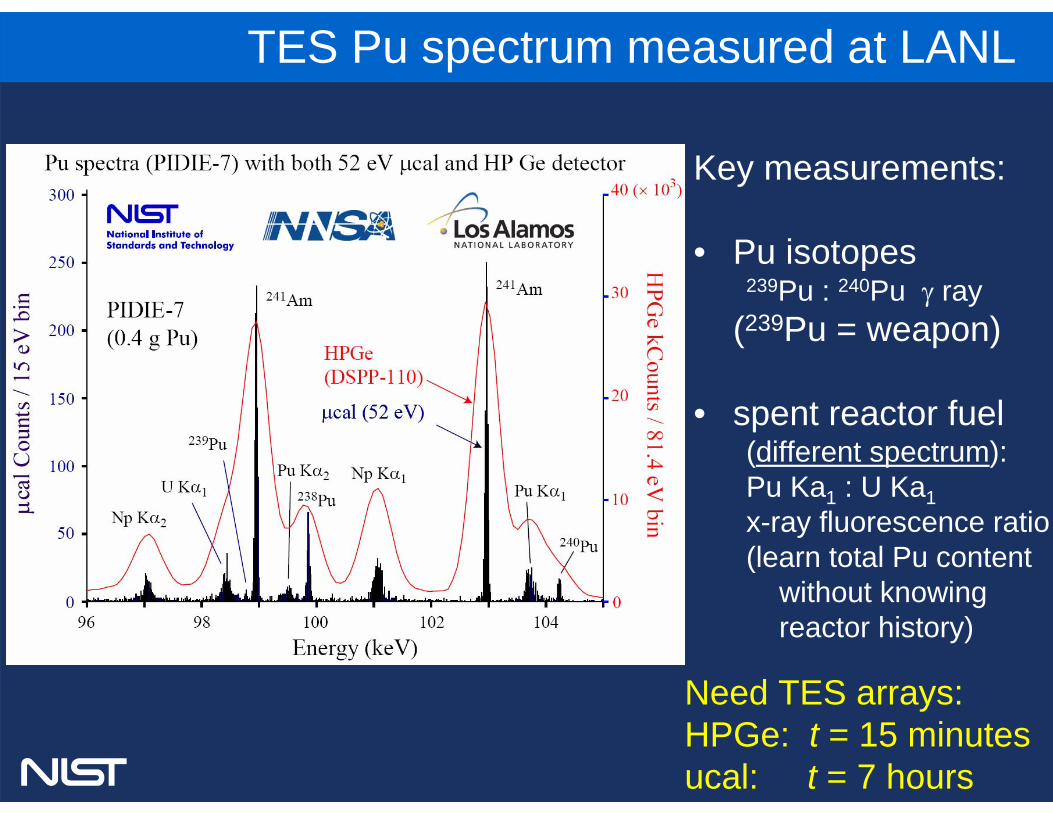
TES Pu spectrum measured at LANL
1 mm
Mo/Cu TES
Sn absorber
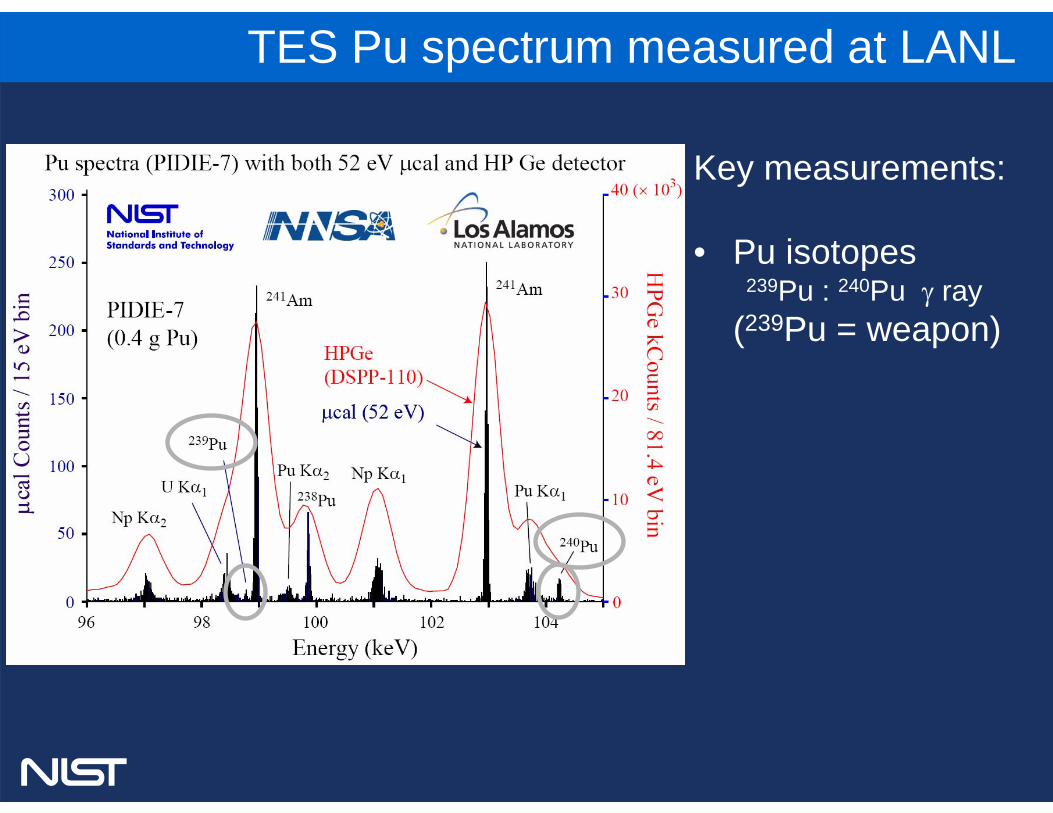
Key measurements:
• Pu isotopes239Pu : 240Pu γ ray
(239Pu = weapon)
TES Pu spectrum measured at LANL
TES Pu spectrum measured at LANL
Key measurements:
• Pu isotopes239Pu : 240Pu γ ray
(239Pu = weapon)
• spent reactor fuel(different spectrum):Pu Ka1 : U Ka1x-ray fluorescence ratio(learn total Pu content
without knowing reactor history)
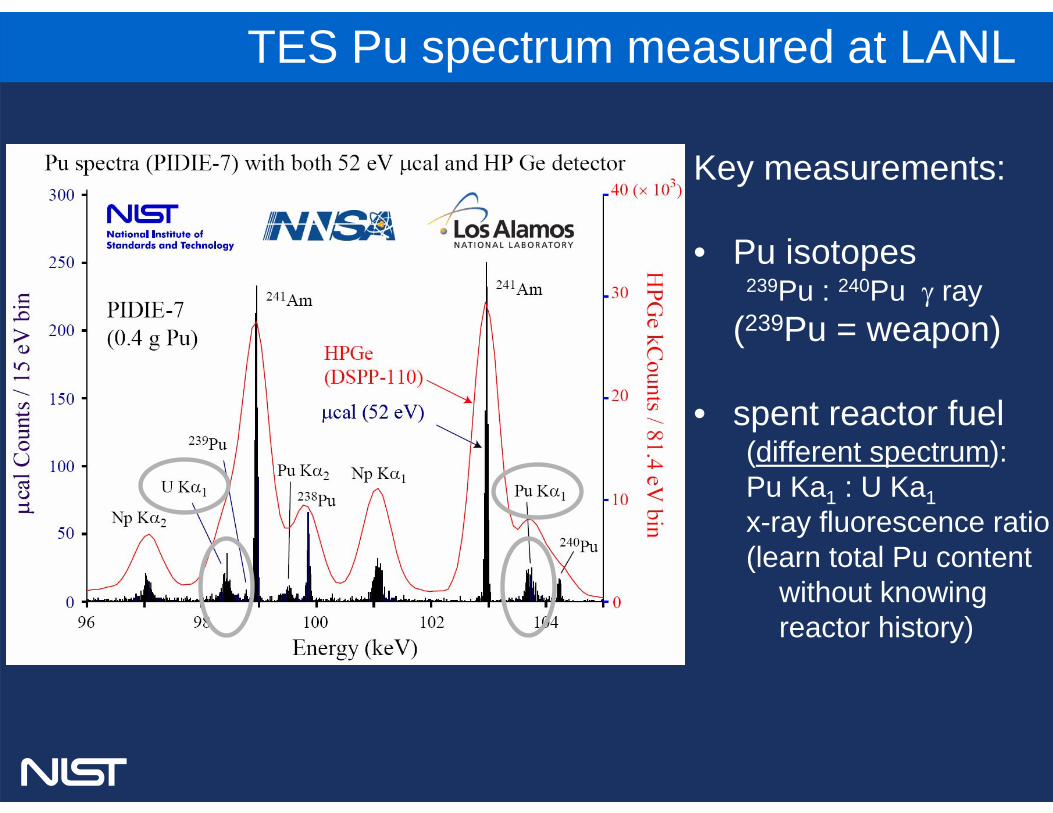
TES Pu spectrum measured at LANL
Key measurements:
• Pu isotopes239Pu : 240Pu γ ray
(239Pu = weapon)
• spent reactor fuel(different spectrum):Pu Ka1 : U Ka1x-ray fluorescence ratio(learn total Pu content
without knowing reactor history)
Need TES arrays:HPGe: t = 15 minutesucal: t = 7 hours
1
2
3
4
5
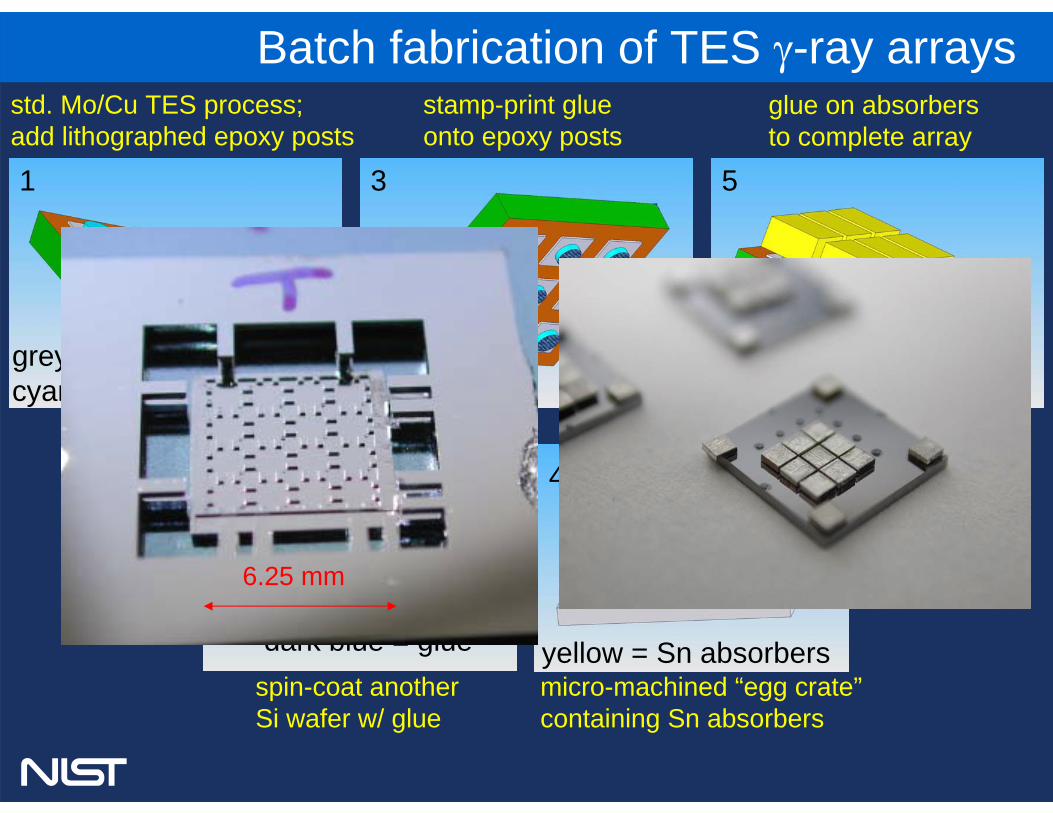
std. Mo/Cu TES process;add lithographed epoxy posts
spin-coat anotherSi wafer w/ glue
stamp-print glueonto epoxy posts
grey = TEScyan = epoxy post
micro-machined “egg crate”containing Sn absorbers
yellow = Sn absorbersdark blue = glue
glue on absorbers to complete array
Batch fabrication of TES γ-ray arrays
6.25 mm
6.25 mm
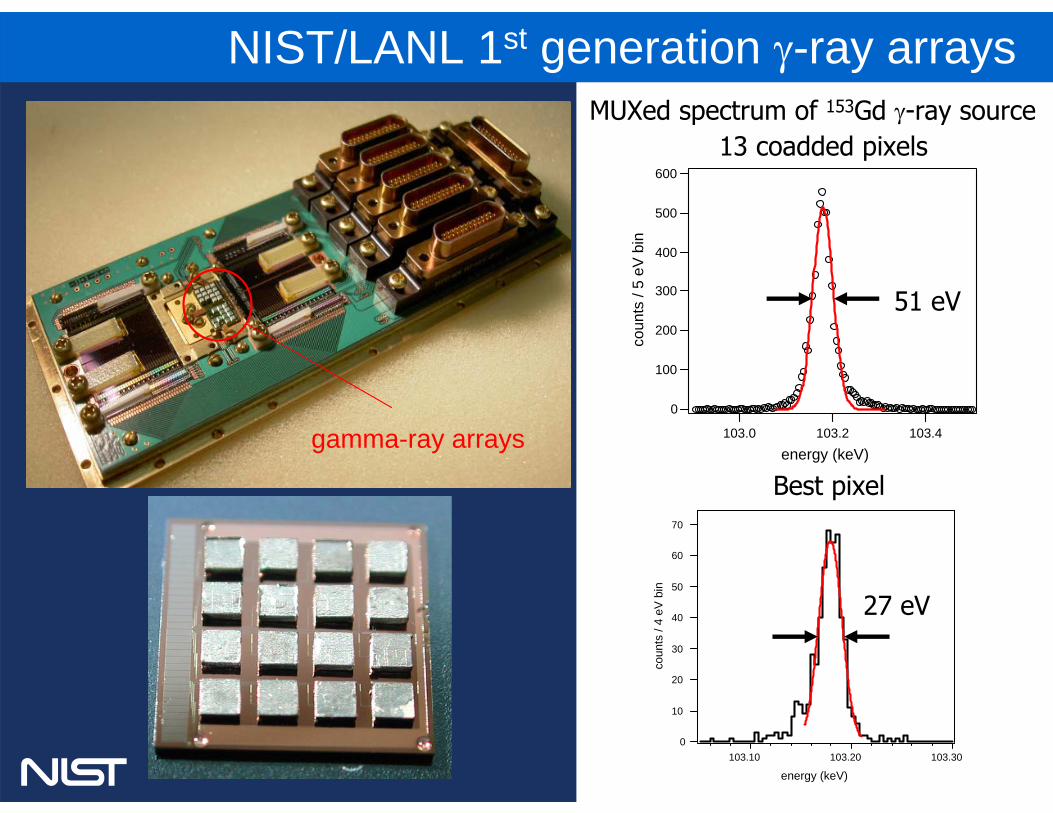
MUXed spectrum of 153Gd γ-ray source
600
500
400
300
200
100
0
coun
ts /
5 eV
bin
103.4103.2103.0
energy (keV)
13 coadded pixels51 eV FWHM at 103 keV
gamma-ray arrays
70
60
50
40
30
20
10
0
coun
ts /
4 eV
bin
103.30103.20103.10
energy (keV)
NIST/LANL 1st generation γ-ray arrays
13 coadded pixels
Best pixel
51 eV
27 eV
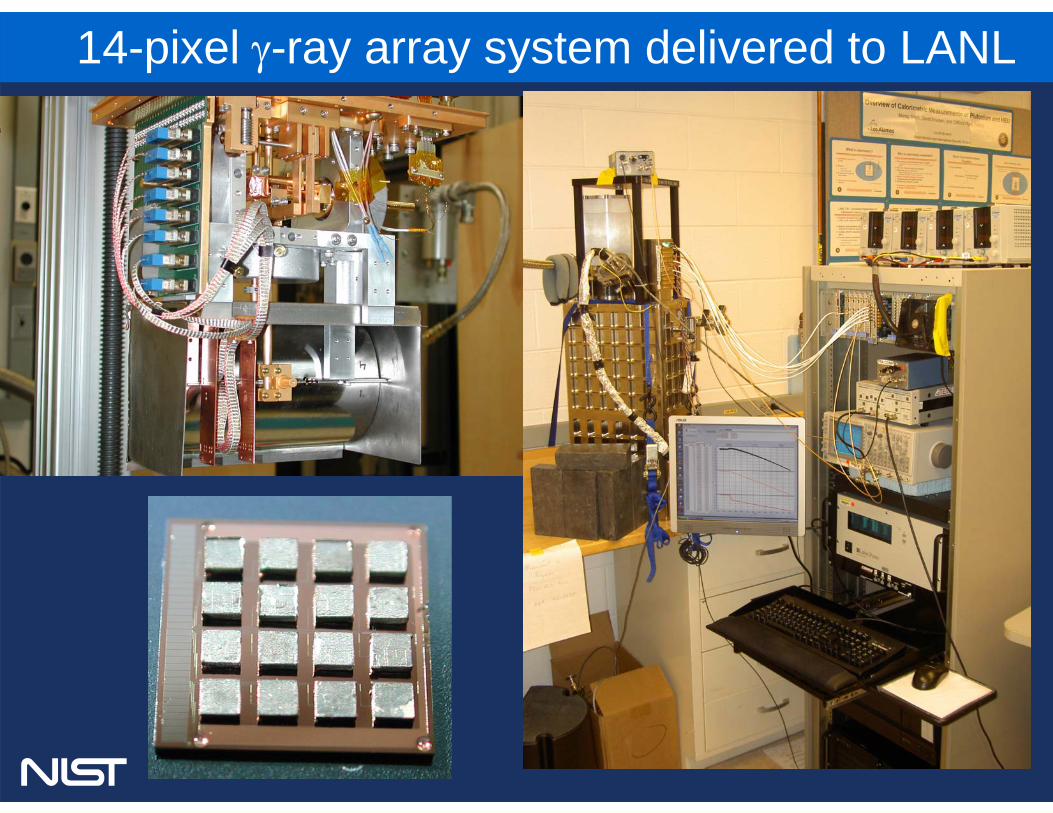
14-pixel γ-ray array system delivered to LANL
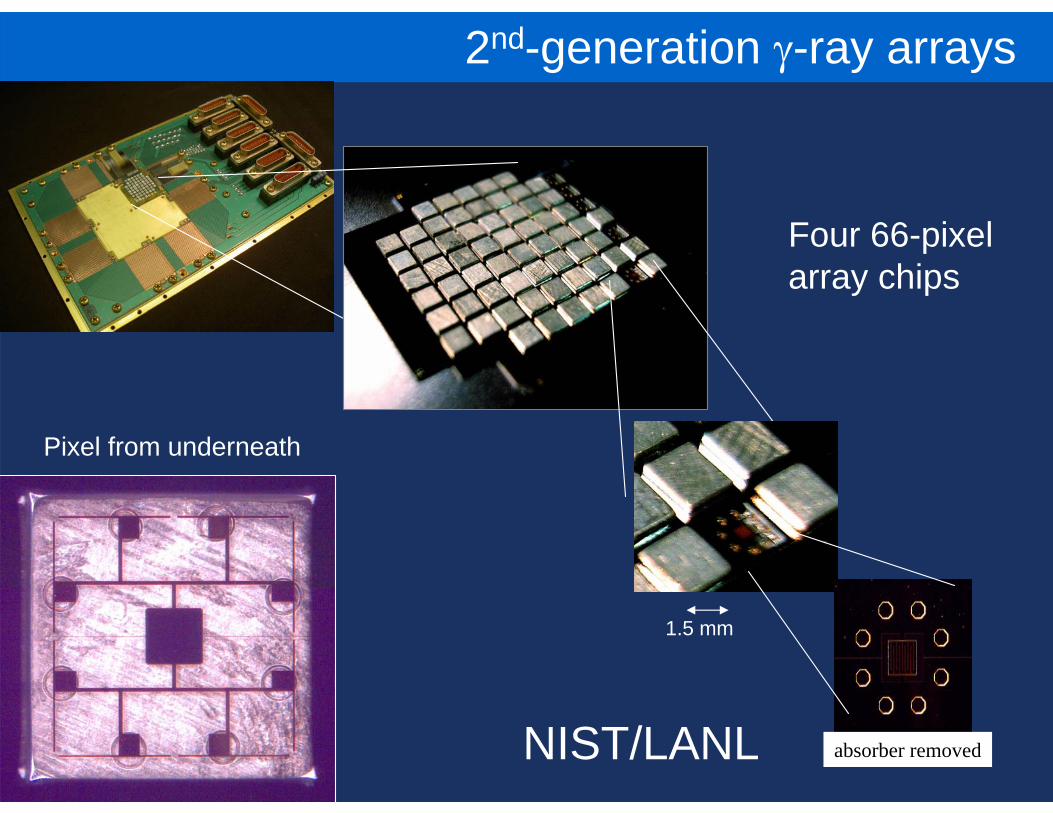
2nd-generation γ-ray arrays
1.5 mm
absorber removedNIST/LANL
Four 66-pixel array chips
Pixel from underneath
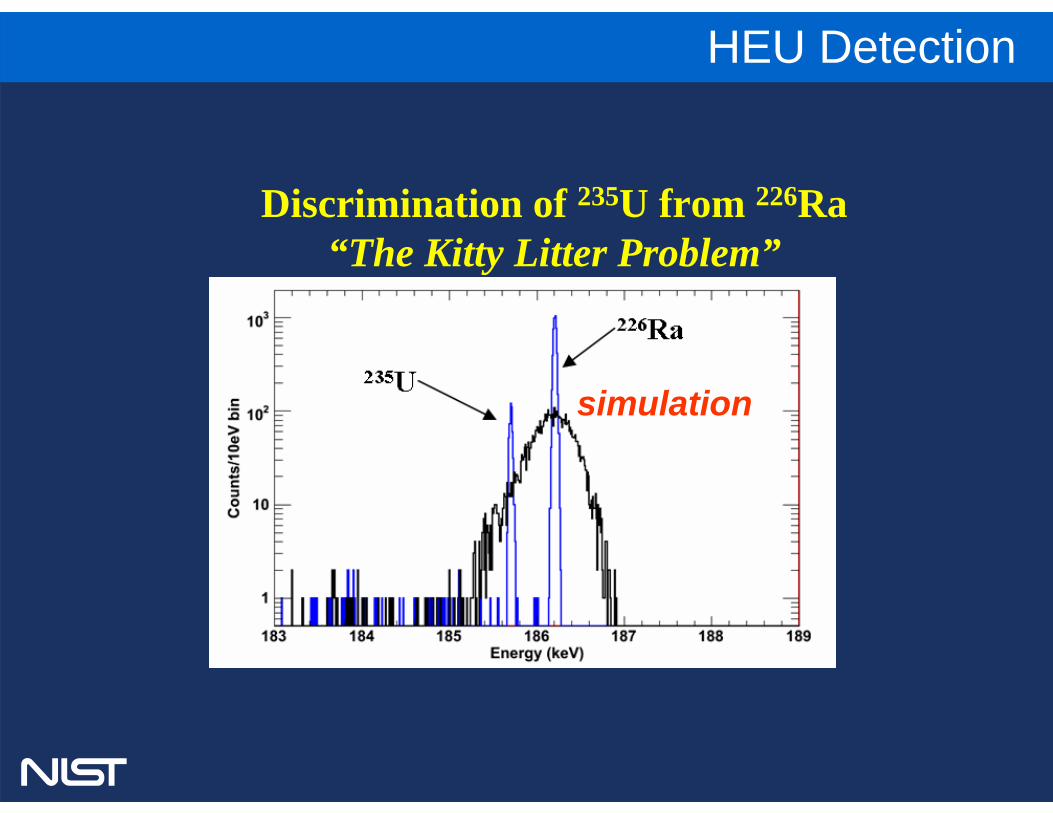
Discrimination of 235U from 226Ra“The Kitty Litter Problem”
HEU Detection
simulation
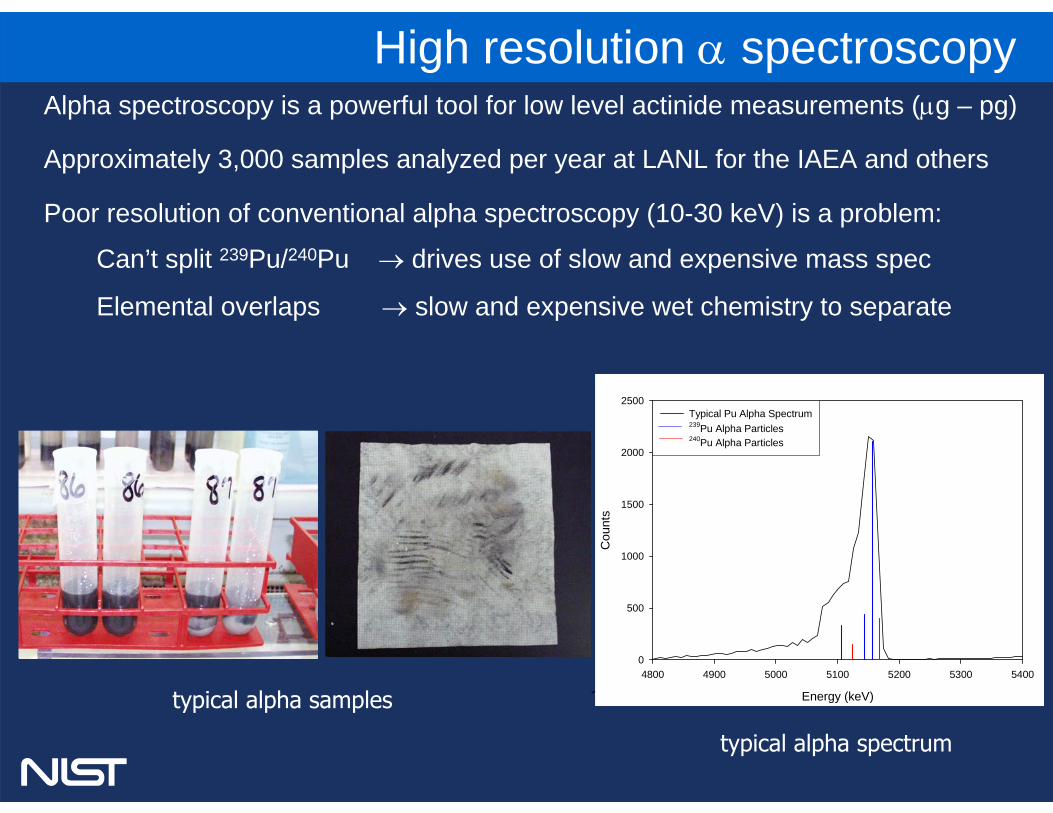
Alpha spectroscopy is a powerful tool for low level actinide measurements (μg – pg)
Approximately 3,000 samples analyzed per year at LANL for the IAEA and others
Poor resolution of conventional alpha spectroscopy (10-30 keV) is a problem:
Can’t split 239Pu/240Pu → drives use of slow and expensive mass spec
Elemental overlaps → slow and expensive wet chemistry to separate
data239Pu240Pu
typical alpha spectrum
typical alpha samples Energy (keV)
4800 4900 5000 5100 5200 5300 5400
Cou
nts
0
500
1000
1500
2000
2500Typical Pu Alpha Spectrum239Pu Alpha Particles240Pu Alpha Particles
High resolution α spectroscopy
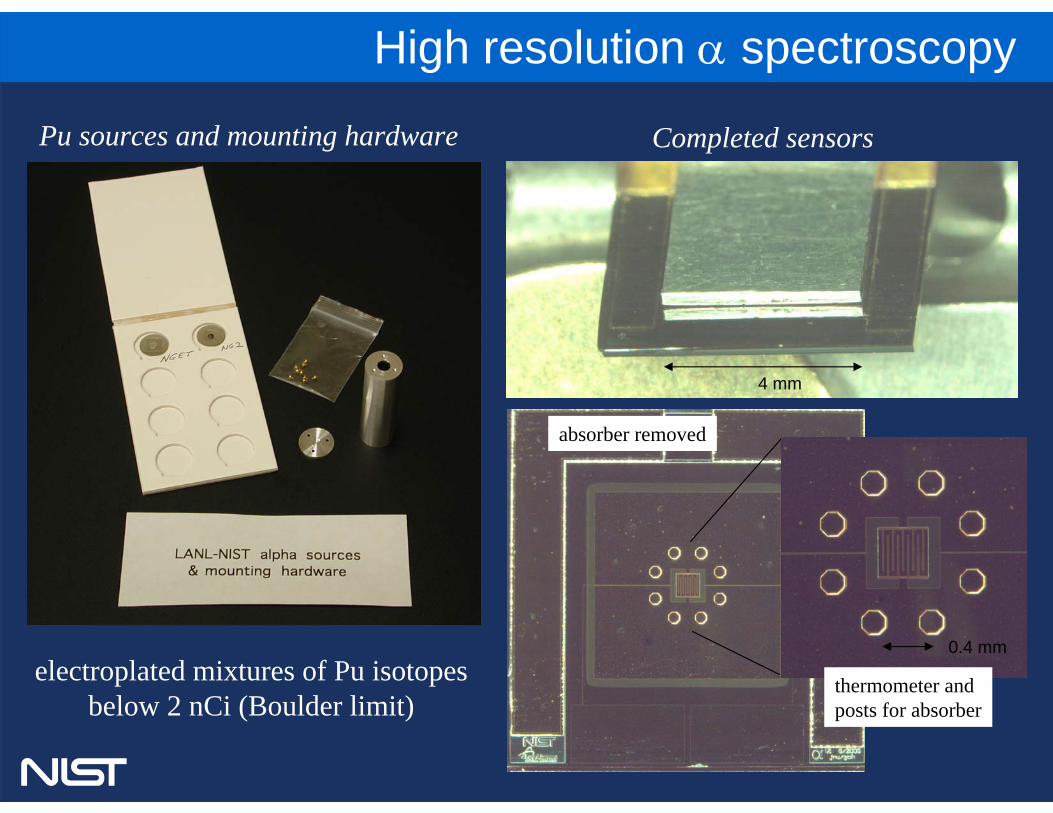
Pu sources and mounting hardware
electroplated mixtures of Pu isotopesbelow 2 nCi (Boulder limit)
Completed sensors
4 mm
thermometer andposts for absorber
0.4 mm
absorber removed
High resolution α spectroscopy
300
250
200
150
100
50
0
counts
/ 2
50 e
V b
in
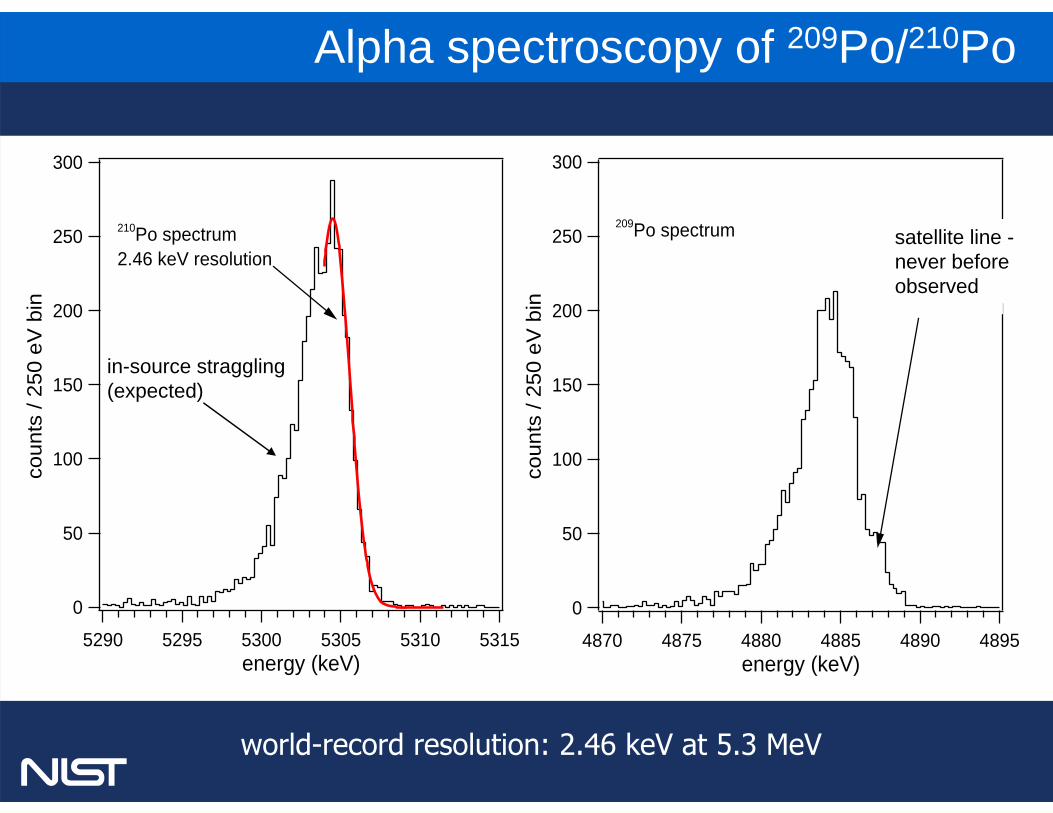
489548904885488048754870energy (keV)
unknown high Eshoulder
209Po spectrum
300
250
200
150
100
50
0
counts
/ 2
50 e
V b
in
531553105305530052955290energy (keV)
2.46 keV resolution
210Po spectrum
in-source straggling (expected)
world-record resolution: 2.46 keV at 5.3 MeV
satellite line -never beforeobserved
Alpha spectroscopy of 209Po/210Po
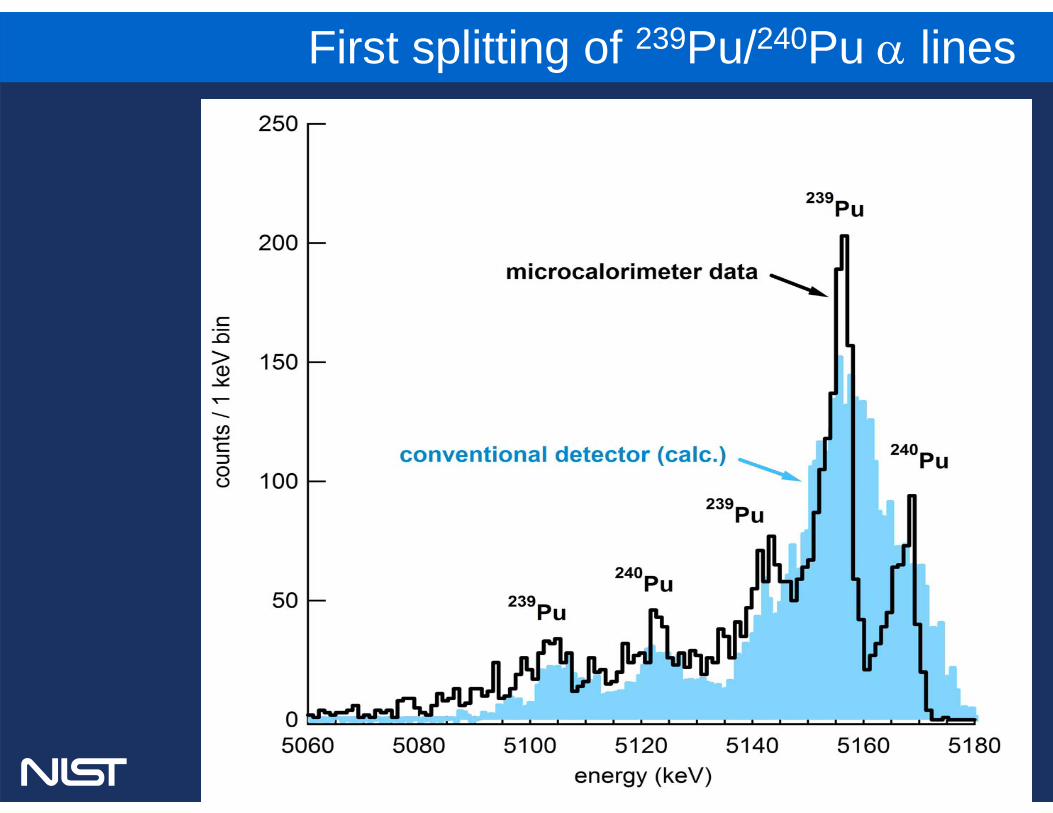
First splitting of 239Pu/240Pu α lines
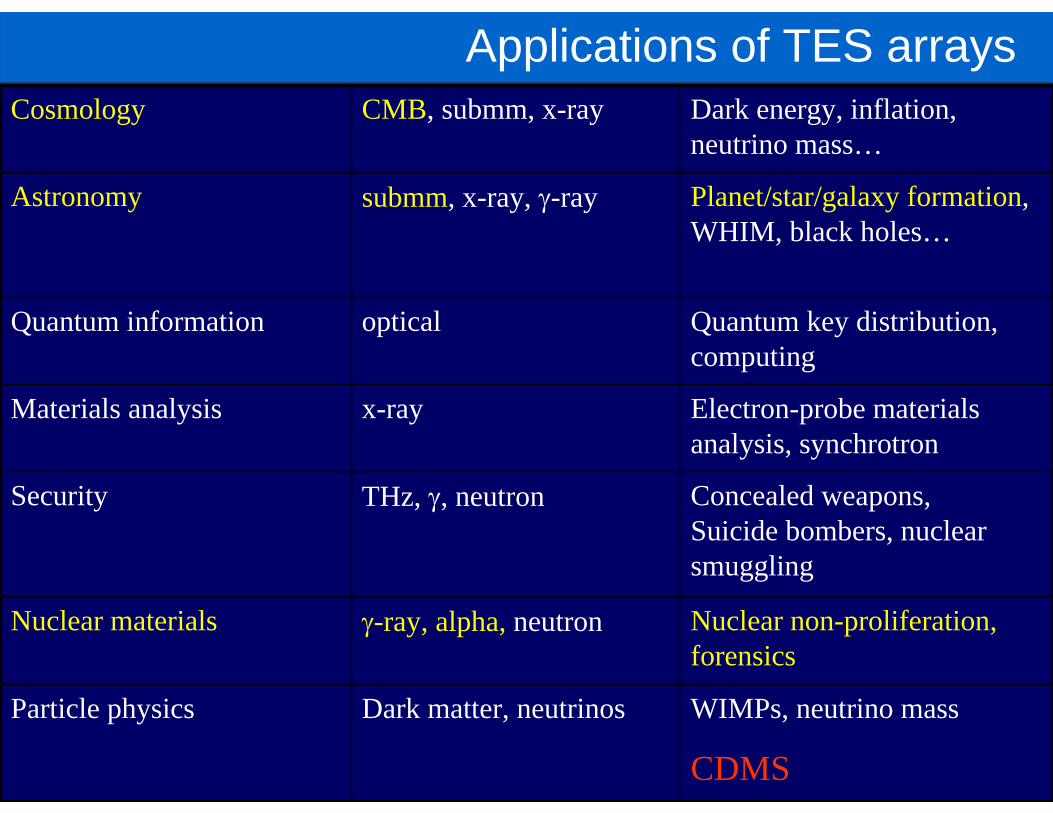
Applications of TES arrays
WIMPs, neutrino mass
CDMS
Dark matter, neutrinosParticle physics
Nuclear non-proliferation, forensics
γ-ray, alpha, neutronNuclear materials
Concealed weapons, Suicide bombers, nuclear smuggling
THz, γ, neutronSecurity
Electron-probe materials analysis, synchrotron
x-rayMaterials analysis
Quantum key distribution, computing
opticalQuantum information
Planet/star/galaxy formation, WHIM, black holes…
submm, x-ray, γ-rayAstronomy
Dark energy, inflation, neutrino mass…
CMB, submm, x-rayCosmology
detector filter SQUID
pixel variety #1
pixel feedline
resonator
coupling T
resonator
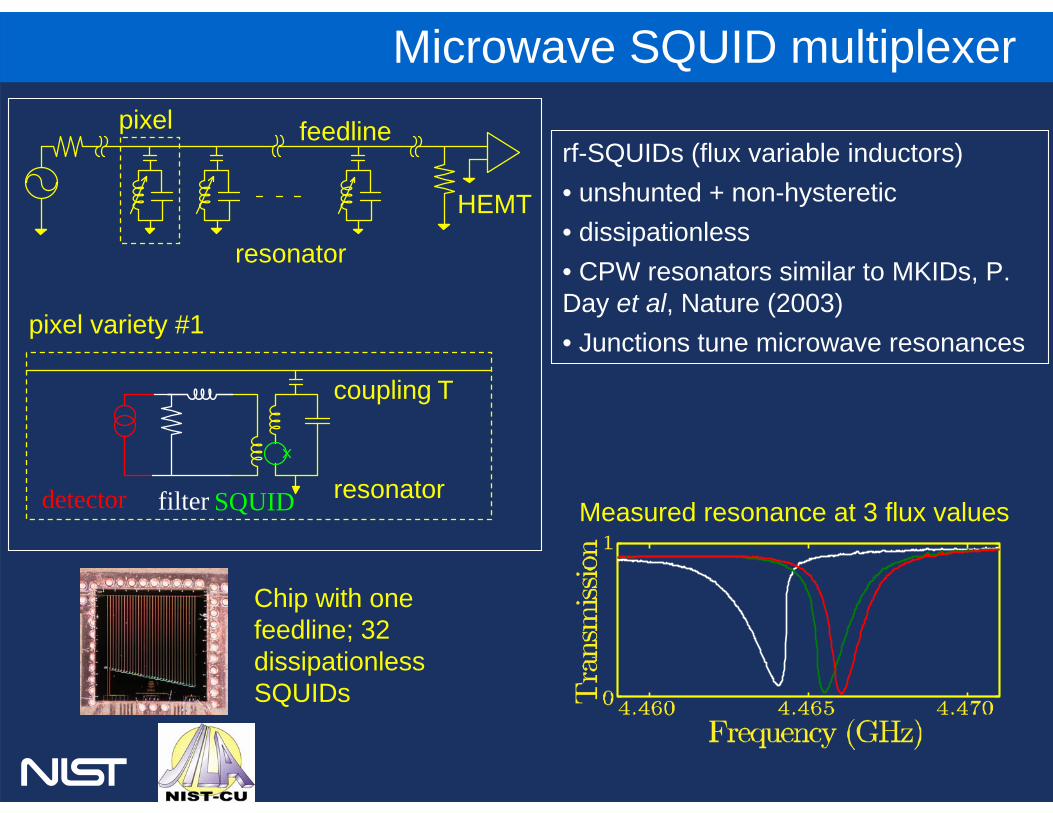
Microwave SQUID multiplexer
rf-SQUIDs (flux variable inductors)• unshunted + non-hysteretic• dissipationless• CPW resonators similar to MKIDs, P. Day et al, Nature (2003)• Junctions tune microwave resonances
Chip with one feedline; 32 dissipationlessSQUIDs
HEMT
Measured resonance at 3 flux values
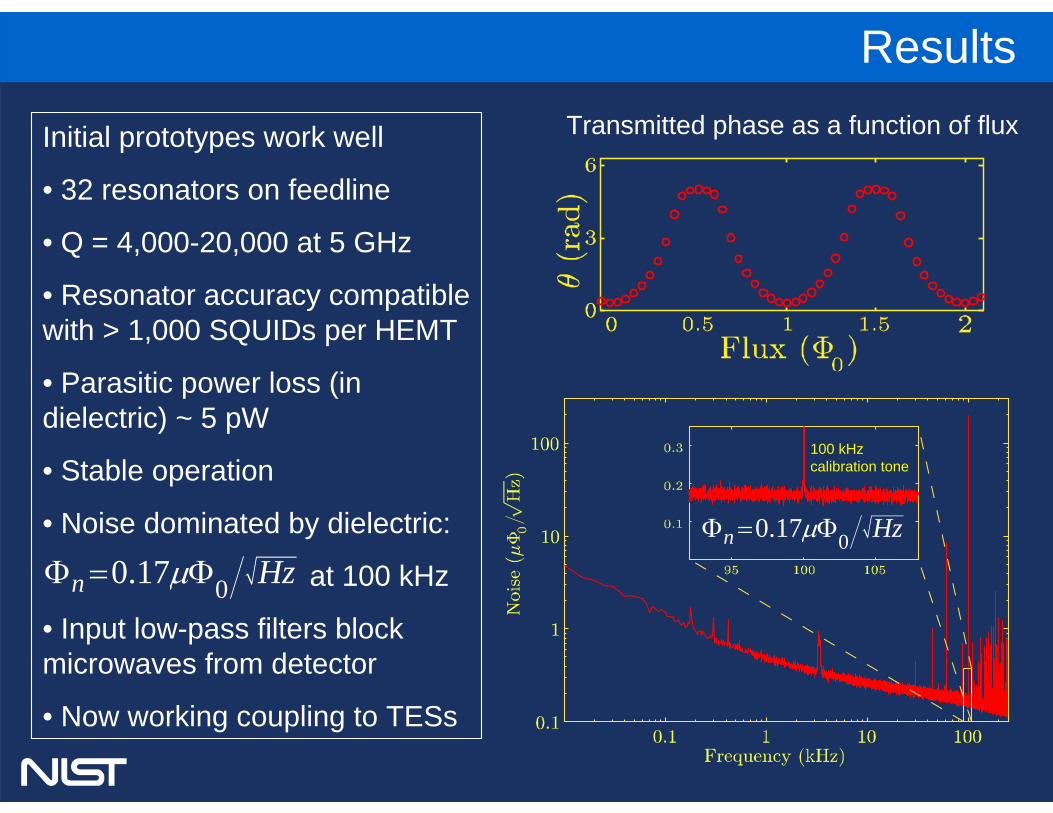
ResultsTransmitted phase as a function of fluxInitial prototypes work well
• 32 resonators on feedline
• Q = 4,000-20,000 at 5 GHz
• Resonator accuracy compatible with > 1,000 SQUIDs per HEMT
• Parasitic power loss (in dielectric) ~ 5 pW
• Stable operation
• Noise dominated by dielectric:
at 100 kHz
• Input low-pass filters block microwaves from detector
• Now working coupling to TESs
00.17n HzμΦ = Φ00.17n HzμΦ = Φ
100 kHz calibration tone
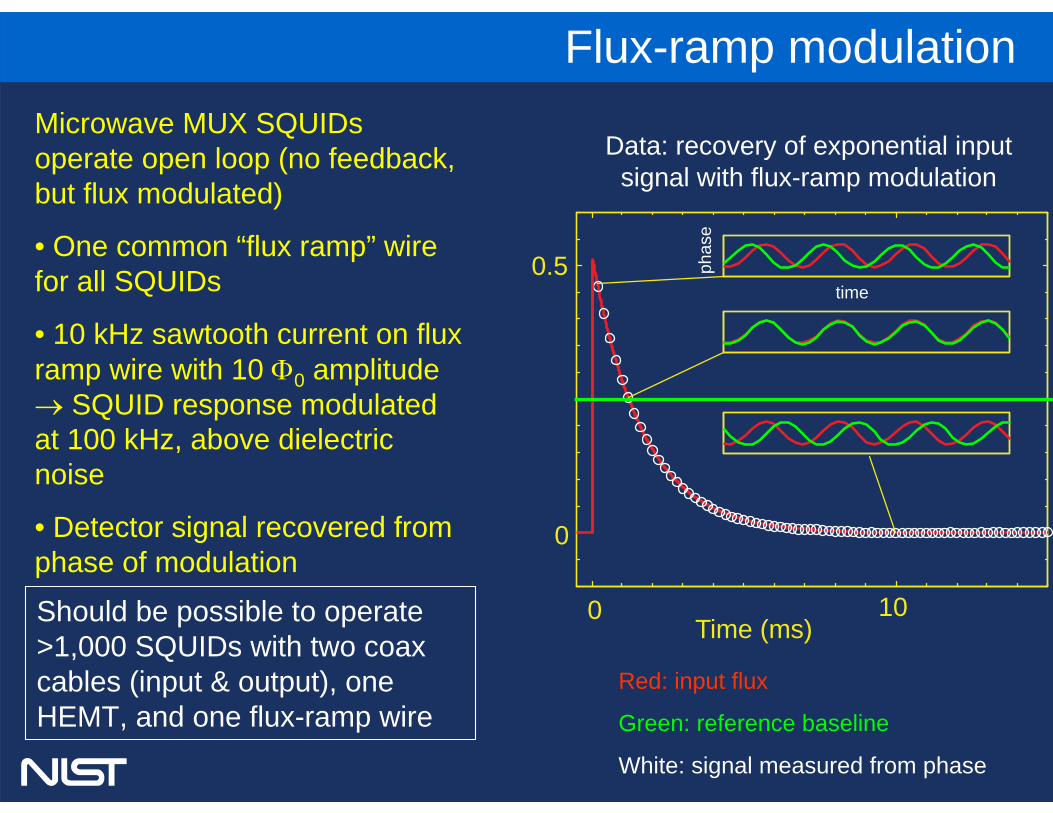
Flux-ramp modulationMicrowave MUX SQUIDsoperate open loop (no feedback, but flux modulated)
• One common “flux ramp” wire for all SQUIDs
• 10 kHz sawtooth current on flux ramp wire with 10 Φ0 amplitude → SQUID response modulated at 100 kHz, above dielectric noise
• Detector signal recovered from phase of modulation
Should be possible to operate >1,000 SQUIDs with two coax cables (input & output), one HEMT, and one flux-ramp wire
Data: recovery of exponential input signal with flux-ramp modulation
Red: input flux
Green: reference baseline
White: signal measured from phase
time
phas
e
Time (ms)0 10
0
0.5
Input and Recovered Flux (
Φ
0
)

Applications of TES arrays
WIMPs, neutrino mass
CDMS
Dark matter, neutrinosParticle physics
Nuclear non-proliferation, forensics
γ-ray, alpha, neutronNuclear materials
Concealed weapons, Suicide bombers, nuclear smuggling
THz, γ, neutronSecurity
Electron-probe materials analysis, synchrotron
x-rayMaterials analysis
Quantum key distribution, computing
opticalQuantum information
Planet/star/galaxy formation, WHIM, black holes…
submm, x-ray, γ-rayAstronomy
Dark energy, inflation, neutrino mass…
CMB, submm, x-rayCosmology
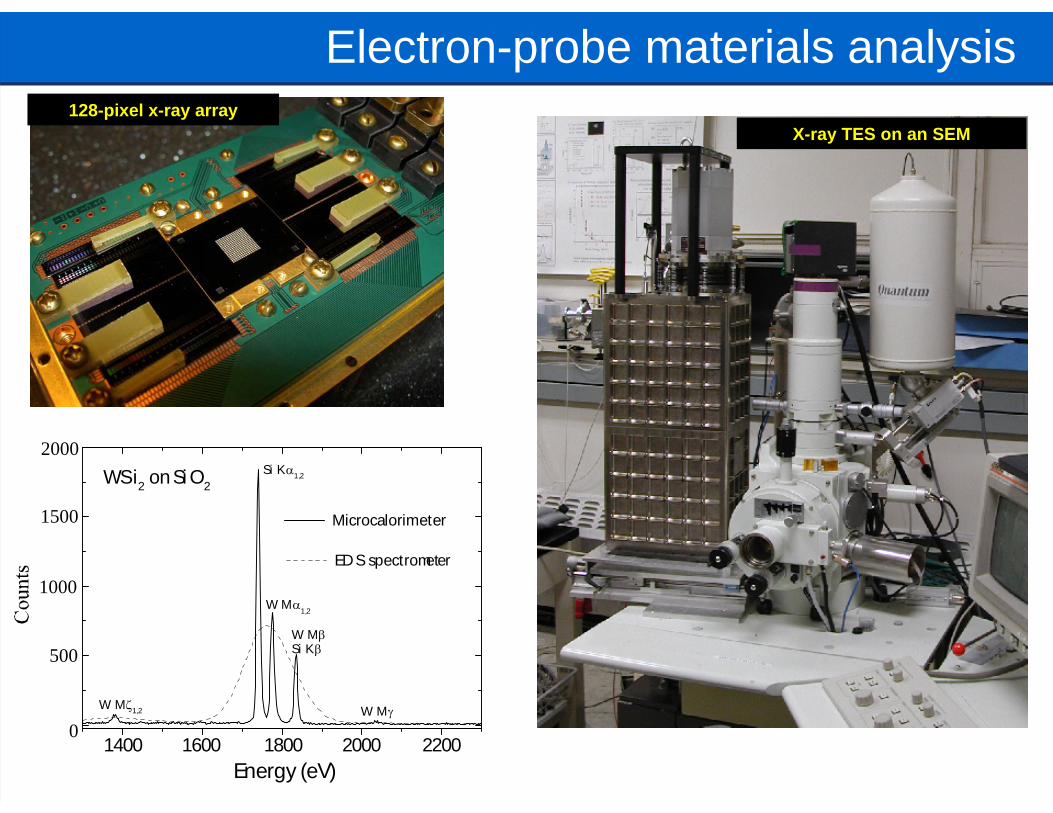
Electron-probe materials analysis128-pixel x-ray array
X-ray TES on an SEM
Microcalorimeter
Energy (eV)
W MγW Mζ1,2
Si KβW Mβ
W Mα1,2
WSi2 on Si O2Si Kα1,2
EDS spectrometer
1400 1600 1800 220020000
500
1000
1500
2000
1700 1725 1750 17750
400
800
1200
1600
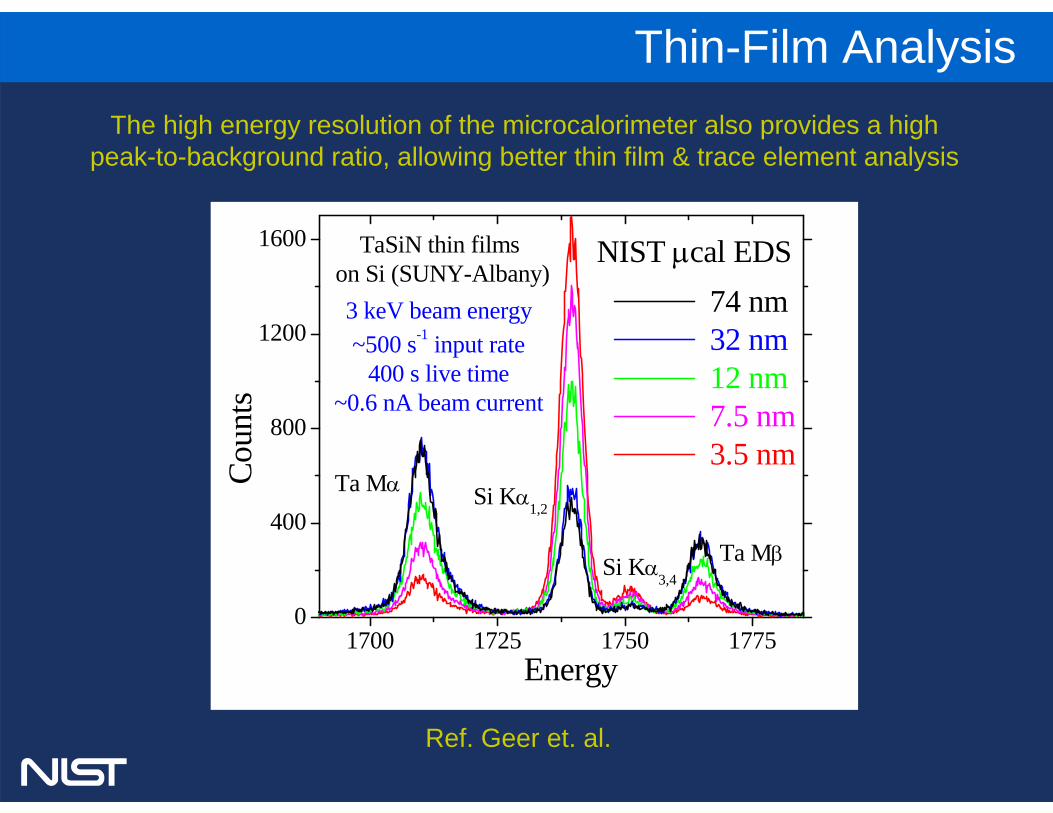
Si Kα3,4Ta Mβ
Si Kα1,2Ta Mα
3 keV beam energy~500 s-1 input rate
400 s live time~0.6 nA beam current
TaSiN thin films on Si (SUNY-Albany)
NIST μcal EDS 74 nm 32 nm 12 nm 7.5 nm 3.5 nmCo
unts
Energy
Thin-Film Analysis
Ref. Geer et. al.
The high energy resolution of the microcalorimeter also provides a high peak-to-background ratio, allowing better thin film & trace element analysis
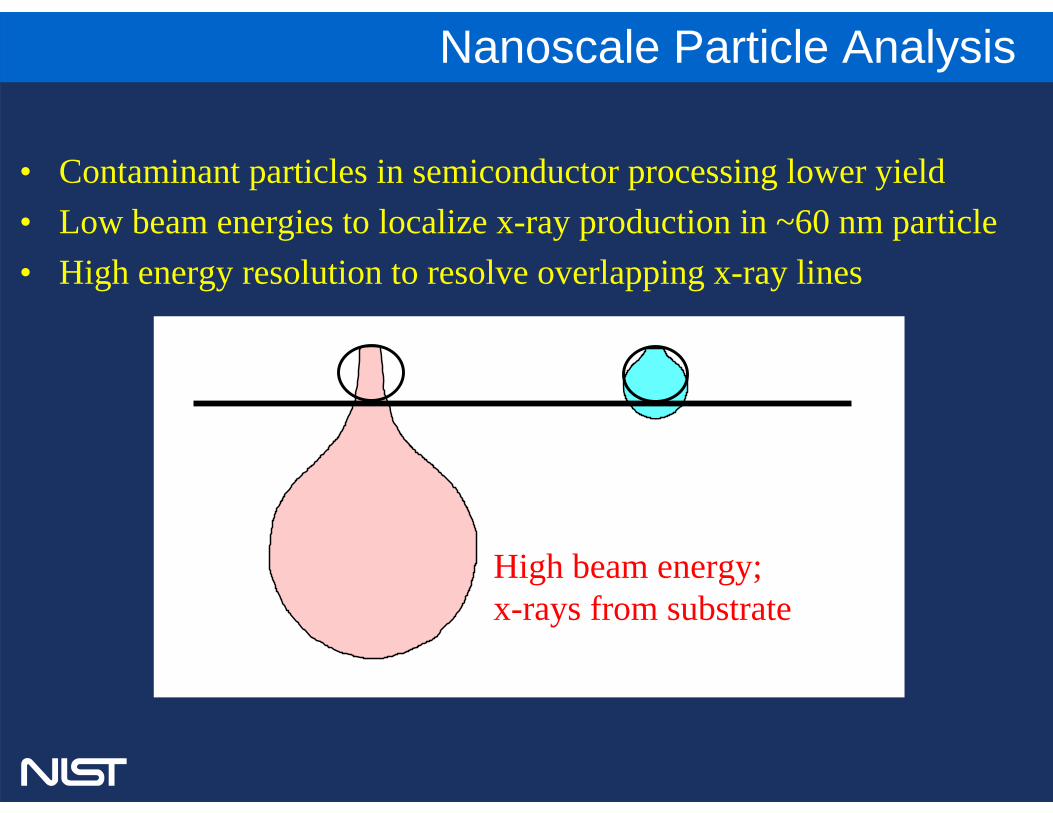
• Contaminant particles in semiconductor processing lower yield• Low beam energies to localize x-ray production in ~60 nm particle • High energy resolution to resolve overlapping x-ray lines
Low beam energy; x-rays from particle
High beam energy; x-rays from substrate
Nanoscale Particle Analysis
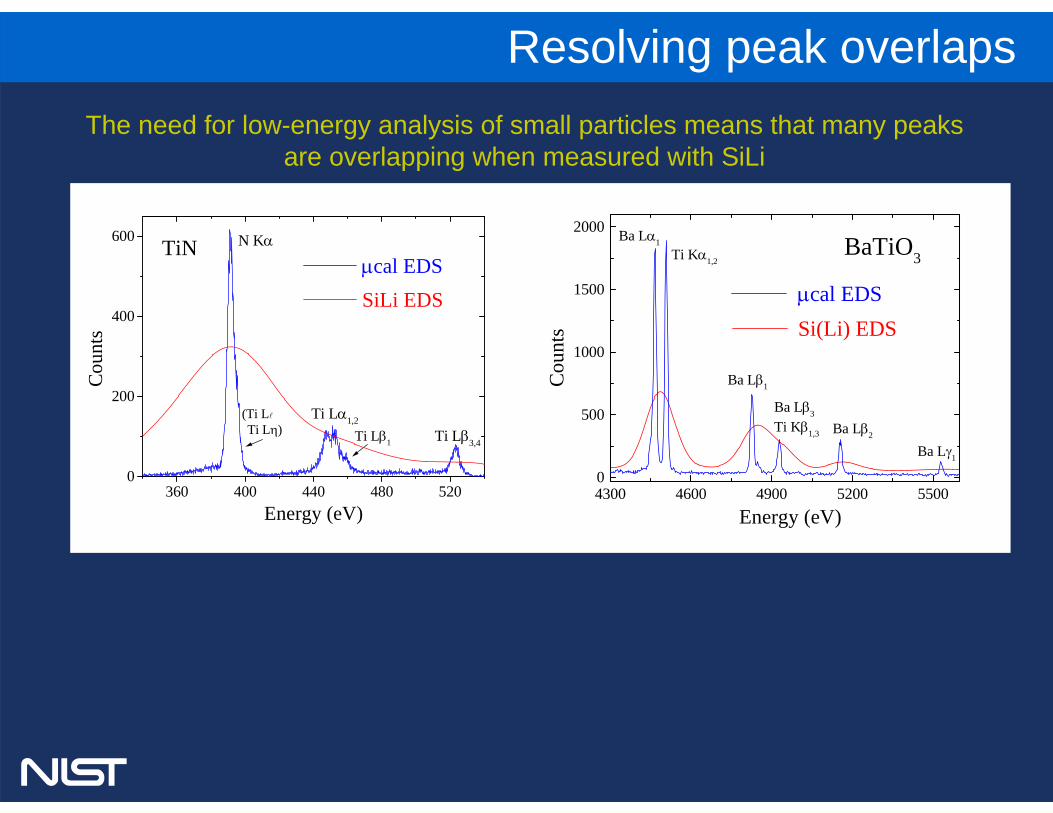
Si(Li) EDS
Cou
nts
Energy (eV)4300 4600 4900 5200 55000
500
1000
1500
2000
Ba Lγ1
Ba Lβ2
Ba Lβ3
Ti Kβ1,3
Ba Lβ1
Ti Kα1,2
Ba Lα1 BaTiO3
μcal EDS
360 400 440 480 5200
200
400
600
μcal EDSTiN
Ti Lβ3,4Ti Lβ1
Ti Lα1,2Ti Lη)
(Ti L
N Kα
Cou
nts
Energy (eV)
SiLi EDS
Resolving peak overlapsThe need for low-energy analysis of small particles means that many peaks
are overlapping when measured with SiLi
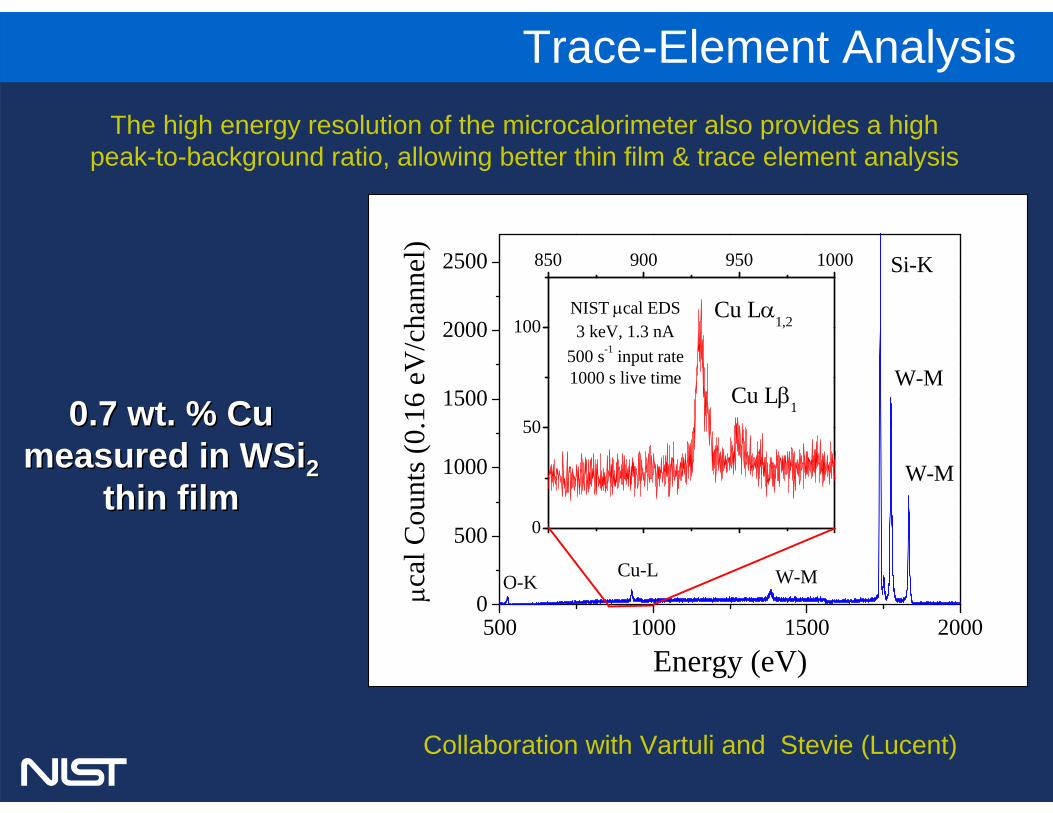
0.7 wt. % Cu 0.7 wt. % Cu measured in WSimeasured in WSi22
thin filmthin film
500 1000 1500 20000
500
1000
1500
2000
2500
0
50
100
850 900 950 1000
Cu-LO-K W-M
W-M
W-M
Si-K
μcal
Cou
nts (
0.16
eV
/cha
nnel
)
Energy (eV)
Cu Lβ1
NIST μcal EDS3 keV, 1.3 nA
500 s-1 input rate1000 s live time
Cu Lα1,2
Trace-Element Analysis
Collaboration with Vartuli and Stevie (Lucent)
The high energy resolution of the microcalorimeter also provides a high peak-to-background ratio, allowing better thin film & trace element analysis
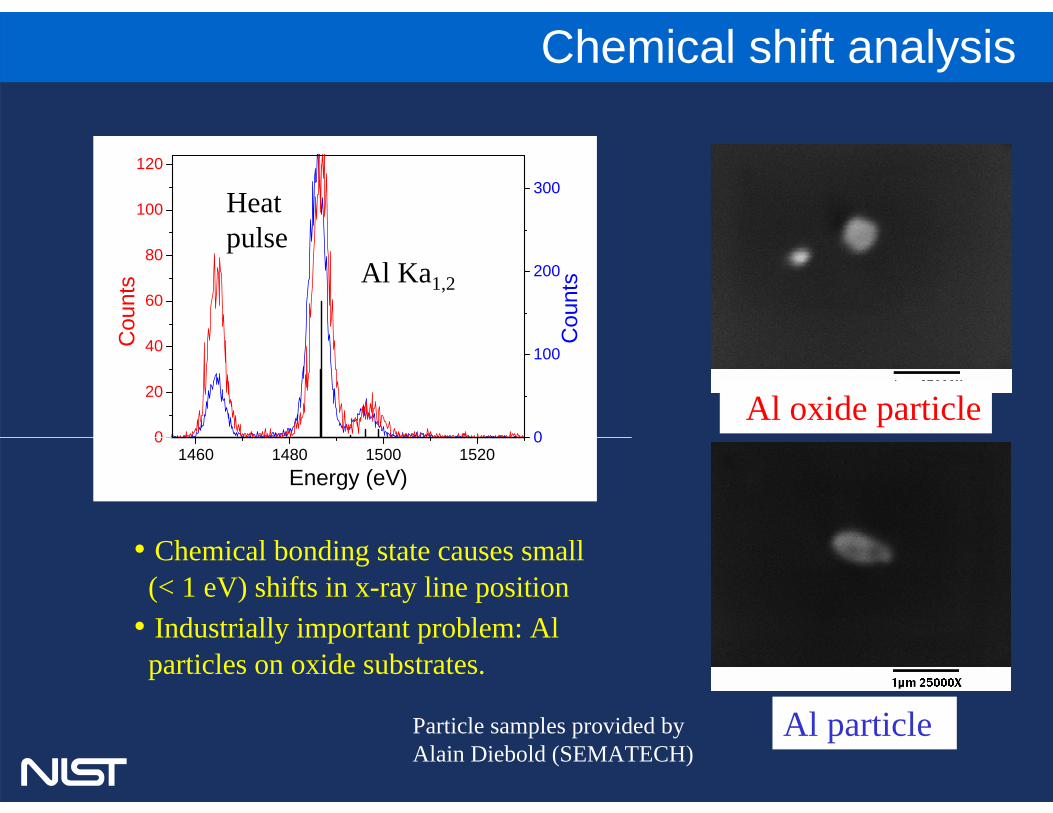
Al Ka1,2
Al oxide particle1460 1480 1500 1520
0
20
40
60
80
100
120
0
100
200
300
Cou
nts
Cou
nts
Energy (eV)
Heatpulse
Al particle
• Chemical bonding state causes small(< 1 eV) shifts in x-ray line position
• Industrially important problem: Alparticles on oxide substrates.
Particle samples provided by Alain Diebold (SEMATECH)
Chemical shift analysis
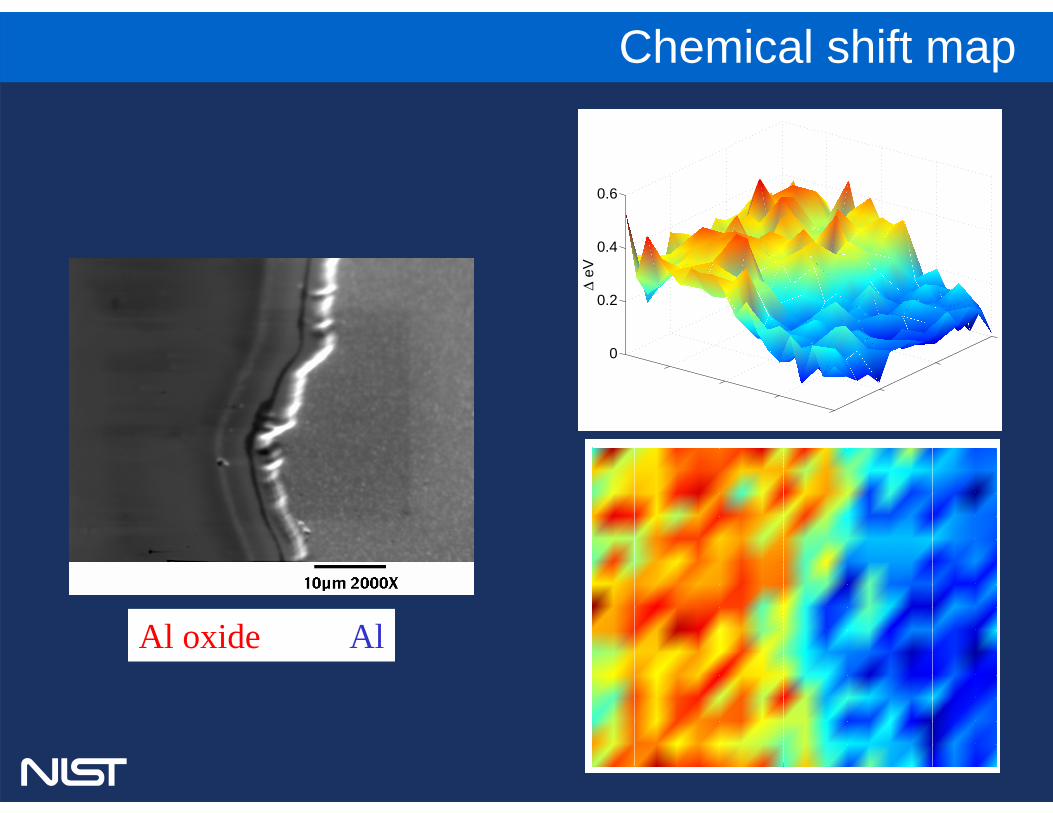
0
0.2
0.4
0.6
Δ eV
Al oxide Al
Chemical shift map