Isoform-Specific Effects of Charged Residues at Borders of the M1−M2 Loop of the Na,K-ATPase α...
12
Isoform-Specific Effects of Charged Residues at Borders of the M1-M2 Loop of the Na,K-ATPase R Subunit ² Maddalena V. Coppi,* ,‡ Leigh A. Compton, § and Guido Guidotti | Department of Microbiology, UniVersity of Massachusetts, Amherst, Massachusetts 01003, Centenary College of Louisiana, 2911 Centenary BouleVard, ShreVeport, Louisiana 71134, and Department of Molecular and Cellular Biology, HarVard UniVersity, 7 DiVinity AVenue, Cambridge, Massachusetts 02138 ReceiVed September 10, 1998; ReVised Manuscript ReceiVed December 11, 1998 ABSTRACT: The Na,K-ATPase is specifically inhibited by the cardiac glycoside, ouabain. Via a largely undefined mechanism, the ouabain affinity of the Na,K-ATPase can be manipulated by mutating the residues at the borders of the first extracellular (M1-M2) loop of the R subunit [Price, E. M., Rice, D. A., and Lingrel, J. B. (1990) J. Biol. Chem. 265, 6638-6641]. To address this issue, we compared the effects of two combinations of charged residues at the M1-M2 loop border, R113,D124 and D113,R124 (numbered according to the rat R1 subunit), on the ouabain sensitivity of the R1 and R2 isoforms. We report that ouabain sensitivity is dependent not only upon the identity of the residues at the M1-M2 loop border but also upon the context into which they are introduced. Furthermore, at low concentrations of ATP, the identity of the residues at the M1-M2 loop border affects the regulation of ATP hydrolysis by potassium in an isoform-specific manner. Analysis of chimeric R subunits reveals that the effects of potassium are determined primarily by the interaction of the N-terminus and M1-M2 loop with the C-terminal third of the R subunit. M1-M2 loop border residues may, therefore, influence ouabain sensitivity indirectly by altering the stability or structure of the intermediate of the Na,K-ATPase catalytic cycle which is competent to bind ouabain. The Na,K-ATPase 1 both maintains and establishes the electrochemical gradients present across the plasma mem- brane of mammalian cells by catalyzing the ATP-dependent transport of sodium and potassium ions (1). It is an oligomeric integral membrane protein consisting of two major subunits, R and , of which there are several isoforms, and a third small proteolipid γ subunit (2). The 100 kDa R subunit comprises 10 putative membrane-spanning segments, M1-M10, and a large intracellular loop containing the nucleotide binding site and catalytic aspartyl residue. The 40-60 kDa subunit consists of a short cytoplasmic strand, a single membrane-spanning segment, and a glycosylated extracellular domain (1). The cation occlusion site of the Na,K-ATPase is thought to be formed by multiple residues located in the membrane-spanning segments of the R and subunits (3). The ∼6.5 kDa γ subunit has been shown to play a role in modulating K + activation of the Na,K-ATPase (2). During catalysis, the Na,K-ATPase alternates between two distinct conformational states, E1 and E2. Interconver- sion between E1 and E2 is intimately linked both to nucleotide binding and hydrolysis and to cation binding and occlusion (4). These conformational states can be distin- guished by their dissimilar affinities for phosphate, nucle- otides, and the specific inhibitor of the Na,K-ATPase, ouabain (4). Ouabain is thought to inhibit the Na,K-ATPase by binding the extracellular and intramembrane surfaces of the enzyme when it is in the E2 conformation, thereby preventing regeneration of the E1 conformation and catalysis (1, 4). The sensitivity of the Na,K-ATPase to inhibition by ouabain appears to be determined exclusively by the identity of the R subunit (1). Naturally occurring R subunits yield Na,K- ATPase molecules which vary dramatically in ouabain sensitivity, with K i ’s ranging from 1 × 10 -7 M [sheep R1 (5), rat R2(6), and rat R3(6)] to 1 × 10 -4 M ouabain [rat R1(7)]. One strategy used to identify the amino acids involved in the interaction between ouabain and the R subunit is to mutagenize ouabain-sensitive R1 subunits (K i in the 1 × 10 -7 M range) and then to screen mutants for their ability to confer ouabain resistance upon ouabain-sensitive cell lines (7). Using this approach, 16 residues scattered throughout the extracellular surface and membrane-spanning segments ² This work was carried out at the Department of Molecular Biology, Harvard University (7 Divinity Ave., Cambridge, MA 02138), and supported by Grants DK27626 and HL08893 from the NIH. M.V.C. was partially funded by NIH Training Grant GM07598. L.A.C. was the recipient of a Howard Hughes Medical Institute Summer Research Internship at Harvard University. * To whom correspondence should be addressed: Department of Microbiology, University of Massachusetts, 203 N Morrill 4N, Amherst, MA 01003. Phone: (413) 545-9647. Fax: (413) 545-1578. E-mail: [email protected]. ‡ University of Massachusetts. § Centenary College of Louisiana. | Harvard University. 1 Abbreviations: Na,K-ATPase, sodium-potassium adenosine triphos- phatase; M1-M2 loop, extracellular loop connecting the first and second membrane-spanning segments of the Na,K-ATPase R subunit; SE, standard error; SD, standard deviation; Tris, tris(hydroxymethyl)- aminoethane; Tris-ATP, ATP buffered with Tris; bp, base pair; PCR, polymerase chain reaction; P i, inorganic phosphate; Ki, concentration of inhibitor at which 50% of the Na,K-ATPase activity is inhibited; Vmax, maximal enzymatic activity; N-terminus, amino terminus; C- terminus, carboxyl terminus. 2494 Biochemistry 1999, 38, 2494-2505 10.1021/bi982180j CCC: $18.00 © 1999 American Chemical Society Published on Web 02/05/1999
Transcript of Isoform-Specific Effects of Charged Residues at Borders of the M1−M2 Loop of the Na,K-ATPase α...

Isoform-Specific Effects of Charged Residues at Borders of the M1-M2 Loop ofthe Na,K-ATPaseR Subunit†
Maddalena V. Coppi,*,‡ Leigh A. Compton,§ and Guido Guidotti|
Department of Microbiology, UniVersity of Massachusetts, Amherst, Massachusetts 01003, Centenary College of Louisiana,2911 Centenary BouleVard, ShreVeport, Louisiana 71134, and Department of Molecular and Cellular Biology,
HarVard UniVersity, 7 DiVinity AVenue, Cambridge, Massachusetts 02138
ReceiVed September 10, 1998; ReVised Manuscript ReceiVed December 11, 1998
ABSTRACT: The Na,K-ATPase is specifically inhibited by the cardiac glycoside, ouabain. Via a largelyundefined mechanism, the ouabain affinity of the Na,K-ATPase can be manipulated by mutating the residuesat the borders of the first extracellular (M1-M2) loop of theR subunit [Price, E. M., Rice, D. A., andLingrel, J. B. (1990)J. Biol. Chem. 265, 6638-6641]. To address this issue, we compared the effects oftwo combinations of charged residues at the M1-M2 loop border, R113,D124 and D113,R124 (numberedaccording to the ratR1 subunit), on the ouabain sensitivity of theR1 andR2 isoforms. We report thatouabain sensitivity is dependent not only upon the identity of the residues at the M1-M2 loop border butalso upon the context into which they are introduced. Furthermore, at low concentrations of ATP, theidentity of the residues at the M1-M2 loop border affects the regulation of ATP hydrolysis by potassiumin an isoform-specific manner. Analysis of chimericR subunits reveals that the effects of potassium aredetermined primarily by the interaction of the N-terminus and M1-M2 loop with the C-terminal third ofthe R subunit. M1-M2 loop border residues may, therefore, influence ouabain sensitivity indirectly byaltering the stability or structure of the intermediate of the Na,K-ATPase catalytic cycle which is competentto bind ouabain.
The Na,K-ATPase1 both maintains and establishes theelectrochemical gradients present across the plasma mem-brane of mammalian cells by catalyzing the ATP-dependenttransport of sodium and potassium ions (1). It is anoligomeric integral membrane protein consisting of twomajor subunits,R andâ, of which there are several isoforms,and a third small proteolipidγ subunit (2). The 100 kDaRsubunit comprises 10 putative membrane-spanning segments,M1-M10, and a large intracellular loop containing thenucleotide binding site and catalytic aspartyl residue. The40-60 kDaâ subunit consists of a short cytoplasmic strand,a single membrane-spanning segment, and a glycosylated
extracellular domain (1). The cation occlusion site of theNa,K-ATPase is thought to be formed by multiple residueslocated in the membrane-spanning segments of theR andâsubunits (3). The ∼6.5 kDa γ subunit has been shown toplay a role in modulating K+ activation of the Na,K-ATPase(2). During catalysis, the Na,K-ATPase alternates betweentwo distinct conformational states, E1 and E2. Interconver-sion between E1 and E2 is intimately linked both tonucleotide binding and hydrolysis and to cation binding andocclusion (4). These conformational states can be distin-guished by their dissimilar affinities for phosphate, nucle-otides, and the specific inhibitor of the Na,K-ATPase,ouabain (4).
Ouabain is thought to inhibit the Na,K-ATPase by bindingthe extracellular and intramembrane surfaces of the enzymewhen it is in the E2 conformation, thereby preventingregeneration of the E1 conformation and catalysis (1, 4). Thesensitivity of the Na,K-ATPase to inhibition by ouabainappears to be determined exclusively by the identity of theR subunit (1). Naturally occurringR subunits yield Na,K-ATPase molecules which vary dramatically in ouabainsensitivity, withKi’s ranging from 1× 10⁻⁷ M [sheepR1(5), rat R2 (6), and ratR3 (6)] to 1 × 10⁻⁴ M ouabain [ratR1 (7)]. One strategy used to identify the amino acidsinvolved in the interaction between ouabain and theR subunitis to mutagenize ouabain-sensitiveR1 subunits (Ki in the 1× 10⁻⁷ M range) and then to screen mutants for their abilityto confer ouabain resistance upon ouabain-sensitive cell lines(7). Using this approach, 16 residues scattered throughoutthe extracellular surface and membrane-spanning segments
† This work was carried out at the Department of Molecular Biology,Harvard University (7 Divinity Ave., Cambridge, MA 02138), andsupported by Grants DK27626 and HL08893 from the NIH. M.V.C.was partially funded by NIH Training Grant GM07598. L.A.C. wasthe recipient of a Howard Hughes Medical Institute Summer ResearchInternship at Harvard University.
* To whom correspondence should be addressed: Department ofMicrobiology, University of Massachusetts, 203 N Morrill 4N, Amherst,MA 01003. Phone: (413) 545-9647. Fax: (413) 545-1578. E-mail:[email protected].
‡ University of Massachusetts.§ Centenary College of Louisiana.| Harvard University.1 Abbreviations: Na,K-ATPase, sodium-potassium adenosine triphos-
phatase; M1-M2 loop, extracellular loop connecting the first andsecond membrane-spanning segments of the Na,K-ATPaseR subunit;SE, standard error; SD, standard deviation; Tris, tris(hydroxymethyl)-aminoethane; Tris-ATP, ATP buffered with Tris; bp, base pair; PCR,polymerase chain reaction; Pi, inorganic phosphate;Ki, concentrationof inhibitor at which 50% of the Na,K-ATPase activity is inhibited;Vmax, maximal enzymatic activity; N-terminus, amino terminus; C-terminus, carboxyl terminus.
2494 Biochemistry1999,38, 2494-2505
10.1021/bi982180j CCC: $18.00 © 1999 American Chemical SocietyPublished on Web 02/05/1999
of the R subunit have been identified as determinants ofouabain sensitivity [reviewed by Croyle et al. (8)]. Thirteenof these residues are conserved in the sheepR1 subunit (9)and in all three ratR subunits (10).
There is convincing evidence for a direct contact withouabain for only one of the 16 residues identified asdeterminants of ouabain sensitivity byR subunit mutagenesis.Cys 104 [sheepR1 (9)], a conserved residue in M1, is thoughtto interact with the steroid nucleus of ouabain via a hydrogenbond (11-14). Mutagenesis of the remaining 15 residuescould potentially alter ouabain binding indirectly, either bychanging the orientation or properties of residues whichnormally contact ouabain, by causing side chains to protrudeinto the ouabain binding cleft, or by altering the E1-E2equilibrium (15, 16). Site-directed mutagenesis (reviewed inrefs17 and18) and biochemical studies (reviewed in ref3)have implicated residues in M4-M10 in cation binding andocclusion. Thus mutagenesis of residues in or adjacent tothese membrane-spanning segments may influence ouabainbinding indirectly as a consequence of alterations in cationbinding (8). In fact, mutagenesis of a leucine residue in theextracellular M5-M6 loop simultaneously decreased ouabainsensitivity and increased apparent potassium affinity (19).The hairpin formed by M1, M2, and the extracellular M1-M2 loop is another region where mutations have the potentialto alter ouabain binding indirectly. This hairpin links twocytoplasmic domains thought to play a role in modulatingATP binding and regulating the E1-E2 conformationalequilibrium (20-23).
Because they differ in ouabain-resistant and ouabain-sensitiveR subunits (10), the two residues at the borders ofthe M1-M2 loop [positions 113 and 124 of ratR1 (9)] havebeen the subject of considerable study. Furthermore, theKi
of three different ouabain-sensitiveR subunits can bechanged to values similar to that of the highly resistant ratR1 subunit (Ki ) ∼1 × 10⁻⁴ M) simply by substituting theirM1-M2 loop border residues with those of ratR1 (7, 24).Mutations at the M1-M2 loop border decrease ouabainsensitivity by increasing the dissociation rate of the inhibitor(13). However, the mechanism by which M1-M2 loopborder residues influence this rate is not well understood.Although the presence of charged residues at the M1-M2loop border seems to be critical for ouabain resistance, thereis no clear correlation between the type of charged residuepresent and the degree of ouabain resistance (5). This resultsuggests that the M1-M2 loop border residues may influenceouabain affinity indirectly via their interaction with other asyet uncharacterized residues. This view is further supportedby the observation that a monoclonal antibody, whichspecifically binds the M1-M2 loop, enhances rather thanblocks ouabain binding (25). Finally, although the sugarmoiety of cardiac glycosides greatly affects their rate ofdissociation, the M1-M2 loop border residues do not appearto interact with this moiety (26).
Here we report that the effect of particular residues at theM1-M2 loop border upon ouabain affinity is context-dependent. In addition, we present evidence that the M1-M2 loop border residues can affect the kinetic properties ofboth theR1 andR2 isoforms of the rat Na,K-ATPase. Ourdata further support the hypothesis that the effects of theM1-M2 border residues on ouabain affinity involve theirinteraction with otherR subunit residues and point to a
potential role for the M1-M2 loop in the regulation of theE1-E2 equilibrium.
EXPERIMENTAL PROCEDURES
Materials. All reagents used to culture HeLa cells werepurchased from GibcoBRL (Grand Island, NY). All chemi-cals used were reagent grade or better. [γ-32P]ATP wasobtained from Dupont-NEN (Boston, MA). Ouabain andTris-ATP were purchased from Sigma Chemical Co. (St.Louis, MO). The vector rR1-pkC4 (7) and a version of thevector rR2-pkC4 (24), which was wild type at positions 111and 122, were obtained from J. Lingrel (University ofCincinnati, Cincinnati, OH). The mammalian expressionvector pMT2 (27) was obtained with the permission of theGenetics Institute (Cambridge, MA), and the mammalianexpression vector pcDNA3 was purchased from Invitrogen(San Diego, CA).
Molecular Biology. Alignment of theR1 andR2 sequences[numbering according to Shull et al. (10)] revealed twoconserved restriction sites at analogous positions: anAflIIIsite located near the phosphorylated aspartyl residue (ratR1,bp 1406, H386; ratR2, bp 1261, H384) and anNcoI site inM5 (rat R1, bp 2435, A729; ratR2, bp 2287, A727). Byaltering two nucleotides of theR1 subunit, it was possibleto create a third common restriction site,NheI, at theN-terminus of M2 (ratR1, bp 643, flanked by V130 andL131; ratR2, bp 497, flanked by V128 and L129). Creationof theR1 subunitNheI site resulted in the substitution S132A,alanine being the residue found at the corresponding positionof the R2 subunit.
The expression vector pMT2R2RD, which directs expres-sion of the rat R2L111R,N122D (R2RD) subunit, wasconstructed as previously described (28). To facilitateconstruction of the various mutant and chimericR2 subunits,the completeR2RD cDNA was excised from pMT2R2RDand ligated into thePstI site of pGem3zf- (Promega,Madison, WI). The substitutions L111D and N122R wereintroduced into an N-terminal restriction fragment of theR2subunit by the method of Kunkel et al. (29). A HindIII-NheI fragment containing these substitutions was substitutedfor the corresponding piece ofR2RD to generate thecompleteR2DR coding sequence. Subsequently, PCR wasused to generate aHindIII-NheI restriction fragment ofR2DR in which the 5′ untranslated sequence was replacedby a consensus Kozak sequence (30). The sense primer was5′-GGG-AAGCTT-GCCGCCACC-ATG-GGA-CGT-GGG-GCA-GGG-CGT-3′ and encoded the N-terminal amino acidsMGRGAGR preceded by a GC clamp, aHindIII site, and aconsensus Kozak sequence. The antisense primer was 5′-CC-GC-TAG-CAC-GAT-ACC-TAG-ATA-3′ and comple-mented the amino acid sequence YLGIVLA. The resultingPCR product was ligated to the remainder of theR2 codingsequence to generate the full-lengthR2ckDR coding se-quence.
To facilitate further manipulation of theR1RD subunit,the rat R1 subunit cDNA and adjoining polylinker wereexcised from rR1-pkC4 (7) and ligated into theHindIII siteof pGem3zf-. A novel NheI site at bp 643 was introducedinto an N-terminal restriction fragment of theR1 subunit bythe method of Kunkel et al. (29). An ApaI-BstBI fragmentcontaining the novelNheI site was substituted for the
Isoform-Specific Effects of Na,K-ATPase Mutations Biochemistry, Vol. 38, No. 8, 19992495

corresponding piece of the wild typeR1 subunit to generatethe completeR1RDNheI(S132A) coding sequence. PCR wasused to generate aHindIII-NheI restriction fragment con-sisting of a consensus Kozak sequence followed by theN-terminus of theR1 subunit coding sequence containingthe substitutions R113D, D124R, and S132A. The senseprimer consisted of a GC clamp followed by aHindIII site,a consensus Kozak sequence, and the first three amino acidsof the ratR1 coding sequence, MGK. Its nucleotide sequencewas 5′-GGG-AAGCTT-GCCGCCACC-ATG-GGG-AAG-G-3′. The antisense primer complemented the amino acidsequence AYGIDSATEEEPPNDRLYLGVVLA. Its se-quence was 5′-CCGC-TAG-CAC-GAC-CCC-GAG-GTA-CAG-TCG-ATC-ATT-TGG-TGG-TTC-CTC-TTC-TGT-AGC-ACT-ATC-GAT-GCC-ATA-AG-3′. The resulting PCRproduct was ligated to the remainder of theR1RDNheIcoding sequence to generate the full-lengthR1ckDRNheIcoding sequence.
Following their assembly, the various mutant and chimericR subunits were introduced into one of two mammalianexpression vectors, pMT2 [R2RD, R2DR, R1RDNheI,R2RDNhe1R1, R1RDNcoIR2, R2RDNheIR1NcoIR2, andR1RD(NheI)AflII R2NcoIR1] or pcDNA3 [R2ckDR, R2ck-DRNheIR1, R1ckDRNheI, andR1ckDRNheIR2].
Tissue Culture and Transfection.HeLa cells were culturedat 37 °C and 5% CO2 in Dulbecco’s Modified Eagle’sMediumsupplementedwithpenicillin,streptomycin,glutamine,and 10% fetal bovine serum. HeLa cells were transfectedby the calcium phosphate method as previously described(28). After 2-4 weeks of growth in selective mediacontaining 1µM ouabain, ouabain-resistant colonies wereeither stained with crystal violet for counting or culturedindividually to generate ouabain-resistant cell lines. Allouabain-resistant cell lines were maintained in mediumcontaining 1µM ouabain.
Membrane Preparations.All membrane preparations werealiquotted, flash-frozen, and stored at-70 °C. The proteinconcentration was determined according to the method ofPeterson (31). Rat skeletal muscle membranes were preparedaccording to the method of Barchi et al. (32). Following acrude dissection to enrich for the outer medulla, rat kidneymicrosomes were prepared and SDS extracted according tothe method of Jørgensen (33). Crude membranes from thevarious HeLa cell lines were prepared according to themethod of Jewell and Lingrel (24) with the followingmodifications. After NaI extraction, the membrane pelletswere resuspended in wash buffer containing 10 mM Hepes/Tris (pH 7.5) and 0.2 mM EDTA/Tris. After repelleting, themembranes were resuspended in 2-3 mL of wash bufferand dialyzed for at least 24 h against 4 L of 10 mM Hepes/Tris (pH 7.4) to eliminate any residual sodium. The dialyzedmembranes were then diluted in wash buffer, pelleted, andresuspended in the same buffer.
Na,K-ATPase Assays. Na,K-ATPase activity was deter-mined as the rate of Pi release from ATP that was eitherouabain-inhibitable or sodium-dependent. The use of Tris-ATP enabled measurement of the rate of ATP hydrolysis inthe absence of sodium. Incubation times and membraneconcentrations were adjusted such that the rate of ATPhydrolysis remained linear (less than 25% of the total ATPhydrolyzed) throughout. For the ouabain titrations shown inFigure 2, Na,K-ATPase activity was measured at 37°C in
buffer containing 2.5 mM ATP, 3 mM MgCl2, 100 mM NaClor choline chloride, 20 mM KCl, 50 mM Tris/HCl (pH 7.4),1 mM EGTA, and varying concentrations of ouabain.Membranes were pre-equilibrated with ouabain for 20 minat 37 °C in the absence of KCl and ATP, and the ATPasereaction was initiated by the simultaneous addition of KCland ATP. The rate of release of Pi was measured accordingto the method of Lanzetta et al. (34). Na,K-ATPase activityin the presence of 1µM ATP was measured at 37°C inbuffer containing 1 mM MgCl2, 100 mM NaCl or cholinechloride, 0.0-5 mM KCl or choline chloride, 50 mM Tris/HCl (pH 7.4), 1 mM EGTA, and an appropriate concentrationof ouabain. Membranes were pre-equilibrated for 20 min at37 °C in the absence of ATP, and the ATPase reaction wasinitiated by the addition of [γ-32P]ATP/ATP. The rate ofrelease of Pi from [γ-32P]ATP/ATP was measured accordingto the method of Pressley et al. (35) with the followingmodifications. Trichloroacetic acid was substituted for per-chloric acid, and the organic phosphomolybdate complex wasextracted into a 1:1 mixture of ethyl acetate and isobutanol.
RESULTS
Capacity of VariousRDR andRRD Subunits To SupportGrowth of Ouabain-Resistant Colonies.Two combinationsof charged M1-M2 loop border residues, R114,D124 (RD,numbering refers to the ratR1 subunit) and D114,R124 (DR),were introduced into ratR1, R2, and chimericR1-R2subunits. We chose theRD combination, because it occursnaturally in the ouabain-resistant ratR1 subunit (10). ThecombinationDR was selected for its capacity to turn thesheepR1 isoform into a “super ouabain resistant” enzymewith a Ki in the millimolar range (5).
To create the various chimericR subunits shown in Figure1, we exploited a naturally occurringNheI restriction sitewhich cleaves theR2 subunit cDNA at the N-terminus ofM2 (bp 497, flanked by V128 and L129). Alignment of theR1 andR2 sequences reveals that mutagenesis of two basepairs in theR1 subunit sequence creates an analogousNheIsite (bp 643, flanked by V130 and L131). Creation of theR1 subunitNheI site also results in the substitution S132A,alanine being the residue found at the corresponding positionof the R2 subunit.
The endogenousR1 subunit of HeLa cells,R1QN, has ahigh affinity for ouabain and can be fully inhibited bymicromolar concentrations of the inhibitor. Exogenouslyexpressed ouabain-resistantR subunits such as ratR1RD (5)andR2RD (24) can assemble with the endogenousâ1 subunitof HeLa cells and enable them to grow at normally toxicconcentrations of ouabain. We began by investigating thecapacity of the various mutant and chimericR-subunitsshown in Figure 1 to support the growth of ouabain-resistantcolonies of HeLa cells. As shown in Figure 1, expression oftheR1 subunit containing the novelNheI site (R1RDNheI),R2RD, or R2RDNheIR1, a chimeric subunit consisting ofthe N-terminus of theR2RD subunit joined to the C-terminusof the R1 subunit, yields hundreds of ouabain-resistantcolonies.
Surprisingly, expression ofR subunits with the M1-M2loop border residuesDR consistently yields fewer ouabain-resistant colonies than the corresponding subunits withRDat the loop borders (Figure 1). The number of ouabain-resistant colonies generated by expression ofR1ckDRNheI,
2496 Biochemistry, Vol. 38, No. 8, 1999 Coppi et al.

R2DRNheIR1, and R2DR was 45.98( 15.40%, 2.62(0.66%, and 0.24( 0.16%, respectively, of the number ofcolonies generated by expression of theirRD counterparts.The few ouabain-resistant colonies of HeLa cells generated
by R2DR expression grew so slowly in the presence of 1µM ouabain that further culturing was not feasible. However,there was abundantR2DR expression in the absence ofouabain in transiently transfected COS-7 cells (data not
FIGURE 1: Ability of rat R1, rat R2, and chimericR subunits with substitutions at the borders of the M1-M2 loop to support growth ofouabain-resistant colonies. HeLa cells were transfected with vectors directing expression of the variousR subunits by the calcium phosphatemethod as described in Experimental Procedures. Following either 2 (R1RDNheI,R2RD, andR2RDNheI) or 3 weeks (remainingR subunits)of growth in medium containing 1µM ouabain, ouabain-resistant colonies were stained with crystal violet and counted. Data shown are asmeans( SE. An asterisk indicates that transfected HeLa cells were cultured in medium containing 10-fold less ouabain (0.1µM). Thenomenclature of the variousR subunits is as follows. The residues at the M1-M2 loop borders are indicated in boldface type. The letters“ck” indicate that the 5′ untranslated sequence was replaced by a consensus Kozak sequence (30). “NheI” refers to either the restriction siteused to fuse the N- and C-termini of the various chimericR subunits or the presence of a novelNheI restriction site and resulting S132Asubstitution in theR1 subunit cDNA. Solid lines and white rectangles denoteR2 subunit sequences. Cross-hatched lines and rectanglesdenoteR1 subunit sequences.
Isoform-Specific Effects of Na,K-ATPase Mutations Biochemistry, Vol. 38, No. 8, 19992497
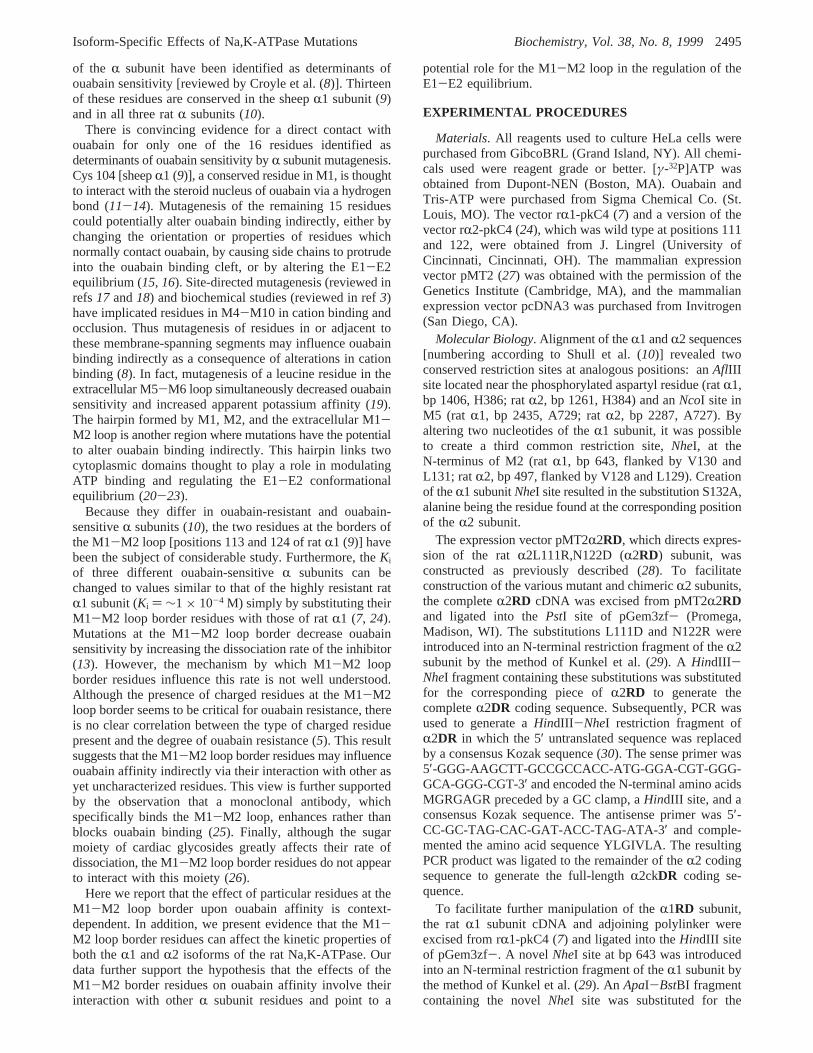
FIGURE 2: Determination of ouabain sensitivity of variousR subunits. The nomenclature ofR subunits is identical to that described inFigure 1. Na,K-ATPase activity was measured in buffer containing 2.5 mM ATP, 100 mM NaCl, 20 mM KCl, 3 mM MgCl2, 50 mMTris/HCl (pH 7.4 and 37°C), 1 mM EGTA, and the indicated concentration of ouabain as described in Experimental Procedures. Raw datawere least-squares fitted to either a one-component or a two-component inhibition curve with the program Igor (Wavemetrics, Lake Oswego,OR). To fit the data for membranes prepared from HeLa cells expressing “super ouabain resistant”R subunits (G, I, and J), ATPase activityin the absence of sodium was considered to be equivalent to ATPase activity in the presence of 1 M ouabain. Single-component curves (Aand C) were fitted to the functionc ) co[1 - x/(c1 + x)] + c2, wherec is the total Na,K-ATPase activity,x is the ouabain concentration,c1 is theKi for ouabain, andc2 is the ouabain-resistant ATPase activity. Two-component curves (B and D-J) were fitted to the functionc ) co[1 - [x/(c1 + x)]c2 - (x/c3 + x)(1 - c2)] + c4, wherec is the total Na,K-ATPase activity,x is the ouabain concentration,c1 is theKi for ouabain of the high-affinity component,c2 is the fraction of the total Na,K-ATPase activity that can be attributed to the high-affinitycomponent,c3 is theKi for ouabain of the low-affinity component, andc4 is the ouabain-resistant Na,K-ATPase activity. Data are plottedas a percentage of the total Na,K-ATPase activity that was defined by the optimal curve fit. Unless otherwise indicated, data plotted aremeans( SE of three independent measurements. An asterisk indicates a point is mean( SE of six independent measurements. Ouabaintitrations were performed on membranes prepared from the following. (A) Untransfected HeLa cells expressing only the endogenousRsubunit,R1QN. Total Na,K-ATPase activity (mean( SD) ) 38.5( 0.49 nmol of Pi mg-1 min-1. (B) Rat muscle membranes containingR1RD andR2LN . Total Na,K-ATPase activity) 1665.3( 22.5 nmol of Pi mg-1 min-1. (C) SDS-extracted rat kidney microsomes expressingR1RD. Total Na,K-ATPase activity) 5250.3( 136.1 nmol of Pi mg-1 min-1. (D) Two different colonies of HeLa cells expressingR1RD.Total Na,K-ATPase activity) 17.37( 0.39 nmol of Pi mg-1 min-1 for black circles and 16.44( 0.41 nmol of Pi mg-1 min-1 for whitecircles. White circles represent data from the membrane preparation used to measure potassium inhibition at 1µM ATP. (E) HeLa cellsexpressingR1RDNheI. Total Na,K-ATPase activity) 34.14( 0.55 nmol of Pi mg-1 min-1. (F) Two different colonies of HeLa cellsexpressingR2RD. Total Na,K-ATPase activity) 25.6( 0.31 nmol of Pi mg-1 min-1 for black circles and 19.31( 0.41 nmol of Pi mg-1
min-1 for white circles. White circles represent data from the membrane preparation used to measure the effect of potassium at 1µM ATP.All asterisks refer to white circles. (G) HeLa cells expressingR1ckDRNheI. Total Na,K-ATPase activity) 28.29( 1.05 nmol of Pi mg-1
min-1. (H) HeLa cells expressingR2ckDR. Total Na,K-ATPase activity) 38.27( 0.54 nmol of Pi mg-1 min-1. (I) HeLa cells expressingR2ckDRNheIR1. Total Na,K-ATPase activity) 29.40( 1.34 nmol of Pi mg-1 min-1. (J) HeLa cells expressingR1ckDRNheIR2. TotalNa,K-ATPase activity) 21.60( 0.56 nmol of Pi mg-1 min-1.
2498 Biochemistry, Vol. 38, No. 8, 1999 Coppi et al.
shown), demonstrating that the expression vector wascompetent.
The failure of anR subunit to support efficient growth ofHeLa cells in the presence of micromolar ouabain can haveseveral causes. The difference between the ouabain affinityof theR subunit and the endogenousR1QN subunit of HeLacells may be too small to maintain a sufficiently largepopulation of active Na,K-ATPase molecules. Alternatively,the introduction of substitutions into anR subunit maycompromise the assembly or catalytic activity of the Na,K-ATPase (17). In both of these cases, increasing the level ofR subunit expression may generate enough Na,K-ATPaseactivity to enable cell division in the presence of ouabain.
Examination of the sequence immediately preceding theinitiation codon of theR2 subunit revealed a suboptimalKozak sequence (10, 30). To increase the level ofR2DRandR2DRNheIR1 expression, we substituted the 5′ untrans-lated region of these cDNAs with a consensus Kozaksequence. As a result of this change, the number of ouabain-resistant colonies resulting from transfection of theR2ck-DRNheIR1 cDNA (228( 42.6) rose to a level comparableto that achieved by transfection of itsRD counterpart(R2RDNheIR1, 313.0( 40.5). This result indicates that anincrease in the expression level of theR2DRNheIR1 subunitis sufficient to overcome the alterations in either ouabainaffinity or enzymatic activity caused by theDR mutations.This is not the case forR2ckDR, where the number ofcolonies remains low despite introduction of a consensusKozak sequence. Substitution of the 5′ untranslated regionof R2DR with a consensus Kozak sequence did, however,enable us to successfully culture a few colonies expressingR2ckDR in 1 µM ouabain. Surprisingly, decreasing theconcentration of ouabain in the selective media from 1 to0.1 µM increased the number of colonies to 58, suggestingthat R2ckDR, unlike sheepR1DR (5), has a fairly highaffinity for ouabain.
Despite the presence of a consensus Kozak sequence (30),expression of the chimericR1ckDRNheIR2 subunit yieldedvery few colonies (0.33( 0.33, n ) 3). Decreasing theouabain concentration in the selective media did not appearto significantly increase the number of ouabain-resistantcolonies (2,n ) 1). Thus, the inability ofR1ckDRNheIR2to support efficient growth of ouabain-resistant colonies isprobably not due to a high ouabain affinity and may insteadbe due to a defect in the ability ofR1ckDRNheIR2 to formfunctional Na,K-ATPase molecules. The possibility thatR1ckDRNheIR2 is nonfunctional and that the few coloniesobtained may be mutants of the original construct has notbeen excluded.
Ouabain SensitiVities of VariousRRD andRDR Subunits.To better understand the effects of theRD and DRsubstitutions, we measured the ouabain sensitivity of theNa,K-ATPase activity present in membrane preparations ofHeLa cells expressing the variousR subunits and comparedit to that of the endogenousR1QN subunit of HeLa cells aswell as to that of the wild typeR1RD andR2LN subunits(Figure 2 and Table 1). As shown in Figure 2, the Na,K-ATPase activity present in all of the ouabain-resistant HeLacell lines expressing the variousR subunits could best be fitby a two-component inhibition curve in which the ouabainsensitivity of the high-affinity component was consistent withthat of the endogenousR1QN subunit. The contribution of
the endogenousR1QN subunit to the total Na,K-ATPaseactivity in these cell lines varies widely, ranging from 14 to59% of the total.
As shown in Table 1, the identity of the residues at theborders of the M1-M2 loop is not an accurate predictor ofouabain sensitivity. This is particularly evident if we comparethe ouabain affinities of the variousRDR subunits. Similarto sheepR1DR, R1ckDRNheI yields a “super ouabainresistant enzyme” with aKi for ouabain in the millimolarrange [(5.85( 0.93)× 10-3 M]. In contrast, theR2ckDRsubunit is relatively ouabain-sensitive; itsKi for ouabain is(2.39 ( 0.92) × 10-5 M. As shown in Figure 2H, it wasdifficult to resolveR1QN from R2ckDR activity. Surpris-ingly, joining theR2 N-terminus containing theDR substitu-tions to the C-terminus ofR1 yields an enzyme (R2ckDRN-heIR1) which is even more ouabain-resistant [Ki for ouabainof (2.04( 0.44)× 10-2 M] than R1ckDRNheI. In contrast,the complementary chimera,R1ckDRR2, yielded an enzymewith a Ki for ouabain that was very close to that ofR1ckDRNheI, (7.70( 1.60)× 10-3 M. There is also a 2-folddifference between the ouabain affinities of theR1RD andR2RD subunits.R2RD [Ki ) (4.53 ( 0.091) × 10-4 M,average of c and d, Table 1] is roughly 2-fold more resistantto ouabain inhibition than eitherR1RD [Ki ) (1.43( 0.50)× 10-4 M, average of a and b, Table 1] orR1RDNheI [Ki
) (1.89 ( 0.18)× 10-4 M].Thus, ouabain sensitivity is dependent not only upon the
identity of the residues at the M1-M2 loop border but alsoupon the context into which they are introduced. The factthat the ouabain sensitivity of the chimericR2ckDRNheIR1subunit is distinct from that of eitherR2ckDR or R1ckDRN-heI indicates that residues located both C-terminal to andN-terminal to or within the M1-M2 loop are important indetermining the effects of substitutions at the borders of theM1-M2 loop upon ouabain sensitivity. It is, therefore,unlikely that the M1-M2 loop border residues are involvedin a direct interaction with ouabain.
Table 1: Context-Dependent Effect of M1-M2 Loop BorderResidues on Ouabain Sensitivitya
R subunitmembrane
source Ki for ouabain (M)
% totalNa,K-ATPase
activity
R1QN HeLa cells (4.35( 0.30)× 10-7 100.0( 0.0R2LN rat muscle (4.77( 0.57)× 10-7 62.60( 1.90R1RD rat muscle (0.894( 0.192)× 10-4 37.40( 1.90R1RD rat kidney (1.91( 0.24)× 10-4 100.0( 0.0R1RD HeLa cells
expressingrat cDNA
(0.920( 0.189)× 10-4 b 60.23( 2.61b
(1.93( 0.46)× 10-4 c 52.06( 3.03c
R1RDNheI (1.89( 0.18)× 10-4 81.90( 1.50R2RD (3.95( 0.30)× 10-4 d 76.02( 0.92d
(5.11( 0.86)× 10-4 e 66.70( 2.54e
R1ckDRNheI (5.85( 0.93)× 10-3 84.51( 2.22R2ckDR (2.39( 0.92)× 10-5 44.85( 8.99R2ckDRNheIR1 (2.04( 0.44)× 10-2 86.32( 2.86R1ckDRNheIR2 (7.7( 1.60)× 10-3 41.23( 1.56
a The identity of residues at the M1-M2 loop borders is indicatedin boldface type. The nomenclature of variousR subunits is identicalto that in the legend of Figure 1. TheKi for ouabain of the variousRsubunits was determined as described in the legend of Figure 2. Dataare means( SD. b Derived from the data depicted as black circles inFigure 2D.c Derived from the data depicted as white circles in Figure2D. d Derived from the data depicted as black circles in Figure 2F.e Derived from the data depicted as white circles in Figure 2F.
Isoform-Specific Effects of Na,K-ATPase Mutations Biochemistry, Vol. 38, No. 8, 19992499
Effect of Potassium onR1QN and R2RD Na,K-ATPaseActiVity at 1µM ATP. Agents which alter the conformational(E1-E2) equilibrium of the Na,K-ATPase also inducechanges in ouabain affinity (15, 16). Given the context-dependent effects of M1-M2 loop border residue substitu-tions upon ouabain sensitivity, we hypothesized that thesesubstitutions might influence ouabain affinity by perturbingthe E1-E2 equilibrium. In fact, the M1-M2 loop links twocytoplasmic segments which have been implicated in modu-lation of the E1-E2 equilibrium: the N-terminus (21-23,36) and the M2-M3 loop (20). Truncation of the ratR1RDsubunit N-terminus and introduction of a point mutation,E233K, into the M2-M3 cytoplasmic loop both result in ashift in the E1-E2 conformational equilibrium toward E1.Both of these alterations also cause the effect of potassiumupon Na,K-ATPase activity at low ATP concentrations toswitch from inhibition to activation (20, 23). Because changesin the effects of potassium on Na,K-ATPase activity at lowATP concentrations are fairly easy to measure and mightindicate perturbations of the E1-E2 equilibrium, we decidedto investigate the effects of substitutions of the M1-M2 loopborder residues upon this parameter.
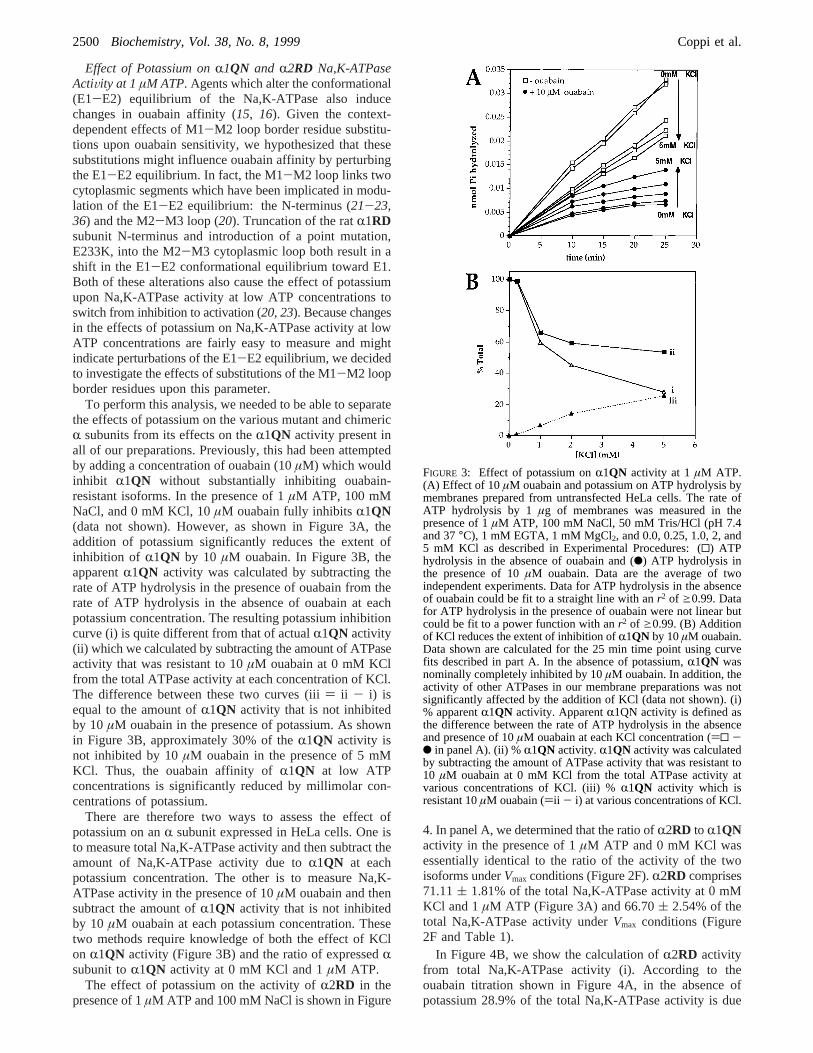
To perform this analysis, we needed to be able to separatethe effects of potassium on the various mutant and chimericR subunits from its effects on theR1QN activity present inall of our preparations. Previously, this had been attemptedby adding a concentration of ouabain (10µM) which wouldinhibit R1QN without substantially inhibiting ouabain-resistant isoforms. In the presence of 1µM ATP, 100 mMNaCl, and 0 mM KCl, 10µM ouabain fully inhibitsR1QN(data not shown). However, as shown in Figure 3A, theaddition of potassium significantly reduces the extent ofinhibition of R1QN by 10 µM ouabain. In Figure 3B, theapparentR1QN activity was calculated by subtracting therate of ATP hydrolysis in the presence of ouabain from therate of ATP hydrolysis in the absence of ouabain at eachpotassium concentration. The resulting potassium inhibitioncurve (i) is quite different from that of actualR1QN activity(ii) which we calculated by subtracting the amount of ATPaseactivity that was resistant to 10µM ouabain at 0 mM KClfrom the total ATPase activity at each concentration of KCl.The difference between these two curves (iii) ii - i) isequal to the amount ofR1QN activity that is not inhibitedby 10 µM ouabain in the presence of potassium. As shownin Figure 3B, approximately 30% of theR1QN activity isnot inhibited by 10µM ouabain in the presence of 5 mMKCl. Thus, the ouabain affinity ofR1QN at low ATPconcentrations is significantly reduced by millimolar con-centrations of potassium.
There are therefore two ways to assess the effect ofpotassium on anR subunit expressed in HeLa cells. One isto measure total Na,K-ATPase activity and then subtract theamount of Na,K-ATPase activity due toR1QN at eachpotassium concentration. The other is to measure Na,K-ATPase activity in the presence of 10µM ouabain and thensubtract the amount ofR1QN activity that is not inhibitedby 10 µM ouabain at each potassium concentration. Thesetwo methods require knowledge of both the effect of KClon R1QN activity (Figure 3B) and the ratio of expressedRsubunit toR1QN activity at 0 mM KCl and 1µM ATP.
The effect of potassium on the activity ofR2RD in thepresence of 1µM ATP and 100 mM NaCl is shown in Figure
4. In panel A, we determined that the ratio ofR2RD to R1QNactivity in the presence of 1µM ATP and 0 mM KCl wasessentially identical to the ratio of the activity of the twoisoforms underVmax conditions (Figure 2F).R2RD comprises71.11( 1.81% of the total Na,K-ATPase activity at 0 mMKCl and 1µM ATP (Figure 3A) and 66.70( 2.54% of thetotal Na,K-ATPase activity underVmax conditions (Figure2F and Table 1).
In Figure 4B, we show the calculation ofR2RD activityfrom total Na,K-ATPase activity (i). According to theouabain titration shown in Figure 4A, in the absence ofpotassium 28.9% of the total Na,K-ATPase activity is due
FIGURE 3: Effect of potassium onR1QN activity at 1 µM ATP.(A) Effect of 10µM ouabain and potassium on ATP hydrolysis bymembranes prepared from untransfected HeLa cells. The rate ofATP hydrolysis by 1µg of membranes was measured in thepresence of 1µM ATP, 100 mM NaCl, 50 mM Tris/HCl (pH 7.4and 37°C), 1 mM EGTA, 1 mM MgCl2, and 0.0, 0.25, 1.0, 2, and5 mM KCl as described in Experimental Procedures: (0) ATPhydrolysis in the absence of ouabain and (b) ATP hydrolysis inthe presence of 10µM ouabain. Data are the average of twoindependent experiments. Data for ATP hydrolysis in the absenceof ouabain could be fit to a straight line with anr2 of g0.99. Datafor ATP hydrolysis in the presence of ouabain were not linear butcould be fit to a power function with anr2 of g0.99. (B) Additionof KCl reduces the extent of inhibition ofR1QN by 10µM ouabain.Data shown are calculated for the 25 min time point using curvefits described in part A. In the absence of potassium,R1QN wasnominally completely inhibited by 10µM ouabain. In addition, theactivity of other ATPases in our membrane preparations was notsignificantly affected by the addition of KCl (data not shown). (i)% apparentR1QN activity. ApparentR1QN activity is defined asthe difference between the rate of ATP hydrolysis in the absenceand presence of 10µM ouabain at each KCl concentration ()0 -b in panel A). (ii) %R1QN activity. R1QN activity was calculatedby subtracting the amount of ATPase activity that was resistant to10 µM ouabain at 0 mM KCl from the total ATPase activity atvarious concentrations of KCl. (iii) %R1QN activity which isresistant 10µM ouabain ()ii - i) at various concentrations of KCl.
2500 Biochemistry, Vol. 38, No. 8, 1999 Coppi et al.
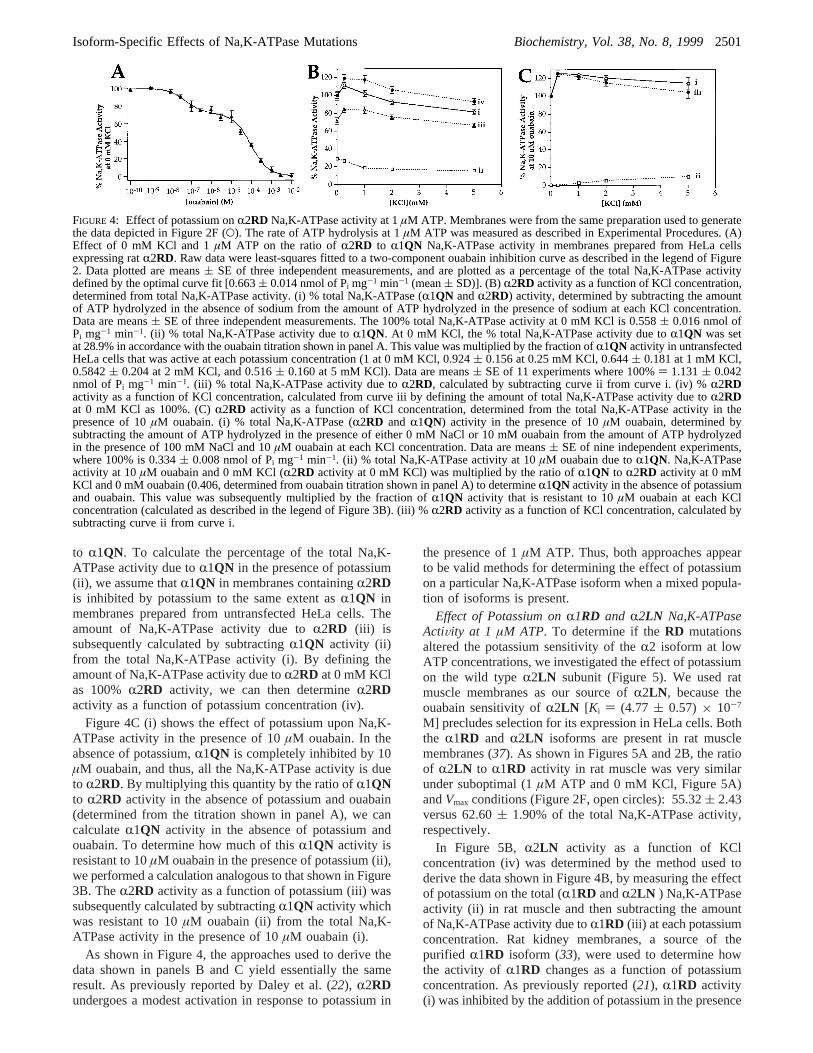
to R1QN. To calculate the percentage of the total Na,K-ATPase activity due toR1QN in the presence of potassium(ii), we assume thatR1QN in membranes containingR2RDis inhibited by potassium to the same extent asR1QN inmembranes prepared from untransfected HeLa cells. Theamount of Na,K-ATPase activity due toR2RD (iii) issubsequently calculated by subtractingR1QN activity (ii)from the total Na,K-ATPase activity (i). By defining theamount of Na,K-ATPase activity due toR2RD at 0 mM KClas 100%R2RD activity, we can then determineR2RDactivity as a function of potassium concentration (iv).
Figure 4C (i) shows the effect of potassium upon Na,K-ATPase activity in the presence of 10µM ouabain. In theabsence of potassium,R1QN is completely inhibited by 10µM ouabain, and thus, all the Na,K-ATPase activity is dueto R2RD. By multiplying this quantity by the ratio ofR1QNto R2RD activity in the absence of potassium and ouabain(determined from the titration shown in panel A), we cancalculateR1QN activity in the absence of potassium andouabain. To determine how much of thisR1QN activity isresistant to 10µM ouabain in the presence of potassium (ii),we performed a calculation analogous to that shown in Figure3B. TheR2RD activity as a function of potassium (iii) wassubsequently calculated by subtractingR1QN activity whichwas resistant to 10µM ouabain (ii) from the total Na,K-ATPase activity in the presence of 10µM ouabain (i).
As shown in Figure 4, the approaches used to derive thedata shown in panels B and C yield essentially the sameresult. As previously reported by Daley et al. (22), R2RDundergoes a modest activation in response to potassium in
the presence of 1µM ATP. Thus, both approaches appearto be valid methods for determining the effect of potassiumon a particularΝa,K-ATPase isoform when a mixed popula-tion of isoforms is present.
Effect of Potassium onR1RD and R2LN Na,K-ATPaseActiVity at 1 µM ATP. To determine if theRD mutationsaltered the potassium sensitivity of theR2 isoform at lowATP concentrations, we investigated the effect of potassiumon the wild typeR2LN subunit (Figure 5). We used ratmuscle membranes as our source ofR2LN , because theouabain sensitivity ofR2LN [Ki ) (4.77 ( 0.57) × 10-7
M] precludes selection for its expression in HeLa cells. Boththe R1RD and R2LN isoforms are present in rat musclemembranes (37). As shown in Figures 5A and 2B, the ratioof R2LN to R1RD activity in rat muscle was very similarunder suboptimal (1µM ATP and 0 mM KCl, Figure 5A)andVmax conditions (Figure 2F, open circles): 55.32( 2.43versus 62.60( 1.90% of the total Na,K-ATPase activity,respectively.
In Figure 5B, R2LN activity as a function of KClconcentration (iv) was determined by the method used toderive the data shown in Figure 4B, by measuring the effectof potassium on the total (R1RD andR2LN ) Na,K-ATPaseactivity (ii) in rat muscle and then subtracting the amountof Na,K-ATPase activity due toR1RD (iii) at each potassiumconcentration. Rat kidney membranes, a source of thepurified R1RD isoform (33), were used to determine howthe activity of R1RD changes as a function of potassiumconcentration. As previously reported (21), R1RD activity(i) was inhibited by the addition of potassium in the presence
FIGURE 4: Effect of potassium onR2RD Na,K-ATPase activity at 1µM ATP. Membranes were from the same preparation used to generatethe data depicted in Figure 2F (O). The rate of ATP hydrolysis at 1µM ATP was measured as described in Experimental Procedures. (A)Effect of 0 mM KCl and 1µM ATP on the ratio ofR2RD to R1QN Na,K-ATPase activity in membranes prepared from HeLa cellsexpressing ratR2RD. Raw data were least-squares fitted to a two-component ouabain inhibition curve as described in the legend of Figure2. Data plotted are means( SE of three independent measurements, and are plotted as a percentage of the total Na,K-ATPase activitydefined by the optimal curve fit [0.663( 0.014 nmol of Pi mg-1 min-1 (mean( SD)]. (B) R2RD activity as a function of KCl concentration,determined from total Na,K-ATPase activity. (i) % total Na,K-ATPase (R1QN andR2RD) activity, determined by subtracting the amountof ATP hydrolyzed in the absence of sodium from the amount of ATP hydrolyzed in the presence of sodium at each KCl concentration.Data are means( SE of three independent measurements. The 100% total Na,K-ATPase activity at 0 mM KCl is 0.558( 0.016 nmol ofPi mg-1 min-1. (ii) % total Na,K-ATPase activity due toR1QN. At 0 mM KCl, the % total Na,K-ATPase activity due toR1QN was setat 28.9% in accordance with the ouabain titration shown in panel A. This value was multiplied by the fraction ofR1QN activity in untransfectedHeLa cells that was active at each potassium concentration (1 at 0 mM KCl, 0.924( 0.156 at 0.25 mM KCl, 0.644( 0.181 at 1 mM KCl,0.5842( 0.204 at 2 mM KCl, and 0.516( 0.160 at 5 mM KCl). Data are means( SE of 11 experiments where 100%) 1.131( 0.042nmol of Pi mg-1 min-1. (iii) % total Na,K-ATPase activity due toR2RD, calculated by subtracting curve ii from curve i. (iv) %R2RDactivity as a function of KCl concentration, calculated from curve iii by defining the amount of total Na,K-ATPase activity due toR2RDat 0 mM KCl as 100%. (C)R2RD activity as a function of KCl concentration, determined from the total Na,K-ATPase activity in thepresence of 10µM ouabain. (i) % totalΝa,K-ATPase (R2RD and R1QN) activity in the presence of 10µM ouabain, determined bysubtracting the amount of ATP hydrolyzed in the presence of either 0 mM NaCl or 10 mM ouabain from the amount of ATP hydrolyzedin the presence of 100 mM NaCl and 10µM ouabain at each KCl concentration. Data are means( SE of nine independent experiments,where 100% is 0.334( 0.008 nmol of Pi mg-1 min-1. (ii) % total Νa,K-ATPase activity at 10µM ouabain due toR1QN. Na,K-ATPaseactivity at 10µM ouabain and 0 mM KCl (R2RD activity at 0 mM KCl) was multiplied by the ratio ofR1QN to R2RD activity at 0 mMKCl and 0 mM ouabain (0.406, determined from ouabain titration shown in panel A) to determineR1QN activity in the absence of potassiumand ouabain. This value was subsequently multiplied by the fraction ofR1QN activity that is resistant to 10µM ouabain at each KClconcentration (calculated as described in the legend of Figure 3B). (iii) %R2RD activity as a function of KCl concentration, calculated bysubtracting curve ii from curve i.
Isoform-Specific Effects of Na,K-ATPase Mutations Biochemistry, Vol. 38, No. 8, 19992501
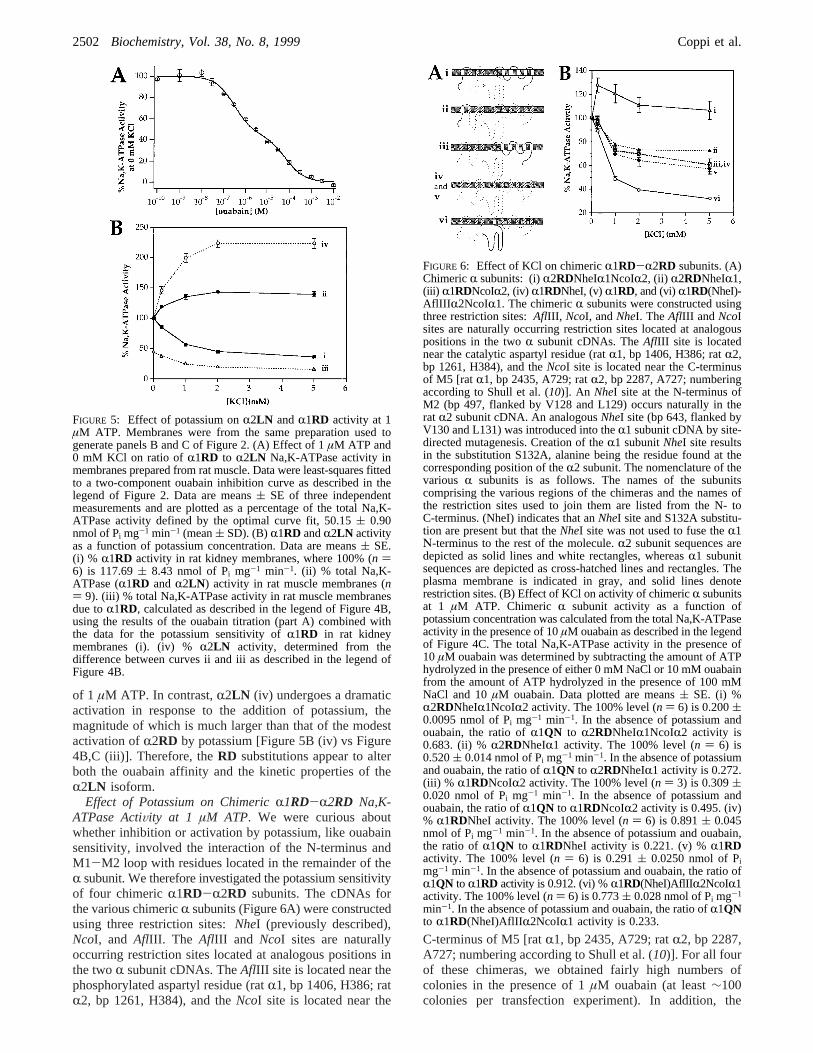
of 1 µM ATP. In contrast,R2LN (iv) undergoes a dramaticactivation in response to the addition of potassium, themagnitude of which is much larger than that of the modestactivation ofR2RD by potassium [Figure 5B (iv) vs Figure4B,C (iii)]. Therefore, theRD substitutions appear to alterboth the ouabain affinity and the kinetic properties of theR2LN isoform.
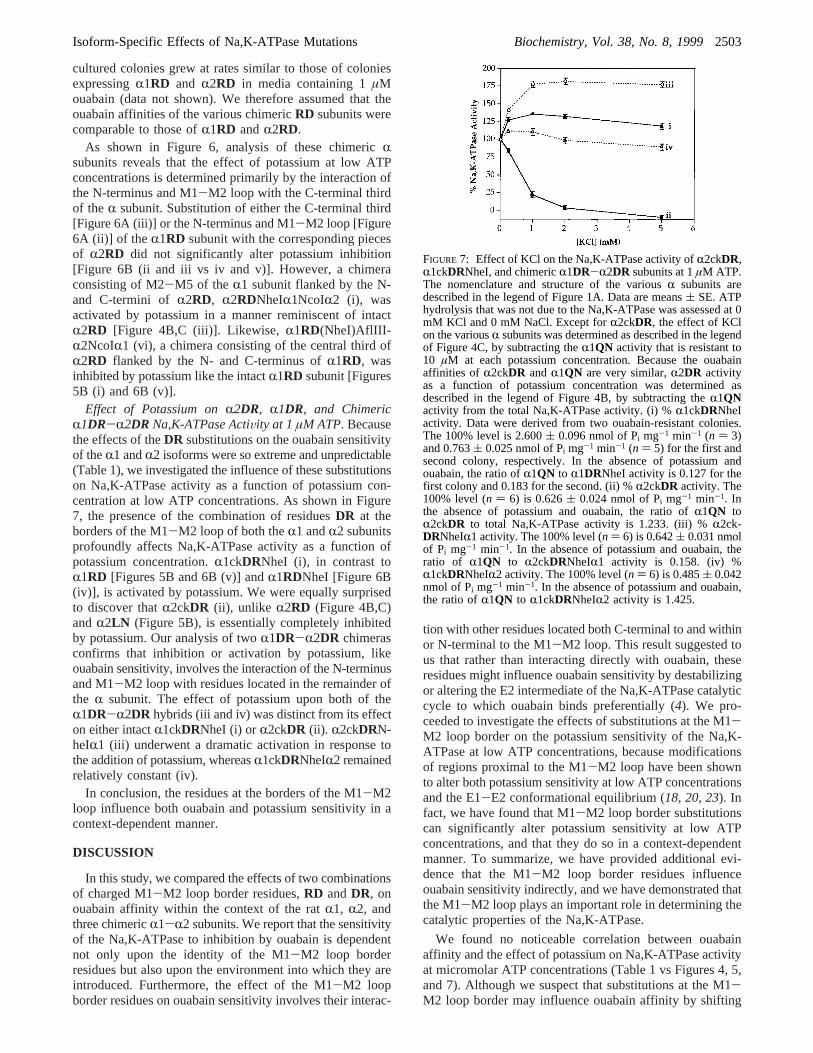
Effect of Potassium on ChimericR1RD-R2RD Na,K-ATPase ActiVity at 1 µM ATP. We were curious aboutwhether inhibition or activation by potassium, like ouabainsensitivity, involved the interaction of the N-terminus andM1-M2 loop with residues located in the remainder of theR subunit. We therefore investigated the potassium sensitivityof four chimericR1RD-R2RD subunits. The cDNAs forthe various chimericR subunits (Figure 6A) were constructedusing three restriction sites:NheI (previously described),NcoI, and AflIII. The AflIII and NcoI sites are naturallyoccurring restriction sites located at analogous positions inthe twoR subunit cDNAs. TheAflIII site is located near thephosphorylated aspartyl residue (ratR1, bp 1406, H386; ratR2, bp 1261, H384), and theNcoI site is located near the
C-terminus of M5 [ratR1, bp 2435, A729; ratR2, bp 2287,A727; numbering according to Shull et al. (10)]. For all fourof these chimeras, we obtained fairly high numbers ofcolonies in the presence of 1µM ouabain (at least∼100colonies per transfection experiment). In addition, the
FIGURE 5: Effect of potassium onR2LN andR1RD activity at 1µM ATP. Membranes were from the same preparation used togenerate panels B and C of Figure 2. (A) Effect of 1µM ATP and0 mM KCl on ratio ofR1RD to R2LN Na,K-ATPase activity inmembranes prepared from rat muscle. Data were least-squares fittedto a two-component ouabain inhibition curve as described in thelegend of Figure 2. Data are means( SE of three independentmeasurements and are plotted as a percentage of the total Na,K-ATPase activity defined by the optimal curve fit, 50.15( 0.90nmol of Pi mg-1 min-1 (mean( SD). (B)R1RD andR2LN activityas a function of potassium concentration. Data are means( SE.(i) % R1RD activity in rat kidney membranes, where 100% (n )6) is 117.69( 8.43 nmol of Pi mg-1 min-1. (ii) % total Na,K-ATPase (R1RD andR2LN ) activity in rat muscle membranes (n) 9). (iii) % total Na,K-ATPase activity in rat muscle membranesdue toR1RD, calculated as described in the legend of Figure 4B,using the results of the ouabain titration (part A) combined withthe data for the potassium sensitivity ofR1RD in rat kidneymembranes (i). (iv) %R2LN activity, determined from thedifference between curves ii and iii as described in the legend ofFigure 4B.
FIGURE 6: Effect of KCl on chimericR1RD-R2RD subunits. (A)ChimericR subunits: (i)R2RDNheIR1NcoIR2, (ii) R2RDNheIR1,(iii) R1RDNcoIR2, (iv) R1RDNheI, (v)R1RD, and (vi)R1RD(NheI)-AflIII R2NcoIR1. The chimericR subunits were constructed usingthree restriction sites:AflIII, NcoI, andNheI. The AflIII and NcoIsites are naturally occurring restriction sites located at analogouspositions in the twoR subunit cDNAs. TheAflIII site is locatednear the catalytic aspartyl residue (ratR1, bp 1406, H386; ratR2,bp 1261, H384), and theNcoI site is located near the C-terminusof M5 [rat R1, bp 2435, A729; ratR2, bp 2287, A727; numberingaccording to Shull et al. (10)]. An NheI site at the N-terminus ofM2 (bp 497, flanked by V128 and L129) occurs naturally in therat R2 subunit cDNA. An analogousNheI site (bp 643, flanked byV130 and L131) was introduced into theR1 subunit cDNA by site-directed mutagenesis. Creation of theR1 subunitNheI site resultsin the substitution S132A, alanine being the residue found at thecorresponding position of theR2 subunit. The nomenclature of thevarious R subunits is as follows. The names of the subunitscomprising the various regions of the chimeras and the names ofthe restriction sites used to join them are listed from the N- toC-terminus. (NheI) indicates that anNheI site and S132A substitu-tion are present but that theNheI site was not used to fuse theR1Ν-terminus to the rest of the molecule.R2 subunit sequences aredepicted as solid lines and white rectangles, whereasR1 subunitsequences are depicted as cross-hatched lines and rectangles. Theplasma membrane is indicated in gray, and solid lines denoterestriction sites. (B) Effect of KCl on activity of chimericR subunitsat 1 µM ATP. Chimeric R subunit activity as a function ofpotassium concentration was calculated from the total Na,K-ATPaseactivity in the presence of 10µM ouabain as described in the legendof Figure 4C. The totalΝa,K-ATPase activity in the presence of10 µM ouabain was determined by subtracting the amount of ATPhydrolyzed in the presence of either 0 mM NaCl or 10 mM ouabainfrom the amount of ATP hydrolyzed in the presence of 100 mMNaCl and 10µM ouabain. Data plotted are means( SE. (i) %R2RDNheIR1NcoIR2 activity. The 100% level (n ) 6) is 0.200(0.0095 nmol of Pi mg-1 min-1. In the absence of potassium andouabain, the ratio ofR1QN to R2RDNheIR1NcoIR2 activity is0.683. (ii) % R2RDNheIR1 activity. The 100% level (n ) 6) is0.520( 0.014 nmol of Pi mg-1 min-1. In the absence of potassiumand ouabain, the ratio ofR1QN to R2RDNheIR1 activity is 0.272.(iii) % R1RDNcoIR2 activity. The 100% level (n ) 3) is 0.309(0.020 nmol of Pi mg-1 min-1. In the absence of potassium andouabain, the ratio ofR1QN to R1RDNcoIR2 activity is 0.495. (iv)% R1RDNheI activity. The 100% level (n ) 6) is 0.891( 0.045nmol of Pi mg-1 min-1. In the absence of potassium and ouabain,the ratio ofR1QN to R1RDNheI activity is 0.221. (v) %R1RDactivity. The 100% level (n ) 6) is 0.291( 0.0250 nmol of Pimg-1 min-1. In the absence of potassium and ouabain, the ratio ofR1QN to R1RD activity is 0.912. (vi) %R1RD(NheI)AflII R2NcoIR1activity. The 100% level (n ) 6) is 0.773( 0.028 nmol of Pi mg-1
min-1. In the absence of potassium and ouabain, the ratio ofR1QNto R1RD(NheI)AflII R2NcoIR1 activity is 0.233.
2502 Biochemistry, Vol. 38, No. 8, 1999 Coppi et al.
cultured colonies grew at rates similar to those of coloniesexpressingR1RD and R2RD in media containing 1µMouabain (data not shown). We therefore assumed that theouabain affinities of the various chimericRD subunits werecomparable to those ofR1RD andR2RD.
As shown in Figure 6, analysis of these chimericRsubunits reveals that the effect of potassium at low ATPconcentrations is determined primarily by the interaction ofthe N-terminus and M1-M2 loop with the C-terminal thirdof the R subunit. Substitution of either the C-terminal third[Figure 6A (iii)] or the N-terminus and M1-M2 loop [Figure6A (ii)] of the R1RD subunit with the corresponding piecesof R2RD did not significantly alter potassium inhibition[Figure 6B (ii and iii vs iv and v)]. However, a chimeraconsisting of M2-M5 of the R1 subunit flanked by the N-and C-termini of R2RD, R2RDNheIR1NcoIR2 (i), wasactivated by potassium in a manner reminiscent of intactR2RD [Figure 4B,C (iii)]. Likewise, R1RD(NheI)AflIII-R2NcoIR1 (vi), a chimera consisting of the central third ofR2RD flanked by the N- and C-terminus ofR1RD, wasinhibited by potassium like the intactR1RD subunit [Figures5B (i) and 6B (v)].
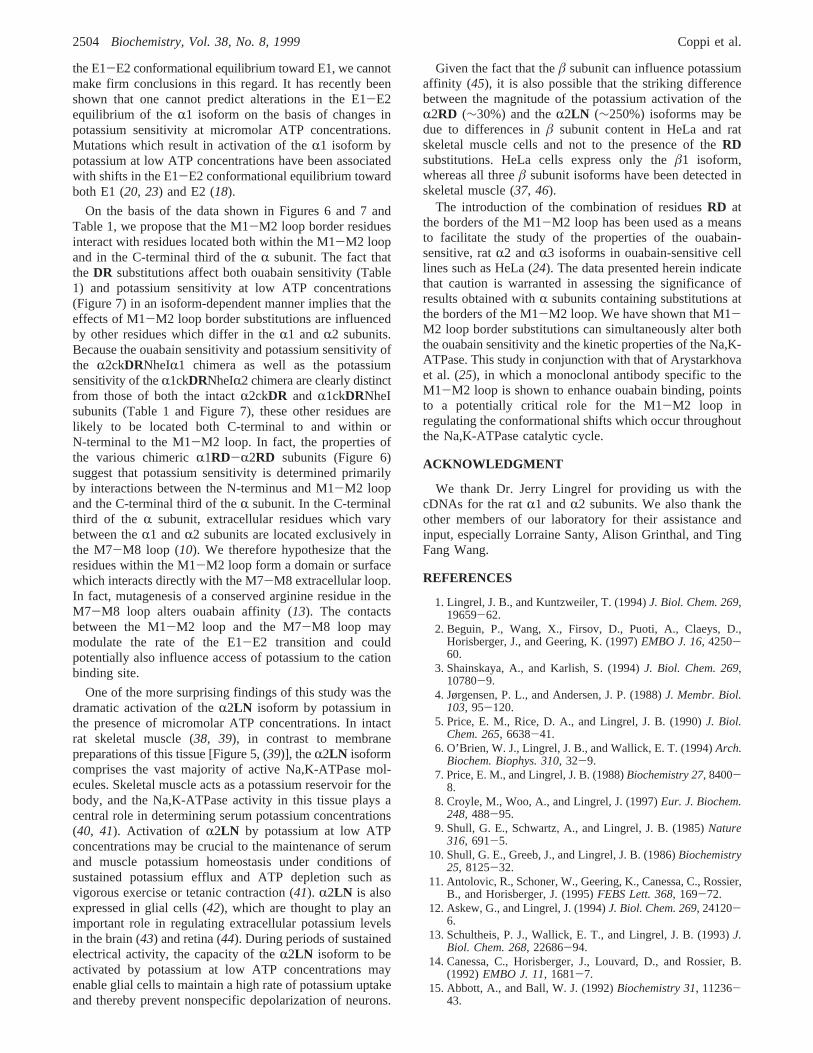
Effect of Potassium onR2DR, R1DR, and ChimericR1DR-R2DR Na,K-ATPase ActiVity at 1µM ATP. Becausethe effects of theDR substitutions on the ouabain sensitivityof theR1 andR2 isoforms were so extreme and unpredictable(Table 1), we investigated the influence of these substitutionson Na,K-ATPase activity as a function of potassium con-centration at low ATP concentrations. As shown in Figure7, the presence of the combination of residuesDR at theborders of the M1-M2 loop of both theR1 andR2 subunitsprofoundly affects Na,K-ATPase activity as a function ofpotassium concentration.R1ckDRNheI (i), in contrast toR1RD [Figures 5B and 6B (v)] andR1RDNheI [Figure 6B(iv)], is activated by potassium. We were equally surprisedto discover thatR2ckDR (ii), unlike R2RD (Figure 4B,C)andR2LN (Figure 5B), is essentially completely inhibitedby potassium. Our analysis of twoR1DR-R2DR chimerasconfirms that inhibition or activation by potassium, likeouabain sensitivity, involves the interaction of the N-terminusand M1-M2 loop with residues located in the remainder ofthe R subunit. The effect of potassium upon both of theR1DR-R2DR hybrids (iii and iv) was distinct from its effecton either intactR1ckDRNheI (i) or R2ckDR (ii). R2ckDRN-heIR1 (iii) underwent a dramatic activation in response tothe addition of potassium, whereasR1ckDRNheIR2 remainedrelatively constant (iv).
In conclusion, the residues at the borders of the M1-M2loop influence both ouabain and potassium sensitivity in acontext-dependent manner.
DISCUSSION
In this study, we compared the effects of two combinationsof charged M1-M2 loop border residues,RD andDR, onouabain affinity within the context of the ratR1, R2, andthree chimericR1-R2 subunits. We report that the sensitivityof the Na,K-ATPase to inhibition by ouabain is dependentnot only upon the identity of the M1-M2 loop borderresidues but also upon the environment into which they areintroduced. Furthermore, the effect of the M1-M2 loopborder residues on ouabain sensitivity involves their interac-
tion with other residues located both C-terminal to and withinor N-terminal to the M1-M2 loop. This result suggested tous that rather than interacting directly with ouabain, theseresidues might influence ouabain sensitivity by destabilizingor altering the E2 intermediate of the Na,K-ATPase catalyticcycle to which ouabain binds preferentially (4). We pro-ceeded to investigate the effects of substitutions at the M1-M2 loop border on the potassium sensitivity of the Na,K-ATPase at low ATP concentrations, because modificationsof regions proximal to the M1-M2 loop have been shownto alter both potassium sensitivity at low ATP concentrationsand the E1-E2 conformational equilibrium (18, 20, 23). Infact, we have found that M1-M2 loop border substitutionscan significantly alter potassium sensitivity at low ATPconcentrations, and that they do so in a context-dependentmanner. To summarize, we have provided additional evi-dence that the M1-M2 loop border residues influenceouabain sensitivity indirectly, and we have demonstrated thatthe M1-M2 loop plays an important role in determining thecatalytic properties of the Na,K-ATPase.
We found no noticeable correlation between ouabainaffinity and the effect of potassium on Na,K-ATPase activityat micromolar ATP concentrations (Table 1 vs Figures 4, 5,and 7). Although we suspect that substitutions at the M1-M2 loop border may influence ouabain affinity by shifting
FIGURE 7: Effect of KCl on the Na,K-ATPase activity ofR2ckDR,R1ckDRNheI, and chimericR1DR-R2DR subunits at 1µM ATP.The nomenclature and structure of the variousR subunits aredescribed in the legend of Figure 1A. Data are means( SE. ATPhydrolysis that was not due to the Na,K-ATPase was assessed at 0mM KCl and 0 mM NaCl. Except forR2ckDR, the effect of KClon the variousR subunits was determined as described in the legendof Figure 4C, by subtracting theR1QN activity that is resistant to10 µM at each potassium concentration. Because the ouabainaffinities of R2ckDR andR1QN are very similar,R2DR activityas a function of potassium concentration was determined asdescribed in the legend of Figure 4B, by subtracting theR1QNactivity from the total Na,K-ATPase activity. (i) %R1ckDRNheIactivity. Data were derived from two ouabain-resistant colonies.The 100% level is 2.600( 0.096 nmol of Pi mg-1 min-1 (n ) 3)and 0.763( 0.025 nmol of Pi mg-1 min-1 (n ) 5) for the first andsecond colony, respectively. In the absence of potassium andouabain, the ratio ofR1QN to R1DRNheI activity is 0.127 for thefirst colony and 0.183 for the second. (ii) %R2ckDR activity. The100% level (n ) 6) is 0.626( 0.024 nmol of Pi mg-1 min-1. Inthe absence of potassium and ouabain, the ratio ofR1QN toR2ckDR to total Na,K-ATPase activity is 1.233. (iii) %R2ck-DRNheIR1 activity. The 100% level (n ) 6) is 0.642( 0.031 nmolof Pi mg-1 min-1. In the absence of potassium and ouabain, theratio of R1QN to R2ckDRNheIR1 activity is 0.158. (iv) %R1ckDRNheIR2 activity. The 100% level (n ) 6) is 0.485( 0.042nmol of Pi mg-1 min-1. In the absence of potassium and ouabain,the ratio ofR1QN to R1ckDRNheIR2 activity is 1.425.
Isoform-Specific Effects of Na,K-ATPase Mutations Biochemistry, Vol. 38, No. 8, 19992503
the E1-E2 conformational equilibrium toward E1, we cannotmake firm conclusions in this regard. It has recently beenshown that one cannot predict alterations in the E1-E2equilibrium of theR1 isoform on the basis of changes inpotassium sensitivity at micromolar ATP concentrations.Mutations which result in activation of theR1 isoform bypotassium at low ATP concentrations have been associatedwith shifts in the E1-E2 conformational equilibrium towardboth E1 (20, 23) and E2 (18).
On the basis of the data shown in Figures 6 and 7 andTable 1, we propose that the M1-M2 loop border residuesinteract with residues located both within the M1-M2 loopand in the C-terminal third of theR subunit. The fact thatthe DR substitutions affect both ouabain sensitivity (Table1) and potassium sensitivity at low ATP concentrations(Figure 7) in an isoform-dependent manner implies that theeffects of M1-M2 loop border substitutions are influencedby other residues which differ in theR1 andR2 subunits.Because the ouabain sensitivity and potassium sensitivity ofthe R2ckDRNheIR1 chimera as well as the potassiumsensitivity of theR1ckDRNheIR2 chimera are clearly distinctfrom those of both the intactR2ckDR and R1ckDRNheIsubunits (Table 1 and Figure 7), these other residues arelikely to be located both C-terminal to and within orN-terminal to the M1-M2 loop. In fact, the properties ofthe various chimericR1RD-R2RD subunits (Figure 6)suggest that potassium sensitivity is determined primarilyby interactions between the N-terminus and M1-M2 loopand the C-terminal third of theR subunit. In the C-terminalthird of the R subunit, extracellular residues which varybetween theR1 andR2 subunits are located exclusively inthe M7-M8 loop (10). We therefore hypothesize that theresidues within the M1-M2 loop form a domain or surfacewhich interacts directly with the M7-M8 extracellular loop.In fact, mutagenesis of a conserved arginine residue in theM7-M8 loop alters ouabain affinity (13). The contactsbetween the M1-M2 loop and the M7-M8 loop maymodulate the rate of the E1-E2 transition and couldpotentially also influence access of potassium to the cationbinding site.
One of the more surprising findings of this study was thedramatic activation of theR2LN isoform by potassium inthe presence of micromolar ATP concentrations. In intactrat skeletal muscle (38, 39), in contrast to membranepreparations of this tissue [Figure 5, (39)], theR2LN isoformcomprises the vast majority of active Na,K-ATPase mol-ecules. Skeletal muscle acts as a potassium reservoir for thebody, and the Na,K-ATPase activity in this tissue plays acentral role in determining serum potassium concentrations(40, 41). Activation of R2LN by potassium at low ATPconcentrations may be crucial to the maintenance of serumand muscle potassium homeostasis under conditions ofsustained potassium efflux and ATP depletion such asvigorous exercise or tetanic contraction (41). R2LN is alsoexpressed in glial cells (42), which are thought to play animportant role in regulating extracellular potassium levelsin the brain (43) and retina (44). During periods of sustainedelectrical activity, the capacity of theR2LN isoform to beactivated by potassium at low ATP concentrations mayenable glial cells to maintain a high rate of potassium uptakeand thereby prevent nonspecific depolarization of neurons.
Given the fact that theâ subunit can influence potassiumaffinity (45), it is also possible that the striking differencebetween the magnitude of the potassium activation of theR2RD (∼30%) and theR2LN (∼250%) isoforms may bedue to differences inâ subunit content in HeLa and ratskeletal muscle cells and not to the presence of theRDsubstitutions. HeLa cells express only theâ1 isoform,whereas all threeâ subunit isoforms have been detected inskeletal muscle (37, 46).
The introduction of the combination of residuesRD atthe borders of the M1-M2 loop has been used as a meansto facilitate the study of the properties of the ouabain-sensitive, ratR2 andR3 isoforms in ouabain-sensitive celllines such as HeLa (24). The data presented herein indicatethat caution is warranted in assessing the significance ofresults obtained withR subunits containing substitutions atthe borders of the M1-M2 loop. We have shown that M1-M2 loop border substitutions can simultaneously alter boththe ouabain sensitivity and the kinetic properties of the Na,K-ATPase. This study in conjunction with that of Arystarkhovaet al. (25), in which a monoclonal antibody specific to theM1-M2 loop is shown to enhance ouabain binding, pointsto a potentially critical role for the M1-M2 loop inregulating the conformational shifts which occur throughoutthe Na,K-ATPase catalytic cycle.
ACKNOWLEDGMENT
We thank Dr. Jerry Lingrel for providing us with thecDNAs for the ratR1 andR2 subunits. We also thank theother members of our laboratory for their assistance andinput, especially Lorraine Santy, Alison Grinthal, and TingFang Wang.
REFERENCES
1. Lingrel, J. B., and Kuntzweiler, T. (1994)J. Biol. Chem. 269,19659-62.
2. Beguin, P., Wang, X., Firsov, D., Puoti, A., Claeys, D.,Horisberger, J., and Geering, K. (1997)EMBO J. 16, 4250-60.
3. Shainskaya, A., and Karlish, S. (1994)J. Biol. Chem. 269,10780-9.
4. Jørgensen, P. L., and Andersen, J. P. (1988)J. Membr. Biol.103, 95-120.
5. Price, E. M., Rice, D. A., and Lingrel, J. B. (1990)J. Biol.Chem. 265, 6638-41.
6. O’Brien, W. J., Lingrel, J. B., and Wallick, E. T. (1994)Arch.Biochem. Biophys. 310, 32-9.
7. Price, E. M., and Lingrel, J. B. (1988)Biochemistry 27, 8400-8.
8. Croyle, M., Woo, A., and Lingrel, J. (1997)Eur. J. Biochem.248, 488-95.
9. Shull, G. E., Schwartz, A., and Lingrel, J. B. (1985)Nature316, 691-5.
10. Shull, G. E., Greeb, J., and Lingrel, J. B. (1986)Biochemistry25, 8125-32.
11. Antolovic, R., Schoner, W., Geering, K., Canessa, C., Rossier,B., and Horisberger, J. (1995)FEBS Lett. 368, 169-72.
12. Askew, G., and Lingrel, J. (1994)J. Biol. Chem. 269, 24120-6.
13. Schultheis, P. J., Wallick, E. T., and Lingrel, J. B. (1993)J.Biol. Chem. 268, 22686-94.
14. Canessa, C., Horisberger, J., Louvard, D., and Rossier, B.(1992)EMBO J. 11, 1681-7.
15. Abbott, A., and Ball, W. J. (1992)Biochemistry 31, 11236-43.
2504 Biochemistry, Vol. 38, No. 8, 1999 Coppi et al.

16. Kirley, T., and Peng, M. (1991)J. Biol. Chem. 266, 19953-7.
17. Arguello, J. M., and Lingrel, J. B. (1995)J. Biol. Chem. 279,22764-71.
18. Blostein, R., Wilczynska, A., Karlish, S., Arguello, J., andLingrel, J. (1997)J. Biol. Chem. 272, 24987-93.
19. Burns, E., Nicholas, R., and Price, E. (1996)J. Biol. Chem.271, 15879-83.
20. Daly, S. E., Blostein, R., and Lane, L. K. (1997)J. Biol. Chem.272, 6341-7.
21. Wierzbicki, W., and Blostein, R. (1993)Proc. Natl. Acad. Sci.U.S.A. 90, 70-4.
22. Daly, S., Lane, L., and Blostein, R. (1994)J. Biol. Chem. 269,23944-8.
23. Daly, S., Lane, L., and Blostein, R. (1996)J. Biol. Chem. 271,23683-9.
24. Jewell, E. A., and Lingrel, J. B. (1991)J. Biol. Chem. 266,16925-30.
25. Arystarkhova, E., Gasparian, M., Modyanov, N., and Swead-ner, K. (1992)J. Biol. Chem. 267, 13694-701.
26. O’Brien, W. J., Wallick, E. T., and Lingrel, J. B. (1993)J.Biol. Chem. 268, 7707-12.
27. Kaufman, R. J., Davies, M. V., Pathak, V. K., and Hershey,J. W. (1989)Mol. Cell Biol. 9, 946-58.
28. Coppi, M. V., and Guidotti, G. (1997)Arch. Biochem. Biophys.346, 312-21.
29. Kunkel, T. A., Roberts, J. D., and Zakour, R. A. (1987)Methods Enzymol. 154, 367-82.
30. Kozak, M. (1987)J. Mol. Biol. 196, 947-50.31. Peterson, G. L. (1977)Anal. Biochem. 83, 346-56.
32. Barchi, R. L., Weigele, J. B., Chalikian, D. M., and Murphy,L. E. (1979)Biochim. Biophys. Acta 550, 59-76.
33. Jørgensen, P. L. (1974)Biochim. Biophys. Acta 356, 53-67.34. Lanzetta, P. A., Alvarez, L. J., Reinach, P. S., and Candia, O.
A. (1979)Anal. Biochem. 100, 95-7.35. Pressley, T. A., Haber, R. S., Loeb, J. N., Edelman, I. S., and
Ismail-Beigi, F. (1986)J. Gen. Physiol. 87, 591-606.36. Burgener-Kairuz, P., Horisberger, J., Geering, K., and Rossier,
B. (1991)FEBS Lett. 290, 83-6.37. Hundal, H. S., Marette, A., Mitsumoto, Y., Ramlal, T.,
Blostein, R., and Klip, A. (1992)J. Biol. Chem. 267, 5040-3.
38. Clausen, T., and Hansen, O. (1977)J. Physiol. 270, 415-30.39. Hsu, Y. M., and Guidotti, G. (1991)J. Biol. Chem. 266, 427-
33.40. DeFronzo, R. A., and Bia, M. (1985) inThe Kidney, Physiol-
ogy and Pathophysiology(Seldin, D. W., and Giebisch, G.,Eds.) pp 1179-206, Raven, New York.
41. Clausen, T. (1990)News Physiol. Sci. 5, 148-51.42. McGrail, K. M., Phillips, J. M., and Sweadner, K. J. (1991)
J. Neurosci. 11, 381-91.43. Amedee, T., Robert, A., and Coles, J. (1997)Glia 21, 46-
55.44. Kusaka, S., and Puro, D. G. (1997)J. Physiol. 500, 593-
604.45. Jaisser, F., Jaunin, J., Geering, K., Rossier, B. C., and
Horisberger, J. D. (1994)J. Gen. Physiol. 103, 605-23.46. Arystarkhova, E., and Sweadner, K. J. (1997)J. Biol. Chem.
272, 22405-8.
BI982180J
Isoform-Specific Effects of Na,K-ATPase Mutations Biochemistry, Vol. 38, No. 8, 19992505