Irina Rish, Research Staff, IBM T.J. Watson Research Center at MLconf NYC
23
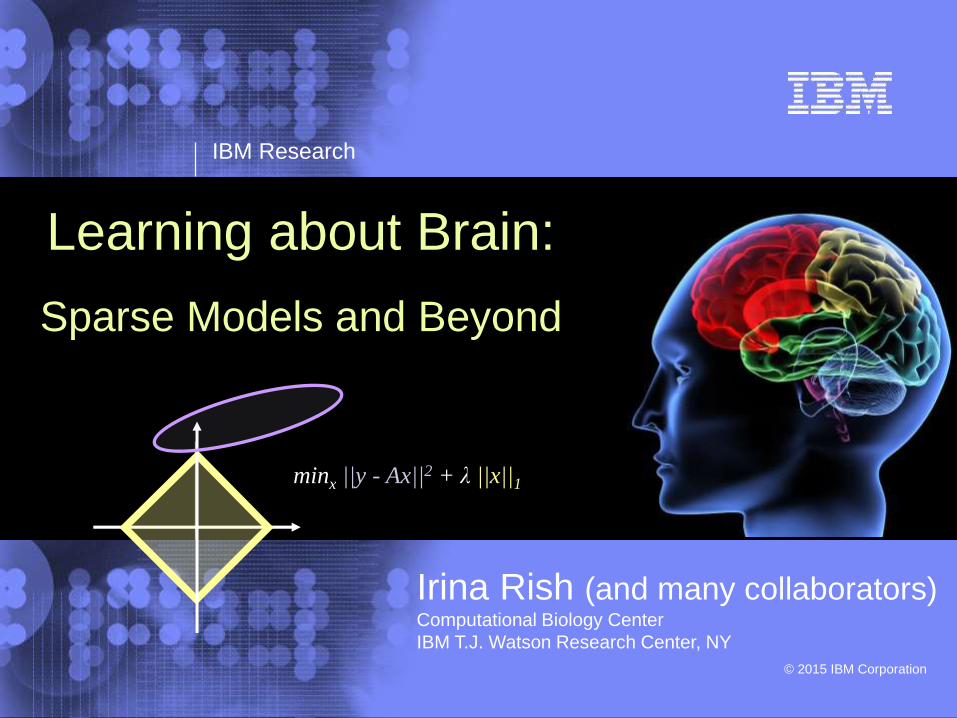
IBM Research © 2014 IBM Corporation © 2002 IBM Corporation IBM Research © 2015 IBM Corporation Learning about Brain: Sparse Models and Beyond Irina Rish (and many collaborators) Computational Biology Center IBM T.J. Watson Research Center, NY min x ||y - Ax|| 2 + λ ||x|| 1
-
Upload
sessionsevents -
Category
Technology
-
view
415 -
download
1
Transcript of Irina Rish, Research Staff, IBM T.J. Watson Research Center at MLconf NYC
IBM Research
© 2014 IBM Corporation
© 2002 IBM Corporation
IBM Research
© 2015 IBM Corporation
Learning about Brain:
Sparse Models and Beyond
Irina Rish (and many collaborators) Computational Biology Center
IBM T.J. Watson Research Center, NY
minx ||y - Ax||2 + λ ||x||1
IBM Research
© 2014 IBM Corporation
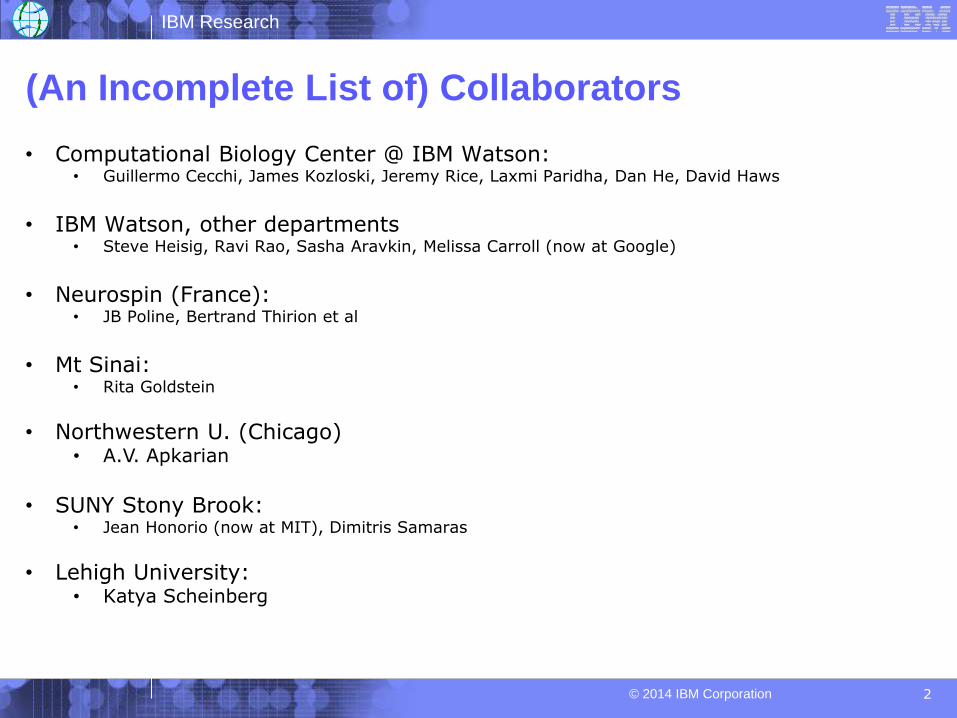
(An Incomplete List of) Collaborators
2
• Computational Biology Center @ IBM Watson:• Guillermo Cecchi, James Kozloski, Jeremy Rice, Laxmi Paridha, Dan He, David Haws
• IBM Watson, other departments• Steve Heisig, Ravi Rao, Sasha Aravkin, Melissa Carroll (now at Google)
• Neurospin (France): • JB Poline, Bertrand Thirion et al
• Mt Sinai: • Rita Goldstein
• Northwestern U. (Chicago)• A.V. Apkarian
• SUNY Stony Brook: • Jean Honorio (now at MIT), Dimitris Samaras
• Lehigh University:• Katya Scheinberg
IBM Research
© 2014 IBM Corporation
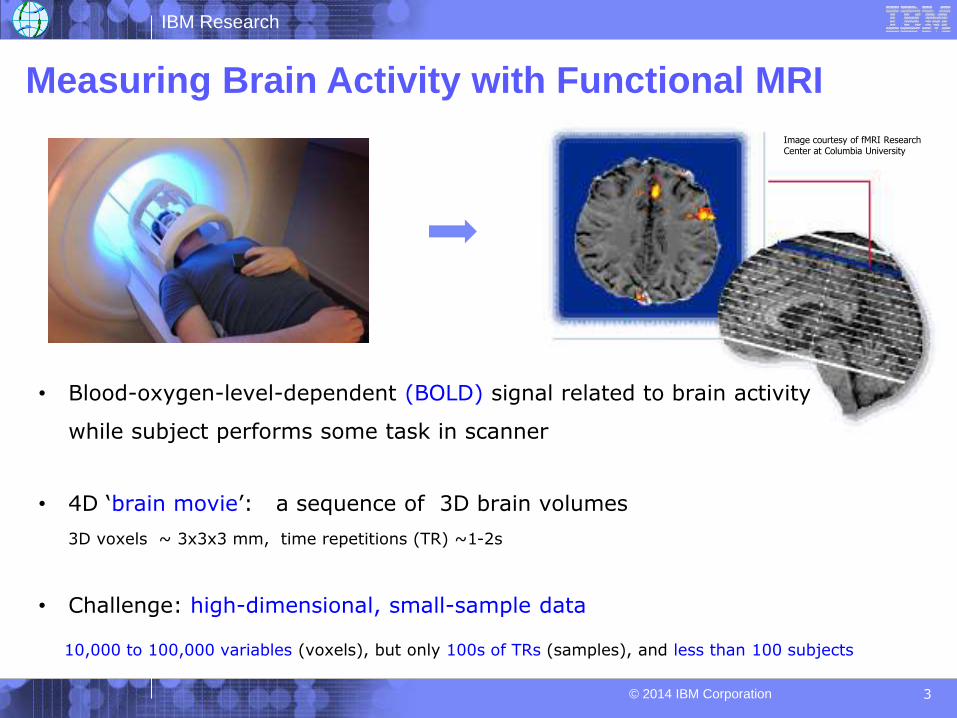
Measuring Brain Activity with Functional MRI
3
Image courtesy of fMRI Research Center at Columbia University
• Blood-oxygen-level-dependent (BOLD) signal related to brain activity
while subject performs some task in scanner
• 4D ‘brain movie’: a sequence of 3D brain volumes
3D voxels ~ 3x3x3 mm, time repetitions (TR) ~1-2s
• Challenge: high-dimensional, small-sample data
10,000 to 100,000 variables (voxels), but only 100s of TRs (samples), and less than 100 subjects
IBM Research
© 2014 IBM Corporation
Data from
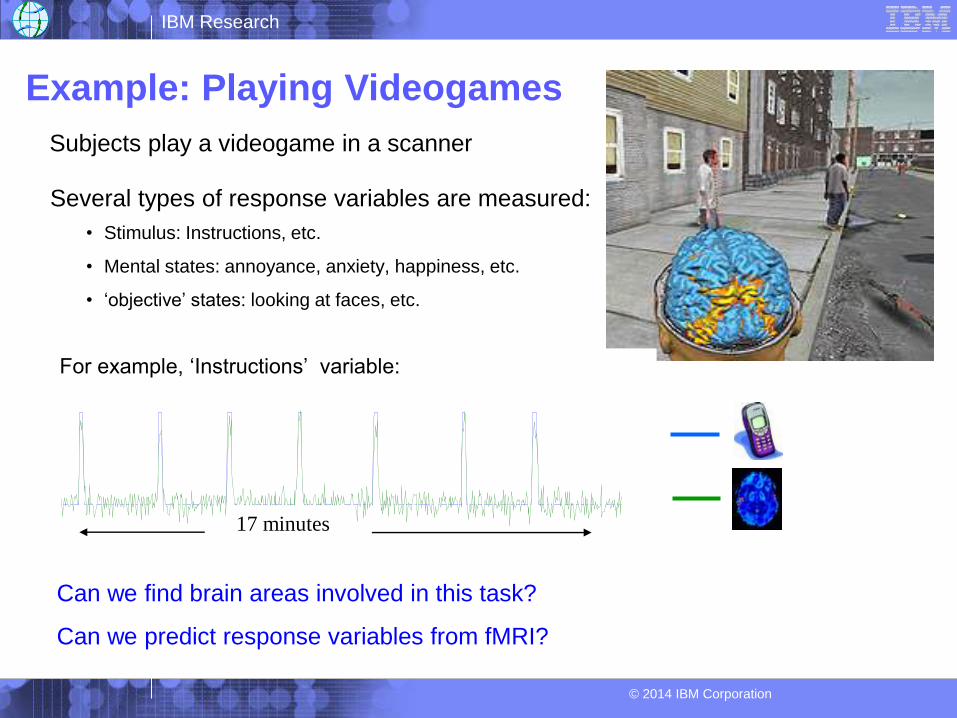
[Baliki, Geha, Apkarian 2008]Example: Playing Videogames
Subjects play a videogame in a scanner
Several types of response variables are measured:
• Stimulus: Instructions, etc.
• Mental states: annoyance, anxiety, happiness, etc.
• ‘objective’ states: looking at faces, etc.
17 minutes
For example, ‘Instructions’ variable:
Can we find brain areas involved in this task?
Can we predict response variables from fMRI?
IBM Research
© 2014 IBM Corporation
n
Data from
[Baliki, Geha, Apkarian 2008]
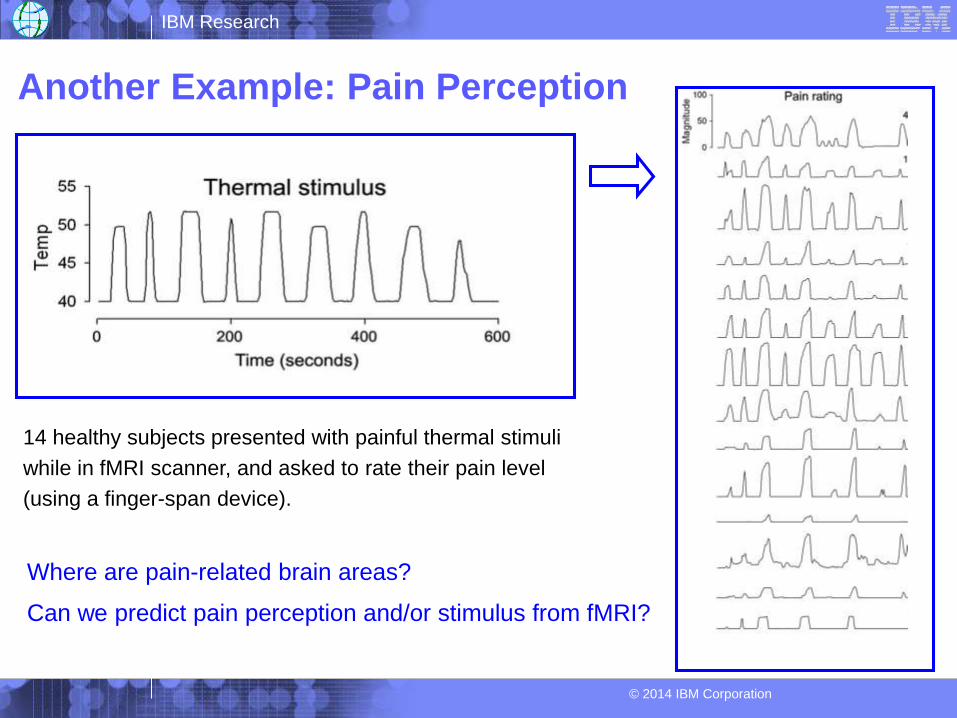
14 healthy subjects presented with painful thermal stimuli
while in fMRI scanner, and asked to rate their pain level
(using a finger-span device).
Another Example: Pain Perception
Where are pain-related brain areas?
Can we predict pain perception and/or stimulus from fMRI?
IBM Research
© 2014 IBM Corporation
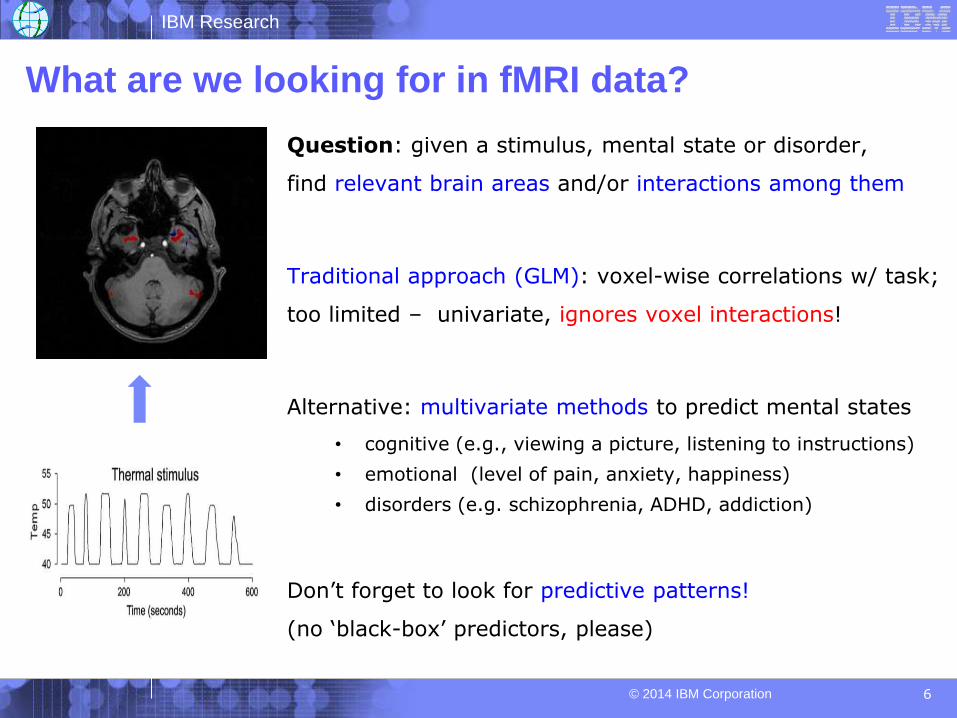
What are we looking for in fMRI data?
6
Question: given a stimulus, mental state or disorder,
find relevant brain areas and/or interactions among them
Traditional approach (GLM): voxel-wise correlations w/ task;
too limited – univariate, ignores voxel interactions!
Alternative: multivariate methods to predict mental states
• cognitive (e.g., viewing a picture, listening to instructions)
• emotional (level of pain, anxiety, happiness)
• disorders (e.g. schizophrenia, ADHD, addiction)
Don’t forget to look for predictive patterns!
(no ‘black-box’ predictors, please)
IBM Research
© 2014 IBM Corporation
Interpretable predictive models
7
Feature Construction: - feature engineering (e.g., network properties)
[Rish et al, PLoS One 2013], [Cecchi et al, NIPS 2009]
[Rish et al, SPIE Med.Imaging 2012]
Feature Selection[Rish et al, SPIE Med.Imaging 2012], [Honorio et al, AISTATS 2012],
[Rish et al, Brain Informatics 2010],[Carroll et al, Neuroimage 2009]
- automated feature extraction
(e.g., dictionary learning, deep learning, etc)
[Rish et al, SfN 2011], [Rish et al, ICML 2008], ongoing work
Sparse regression and sparse networks
Y1
U
YK
…
X1 XD
…
V1Wk
W1
‘Biomarkers’
Predictive
Features
+
++
+- -
--
-
Predictive Model
mental
disorder
healthy
IBM Research
© 2014 IBM Corporation
Data from
[Baliki, Geha, Apkarian 2008]
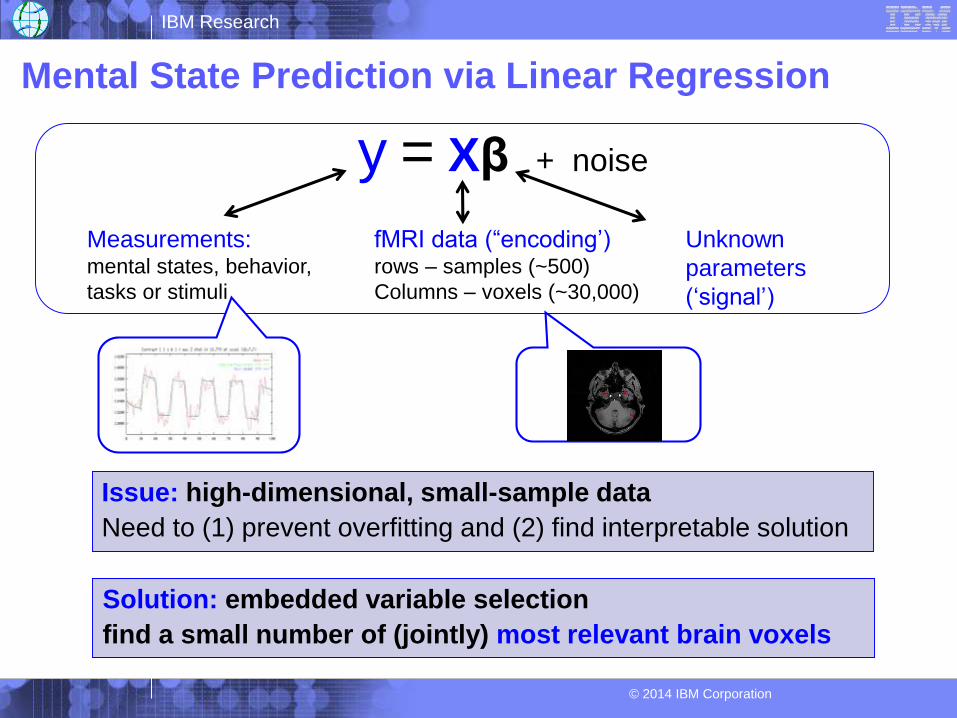
Mental State Prediction via Linear Regression
y = Xβ + noise
fMRI data (“encoding’)rows – samples (~500)
Columns – voxels (~30,000)
Unknown
parameters
(‘signal’)
Measurements:mental states, behavior,
tasks or stimuli
Solution: embedded variable selection
find a small number of (jointly) most relevant brain voxels
Issue: high-dimensional, small-sample data
Need to (1) prevent overfitting and (2) find interpretable solution
IBM Research
© 2014 IBM Corporation
Data from
[Baliki, Geha, Apkarian 2008]
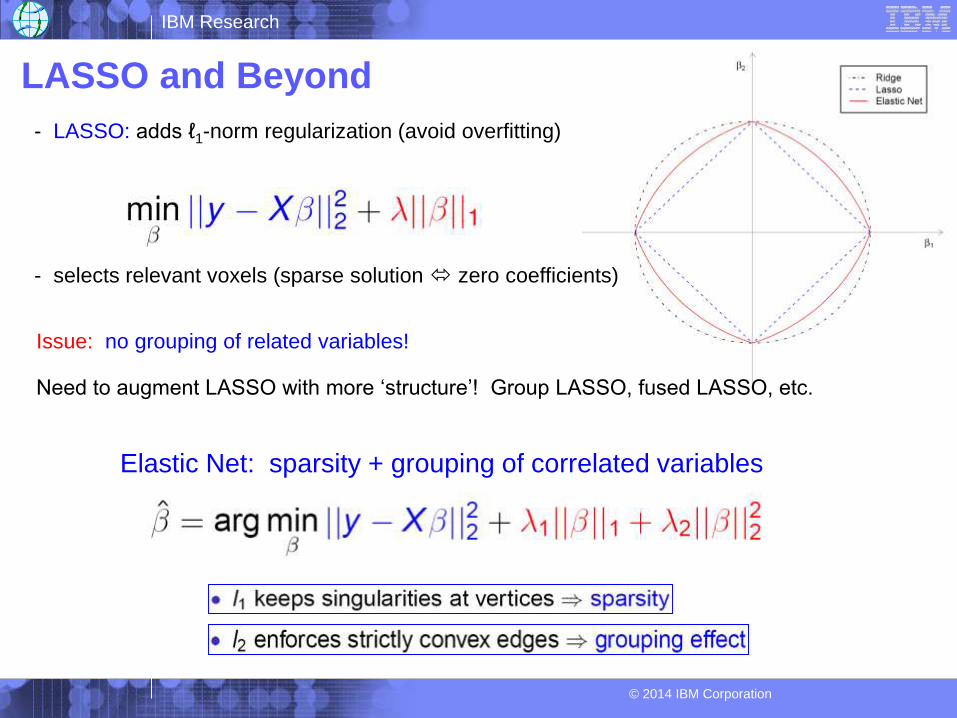
LASSO and Beyond
- LASSO: adds ℓ1-norm regularization (avoid overfitting)
- selects relevant voxels (sparse solution zero coefficients)
Issue: no grouping of related variables!
Need to augment LASSO with more ‘structure’! Group LASSO, fused LASSO, etc.
Elastic Net: sparsity + grouping of correlated variables
IBM Research
© 2014 IBM Corporation
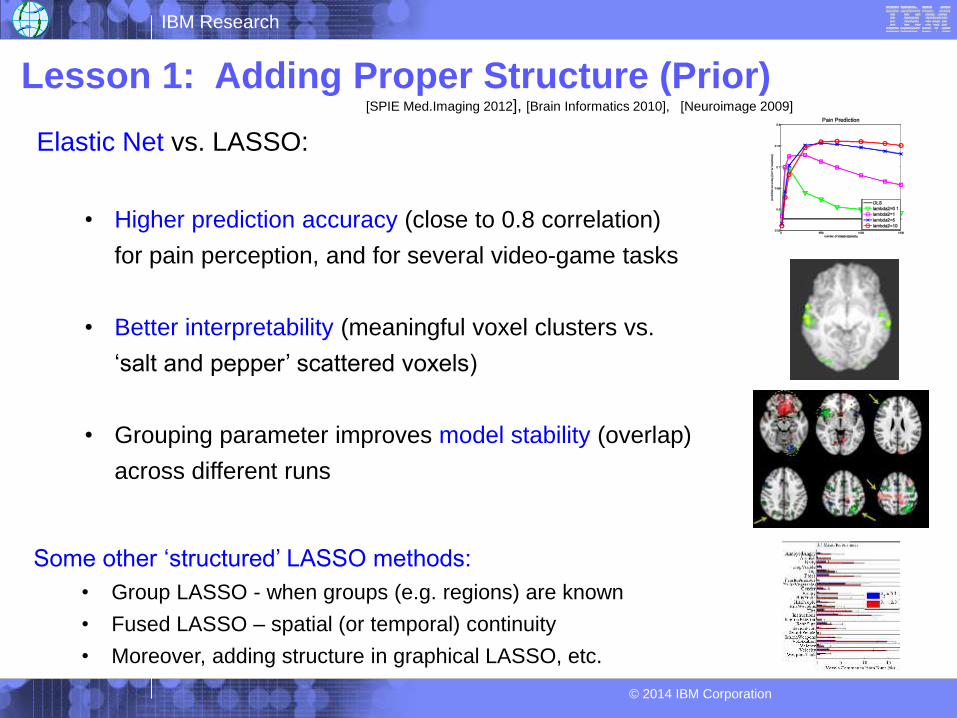
Lesson 1: Adding Proper Structure (Prior)
Elastic Net vs. LASSO:
• Higher prediction accuracy (close to 0.8 correlation)
for pain perception, and for several video-game tasks
• Better interpretability (meaningful voxel clusters vs.
‘salt and pepper’ scattered voxels)
• Grouping parameter improves model stability (overlap)
across different runs
Some other ‘structured’ LASSO methods:
• Group LASSO - when groups (e.g. regions) are known
• Fused LASSO – spatial (or temporal) continuity
• Moreover, adding structure in graphical LASSO, etc.
[SPIE Med.Imaging 2012], [Brain Informatics 2010], [Neuroimage 2009]
IBM Research
© 2014 IBM Corporation
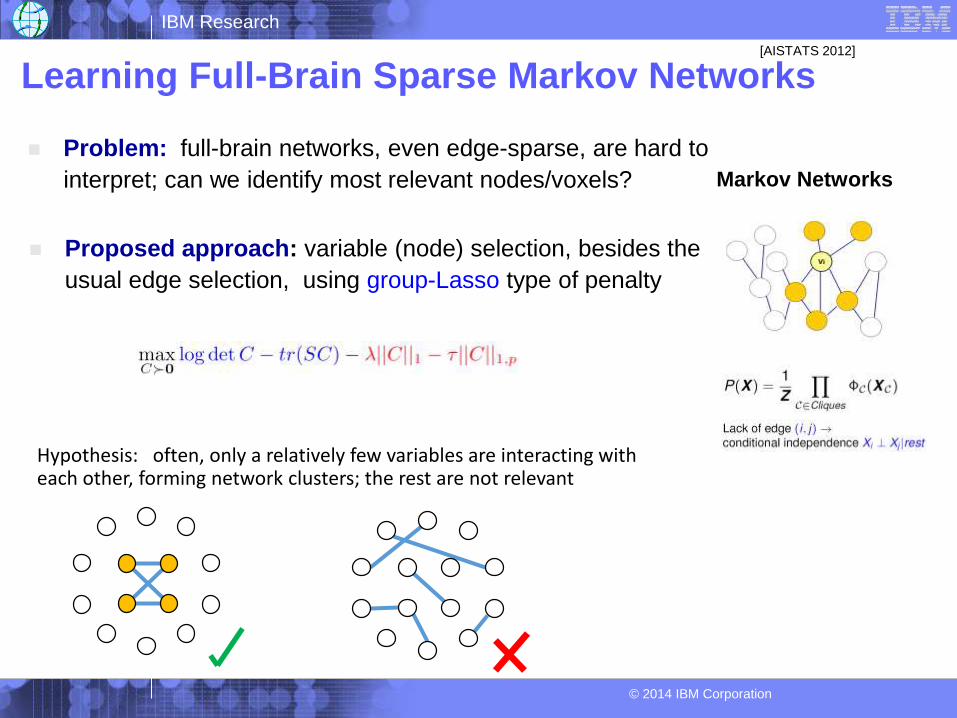
Learning Full-Brain Sparse Markov Networks
Problem: full-brain networks, even edge-sparse, are hard to
interpret; can we identify most relevant nodes/voxels?
Proposed approach: variable (node) selection, besides the
usual edge selection, using group-Lasso type of penalty
Markov Networks
Hypothesis: often, only a relatively few variables are interacting with each other, forming network clusters; the rest are not relevant
[AISTATS 2012]
IBM Research
© 2014 IBM Corporation
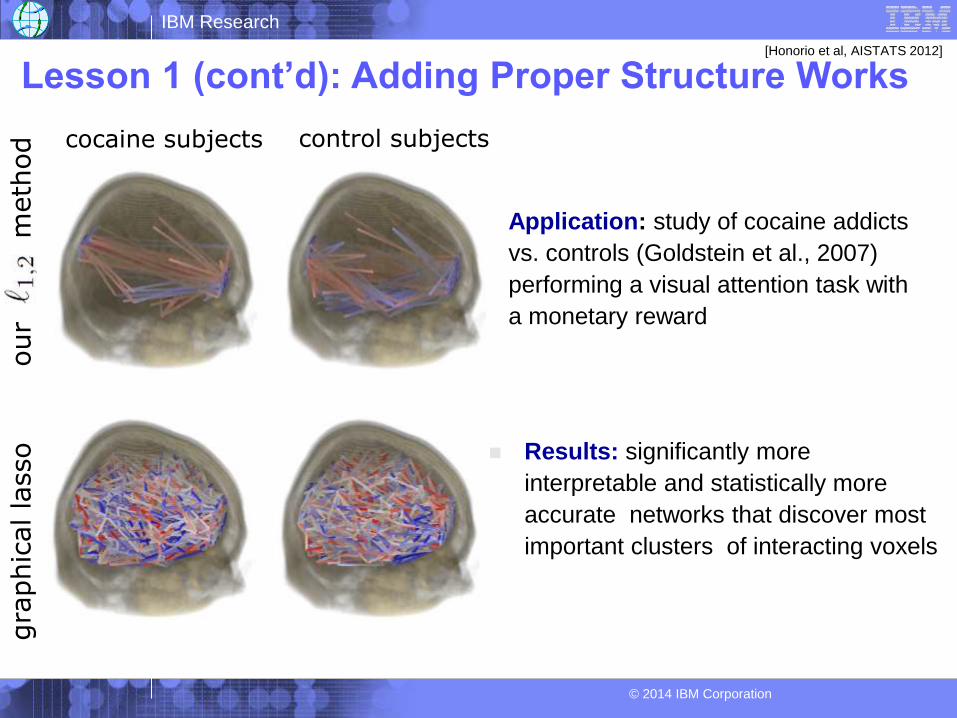
Lesson 1 (cont’d): Adding Proper Structure Works
Application: study of cocaine addicts
vs. controls (Goldstein et al., 2007)
performing a visual attention task with
a monetary reward
Results: significantly more
interpretable and statistically more
accurate networks that discover most
important clusters of interacting voxels
cocaine subjects control subjects
gra
phic
alla
sso
our
meth
od
[Honorio et al, AISTATS 2012]
IBM Research
© 2014 IBM Corporation
Lesson 2: Data-Driven + Analytical Models
• Dynamical model (1st order, only 3 parameters) captures inter-
subject variability in pain response given stimulus
• Stimulus not available? Predict from fMRI, then apply the model!
Va
ryin
g P
ain
Pe
rce
ptio
n
Incorporating nonlinear dynamical model into sparse learning (via hidden stimulus variable)
improves over ‘direct’ sparse regression – due to very high accuracy of analytical model !
[PLoS Comp Bio 2012]
IBM Research
© 2014 IBM Corporation
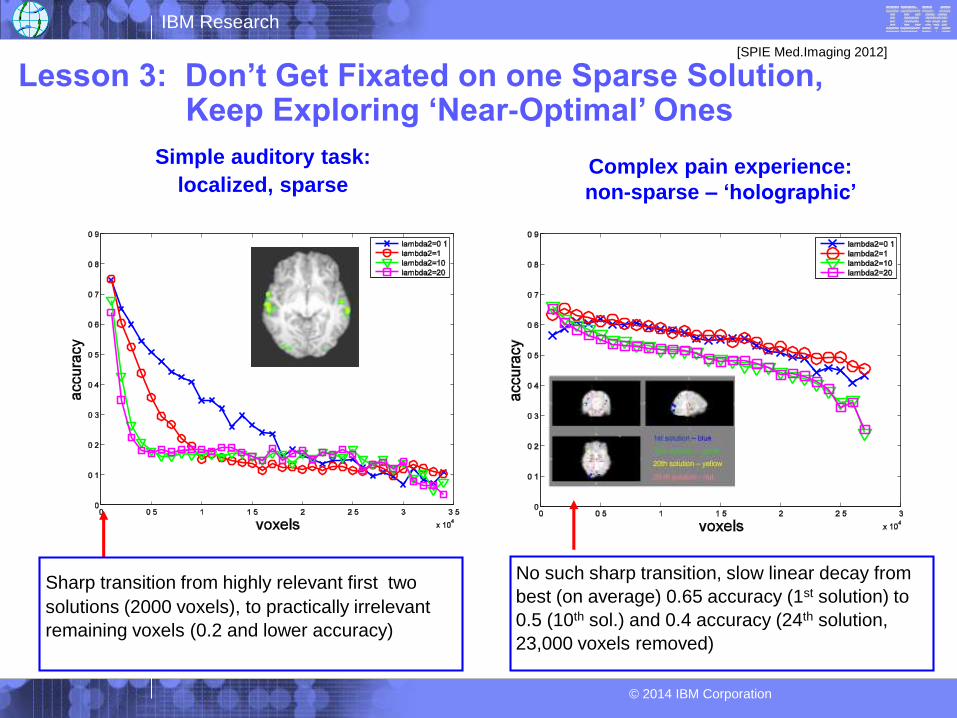
Lesson 3: Don’t Get Fixated on one Sparse Solution,Keep Exploring ‘Near-Optimal’ Ones
Simple auditory task:
localized, sparseComplex pain experience:
non-sparse – ‘holographic’
Sharp transition from highly relevant first two
solutions (2000 voxels), to practically irrelevant
remaining voxels (0.2 and lower accuracy)
No such sharp transition, slow linear decay from
best (on average) 0.65 accuracy (1st solution) to
0.5 (10th sol.) and 0.4 accuracy (24th solution,
23,000 voxels removed)
[SPIE Med.Imaging 2012]
IBM Research
© 2014 IBM Corporation
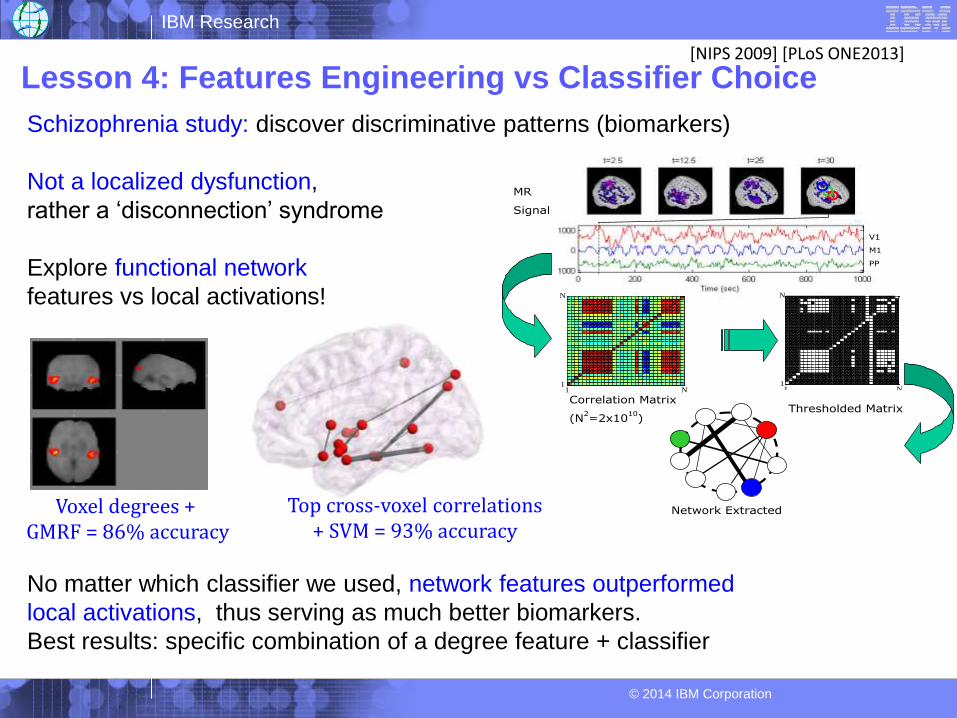
Schizophrenia study: discover discriminative patterns (biomarkers)
Not a localized dysfunction,
rather a ‘disconnection’ syndrome
Explore functional network
features vs local activations!
No matter which classifier we used, network features outperformed
local activations, thus serving as much better biomarkers.
Best results: specific combination of a degree feature + classifier
Network Extracted
Correlation Matrix
(N2=2x10
10)
Thresholded Matrix
MR
Signal
M1
V1
PP
1 N1
N
-0.5
0
0.5
1
1 N1
N
Lesson 4: Features Engineering vs Classifier Choice
Voxel degrees + GMRF = 86% accuracy
Top cross-voxel correlations + SVM = 93% accuracy
[NIPS 2009] [PLoS ONE2013]
IBM Research
© 2014 IBM Corporation
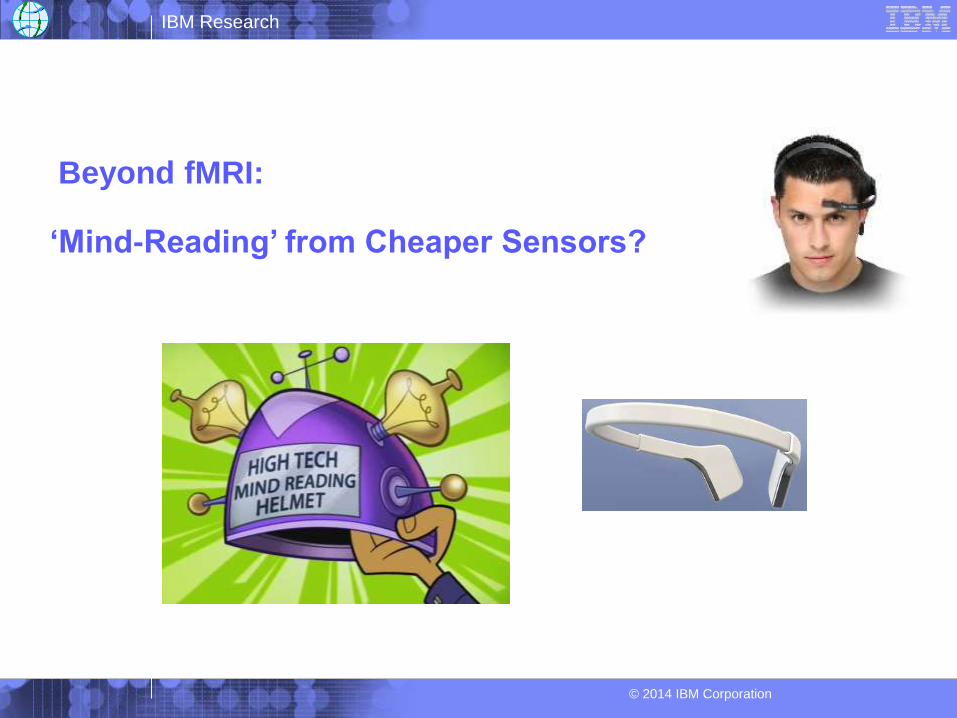
Beyond fMRI:
‘Mind-Reading’ from Cheaper Sensors?
IBM Research
© 2014 IBM Corporation
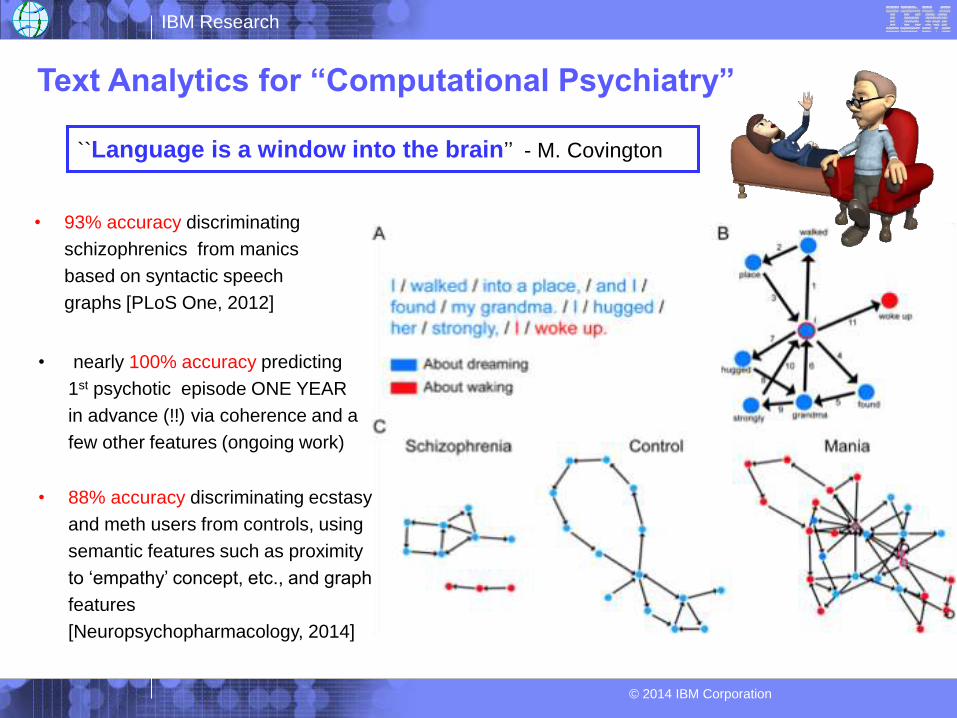
Text Analytics for “Computational Psychiatry”
``Language is a window into the brain’’ - M. Covington
• 93% accuracy discriminating
schizophrenics from manics
based on syntactic speech
graphs [PLoS One, 2012]
• nearly 100% accuracy predicting
1st psychotic episode ONE YEAR
in advance (!!) via coherence and a
few other features (ongoing work)
• 88% accuracy discriminating ecstasy
and meth users from controls, using
semantic features such as proximity
to ‘empathy’ concept, etc., and graph
features
[Neuropsychopharmacology, 2014]
IBM Research
© 2014 IBM Corporation
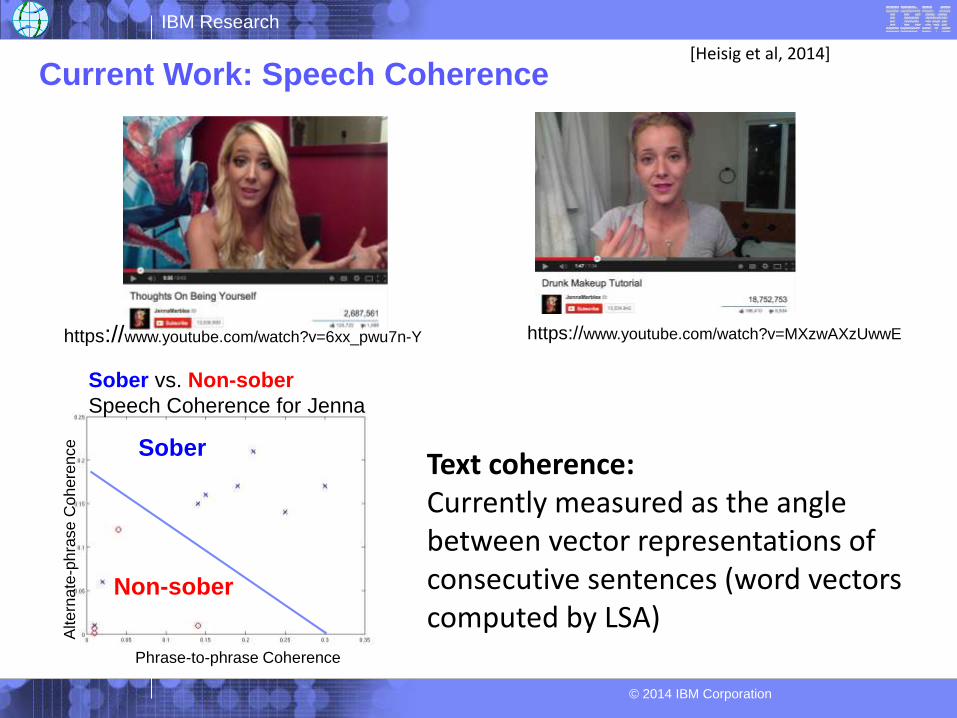
Current Work: Speech Coherence
Text coherence: Currently measured as the angle between vector representations of consecutive sentences (word vectors computed by LSA)
https://www.youtube.com/watch?v=MXzwAXzUwwEhttps://www.youtube.com/watch?v=6xx_pwu7n-Y
Sober vs. Non-sober
Speech Coherence for Jenna
Phrase-to-phrase Coherence
Alte
rna
te-p
hra
se
Co
here
nce
Non-sober
Sober
[Heisig et al, 2014]
IBM Research
© 2014 IBM Corporation
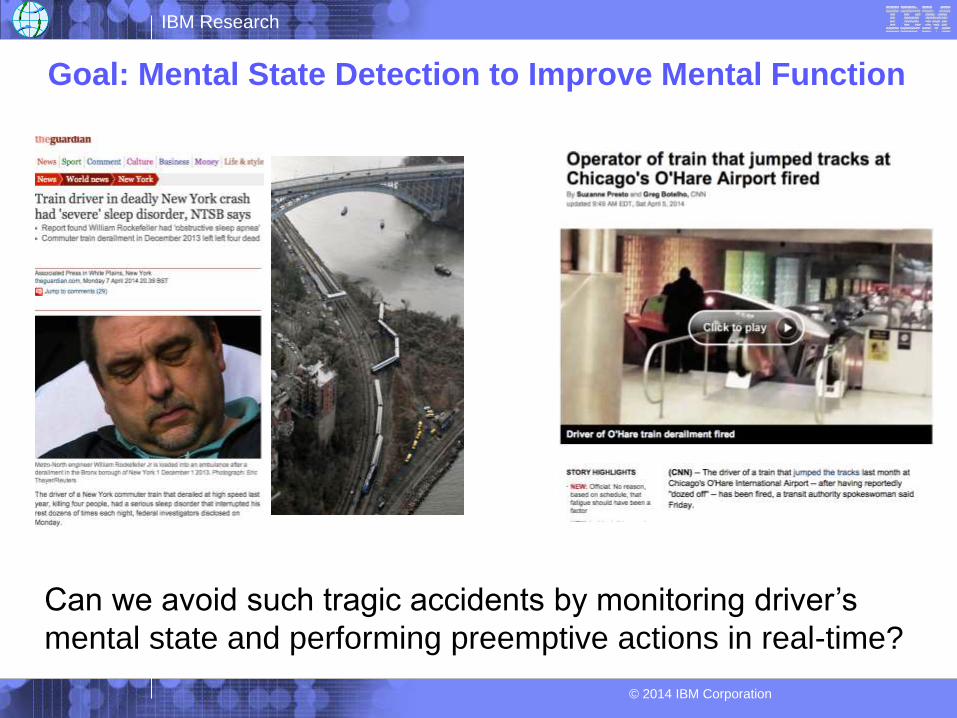
Goal: Mental State Detection to Improve Mental Function
Can we avoid such tragic accidents by monitoring driver’s
mental state and performing preemptive actions in real-time?
IBM Research
© 2014 IBM Corporation
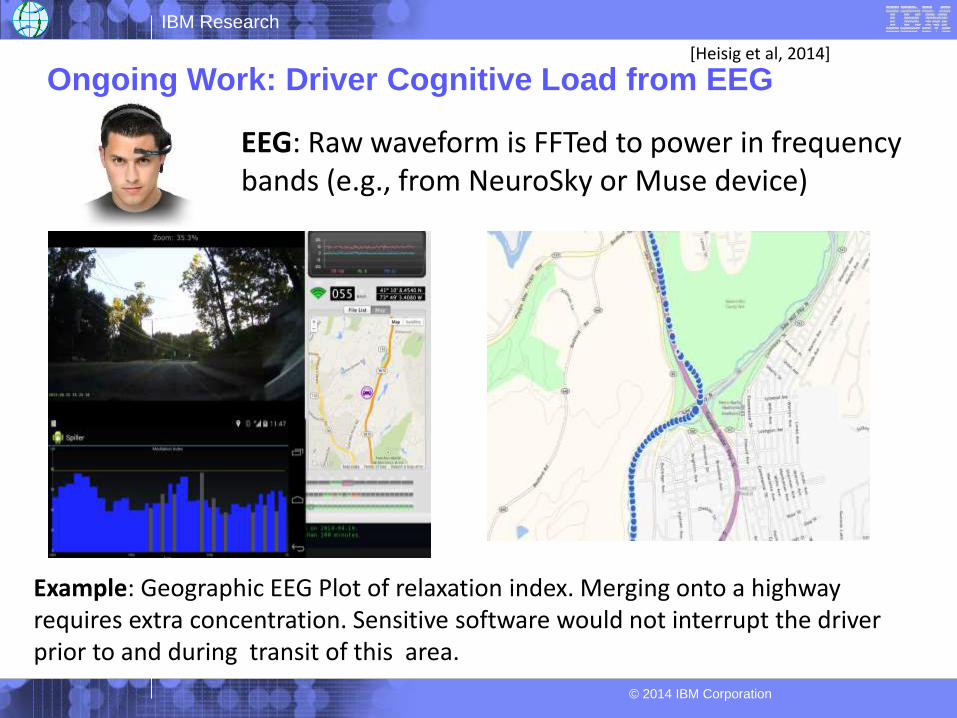
Ongoing Work: Driver Cognitive Load from EEG
Example: Geographic EEG Plot of relaxation index. Merging onto a highway requires extra concentration. Sensitive software would not interrupt the driver prior to and during transit of this area.
EEG: Raw waveform is FFTed to power in frequency bands (e.g., from NeuroSky or Muse device)
[Heisig et al, 2014]

IBM Research
© 2014 IBM Corporation
Sensor 1
Sensor 3
I walked
into a café ..
Sensor 2
Sensor data
Text
Audio
Video
EEG signal
Temperature
Heart-rate
Skin-
conductance
Psycho- and
physiological
Features
Voice power
spectrum
Text topic model
Syntactic graph
HRV spectrum
Cheap
data+
Smart Analytics:
Machine learning+
graph theory
=Behavioral
predictionBrain sciences:
Psychology+
Neuroscience
Behavioral
Phenotype
Baselining
Change-point
detection
Predictions
Towards “Augmented Human”: Real-Time Mind-Reading from Cheap Sensors
IBM Research
© 2014 IBM Corporation
References [Heisig et al, 2014] S. Heisig, G. Cecchi, R. Rao and I. Rish. Augmented Human: Human OS for Improved Mental Function.
AAAI 2014 Workshop on Cognitive Computing and Augmented Human Intelligence.
[Neuropsychopharmacology, 2014] A Window into the Intoxicated Mind? Speech as an Index of Psychoactive Drug Effects. Bedi G,
Cecchi G A, Fernandez Slezak D, Carrillo F, Sigman M, de Wit H. Neuropsychopharmacology, 2014
[PLoS ONE, 2013] Schizophrenia as a Network Disease: Disruption of Emergent Brain Function in Patients with Auditory
Hallucinations, I Rish, G Cecchi, B Thyreau, B Thirion, M Plaze, M-L Paillere-Martinot, C Martelli, J-L Martinot, J-B Poline. PloS
ONE 8(1), e50625, Public Library of Science, 2013.
[PLoS One, 2012] Speech Graphs Provide a Quantitative Measure of Thought Disorder in Psychosis. N.B. Mota, N.A.P. Vasconcelos, N.
Lemos, A.C. Pieretti, O. Kinouchi, G.A. Cecchi, M. Copelli, S. Ribeiro. PLoS One, 2012
[SPIE Med.Imaging 2012] Sparse regression analysis of task-relevant information distribution in the brain.
Irina Rish, Guillermo A Cecchi, Kyle Heuton, Marwan N Baliki, A Vania Apkarian, SPIE Medical Imaging, 2012.
[AISTATS 2012] J. Honorio, D. Samaras, I. Rish, G.A. Cecchi. Variable Selection for Gaussian Graphical Models. AISTATS, 2012.
[PLoS Comp Bio 2012] Predictive Dynamics of Human Pain Perception, GA Cecchi, L Huang, J Ali Hashmi, M Baliki, MV Centeno, I
Rish, AV Apkarian, PLoS Comp Bio 8(10), e1002719, Public Library of Science, 2012.
[Brain Informatics 2010] I. Rish, G. Cecchi, M.N. Baliki and A.V. Apkarian. Sparse Regression Models of Pain Perception, in Proc. of
Brain Informatics (BI-2010), Toronto, Canada, August 2010.
[NeuroImage, 2009] Prediction and interpretation of distributed neural activity with sparse models. Melissa K Carroll, Guillermo A
Cecchi, Irina Rish, Rahul Garg, A Ravishankar Rao. NeuroImage 44(1), 112--122, Elsevier, 2009.
[NIPS, 2009] Discriminative network models of schizophrenia, GA Cecchi, I Rish, B Thyreau, B Thirion, M Plaze, M-L Paillere-
Martinot, C Martelli, J-L Martinot, J-B Poline. Advances in Neural Information Processing Systems (NIPS 2009) , pp. 252--260, 2009.
22
IBM Research
© 2014 IBM Corporation 23
Links Publication page:
http://researcher.watson.ibm.com/researcher/view_person_pubs.php?person=us-rish&t=1
Books:
Practical Applications of Sparse Modeling, I Rish, GA. Cecchi, A Lozano, A
Niculescu-Mizil (editors), MIT Press, 2014.http://www.amazon.com/Practical-Applications-Modeling-Information-Processing/dp/0262027720/ref=sr_1_2?ie=UTF8&qid=1427846244&sr=8-2&keywords=sparse+modeling
I Rish and G Grabarnik. Chapman and Hall/CRC Machine Learning and Pattern
Recognition, 2014. http://www.amazon.com/Sparse-Modeling-Algorithms-Applications-Recognition/dp/1439828695/ref=sr_1_1?ie=UTF8&qid=1427846244&sr=8-1&keywords=sparse+modeling