Investigation of ocular damage threshold by millimeter wave exposure … · ·...
25
Investigation of ocular damage threshold by millimeter wave threshold by millimeter wave exposure (40, 75, 95 GHz) M. Kojima 1,2) , Y. Suzuki 3) , K. Sasaki 4) , T. Tasaki 1) T. Okuno 3) , K. Wake 4) , S. Watanabe 4) , M. Taki 3) HS ki 12 ) H. Sasaki 1,2 ) 1 Division of Vision Research for Environmental Health Medical 1. Division of Vision Research for Environmental Health, Medical Research Institute, Kanazawa Medical University 2. Department of Ophthalmology, Kanazawa Medical University 3 Department of Electrical Engineering Tokyo Metropolitan University 3. Department of Electrical Engineering, Tokyo Metropolitan University 4. National Institute of Information and Communications Technology 1
Transcript of Investigation of ocular damage threshold by millimeter wave exposure … · ·...
Investigation of ocular damage threshold by millimeter wave threshold by millimeter wave
exposure (40, 75, 95 GHz)
M. Kojima 1,2), Y. Suzuki 3), K. Sasaki 4), T. Tasaki 1)
T. Okuno 3), K. Wake 4), S. Watanabe4), M. Taki 3)
H S ki 1 2)H. Sasaki 1,2)
1 Division of Vision Research for Environmental Health Medical1. Division of Vision Research for Environmental Health, MedicalResearch Institute, Kanazawa Medical University
2. Department of Ophthalmology, Kanazawa Medical University3 Department of Electrical Engineering Tokyo Metropolitan University3. Department of Electrical Engineering, Tokyo Metropolitan University4. National Institute of Information and Communications Technology
1
Methods
Rabbits were exposed to MMWs at frequencies of 40,p q ,75, and 95 GHz for 6 minutes.
One day after exposure morphological changes in theOne day after exposure, morphological changes in thecornea were assessed by slit-lamp microscopy(including fluorescence staining) and optical(including fluorescence staining) and opticalcoherence tomography.
D d t f l i j ( lDose-response data of corneal injury (cornealepithelium damage, corneal opaque, and cornealedema) at each frequency were obtained byedema) at each frequency were obtained byexperiments in the range of power density.
2

MMW exposurepIncident power density: Power density averaged over a13 mm diameter circle corresponding to the area of the
Beam profile
13-mm-diameter circle corresponding to the area of theocular surface exposed to the ambient air.
40 GH
Beam profile
95 GHFWHM: full width at half maximum
]
13 mm in diameter40 GHz
]
13 mm in diameter95 GHz
field
[V/m
]
FWHM 9.6 mm fie
ld [V
/m]
Ele
ctric
f 9.6 mm
FWHM 3.7 mmE
lect
ric f
Distance [mm] Distance [mm]3
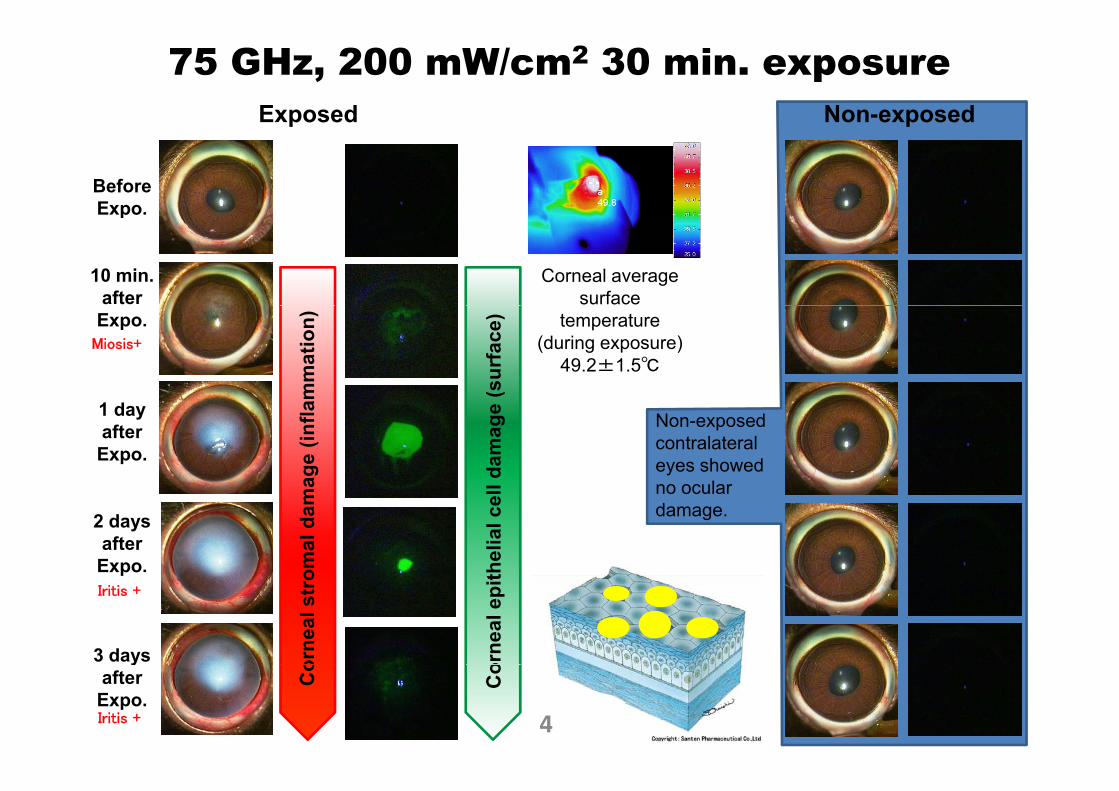
75 GHz, 200 mW/cm2 30 min. exposureExposed Non-exposed
BeforeExpo.
p p
p
10 min.after
Corneal average surface
Expo.Miosis+
mm
atio
n)
(sur
face
) temperature(during exposure)
49.2±1.5℃
1 dayafterExpo.
Non-exposed contralateral eyes showed no ocularag
e (in
flam
dam
age
(2 daysafterExpo.
no ocular damage.
omal
dam
a
thel
ial c
ell
p
3 days
Iritis +
orne
al s
tro
orne
al e
pit
yafterExpo.Iritis +
Co
Co
4
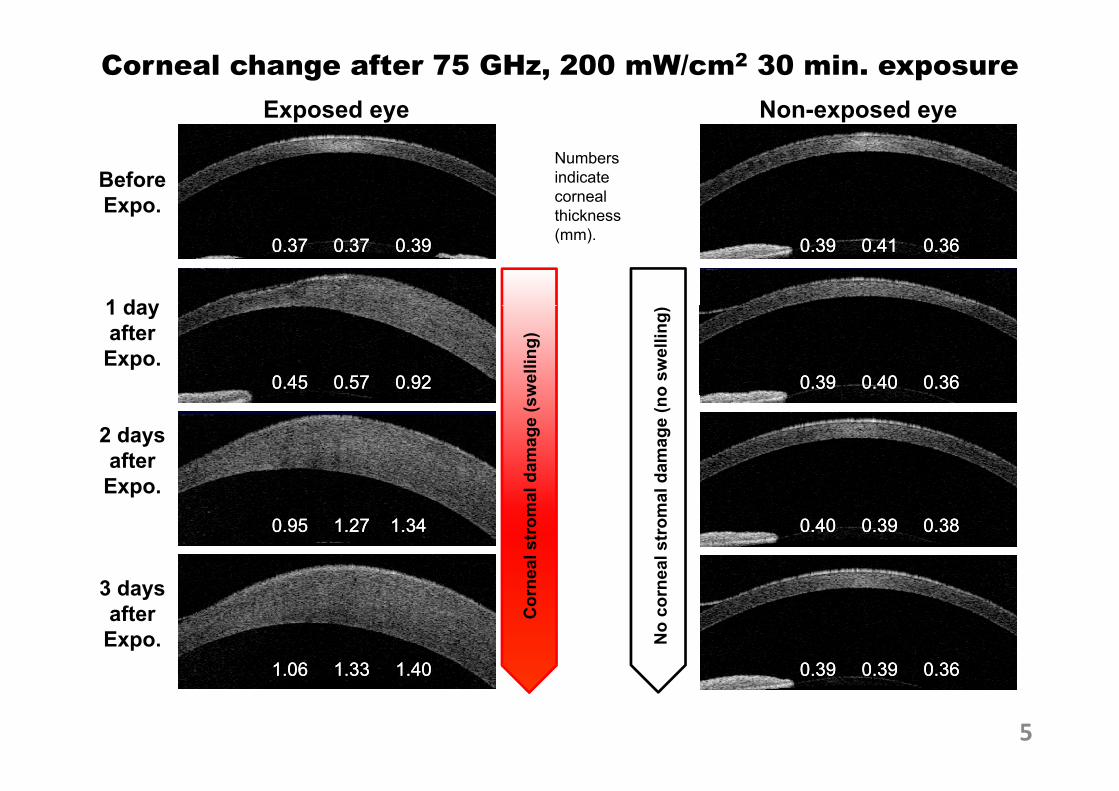
Corneal change after 75 GHz, 200 mW/cm2 30 min. exposureExposed eye Non-exposed eye
BeforeExpo.
Numbersindicate corneal thicknessp
1 day
thickness(mm). 0.39 0.41 0.360.39 0.41 0.360.37 0.37 0.390.37 0.37 0.39
1 dayafterExpo.
0.39 0.40 0.360.39 0.40 0.360.45 0.57 0.920.45 0.57 0.92 wel
ling)
o sw
ellin
g)
2 daysafterExpo da
mag
e (s
w
dam
age
(no
Expo.
0.40 0.39 0.380.40 0.39 0.380.95 1.27 1.340.95 1.27 1.34ea
l str
omal
eal s
trom
al
3 daysafterExpo.
0 39 0 39 0 360 39 0 39 0 361 06 1 33 1 401 06 1 33 1 40
Cor
ne
No
corn
e0.39 0.39 0.360.39 0.39 0.361.06 1.33 1.401.06 1.33 1.40
5
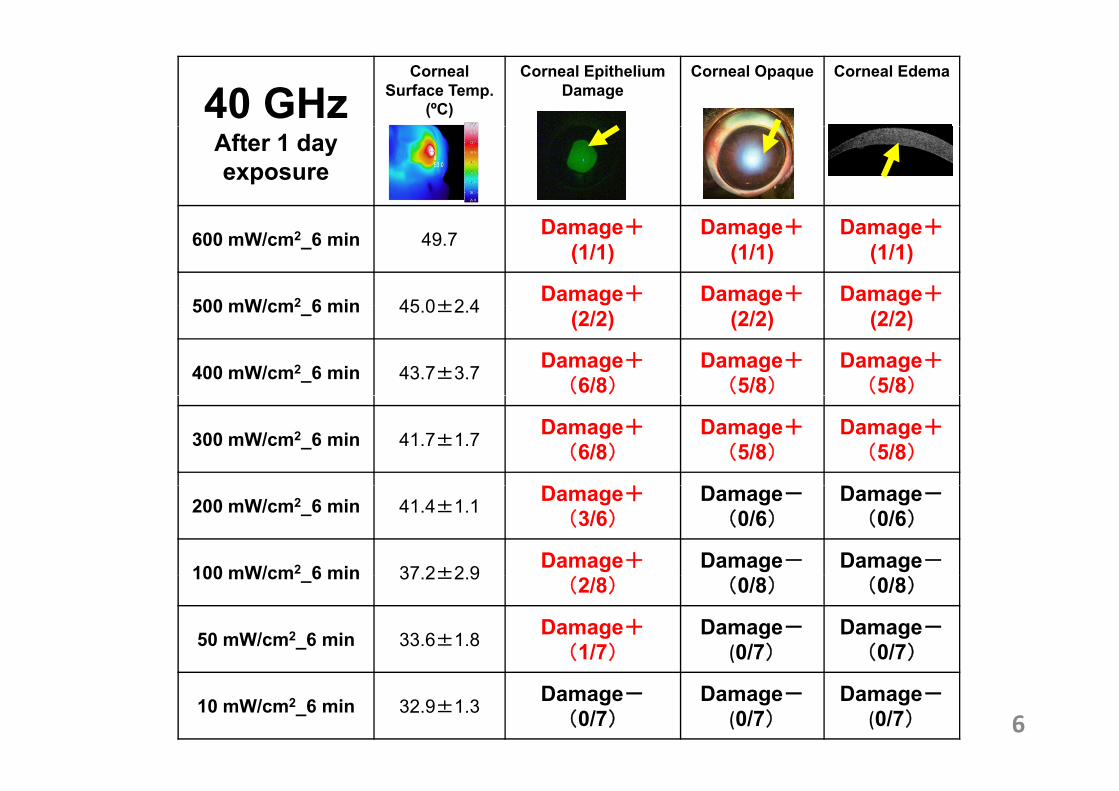
40 GHzCorneal
Surface Temp. (ºC)
Corneal EpitheliumDamage
Corneal Opaque Corneal Edema
After 1 day exposure
600 mW/cm2_6 min 49.7 Damage+(1/1)
Damage+(1/1)
Damage+(1/1)
500 mW/cm2 6 min 45 0±2 4 Damage+ Damage+ Damage+500 mW/cm2_6 min 45.0±2.4 (2/2) (2/2) (2/2)
400 mW/cm2_6 min 43.7±3.7 Damage+(6/8)
Damage+(5/8)
Damage+(5/8)
300 mW/cm2_6 min 41.7±1.7 Damage+(6/8)
Damage+(5/8)
Damage+(5/8)
200 mW/cm2_6 min 41.4±1.1 Damage+(3/6)
Damage-(0/6)
Damage-(0/6)
100 mW/cm2 6 min 37 2±2 9 Damage+ Damage- Damage-100 mW/cm _6 min 37.2±2.9(2/8) (0/8) (0/8)
50 mW/cm2_6 min 33.6±1.8 Damage+(1/7)
Damage-(0/7)
Damage-(0/7)
610 mW/cm2_6 min 32.9±1.3 Damage-
(0/7)Damage-
(0/7)Damage-
(0/7)
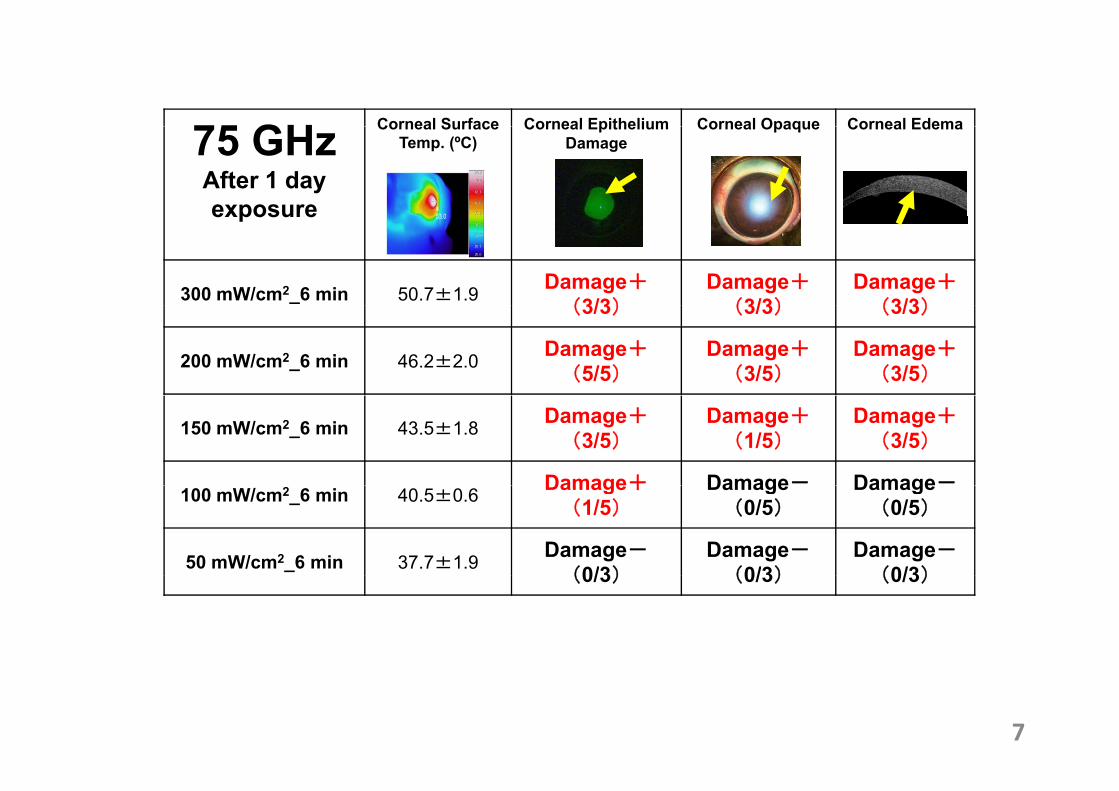
75 GH Corneal Surface Corneal Epithelium Corneal Opaque Corneal Edema75 GHzAfter 1 day exposure
Corneal Surface Temp. (ºC)
Corneal EpitheliumDamage
Corneal Opaque Corneal Edema
exposure
300 mW/cm2_6 min 50.7±1.9 Damage+(3/3)
Damage+(3/3)
Damage+(3/3)(3/3) (3/3) (3/3)
200 mW/cm2_6 min 46.2±2.0 Damage+(5/5)
Damage+(3/5)
Damage+(3/5)
150 mW/cm2_6 min 43.5±1.8 Damage+(3/5)
Damage+(1/5)
Damage+(3/5)
Damage+ Damage- Damage-100 mW/cm2_6 min 40.5±0.6 Damage+(1/5)
Damage(0/5)
Damage(0/5)
50 mW/cm2_6 min 37.7±1.9 Damage-(0/3)
Damage-(0/3)
Damage-(0/3)(0/3) (0/3) (0/3)
7
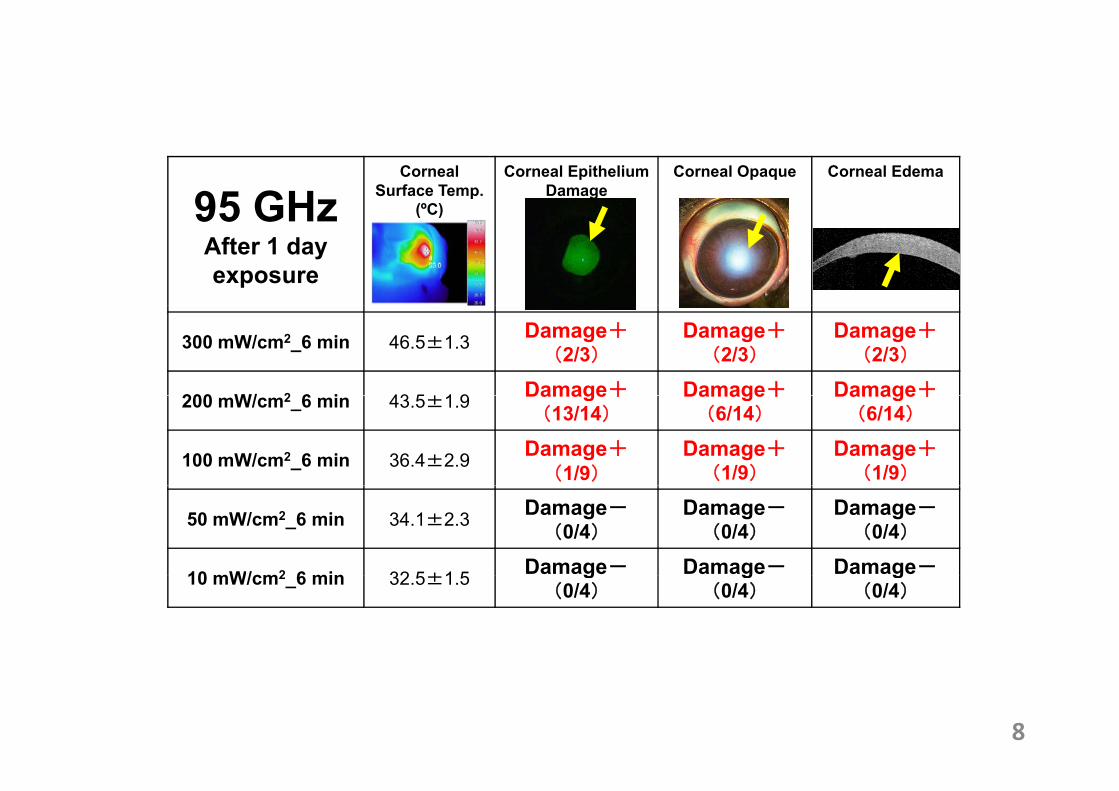
95 GHzCorneal
Surface Temp. (ºC)
Corneal EpitheliumDamage
Corneal Opaque Corneal Edema
95 GHzAfter 1 day exposure
( )
300 mW/cm2_6 min 46.5±1.3 Damage+(2/3)
Damage+(2/3)
Damage+(2/3)
200 W/ 2 6 i 43 5±1 9 Damage+ Damage+ Damage+200 mW/cm2_6 min 43.5±1.9 Damage+(13/14)
Damage+(6/14)
Damage+(6/14)
100 mW/cm2_6 min 36.4±2.9 Damage+(1/9)
Damage+(1/9)
Damage+(1/9)
50 mW/cm2_6 min 34.1±2.3 Damage-(0/4)
Damage-(0/4)
Damage-(0/4)
10 mW/cm2 6 min 32 5±1 5 Damage- Damage- Damage-10 mW/cm2_6 min 32.5±1.5 g(0/4)
g(0/4)
g(0/4)
8
Maximum likelihood estimation ith li d li d lwith generalized linear model
• The values of MMW power density which indicate thethreshold of eye damage were defined as damage dose (DD).
• Markers plotted in each graph denote dependence of the ratio• Markers plotted in each graph denote dependence of the ratioof eye damage to the number of exposed eyes to the powerdensity (dose) obtained from actual MMW exposureexperiments.experiments.– The number of rabbit eyes at each power density corresponds to
the marker size. (If the marker size is large, the number of eyesexposed to MMW is large )exposed to MMW is large.)
– Maximum likelihood estimation (MLE) was performed with aprobit model for the experimental data.
– “R” language is used for the MLE.– Black line:result of MLE for GLE
Bl li l li it 95% fid i t l– Blue line:lower limit on a 95% confidence interval– Red line:upper limit on a 95% confidence interval
9
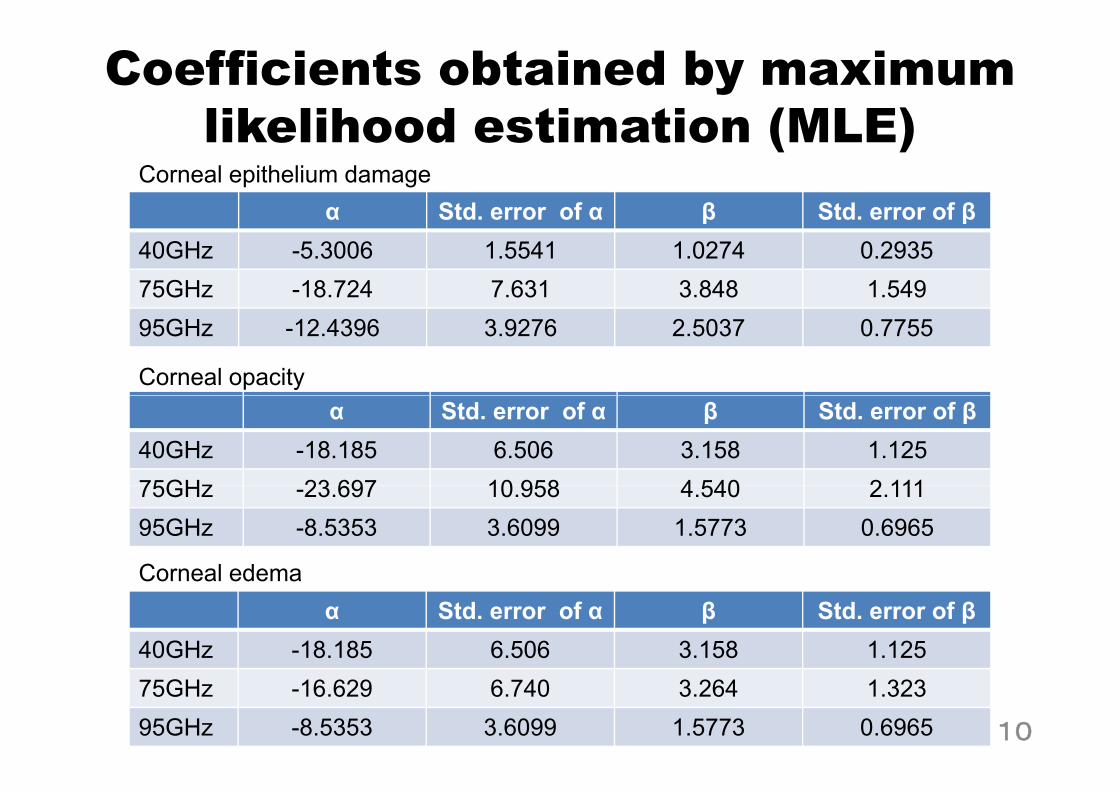
Coefficients obtained by maximum likelihood estimation (MLE)likelihood estimation (MLE)
α Std error of α β Std error of βCorneal epithelium damage
α Std. error of α β Std. error of β40GHz -5.3006 1.5541 1.0274 0.293575GHz -18.724 7.631 3.848 1.54995GHz -12.4396 3.9276 2.5037 0.7755
Corneal opacityα Std. error of α β Std. error of β
40GHz -18.185 6.506 3.158 1.12575GHz 23 697 10 958 4 540 2 11175GHz -23.697 10.958 4.540 2.11195GHz -8.5353 3.6099 1.5773 0.6965
Corneal edemaCorneal edemaα Std. error of α β Std. error of β
40GHz -18.185 6.506 3.158 1.12575GHz -16.629 6.740 3.264 1.32395GHz -8.5353 3.6099 1.5773 0.6965 10
E d ti 6 iExposure duration = 6 min
11
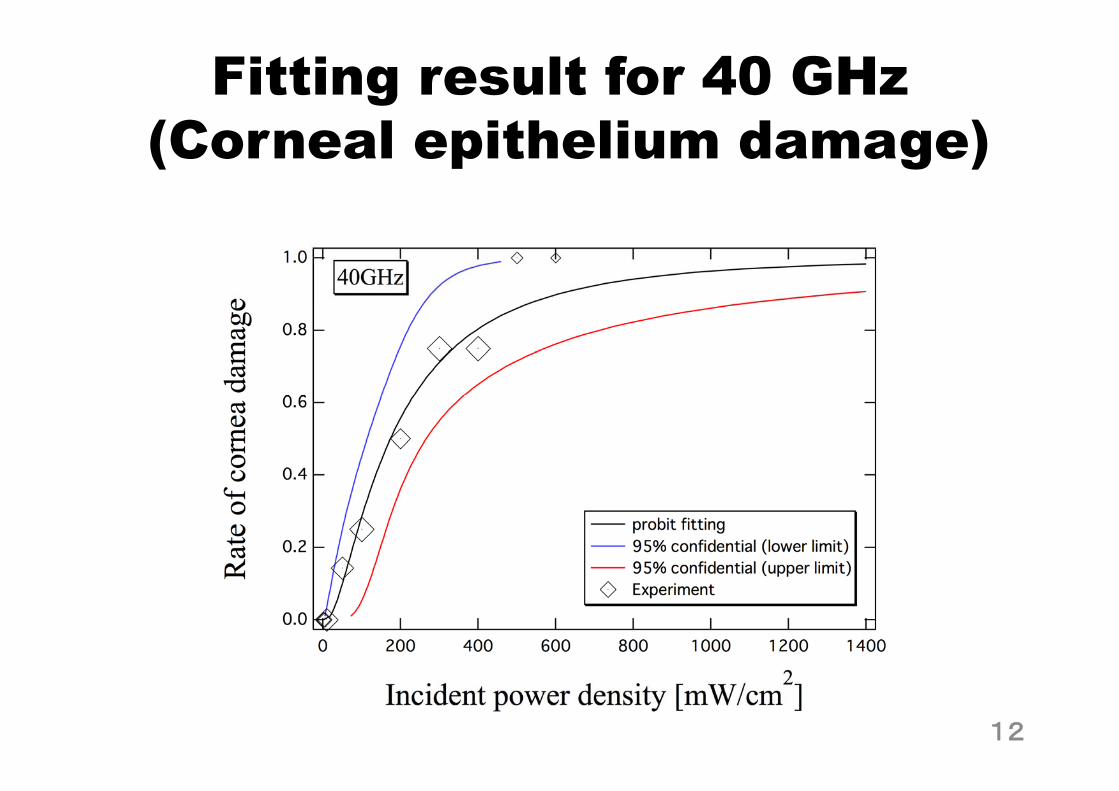
Fitting result for 40 GHz(C l ith li d )(Corneal epithelium damage)
12
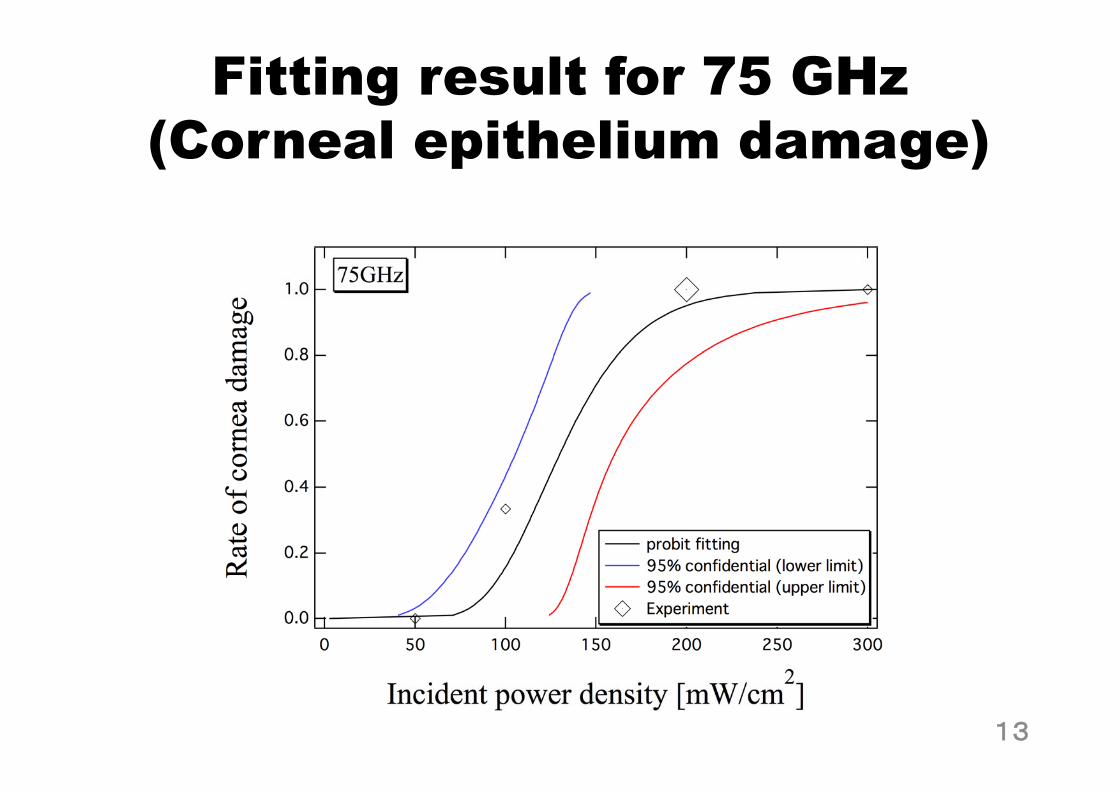
Fitting result for 75 GHz(C l ith li d )(Corneal epithelium damage)
13
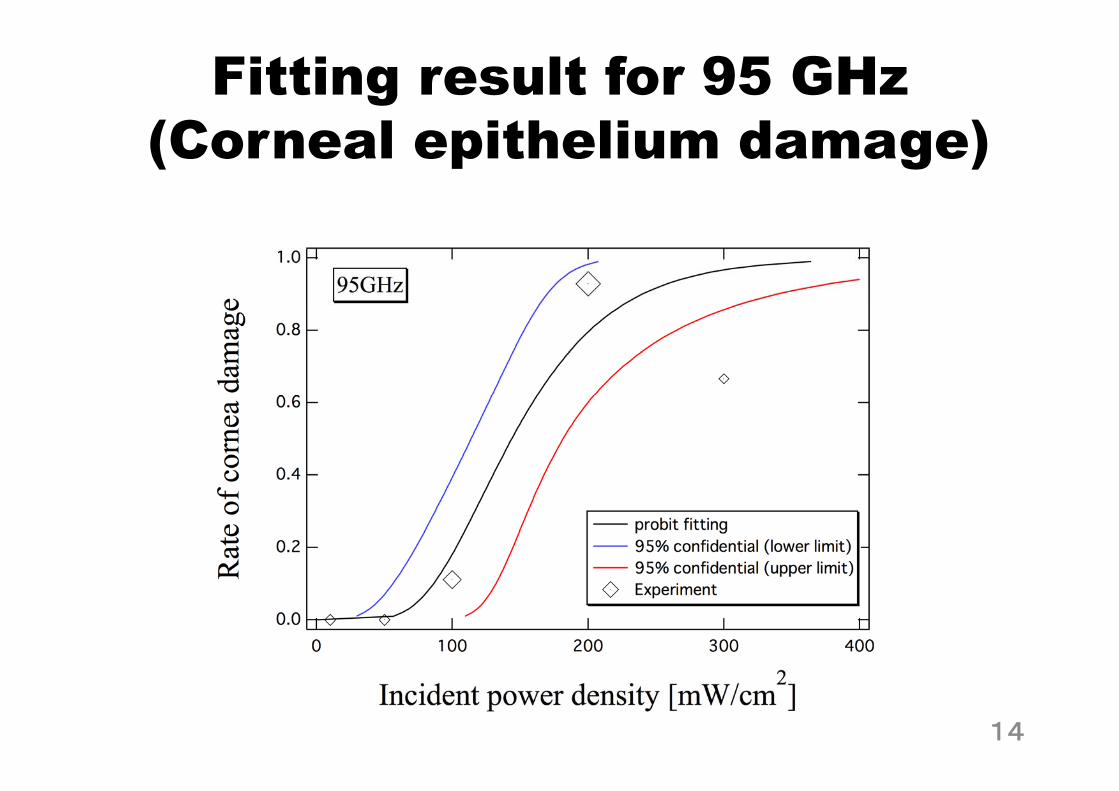
Fitting result for 95 GHz(C l ith li d )(Corneal epithelium damage)
14
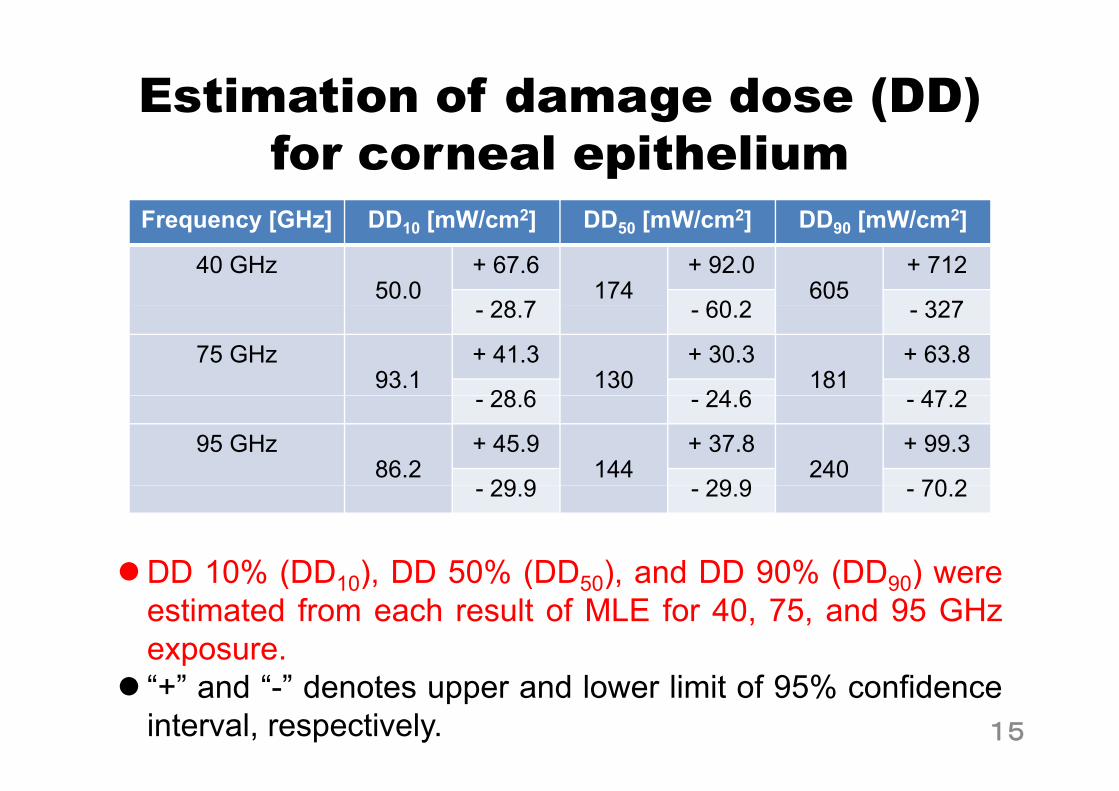
Estimation of damage dose (DD) for corneal epithelium
Frequency [GHz] DD [mW/cm2] DD [mW/cm2] DD [mW/cm2]Frequency [GHz] DD10 [mW/cm2] DD50 [mW/cm2] DD90 [mW/cm2]
40 GHz50.0
+ 67.6174
+ 92.0605
+ 712
28 7 60 2 327- 28.7 - 60.2 - 327
75 GHz93.1
+ 41.3130
+ 30.3181
+ 63.8
28 6 24 6 47 2- 28.6 - 24.6 - 47.2
95 GHz86.2
+ 45.9144
+ 37.8240
+ 99.3
29 9 29 9 70 2- 29.9 - 29.9 - 70.2
DD 10% (DD ) DD 50% (DD ) and DD 90% (DD ) wereDD 10% (DD10), DD 50% (DD50), and DD 90% (DD90) wereestimated from each result of MLE for 40, 75, and 95 GHzexposure.p“+” and “-” denotes upper and lower limit of 95% confidenceinterval, respectively. 15
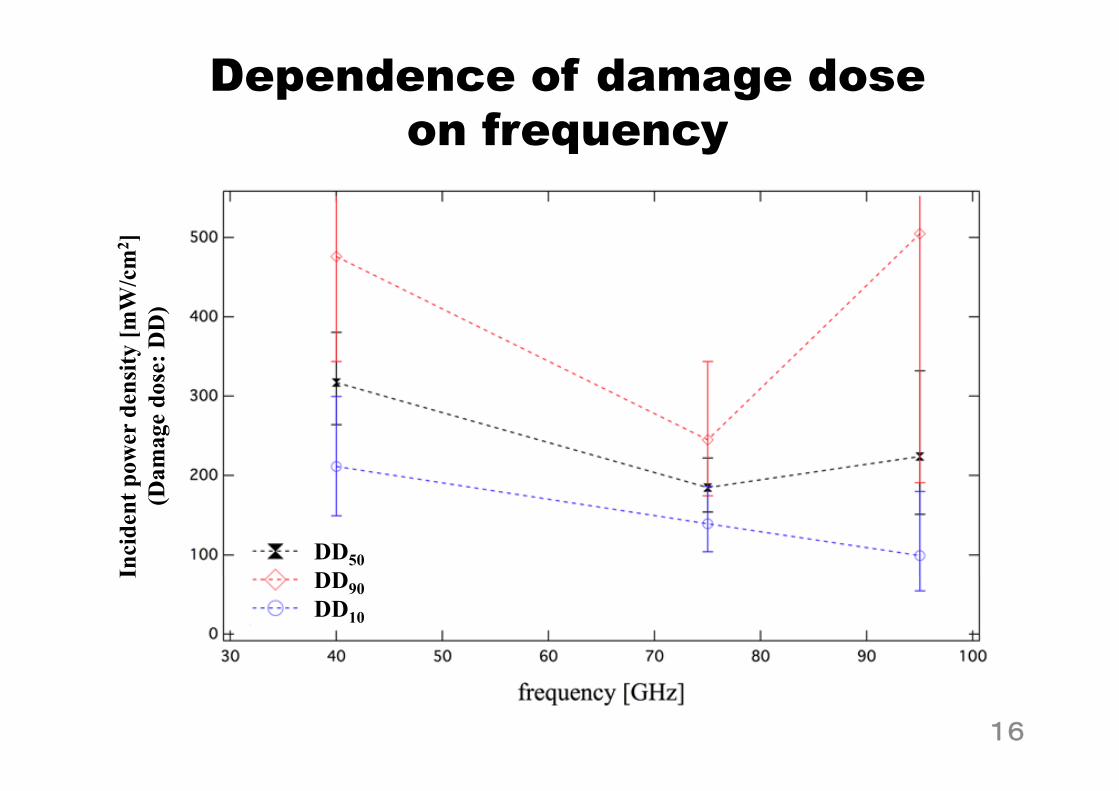
Dependence of damage doseon frequencyon frequency
W/c
m2 ]
ensi
ty [m
Wdo
se: D
D)
pow
er d
eD
amag
e d
Inci
dent
p (D
DD50DDI DD90DD10
16
E d ti 30 iExposure duration = 30 min
17
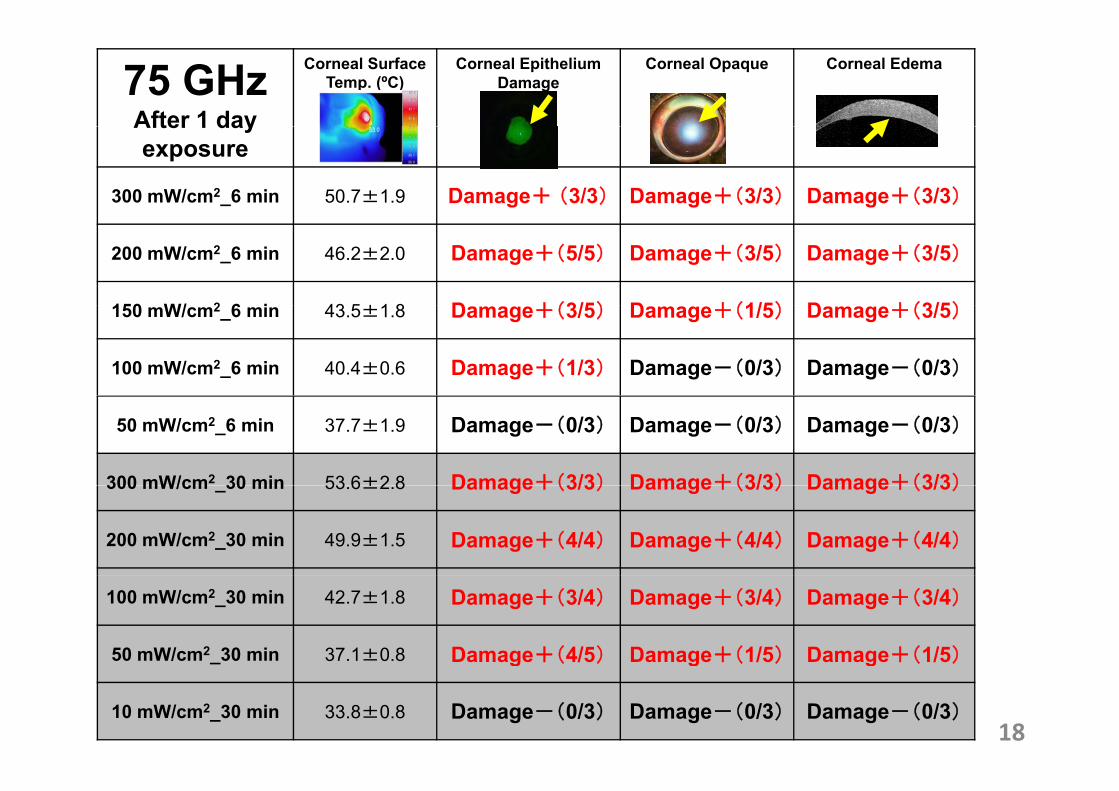
75 GHzAfter 1 day
Corneal Surface Temp. (ºC)
Corneal EpitheliumDamage
Corneal Opaque Corneal Edema
After 1 day exposure
300 mW/cm2_6 min 50.7±1.9 Damage+ (3/3) Damage+(3/3) Damage+(3/3)
200 mW/cm2_6 min 46.2±2.0 Damage+(5/5) Damage+(3/5) Damage+(3/5)
150 W/ 2 6 i 43 5±1 8 D +(3/5) D +(1/5) D +(3/5)150 mW/cm2_6 min 43.5±1.8 Damage+(3/5) Damage+(1/5) Damage+(3/5)
100 mW/cm2_6 min 40.4±0.6 Damage+(1/3) Damage-(0/3) Damage-(0/3)
50 mW/cm2_6 min 37.7±1.9 Damage-(0/3) Damage-(0/3) Damage-(0/3)
300 mW/cm2 30 min 53 6±2 8 Damage+(3/3) Damage+(3/3) Damage+(3/3)300 mW/cm _30 min 53.6±2.8 Damage+(3/3) Damage+(3/3) Damage+(3/3)
200 mW/cm2_30 min 49.9±1.5 Damage+(4/4) Damage+(4/4) Damage+(4/4)
100 mW/cm2_30 min 42.7±1.8 Damage+(3/4) Damage+(3/4) Damage+(3/4)
50 mW/cm2_30 min 37.1±0.8 Damage+(4/5) Damage+(1/5) Damage+(1/5)g g g
10 mW/cm2_30 min 33.8±0.8 Damage-(0/3) Damage-(0/3) Damage-(0/3)18
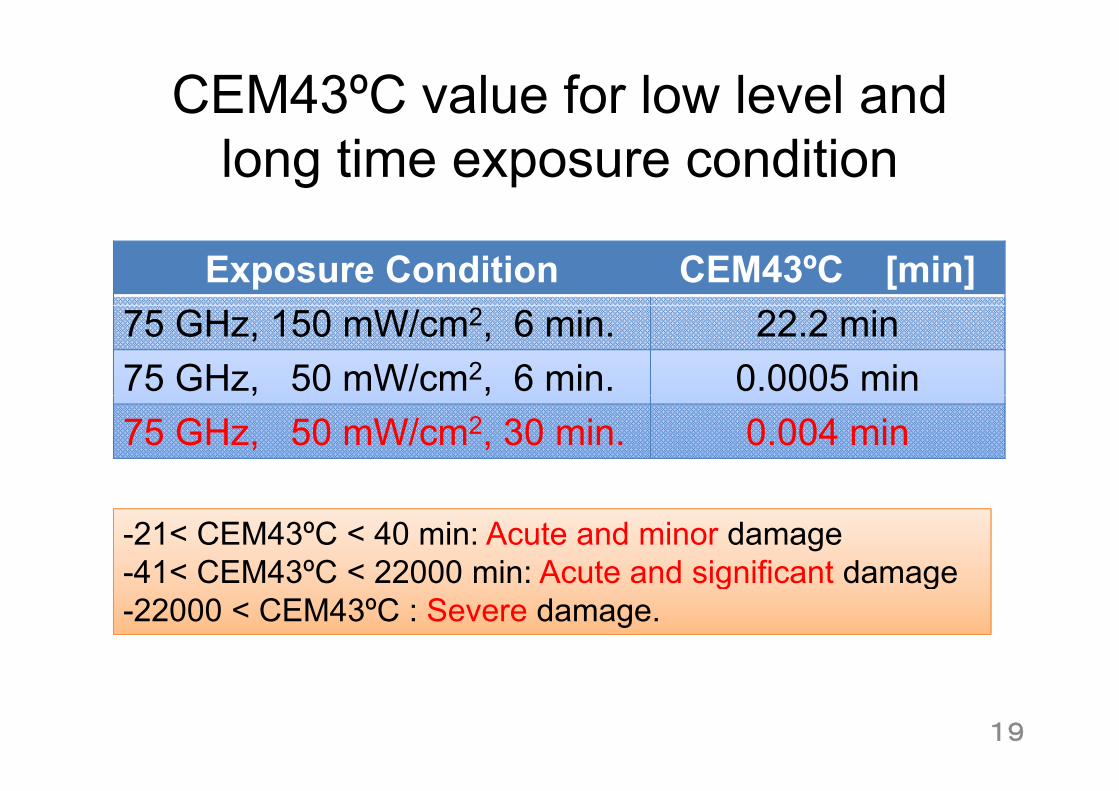
CEM43ºC value for low level and long time exposure condition
Exposure Condition CEM43ºC [min]75 GHz, 150 mW/cm2, 6 min. 22.2 min75 GHz, 50 mW/cm2, 6 min. 0.0005 min, ,75 GHz, 50 mW/cm2, 30 min. 0.004 min
-21< CEM43ºC < 40 min: Acute and minor damage-41< CEM43ºC < 22000 min: Acute and significant damage-41< CEM43 C < 22000 min: Acute and significant damage-22000 < CEM43ºC : Severe damage.
19
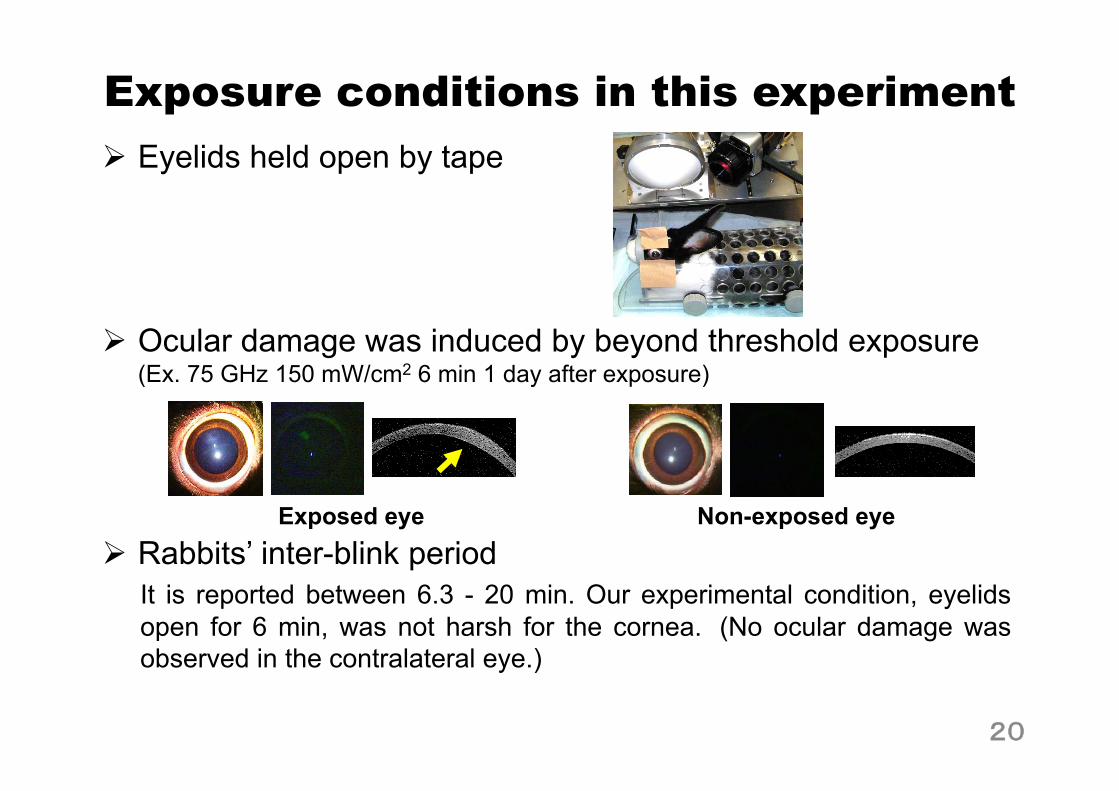
Exposure conditions in this experimentEyelids held open by tape
Ocular damage was induced by beyond threshold exposure(Ex. 75 GHz 150 mW/cm2 6 min 1 day after exposure)
Rabbits’ inter-blink periodExposed eye Non-exposed eye
It is reported between 6.3 - 20 min. Our experimental condition, eyelidsopen for 6 min, was not harsh for the cornea. (No ocular damage wasobserved in the contralateral eye.)observed in the contralateral eye.)
20
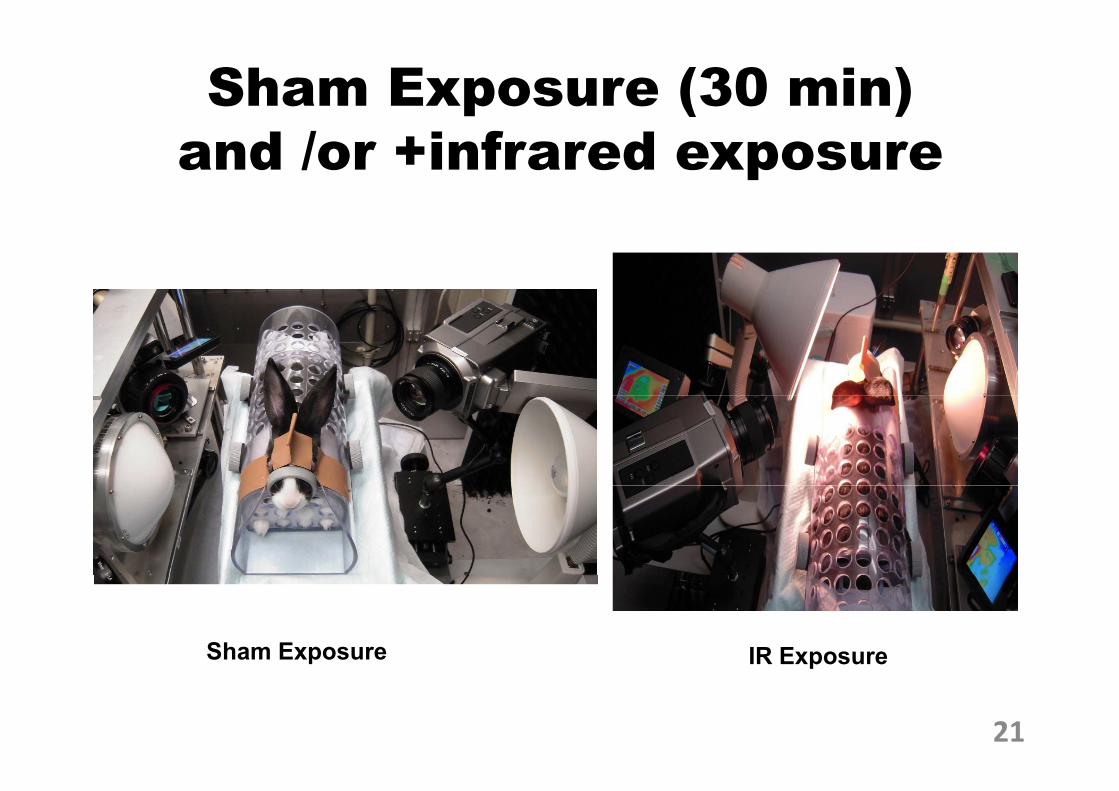
Sham Exposure (30 min) and /or +infrared exposure
Sham Exposure IR Exposurep
21
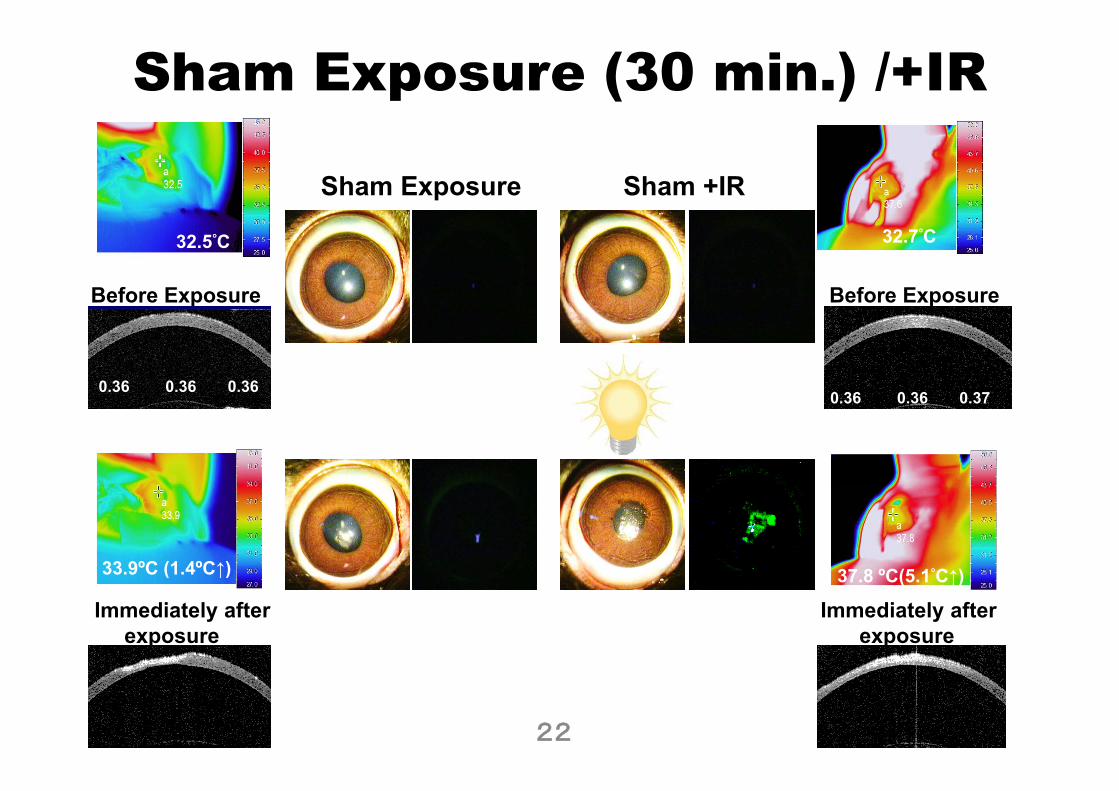
Sham Exposure (30 min.) /+IR
Sham Exposure Sham +IR
Before Exposure Before Exposure
32.5°C 32.7°C
p p
0.36 0.36 0.360 36 0 36 0 370.36 0.36 0.37
33.9ºC (1.4ºC↑) 37 8 ºC(5 1°C↑)( ↑) 37.8 ºC(5.1 C↑)
Immediately after Immediately after exposure exposure
0.23 0.26 0.35 0.26 0.28 0.292222
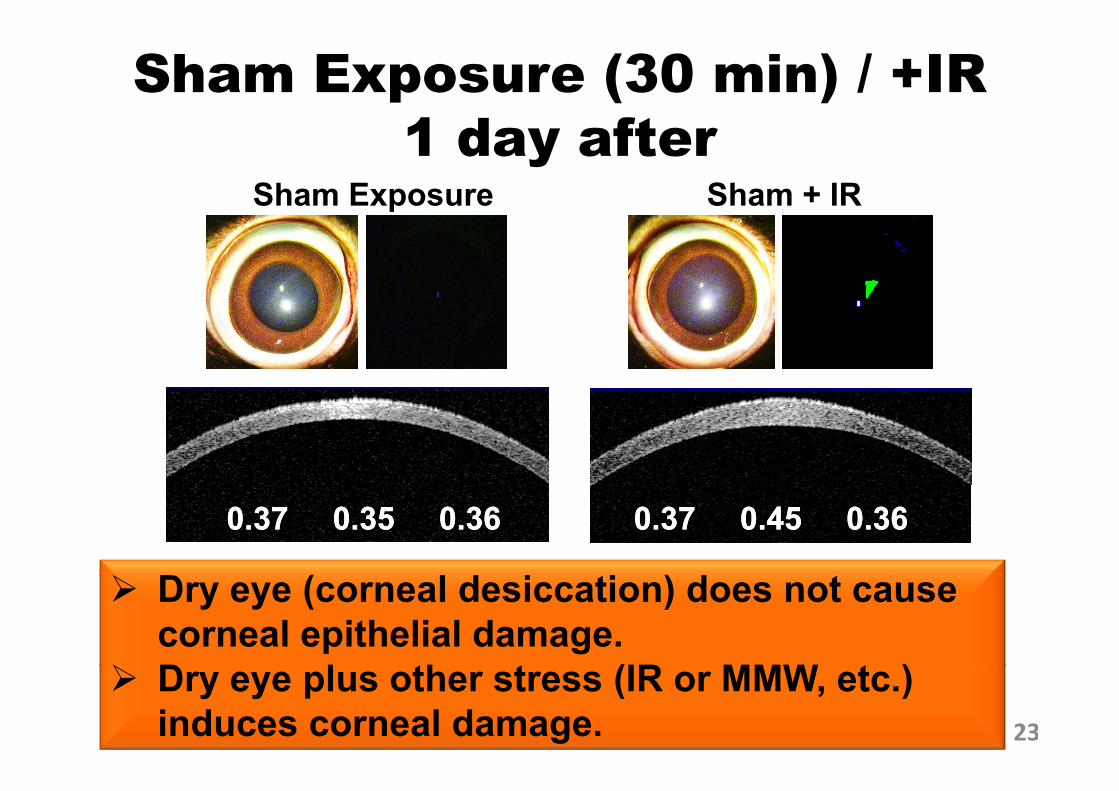
Sham Exposure (30 min) / +IR1 d ft1 day after
Sham Exposure Sham + IR
( )
0.37 0.35 0.360.37 0.35 0.36 0.37 0.45 0.360.37 0.45 0.36
0.35 0.33 0.35 0.38 0.48 0.41
Dry eye (corneal desiccation) does not cause corneal epithelial damage.D l h (IR MMW )Dry eye plus other stress (IR or MMW, etc.) induces corneal damage. 23
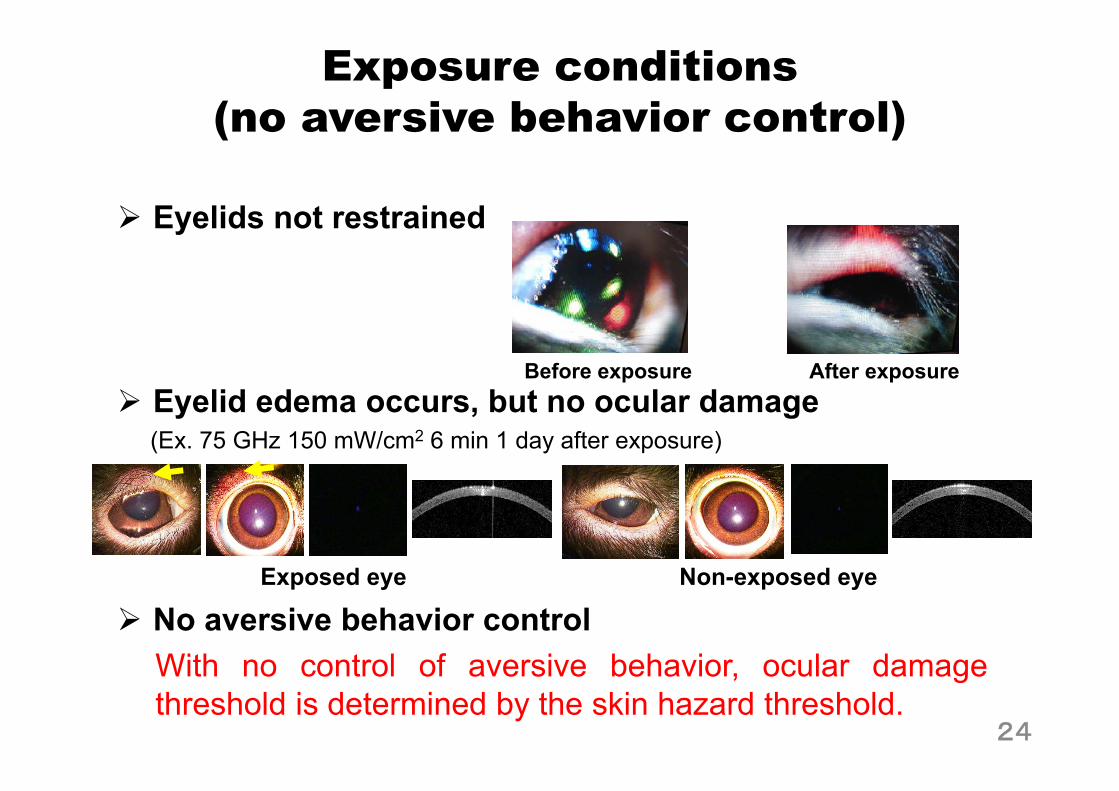
Exposure conditions (no aversive behavior control)(no aversive behavior control)
Eyelids not restrainedEyelids not restrained
Eyelid edema occurs but no ocular damageBefore exposure After exposure
Eyelid edema occurs, but no ocular damage(Ex. 75 GHz 150 mW/cm2 6 min 1 day after exposure)
Exposed eye Non exposed eye
No aversive behavior controlWith no control of aversive behavior ocular damage
Exposed eye Non-exposed eye
With no control of aversive behavior, ocular damagethreshold is determined by the skin hazard threshold.
24
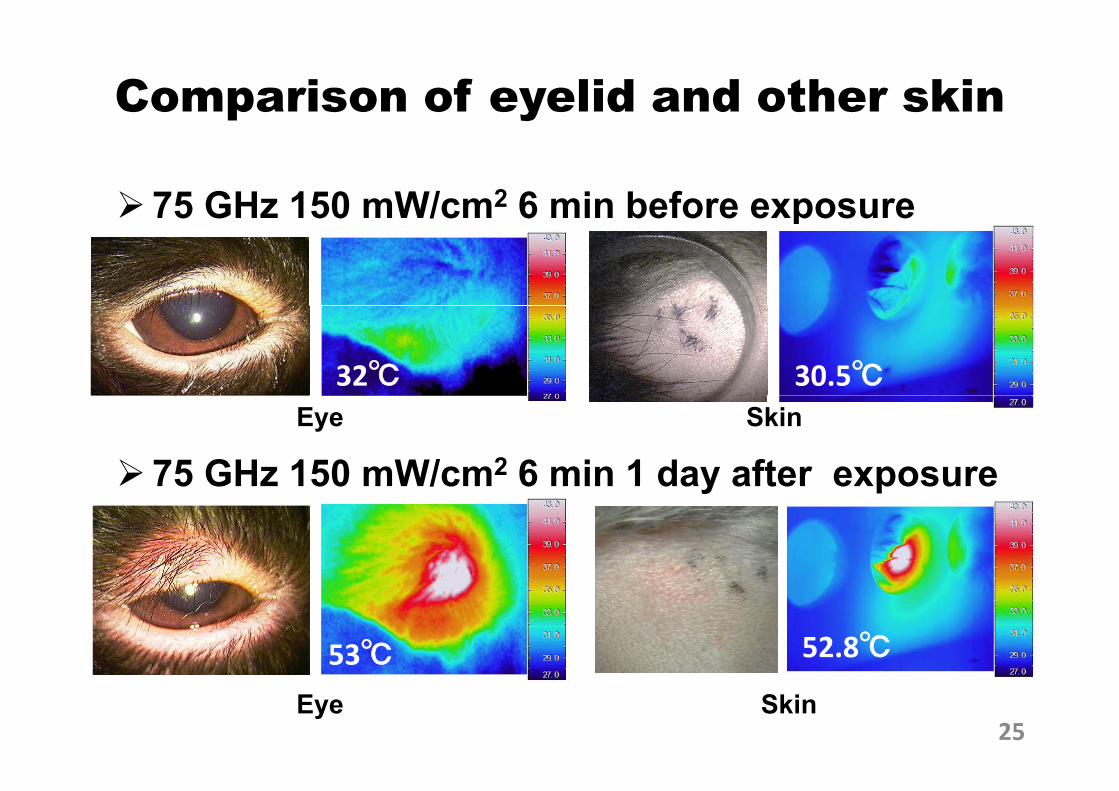
Comparison of eyelid and other skin
75 GHz 150 mW/cm2 6 min before exposure75 GHz 150 mW/cm 6 min before exposure
32℃ 30.5℃
75 GHz 150 mW/cm2 6 min 1 day after exposureEye Skin
75 GHz 150 mW/cm 6 min 1 day after exposure
53℃ 52.8℃
25
53Eye Skin