Introduction to LRFD, Loads and Loads Distribution
26
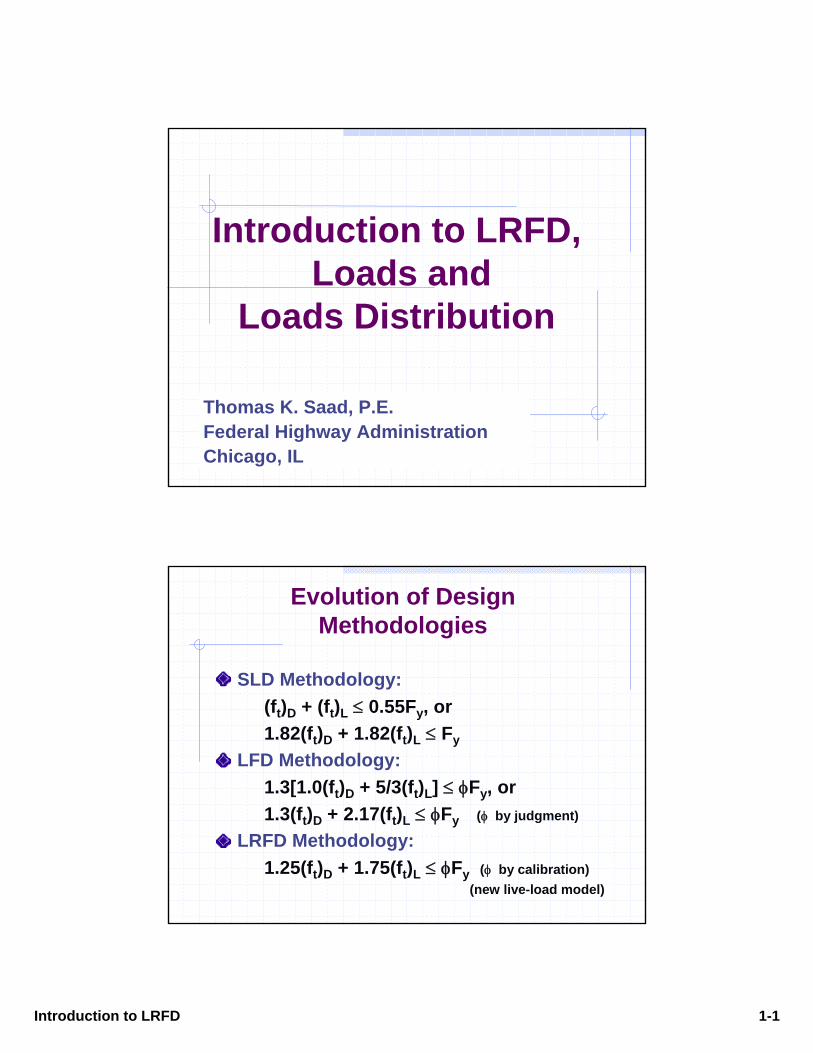
Introduction to LRFD 1-1 Introduction to LRFD, Loads and Loads Distribution Thomas K. Saad, P.E. Federal Highway Administration Chicago, IL Evolution of Design Methodologies SLD Methodology: (f t ) D + (f t ) L ≤ 0.55F y , or 1.82(f t ) D + 1.82(f t ) L ≤ F y LFD Methodology: 1.3[1.0(f t ) D + 5/3(f t ) L ] ≤φF y , or 1.3(f t ) D + 2.17(f t ) L ≤φF y (φ by judgment) LRFD Methodology: 1.25(f t ) D + 1.75(f t ) L ≤φF y (φ by calibration) (new live-load model)
Transcript of Introduction to LRFD, Loads and Loads Distribution
Introduction to LRFD 1-1
Introduction to LRFD,Loads and
Loads Distribution
Thomas K. Saad, P.E.Federal Highway AdministrationChicago, IL
Evolution of Design Methodologies
SLD Methodology:(ft)D + (ft)L ≤ 0.55Fy, or1.82(ft)D + 1.82(ft)L ≤ Fy
LFD Methodology:1.3[1.0(ft)D + 5/3(ft)L] ≤ φFy, or1.3(ft)D + 2.17(ft)L ≤ φFy (φ by judgment)
LRFD Methodology:1.25(ft)D + 1.75(ft)L ≤ φFy (φ by calibration)
(new live-load model)
Introduction to LRFD 1-2
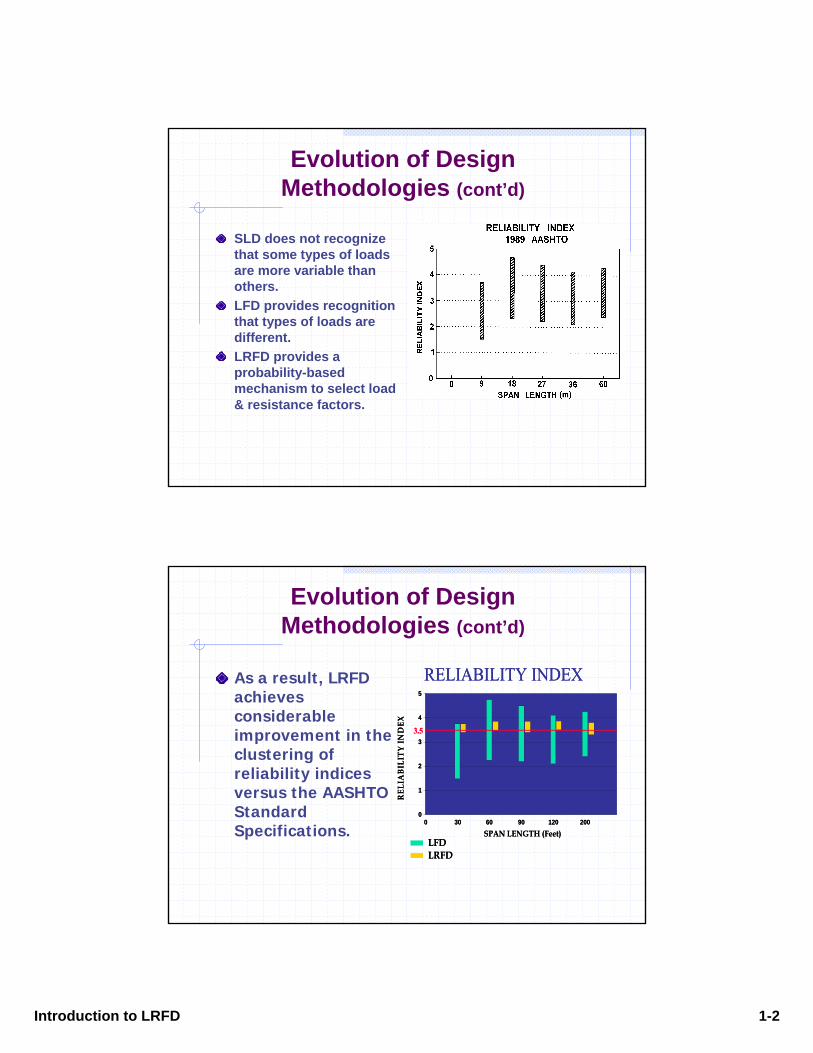
Evolution of Design Methodologies (cont’d)
SLD does not recognize that some types of loads are more variable than others.LFD provides recognition that types of loads are different.LRFD provides a probability-based mechanism to select load & resistance factors.
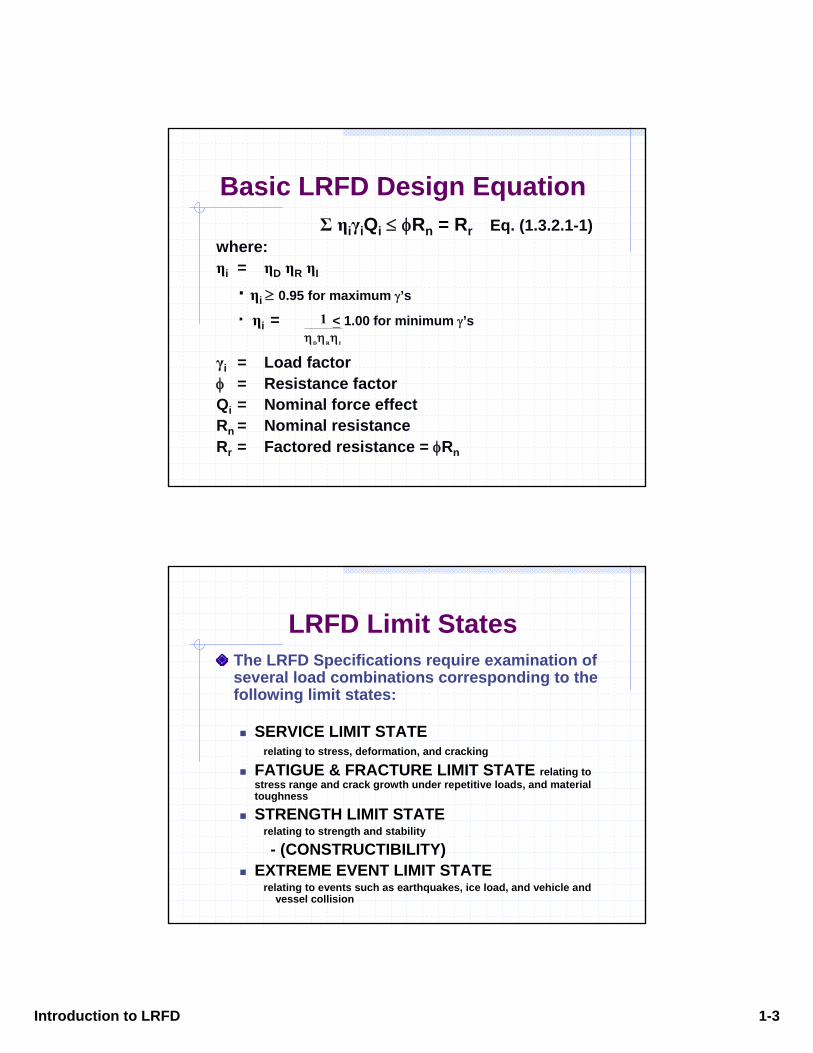
Evolution of Design Methodologies (cont’d)
As a result, LRFD achieves considerable improvement in the clustering of reliability indices versus the AASHTO Standard Specifications.
LFDLRFD
RELIABILITY INDEX
0
1
2
3
4
5
0 30 60 90 120 200
SPAN LENGTH (Feet)
REL
IABI
LITY
IND
EX
3.5
LFDLRFD
RELIABILITY INDEX
0
1
2
3
4
5
0 30 60 90 120 200
SPAN LENGTH (Feet)
REL
IABI
LITY
IND
EX
3.5
Introduction to LRFD 1-3
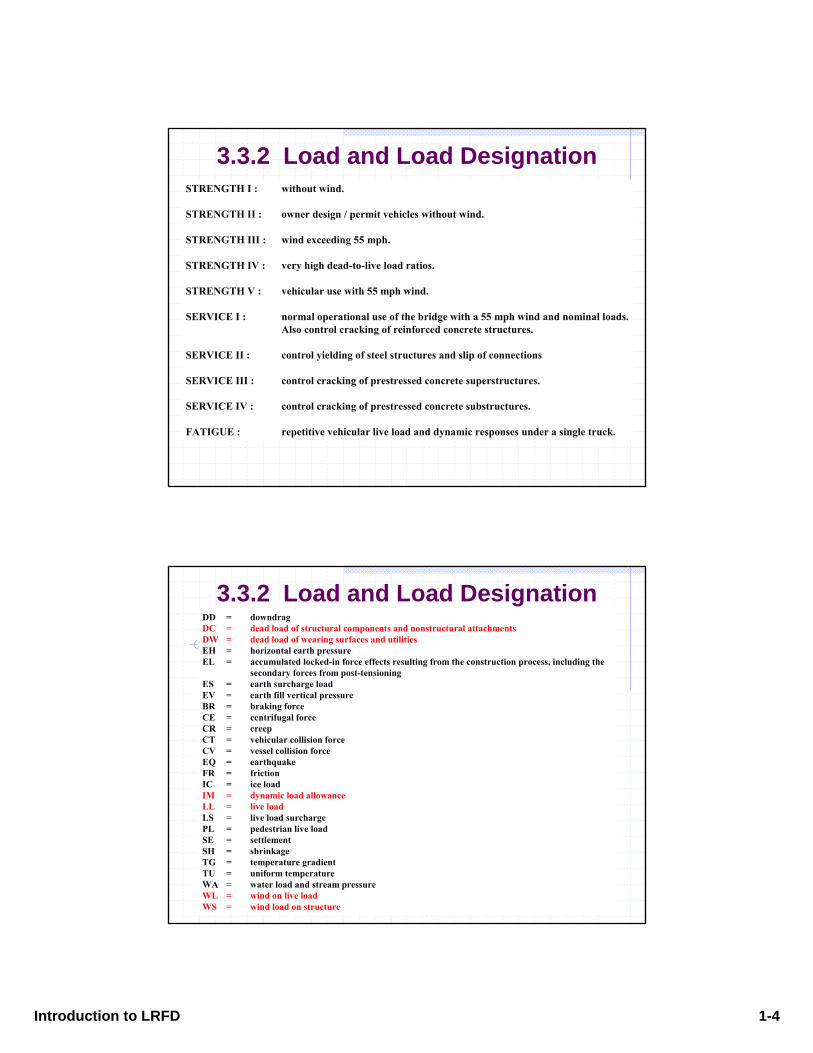
Basic LRFD Design EquationΣ ηiγiQi ≤ φRn = Rr Eq. (1.3.2.1-1)
where:ηi = ηD ηR ηI
· ηi ≥ 0.95 for maximum γ’s
· ηi = < 1.00 for minimum γ’s
γi = Load factorφ = Resistance factorQi = Nominal force effect Rn = Nominal resistanceRr = Factored resistance = φRn
IRD
1ηηη
LRFD Limit StatesThe LRFD Specifications require examination of several load combinations corresponding to the following limit states:
SERVICE LIMIT STATErelating to stress, deformation, and cracking
FATIGUE & FRACTURE LIMIT STATE relating to stress range and crack growth under repetitive loads, and material toughness
STRENGTH LIMIT STATE relating to strength and stability
- (CONSTRUCTIBILITY)EXTREME EVENT LIMIT STATE
relating to events such as earthquakes, ice load, and vehicle and vessel collision
Introduction to LRFD 1-4
3.3.2 Load and Load Designation STRENGTH I : without wind.
STRENGTH II : owner design / permit vehicles without wind.
STRENGTH III : wind exceeding 55 mph.
STRENGTH IV : very high dead-to-live load ratios.
STRENGTH V : vehicular use with 55 mph wind.
SERVICE I : normal operational use of the bridge with a 55 mph wind and nominal loads.Also control cracking of reinforced concrete structures.
SERVICE II : control yielding of steel structures and slip of connections
SERVICE III : control cracking of prestressed concrete superstructures.
SERVICE IV : control cracking of prestressed concrete substructures.
FATIGUE : repetitive vehicular live load and dynamic responses under a single truck.
3.3.2 Load and Load Designation DD = downdragDC = dead load of structural components and nonstructural attachmentsDW = dead load of wearing surfaces and utilitiesEH = horizontal earth pressureEL = accumulated locked-in force effects resulting from the construction process, including the
secondary forces from post-tensioningES = earth surcharge loadEV = earth fill vertical pressureBR = braking forceCE = centrifugal forceCR = creepCT = vehicular collision forceCV = vessel collision forceEQ = earthquakeFR = frictionIC = ice loadIM = dynamic load allowanceLL = live loadLS = live load surchargePL = pedestrian live loadSE = settlementSH = shrinkageTG = temperature gradientTU = uniform temperatureWA = water load and stream pressure WL = wind on live loadWS = wind load on structure
Introduction to LRFD 1-5
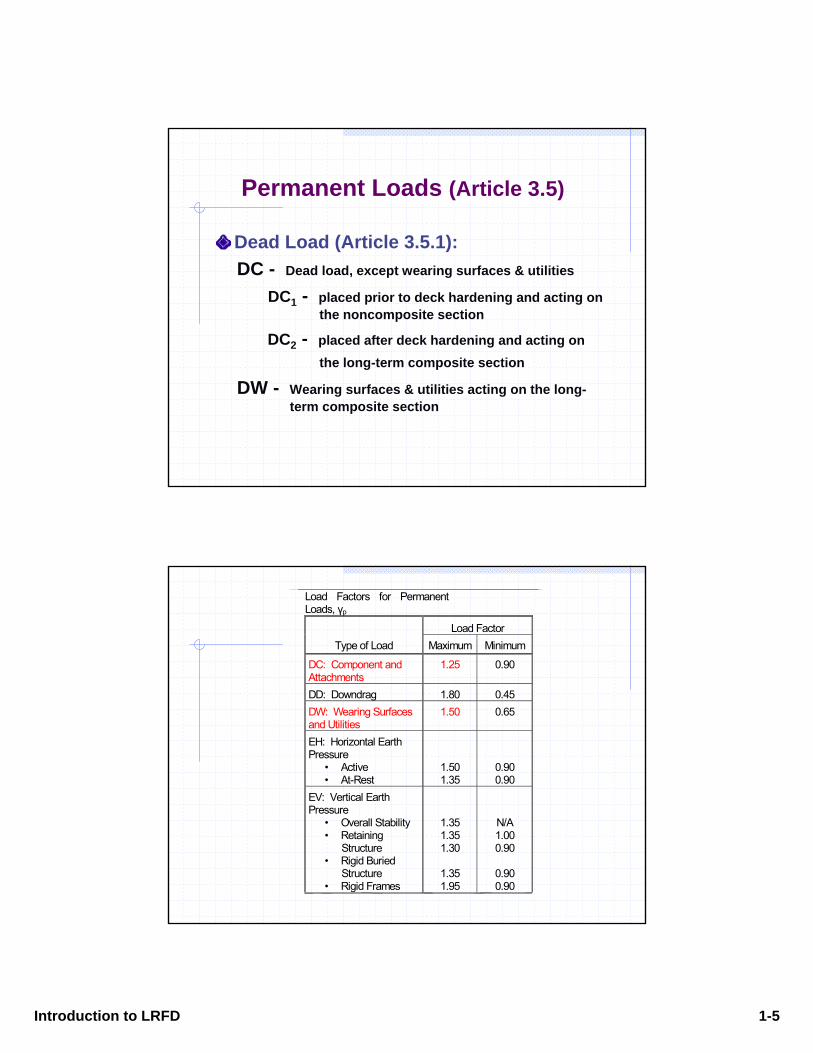
Permanent Loads (Article 3.5)
Dead Load (Article 3.5.1):DC - Dead load, except wearing surfaces & utilities
DC1 - placed prior to deck hardening and acting on the noncomposite section
DC2 - placed after deck hardening and acting on the long-term composite section
DW - Wearing surfaces & utilities acting on the long-term composite section
Load Factors for PermanentLoads, γp
Load FactorType of Load Maximum Minimum
DC: Component andAttachments
1.25 0.90
DD: Downdrag 1.80 0.45DW: Wearing Surfacesand Utilities
1.50 0.65
EH: Horizontal EarthPressure
• Active• At-Rest
1.501.35
0.900.90
EV: Vertical EarthPressure
• Overall Stability• Retaining
Structure• Rigid Buried
Structure• Rigid Frames
1.351.351.30
1.351.95
N/A1.000.90
0.900.90
Introduction to LRFD 1-6
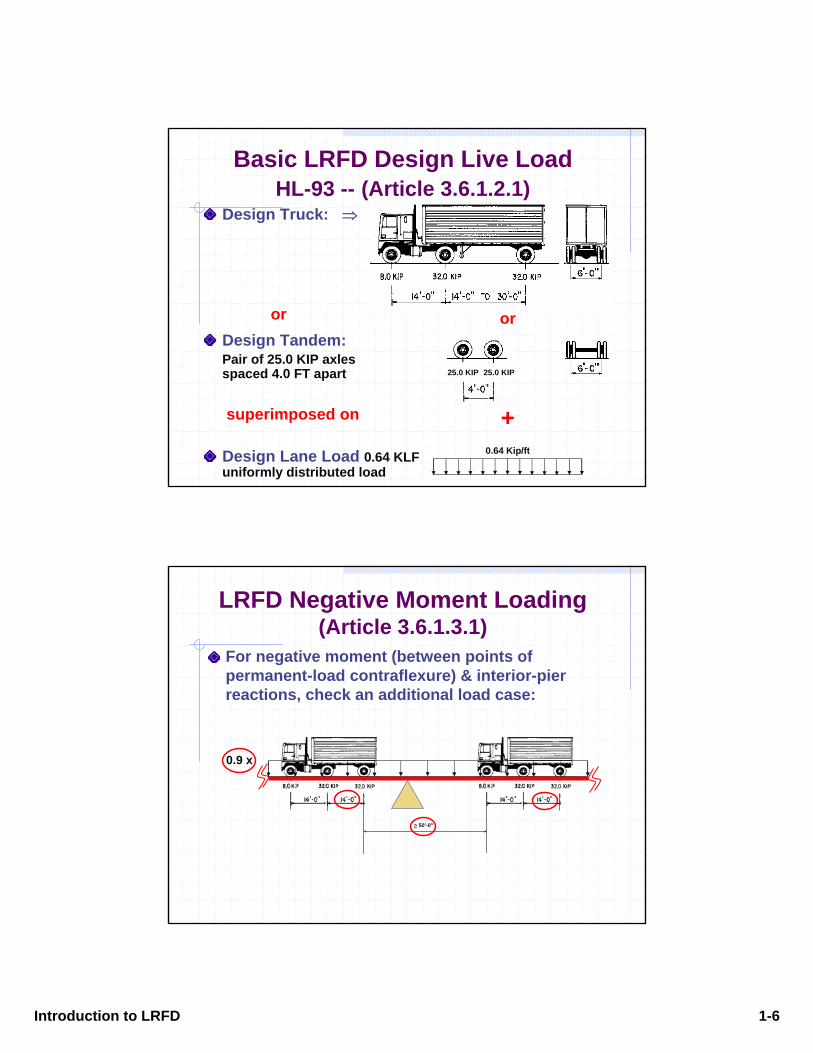
Basic LRFD Design Live LoadHL-93 -- (Article 3.6.1.2.1)
Design Truck: ⇒
Design Tandem:Pair of 25.0 KIP axles spaced 4.0 FT apart
superimposed on
Design Lane Load 0.64 KLF uniformly distributed load
0.64 Kip/ft
+
oror
25.0 KIP25.0 KIP
LRFD Negative Moment Loading(Article 3.6.1.3.1)
For negative moment (between points of permanent-load contraflexure) & interior-pier reactions, check an additional load case:
> 50’-0”
0.9 x
Introduction to LRFD 1-7
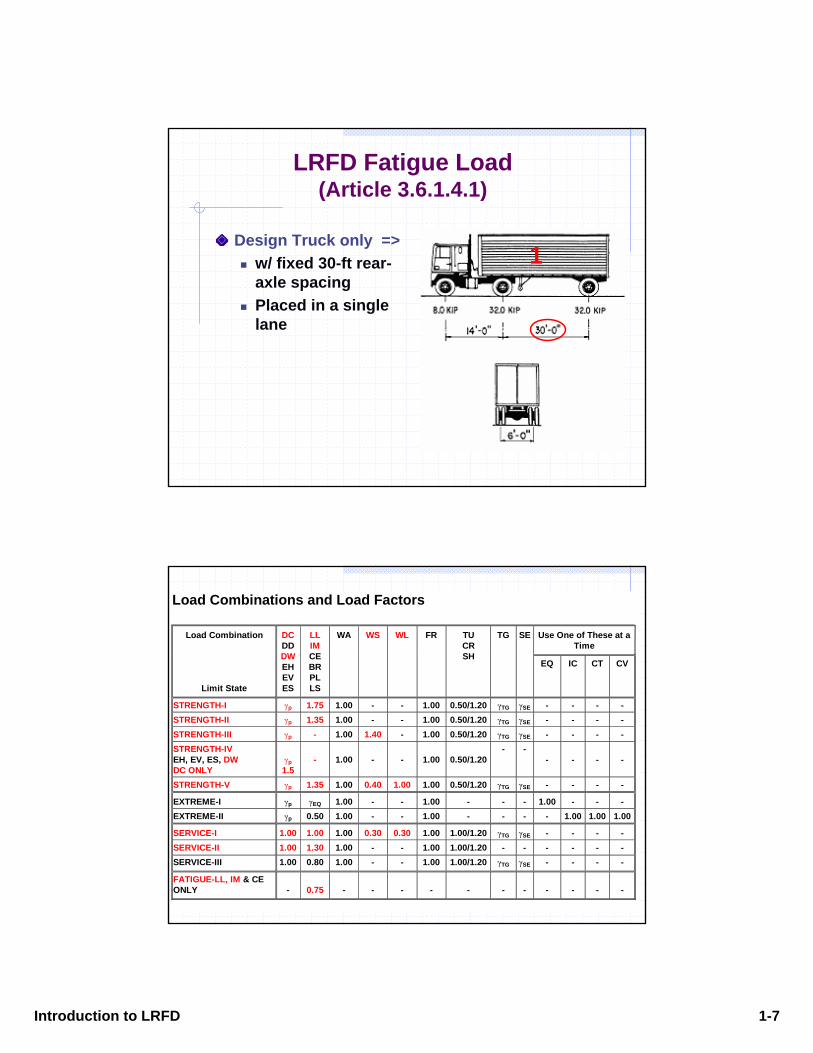
LRFD Fatigue Load(Article 3.6.1.4.1)
Design Truck only =>w/ fixed 30-ft rear-axle spacingPlaced in a single lane
1
Load Combinations and Load Factors
Use One of These at a
Time
Load Combination
Limit State
DC DD DW EH EV ES
LL IM CE BR PL LS
WA
WS
WL
FR
TU CR SH
TG
SE
EQ
IC
CT
CV
STRENGTH-I
γp
1.75
1.00
-
-
1.00
0.50/1.20
γTG
γSE
-
-
-
-
STRENGTH-II γp
1.35
1.00
-
-
1.00
0.50/1.20
γTG
γSE
-
-
-
-
STRENGTH-III γp
-
1.00
1.40
-
1.00
0.50/1.20
γTG
γSE
-
-
-
-
STRENGTH-IV EH, EV, ES, DW DC ONLY
γp 1.5
-
1.00
-
-
1.00
0.50/1.20
-
-
-
-
-
-
STRENGTH-V
γp
1.35
1.00
0.40
1.00
1.00
0.50/1.20
γTG
γSE
-
-
-
-
EXTREME-I
γp
γEQ
1.00
-
-
1.00
-
-
-
1.00
-
-
-
EXTREME-II γp
0.50
1.00
-
-
1.00
-
-
-
-
1.00
1.00
1.00
SERVICE-I
1.00
1.00
1.00
0.30
0.30
1.00
1.00/1.20
γTG
γSE
-
-
-
-
SERVICE-II 1.00
1.30
1.00
-
-
1.00
1.00/1.20
-
-
-
-
-
-
SERVICE-III 1.00
0.80
1.00
-
-
1.00
1.00/1.20
γTG
γSE
-
-
-
-
FATIGUE-LL, IM & CE ONLY
-
0.75
-
-
-
-
-
-
-
-
-
-
-
Introduction to LRFD 1-8
Resistance Factors(Article 6.5.4.2)
Resistance factors, φ, for the strength limit state shall be taken as follows: • For flexure φf = 1.00 • For shear φv = 1.00 • For axial compression, steel only φc = 0.90 • For axial compression, composite φc = 0.90 • For tension, fracture in net section φu = 0.80 • For tension, yielding in gross section φy = 0.95 • For bolts bearing on material φbb = 0.80 • For shear connectors φsc = 0.85 • For A 325 and A 490 bolts in shear φs = 0.80 • For block shear φbs = 0.80 • For web crippling φw = 0.80 • For weld metal in fillet welds:
• tension or compression parallel to axis of the weld same as base metal • shear in throat of weld metal φe2 = 0.80
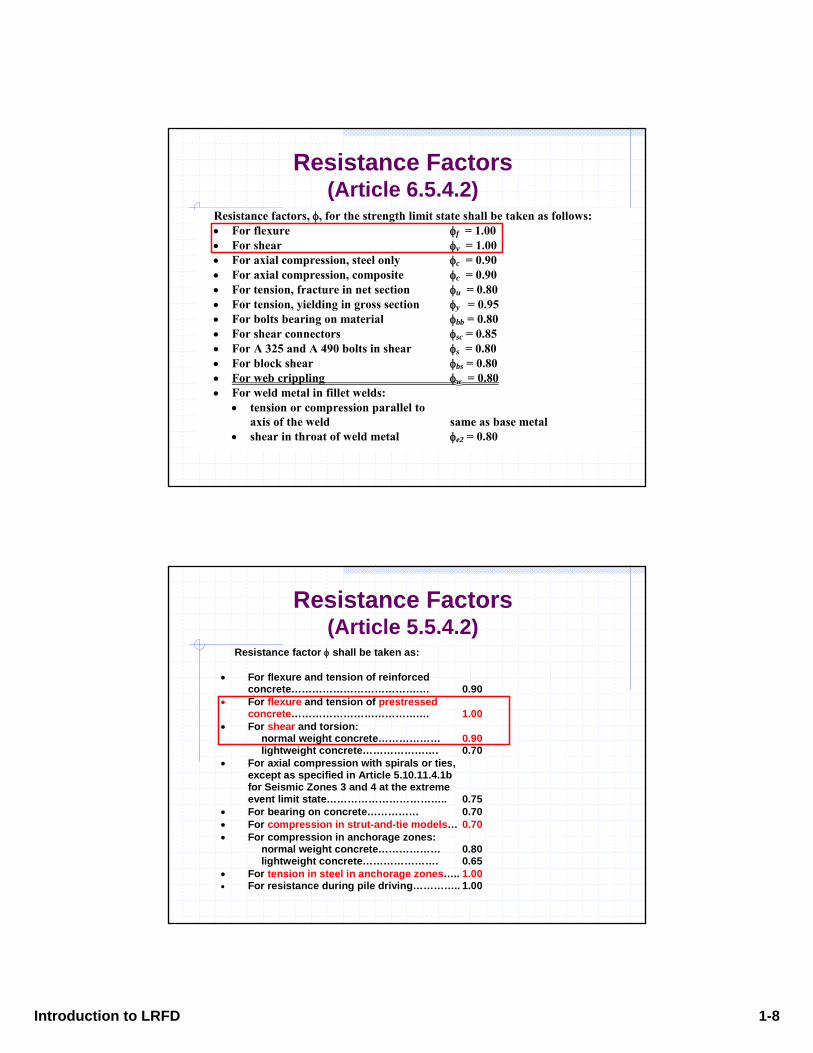
Resistance Factors(Article 5.5.4.2)
Resistance factor φ shall be taken as:
• For flexure and tension of reinforced concrete……………………………….… 0.90 • For flexure and tension of prestressed concrete……………………………….… 1.00 • For shear and torsion:
normal weight concrete……………… 0.90 lightweight concrete…………………. 0.70
• For axial compression with spirals or ties, except as specified in Article 5.10.11.4.1b for Seismic Zones 3 and 4 at the extreme event limit state…………………………….. 0.75
• For bearing on concrete…………… 0.70 • For compression in strut-and-tie models… 0.70 • For compression in anchorage zones:
normal weight concrete……………… 0.80 lightweight concrete…………………. 0.65
• For tension in steel in anchorage zones….. 1.00 • For resistance during pile driving………….. 1.00
Introduction to LRFD 1-9
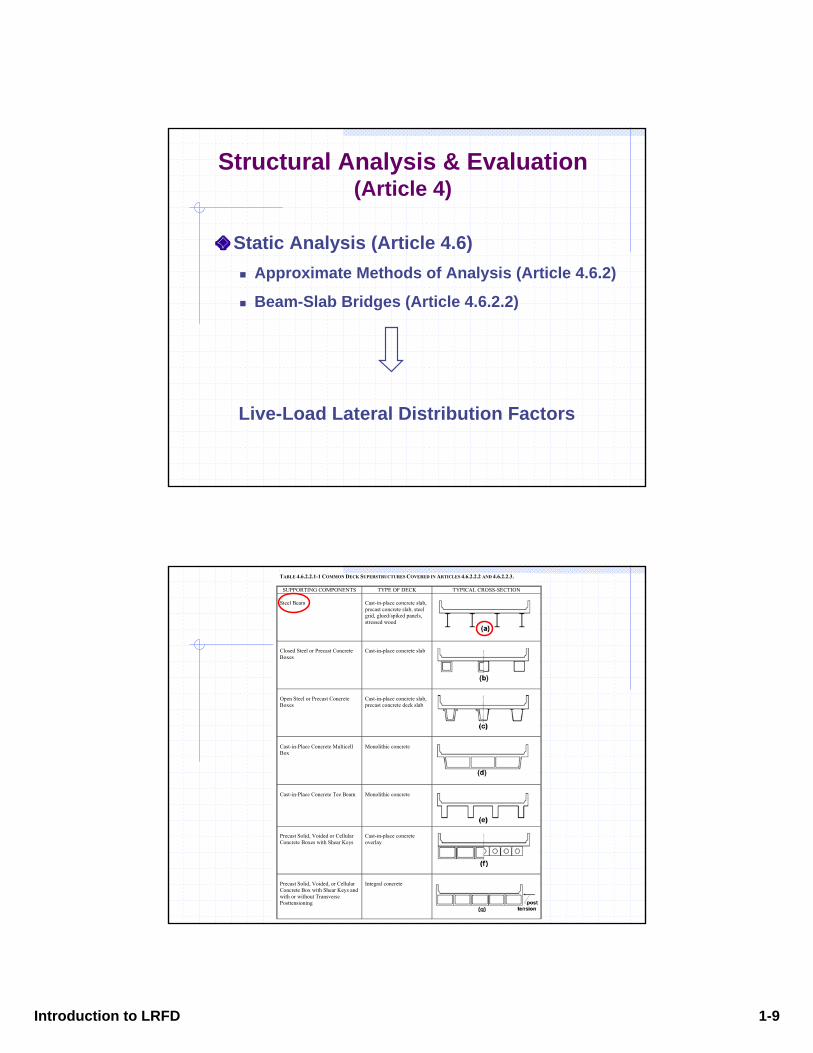
Static Analysis (Article 4.6)Approximate Methods of Analysis (Article 4.6.2)
Beam-Slab Bridges (Article 4.6.2.2)
Structural Analysis & Evaluation (Article 4)
Live-Load Lateral Distribution Factors
TABLE 4.6.2.2.1-1 COMMON DECK SUPERSTRUCTURES COVERED IN ARTICLES 4.6.2.2.2 AND 4.6.2.2.3.
SUPPORTING COMPONENTS TYPE OF DECK TYPICAL CROSS-SECTION Steel Beam
Cast-in-place concrete slab, precast concrete slab, steel grid, glued/spiked panels, stressed wood
Closed Steel or Precast Concrete Boxes
Cast-in-place concrete slab
Open Steel or Precast Concrete Boxes
Cast-in-place concrete slab, precast concrete deck slab
Cast-in-Place Concrete Multicell Box
Monolithic concrete
Cast-in-Place Concrete Tee Beam
Monolithic concrete
Precast Solid, Voided or Cellular Concrete Boxes with Shear Keys
Cast-in-place concrete overlay
Precast Solid, Voided, or Cellular Concrete Box with Shear Keys and with or without Transverse Posttensioning
Integral concrete
Introduction to LRFD 1-10
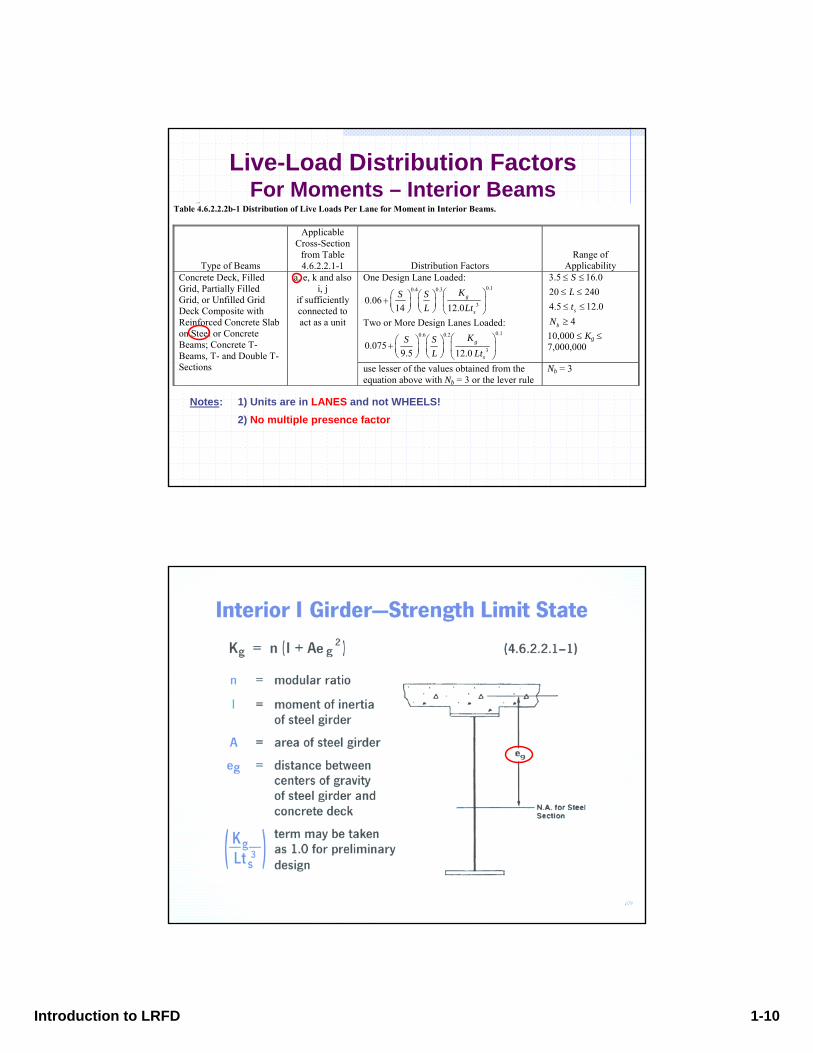
Table 4.6.2.2.2b-1 Distribution of Live Loads Per Lane for Moment in Interior Beams.
Type of Beams
Applicable Cross-Section
from Table 4.6.2.2.1-1 Distribution Factors
Range of Applicability
One Design Lane Loaded: 0.10.4 0.3
30.0614 12.0
g
s
KS SL Lt
⎛ ⎞⎛ ⎞ ⎛ ⎞+ ⎜ ⎟⎜ ⎟ ⎜ ⎟⎝ ⎠ ⎝ ⎠ ⎝ ⎠
Two or More Design Lanes Loaded: 0.10.6 0.2
30.0759.5 12.0
g
s
KS SL Lt
⎛ ⎞⎛ ⎞ ⎛ ⎞+ ⎜ ⎟⎜ ⎟ ⎜ ⎟⎝ ⎠ ⎝ ⎠ ⎝ ⎠
3.5 16.020 2404.5 12.0
4s
b
SLt
N
≤ ≤≤ ≤≤ ≤≥
10,000 ≤ Kg ≤ 7,000,000
Concrete Deck, Filled Grid, Partially Filled Grid, or Unfilled Grid Deck Composite with Reinforced Concrete Slab on Steel or Concrete Beams; Concrete T-Beams, T- and Double T-Sections
a, e, k and also i, j
if sufficiently connected to act as a unit
use lesser of the values obtained from the equation above with Nb = 3 or the lever rule
Nb = 3
Live-Load Distribution FactorsFor Moments – Interior Beams
Notes: 1) Units are in LANES and not WHEELS!2) No multiple presence factor
Introduction to LRFD 1-11
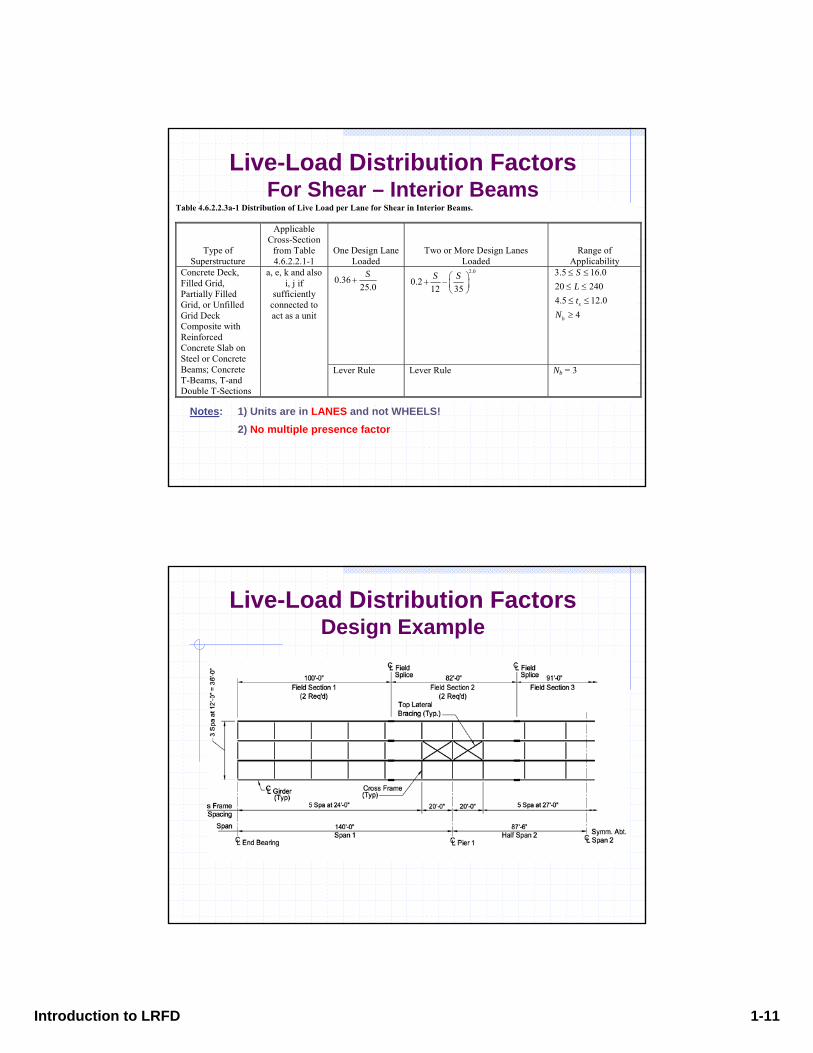
Table 4.6.2.2.3a-1 Distribution of Live Load per Lane for Shear in Interior Beams.
Type of Superstructure
Applicable Cross-Section
from Table 4.6.2.2.1-1
One Design Lane Loaded
Two or More Design Lanes Loaded
Range of Applicability
0.3625.0
S+
2.0
0.212 35S S⎛ ⎞+ − ⎜ ⎟
⎝ ⎠
3.5 16.020 2404.5 12.0
4s
b
SLt
N
≤ ≤≤ ≤≤ ≤
≥
Concrete Deck, Filled Grid, Partially Filled Grid, or Unfilled Grid Deck Composite with Reinforced Concrete Slab on Steel or Concrete Beams; Concrete T-Beams, T-and Double T-Sections
a, e, k and also i, j if
sufficiently connected to act as a unit
Lever Rule Lever Rule Nb = 3
Live-Load Distribution FactorsFor Shear – Interior Beams
Notes: 1) Units are in LANES and not WHEELS!2) No multiple presence factor
Live-Load Distribution FactorsDesign Example
Introduction to LRFD 1-12
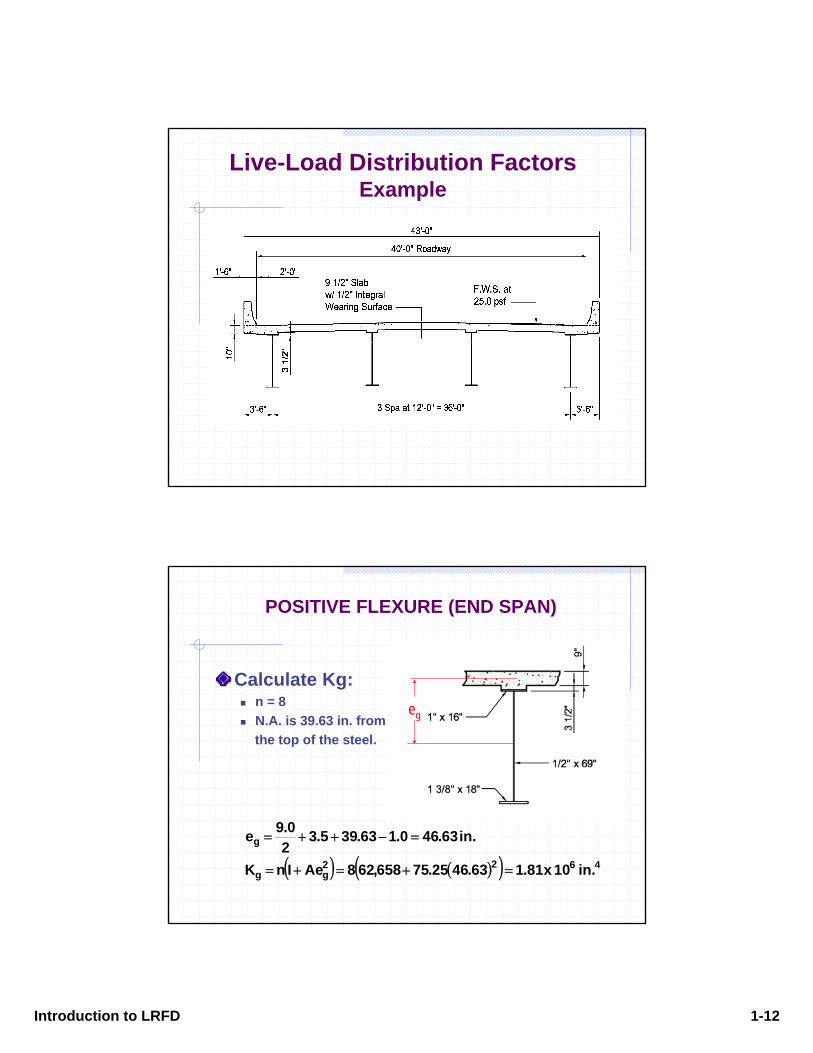
Live-Load Distribution Factors Example
POSITIVE FLEXURE (END SPAN)
Calculate Kg:n = 8N.A. is 39.63 in. fromthe top of the steel.
( ) ( )( ) 4622gg
g
in. 10 x 81.163.4625.75658,628AeInK
in. 63.460.163.395.320.9e
=+=+=
=−++=
eg
Introduction to LRFD 1-13
SL
tS
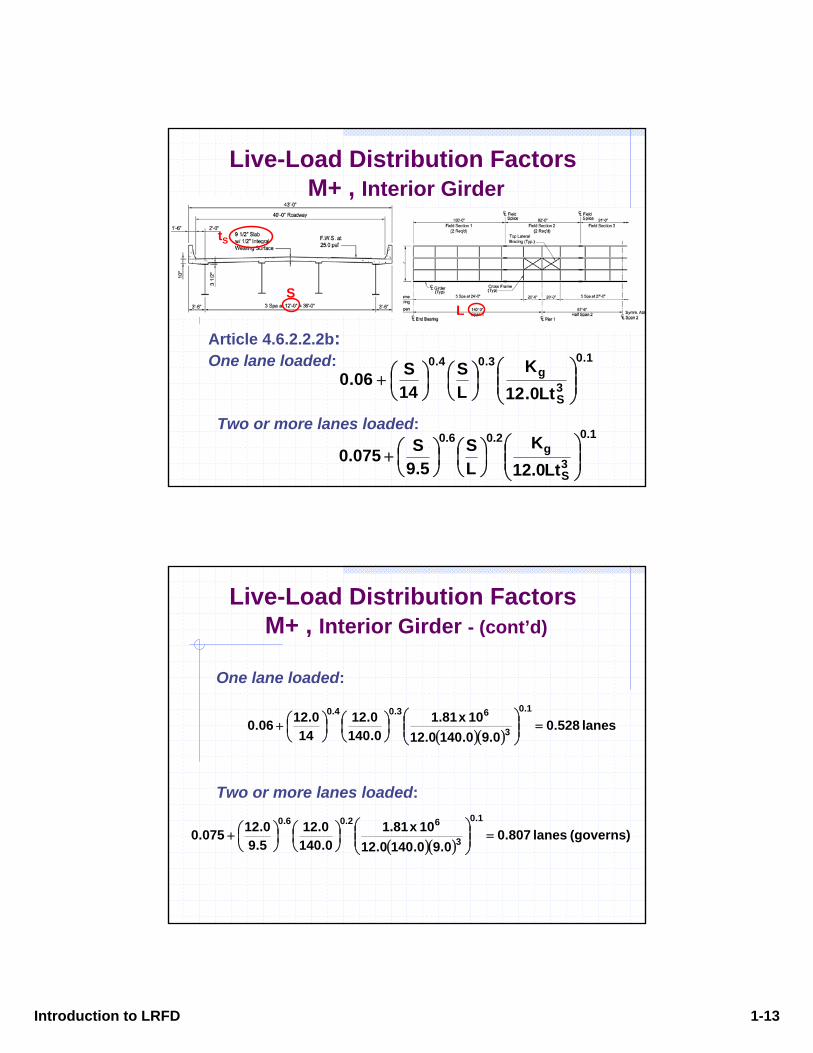
Live-Load Distribution FactorsM+ , Interior Girder
Article 4.6.2.2.2b:One lane loaded:
Two or more lanes loaded:
1.0
3S
g3.04.0
Lt0.12K
LS
14S06.0 ⎟⎟
⎠
⎞⎜⎜⎝
⎛⎟⎠⎞
⎜⎝⎛
⎟⎠⎞
⎜⎝⎛+
1.0
3S
g2.06.0
Lt0.12K
LS
5.9S075.0 ⎟⎟
⎠
⎞⎜⎜⎝
⎛⎟⎠⎞
⎜⎝⎛
⎟⎠⎞
⎜⎝⎛+
Live-Load Distribution FactorsM+ , Interior Girder - (cont’d)
One lane loaded:
Two or more lanes loaded:
( )( )lanes 528.0
0.90.1400.1210 x .811
0.1400.12
140.1206.0
1.0
3
63.04.0=⎟⎟
⎠
⎞⎜⎜⎝
⎛⎟⎠⎞
⎜⎝⎛
⎟⎠⎞
⎜⎝⎛+
( )( )(governs) lanes 807.0
0.90.1400.1210 x .811
0.1400.12
5.90.12075.0
1.0
3
62.06.0=⎟⎟
⎠
⎞⎜⎜⎝
⎛⎟⎠⎞
⎜⎝⎛
⎟⎠⎞
⎜⎝⎛+
Introduction to LRFD 1-14
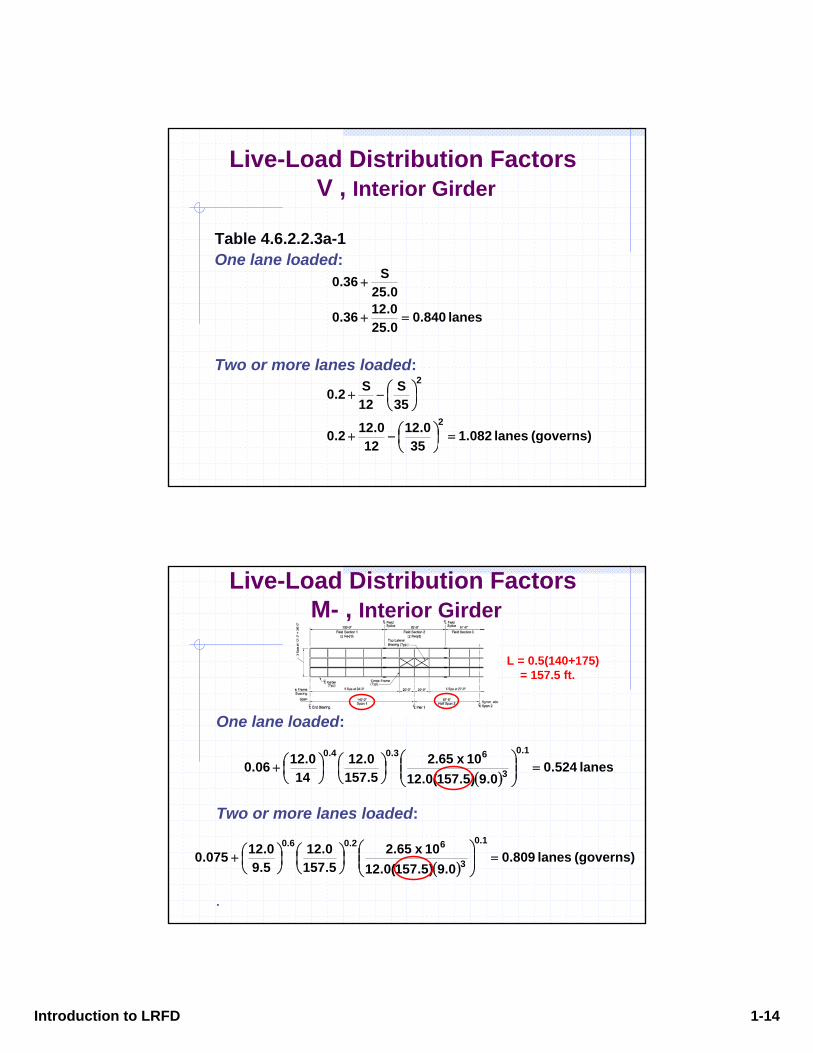
Table 4.6.2.2.3a-1One lane loaded:
Two or more lanes loaded:
lanes 840.00.250.1236.0
0.25S36.0
=+
+
(governs) lanes 082.135
0.1212
0.122.0
35S
12S2.0
2
2
=⎟⎠⎞
⎜⎝⎛−+
⎟⎠⎞
⎜⎝⎛−+
Live-Load Distribution FactorsV , Interior Girder
One lane loaded:
Two or more lanes loaded:
.
( )lanes 524.0
0.9)5.157(0.1210 x .652
5.1570.12
140.1206.0
1.0
3
63.04.0=⎟⎟
⎠
⎞⎜⎜⎝
⎛⎟⎠⎞
⎜⎝⎛
⎟⎠⎞
⎜⎝⎛+
( )(governs) lanes 809.0
0.9)5.157(0.1210 x .652
5.1570.12
5.90.12075.0
1.0
3
62.06.0=⎟⎟
⎠
⎞⎜⎜⎝
⎛⎟⎠⎞
⎜⎝⎛
⎟⎠⎞
⎜⎝⎛+
Live-Load Distribution FactorsM- , Interior Girder
L = 0.5(140+175)= 157.5 ft.
Introduction to LRFD 1-15
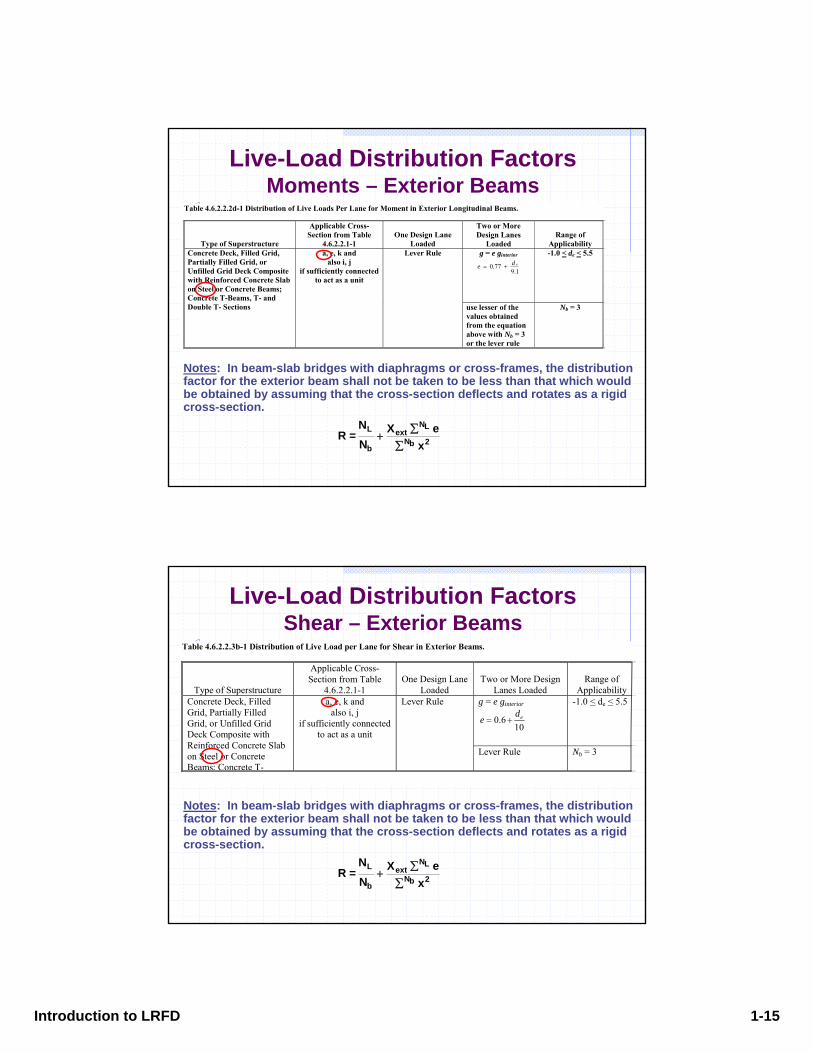
Table 4.6.2.2.2d-1 Distribution of Live Loads Per Lane for Moment in Exterior Longitudinal Beams.
Type of Superstructure
Applicable Cross-Section from Table
4.6.2.2.1-1 One Design Lane
Loaded
Two or More Design Lanes
Loaded Range of
Applicability g = e ginterior
0.779.1
ede = +
-1.0 < de < 5.5 Concrete Deck, Filled Grid, Partially Filled Grid, or Unfilled Grid Deck Composite with Reinforced Concrete Slab on Steel or Concrete Beams; Concrete T-Beams, T- and Double T- Sections
a, e, k and also i, j
if sufficiently connected to act as a unit
Lever Rule
use lesser of the values obtained from the equation above with Nb = 3 or the lever rule
Nb = 3
Live-Load Distribution FactorsMoments – Exterior Beams
Notes: In beam-slab bridges with diaphragms or cross-frames, the distribution factor for the exterior beam shall not be taken to be less than that which would be obtained by assuming that the cross-section deflects and rotates as a rigid cross-section.
2bN
LNext
b
L
xeX
NN =R
∑∑
+
Table 4.6.2.2.3b-1 Distribution of Live Load per Lane for Shear in Exterior Beams.
Type of Superstructure
Applicable Cross-Section from Table
4.6.2.2.1-1 One Design Lane
Loaded Two or More Design
Lanes Loaded Range of
Applicability g = e ginterior
0.610
ede = +
-1.0 < de < 5.5 Concrete Deck, Filled Grid, Partially Filled Grid, or Unfilled Grid Deck Composite with Reinforced Concrete Slab on Steel or Concrete Beams; Concrete T-
a, e, k and also i, j
if sufficiently connected to act as a unit
Lever Rule
Lever Rule Nb = 3
Live-Load Distribution FactorsShear – Exterior Beams
Notes: In beam-slab bridges with diaphragms or cross-frames, the distribution factor for the exterior beam shall not be taken to be less than that which would be obtained by assuming that the cross-section deflects and rotates as a rigid cross-section.
2bN
LNext
b
L
xeX
NN =R
∑∑
+
Introduction to LRFD 1-16
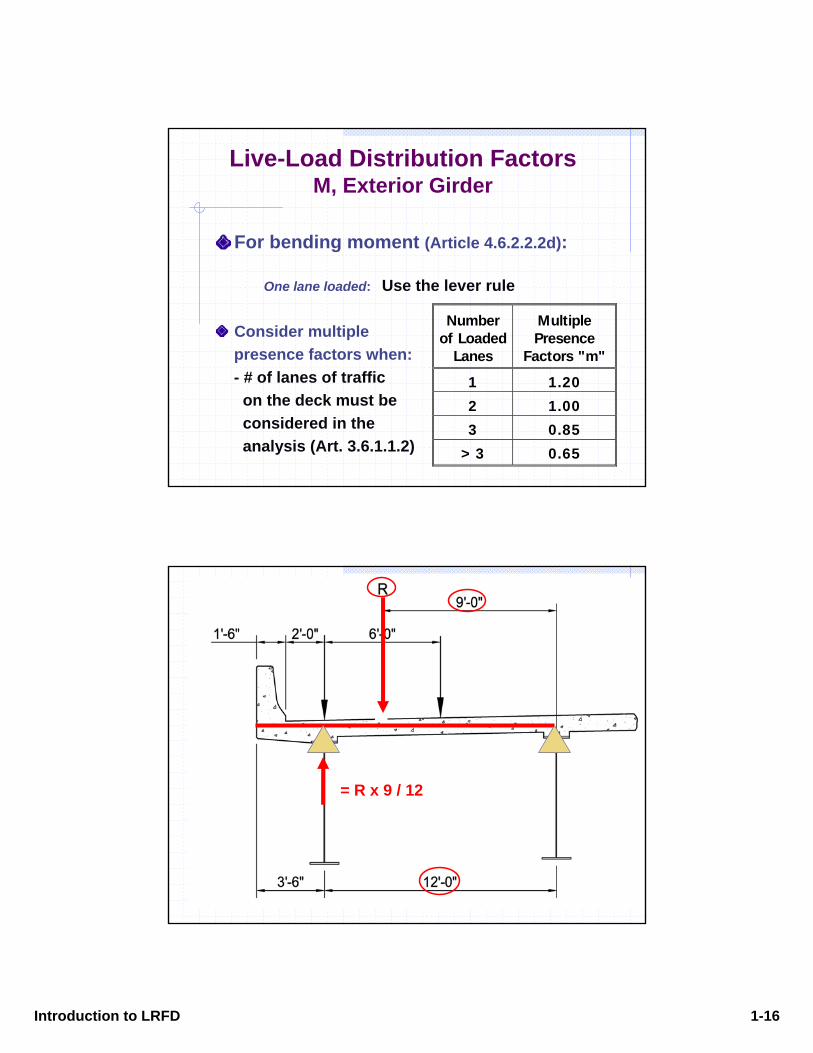
For bending moment (Article 4.6.2.2.2d):
One lane loaded: Use the lever rule
Consider multiplepresence factors when:- # of lanes of traffic on the deck must beconsidered in theanalysis (Art. 3.6.1.1.2)
Numberof Loaded
Lanes
MultiplePresence
Factors "m"
1 1.202 1.003 0.85
> 3 0.65
Live-Load Distribution FactorsM, Exterior Girder
= R x 9 / 12
Introduction to LRFD 1-17
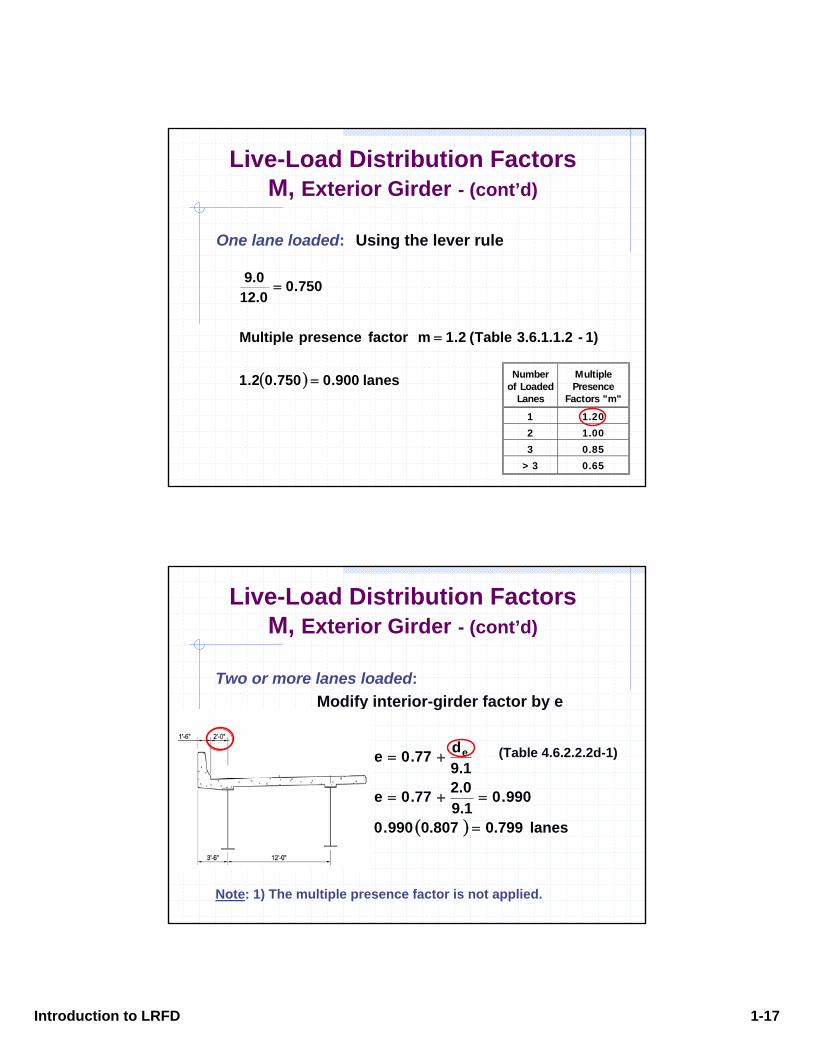
Live-Load Distribution FactorsM, Exterior Girder - (cont’d)
One lane loaded: Using the lever rule
( ) lanes 900.0750.02.1
1)-3.6.1.1.2 Table( 2.1 m factor presenceMultiple
750.012.09.0
=
=
=
Numberof Loaded
Lanes
MultiplePresence
Factors "m"
1 1.202 1.003 0.85
> 3 0.65
Two or more lanes loaded: Modify interior-girder factor by e
(Table 4.6.2.2.2d-1)
Note: 1) The multiple presence factor is not applied.
( ) lanes 0.7990.807990.0
990.09.12.0.770e
9.1d.770e e
=
=+=
+=
Live-Load Distribution FactorsM, Exterior Girder - (cont’d)
Introduction to LRFD 1-18
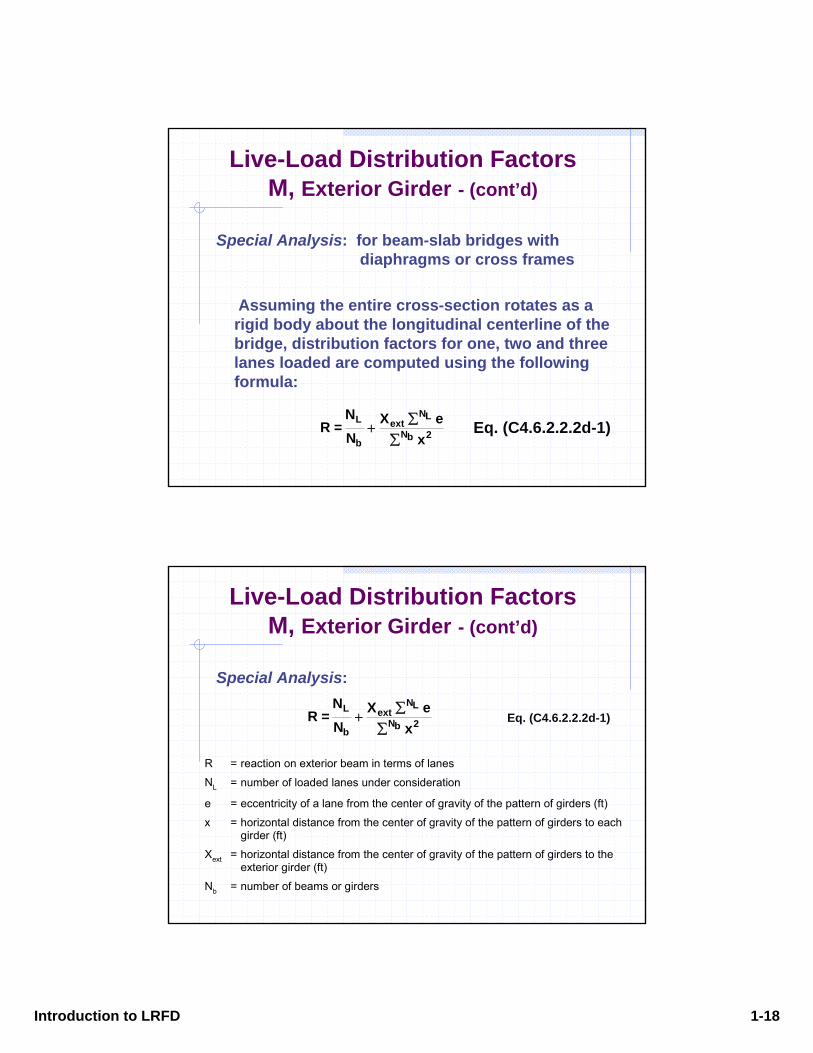
Special Analysis: for beam-slab bridges with diaphragms or cross frames
Assuming the entire cross-section rotates as a rigid body about the longitudinal centerline of the bridge, distribution factors for one, two and three lanes loaded are computed using the following formula:
Eq. (C4.6.2.2.2d-1)2bN
LNext
b
L
xeX
NN =R
∑∑
+
Live-Load Distribution FactorsM, Exterior Girder - (cont’d)
Special Analysis:
Eq. (C4.6.2.2.2d-1)2bN
LNext
b
L
xeX
NN =R
∑∑
+
R = reaction on exterior beam in terms of lanes
NL = number of loaded lanes under consideration
e = eccentricity of a lane from the center of gravity of the pattern of girders (ft)
x = horizontal distance from the center of gravity of the pattern of girders to eachgirder (ft)
Xext = horizontal distance from the center of gravity of the pattern of girders to theexterior girder (ft)
Nb = number of beams or girders
Live-Load Distribution FactorsM, Exterior Girder - (cont’d)
Introduction to LRFD 1-19
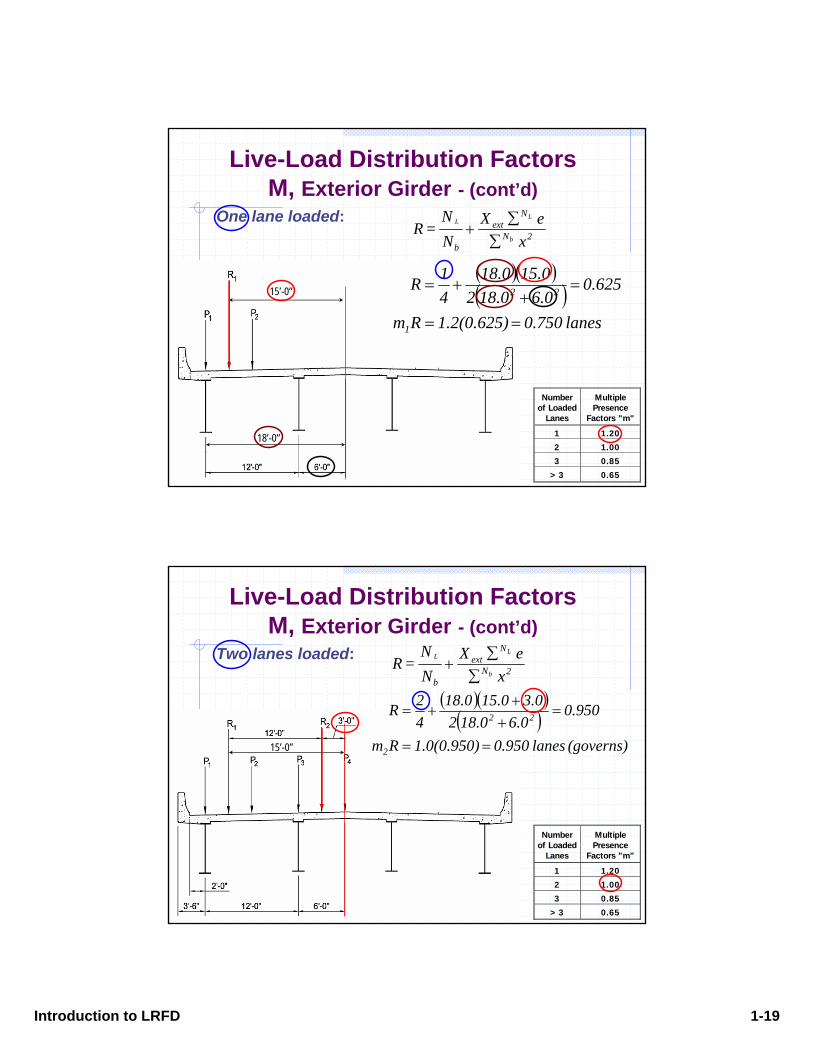
One lane loaded:
Live-Load Distribution FactorsM, Exterior Girder - (cont’d)
( )( )( )
lanes 750.01.2(0.625)Rm
625.00.60.8120.15.081
41R
1
22
==
=+
+=
2N
Next
b xeX
NN
= Rb
LL
∑∑
+
18’-0”
15’-0”
Numberof Loaded
Lanes
MultiplePresence
Factors "m"
1 1.202 1.003 0.85
> 3 0.65
Two lanes loaded:
( )( )( )
(governs) lanes 950.01.0(0.950)Rm
950.00.60.812
0.30.150.8142R
2
22
==
=+
++=
Live-Load Distribution FactorsM, Exterior Girder - (cont’d)
Numberof Loaded
Lanes
MultiplePresence
Factors "m"
1 1.202 1.003 0.85
> 3 0.65
15’-0”
2N
Next
b xeX
NN
= Rb
LL
∑∑
+
Introduction to LRFD 1-20
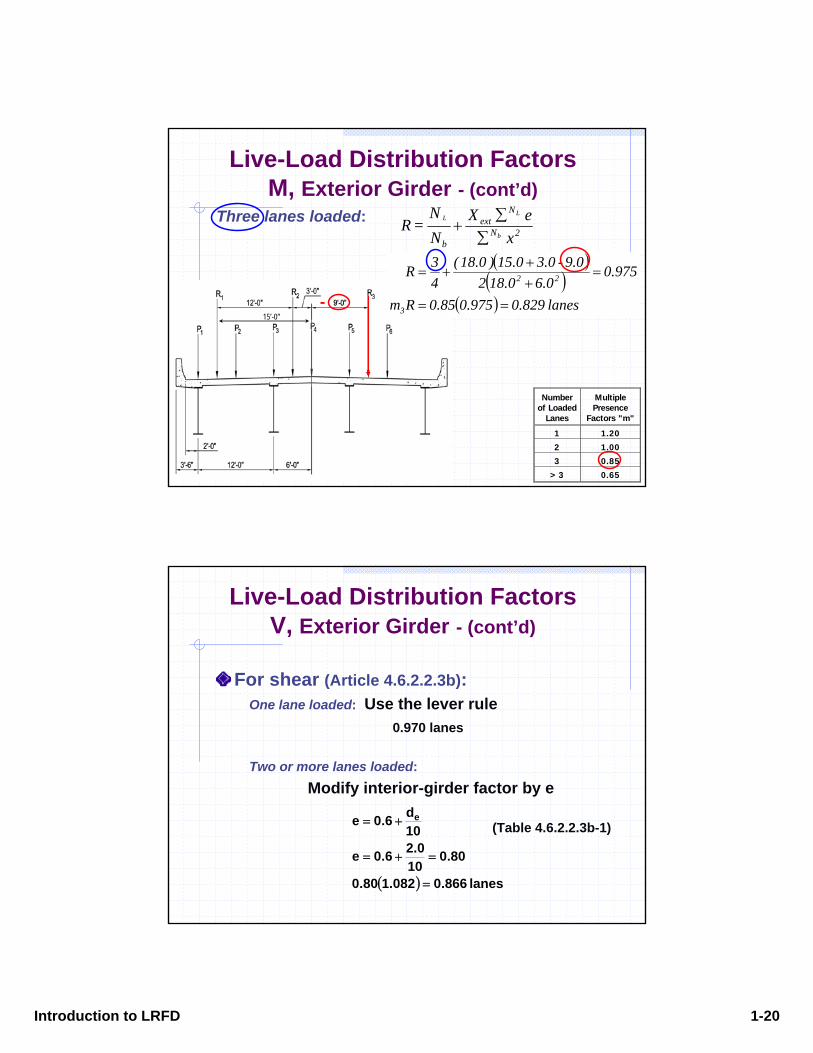
Three lanes loaded:
Live-Load Distribution FactorsM, Exterior Girder - (cont’d)
Numberof Loaded
Lanes
MultiplePresence
Factors "m"
1 1.202 1.003 0.85
> 3 0.65
15’-0”-
( )( )
( ) lanes 0.8290.975.850Rm
975.00.60.812
9.0-0.30.51)8.01(43R
3
22
==
=++
+=
2N
Next
b xeX
NN
= Rb
LL
∑∑
+
For shear (Article 4.6.2.2.3b):One lane loaded: Use the lever rule
0.970 lanes
Two or more lanes loaded: Modify interior-girder factor by e
(Table 4.6.2.2.3b-1)
( ) lanes 866.0082.180.0
80.010
0.26.0e
10d6.0e e
=
=+=
+=
Live-Load Distribution FactorsV, Exterior Girder - (cont’d)
Introduction to LRFD 1-21
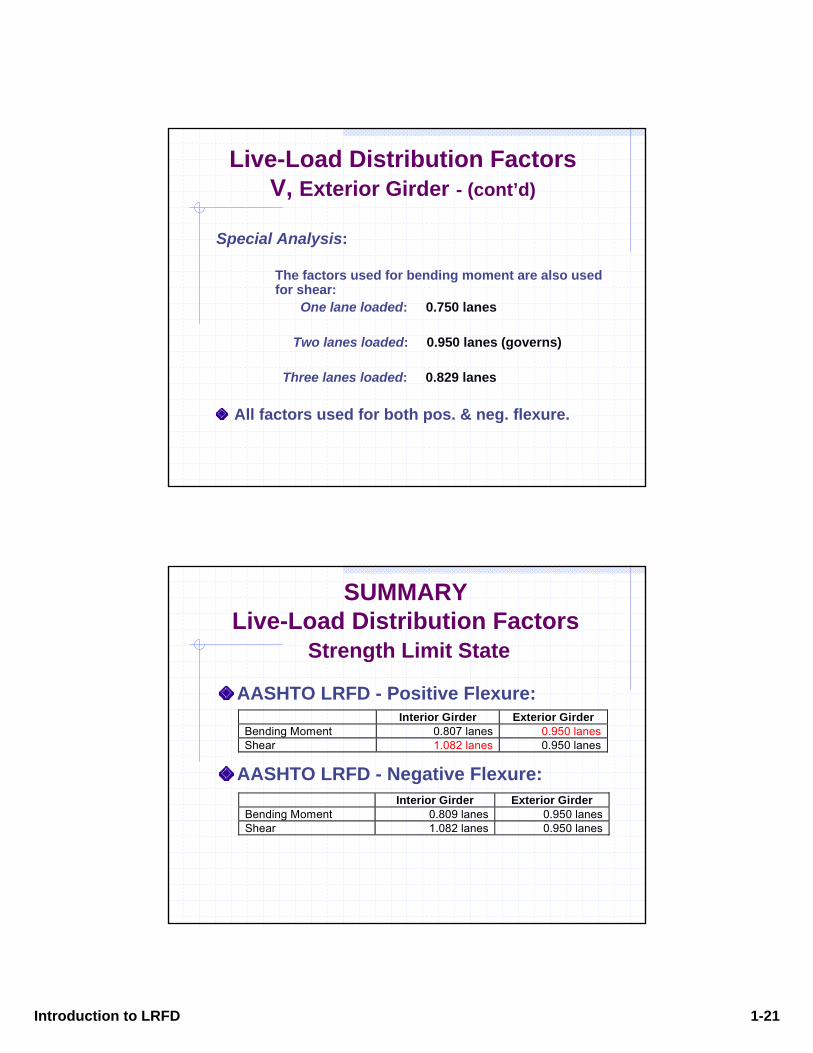
Special Analysis:
The factors used for bending moment are also used for shear:
One lane loaded: 0.750 lanes
Two lanes loaded: 0.950 lanes (governs)
Three lanes loaded: 0.829 lanes
All factors used for both pos. & neg. flexure.
Live-Load Distribution FactorsV, Exterior Girder - (cont’d)
AASHTO LRFD - Positive Flexure:
AASHTO LRFD - Negative Flexure:Interior Girder Exterior Girder
Bending Moment 0.809 lanes 0.950 lanesShear 1.082 lanes 0.950 lanes
Interior Girder Exterior GirderBending Moment 0.807 lanes 0.950 lanesShear 1.082 lanes 0.950 lanes
SUMMARYLive-Load Distribution Factors
Strength Limit State
Introduction to LRFD 1-22
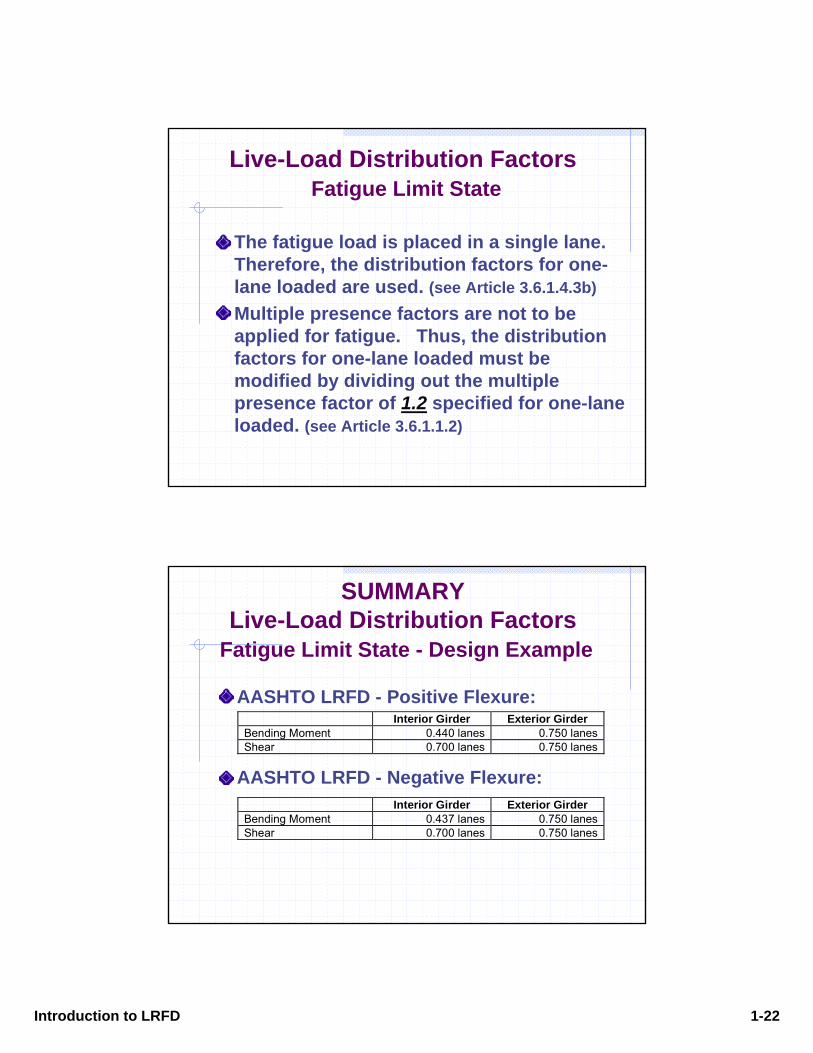
The fatigue load is placed in a single lane. Therefore, the distribution factors for one-lane loaded are used. (see Article 3.6.1.4.3b)Multiple presence factors are not to be applied for fatigue. Thus, the distribution factors for one-lane loaded must be modified by dividing out the multiple presence factor of 1.2 specified for one-lane loaded. (see Article 3.6.1.1.2)
Live-Load Distribution FactorsFatigue Limit State
AASHTO LRFD - Positive Flexure:
AASHTO LRFD - Negative Flexure:
Interior Girder Exterior GirderBending Moment 0.440 lanes 0.750 lanesShear 0.700 lanes 0.750 lanes
Interior Girder Exterior GirderBending Moment 0.437 lanes 0.750 lanesShear 0.700 lanes 0.750 lanes
SUMMARYLive-Load Distribution Factors
Fatigue Limit State - Design Example
Introduction to LRFD 1-23
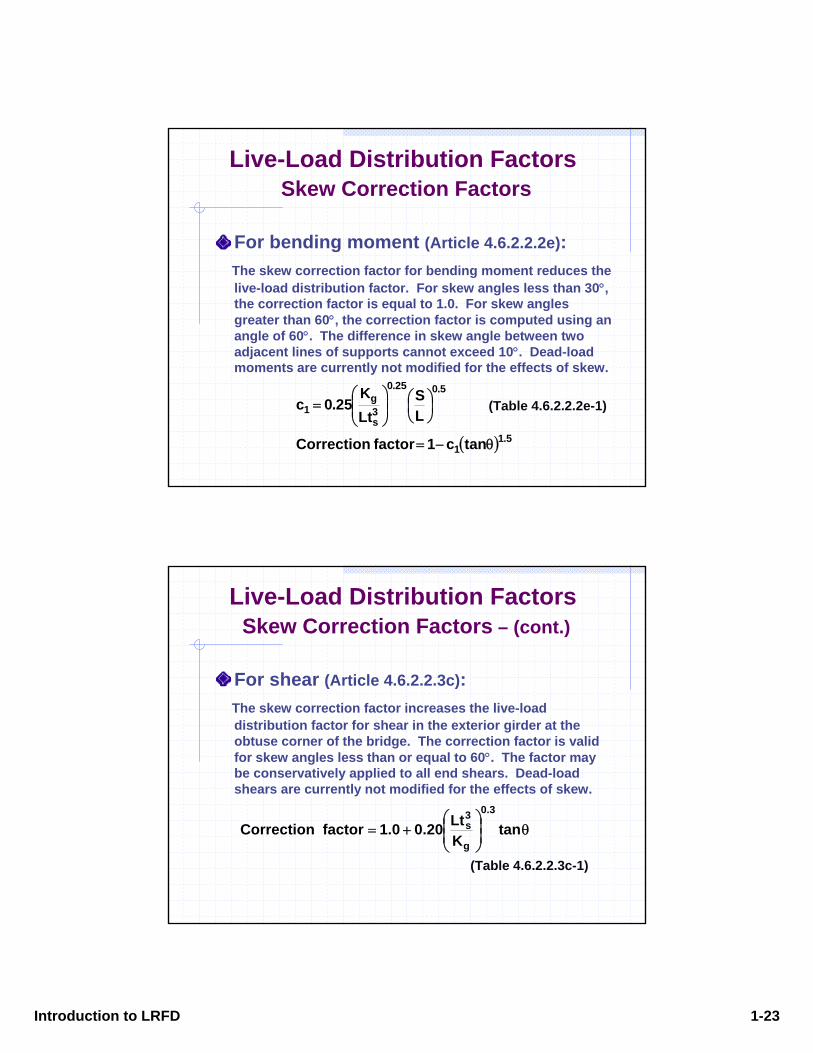
For bending moment (Article 4.6.2.2.2e):The skew correction factor for bending moment reduces the live-load distribution factor. For skew angles less than 30°, the correction factor is equal to 1.0. For skew angles greater than 60°, the correction factor is computed using an angle of 60°. The difference in skew angle between two adjacent lines of supports cannot exceed 10°. Dead-load moments are currently not modified for the effects of skew.
(Table 4.6.2.2.2e-1)
( ) 5.11
5.025.0
3s
g1
tanc1factorCorrection
LS
LtK
25.0c
θ−=
⎟⎠⎞
⎜⎝⎛
⎟⎟⎠
⎞⎜⎜⎝
⎛=
Live-Load Distribution FactorsSkew Correction Factors
For shear (Article 4.6.2.2.3c):The skew correction factor increases the live-load distribution factor for shear in the exterior girder at the obtuse corner of the bridge. The correction factor is valid for skew angles less than or equal to 60°. The factor may be conservatively applied to all end shears. Dead-load shears are currently not modified for the effects of skew.
(Table 4.6.2.2.3c-1)
θ⎟⎟⎠
⎞⎜⎜⎝
⎛+= tan
KLt20.00.1factorCorrection
3.0
g
3s
Live-Load Distribution FactorsSkew Correction Factors – (cont.)
Introduction to LRFD 1-24
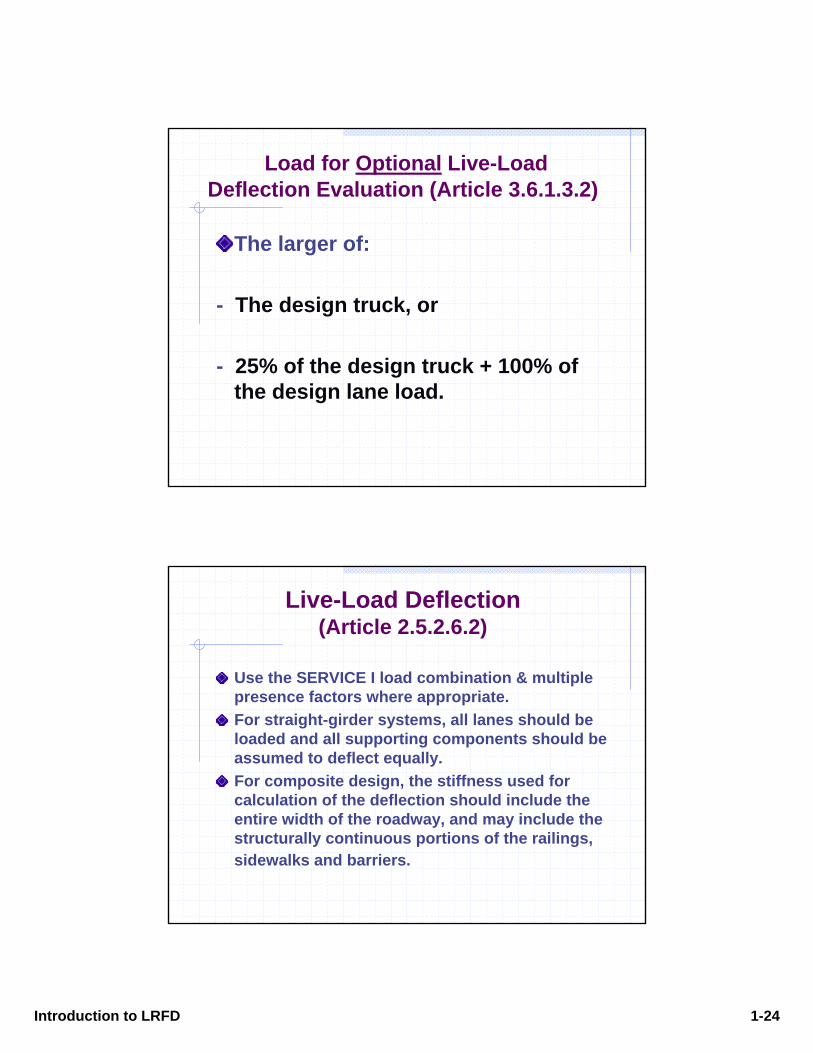
Load for Optional Live-Load Deflection Evaluation (Article 3.6.1.3.2)
The larger of:
- The design truck, or
- 25% of the design truck + 100% of the design lane load.
Live-Load Deflection(Article 2.5.2.6.2)
Use the SERVICE I load combination & multiple presence factors where appropriate.For straight-girder systems, all lanes should be loaded and all supporting components should be assumed to deflect equally.For composite design, the stiffness used for calculation of the deflection should include the entire width of the roadway, and may include the structurally continuous portions of the railings, sidewalks and barriers.
Introduction to LRFD 1-25
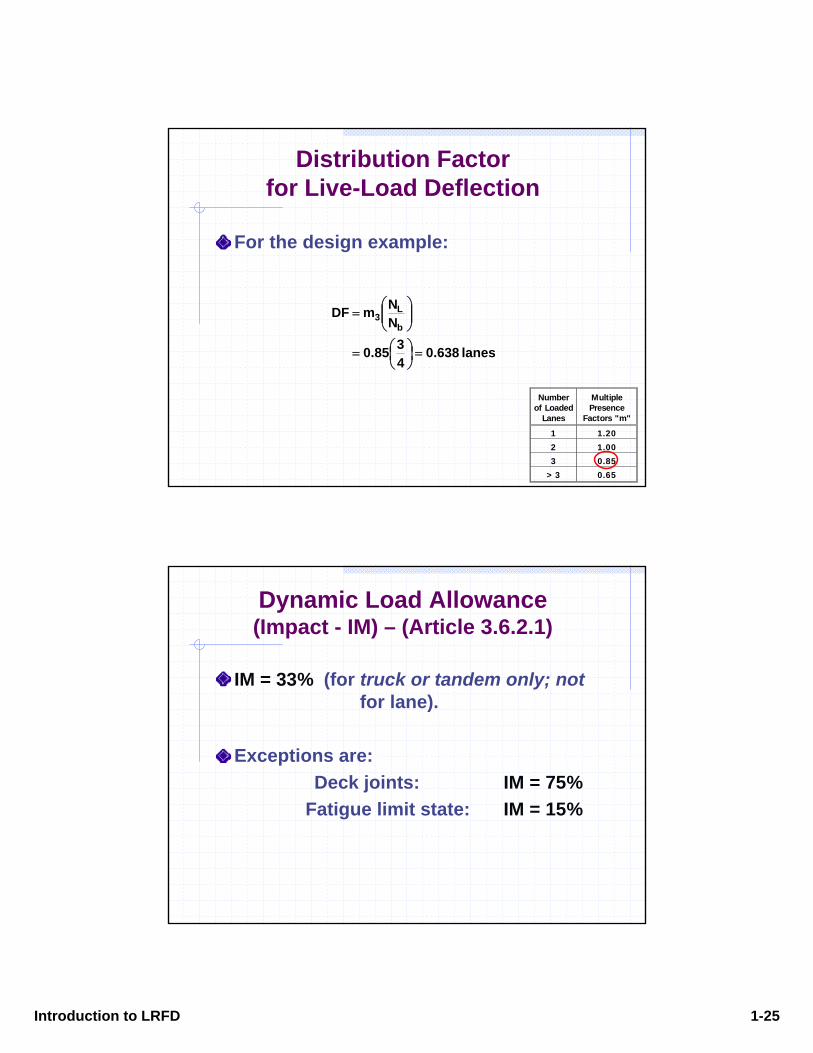
Distribution Factorfor Live-Load Deflection
For the design example:
lanes 638.04385.0
NNmDF
b
L3
=⎟⎠⎞
⎜⎝⎛=
⎟⎟⎠
⎞⎜⎜⎝
⎛=
Numberof Loaded
Lanes
MultiplePresence
Factors "m"
1 1.202 1.003 0.85
> 3 0.65
Dynamic Load Allowance(Impact - IM) – (Article 3.6.2.1)
IM = 33% (for truck or tandem only; notfor lane).
Exceptions are:Deck joints: IM = 75%
Fatigue limit state: IM = 15%
Introduction to LRFD 1-26
QUESTIONS?
Thomas Saad, P.E.FHWA, Suite 30119900 Governors DriveOlympia Fields, IL 60461Ph: 708.283.3521E-mail: [email protected]