Molecular Docking, Pharmacokinetic Properties and Toxicity ...
Int. J. Mol. Sci. 2011, 12, 1807-1835; doi:10.3390/ijms12031807
International Journal of
Molecular Sciences ISSN 1422-0067
www.mdpi.com/journal/ijms Article
Combined 3D-QSAR, Molecular Docking and Molecular Dynamics Study on Derivatives of Peptide Epoxyketone and Tyropeptin-Boronic Acid as Inhibitors Against the β5 Subunit of Human 20S Proteasome
Jianling Liu 1, Hong Zhang 1, Zhengtao Xiao 2, Fangfang Wang 1, Xia Wang 3 and
Yonghua Wang 2,*
1 College of Life Sciences, Northwest University, Xi’an, Shaanxi 710069, China 2 Center of Bioinformatics, Northwest A&F University, Yangling, Shaanxi 712100, China;
E-Mail: [email protected] 3 School of Chemical Engineering, Dalian University of Technology, Dalian 116012, China
* Author to whom correspondence should be addressed; E-Mail: [email protected];
Tel.: +86-29-87092262; Fax: +86-29-87092262.
Received: 24 January 2011; in revised form: 14 February 2011 / Accepted: 28 February 2011 /
Published: 9 March 2011
Abstract: An abnormal ubiquitin-proteasome is found in many human diseases, especially
in cancer, and has received extensive attention as a promising therapeutic target in recent
years. In this work, several in silico models have been built with two classes of proteasome
inhibitors (PIs) by using 3D-QSAR, homology modeling, molecular docking and molecular
dynamics (MD) simulations. The study resulted in two types of satisfactory 3D-QSAR
models, i.e., the CoMFA model (Q2 = 0.462, R2pred = 0.820) for epoxyketone inhibitors
(EPK) and the CoMSIA model (Q2 = 0.622, R2pred = 0.821) for tyropeptin-boronic acid
derivatives (TBA). From the contour maps, some key structural factors responsible for the
activity of these two series of PIs are revealed. For EPK inhibitors, the N-cap part should
have higher electropositivity; a large substituent such as a benzene ring is favored at the
C6-position. In terms of TBA inhibitors, hydrophobic substituents with a larger size anisole
group are preferential at the C8-position; higher electropositive substituents like a
naphthalene group at the C3-position can enhance the activity of the drug by providing
hydrogen bond interaction with the protein target. Molecular docking disclosed that residues
Thr60, Thr80, Gly106 and Ser189 play a pivotal role in maintaining the drug-target
OPEN ACCESS
Int. J. Mol. Sci. 2011, 12
1808
interactions, which are consistent with the contour maps. MD simulations further indicated
that the binding modes of each conformation derived from docking is stable and in accord
with the corresponding structure extracted from MD simulation overall. These results can
offer useful theoretical references for designing more potent PIs.
Keywords: ubiquitin-proteasome; 3D-QSAR; CoMFA; CoMSIA; homology modeling;
molecular docking; molecular dynamics
1. Introduction
Ubiquitin-proteasome system (UPS), as a major factor in regulated intracellular proteolysis in
eukaryotic cells, is essential to maintain intracellular protein homeostasis and control important
signaling pathways [1,2]. In the proteolytic process, the destined degradation protein is first labeled with
a poly-ubiqutin chain through a cascade of enzymes (E1, E2, E3), then the ubiquitylated protein is
recognized and degraded by the 26S proteasome, a multicatalytic multisubunit protease complex [3].
Two types of 26S proteasome have been identified, i.e., constitutive proteasome and immunoproteasome
[4].
The 26S proteasome consists of a 20S core particle (20S CP) and one or two 19S regulatory particles
(19S RP) capped at either (or both) ends of the core [5]. X-ray crystallography studies [6–9] have
demonstrated that 19S RP is built of a ring shaped base and a lid-structure, that regulates the entrance of
substrate to the attached 20S proteasome [10], the 20S CP is a conserved hollow cylinder-shaped
structure which is composed of four homologous rings, arranged in the sequence α7β7β7α7. Each β ring
contains three distinct catalytic activities with three different subunits, namely chymotrypsin-like (β5),
trypsin-like (β2) and the post-glutamyl peptide hydrolyzing, or caspase-like (β1) [11–13]. All three
peptidases exhibit the same catalytic mechanism, in which the N-terminal threonine residue is the active
nucleophile [14,15]. Among them, the importance of individual subunit activities for proteasomal function is as follows: β5 >> β2 ≥ β1 [16].
Owing to the significance of the proteasome, it is not surprising that aberrations and deregulations
of the proteasome contribute to the pathogenesis of several human diseases. Thus, proteasome
inhibitors (PIs) have become an attractive agent for human diseases therapy, especially for cancer
[17–22]. Their anti-inflammatory and anti-cancer effects are particularly achieved through inhibiting
activation of the transcription factor NFκB and promotion of apoptosis in rapidly dividing cells [23–25].
The most important class of PIs is the peptidic inhibitors, such as aldehydes [1], boronates [26], etc.
Because of the highly reactive functional aldehyde group, aldehydes lack specificity; bortezomib, a
famous PI of the boronate inhibitor family, has been approved for treatment of multiple myeloma and
mantle cell lymphomas by the FDA [27]. However, some side effects of bortezomib have also been
reported [28]. Thus, it is urgent to develop more potent, selective and clinic-friendly PIs. Epoxyketones
(α, β-ketoepoxides) (EPK) are the second-generation PIs found in the late 90s [29,30]. Unlike other PIs,
epoxyketones show potent selectivity to the proteasome, without inhibitory effects on other proteases
such as calpain, trypsin, papain, chymotrypsin and cathepsins [31], due to the fact that epoxyketone
moiety can form a morpholino adduct with the active site amino terminal Thr of the β5 subunit [32].
Int. J. Mol. Sci. 2011, 12
1809
Epoxyketone inhibits primarily the CT-L activity of the proteasome [33], but also the T-L and C-L
activities with slower rates [31]. Another attractive class of PIs is boronic acid derivatives of tyropeptin
(TBA). Tyropeptins A, produced by Kitasatospora sp. MK993-dF2, is novel proteasome inhibitor [34].
Takumi Watanabe and coworkers also synthesized a set of TBA derivatives, exhibiting potent inhibitory
against the CT-L activity of human proteasome [35].
Quantitative structure activity relationship (QSAR), which quantitatively correlates the variations in
biological activity with the properties or molecular structures, is one of the most effective approaches for
designing new chemical identities and understanding the action mechanisms of drugs [36–38]. In recent
years, great attention has been paid to discovery and synthesis of novel PIs, studies regarding QSAR of
existing PIs is still relatively insufficient although some 3D-QSAR models of PIs have been reported
[39,40]. The authors offered useful information about the binding mode between the inhibitors and the
proteasome through ligand-based model. However, detailed insights into the active site are still unclear,
since the X-ray crystallographic structure of the human proteasome has not been reported to date. Thus,
in order to reveal the structural features of inhibitors of the β5 subunit of human proteasome, a set of in
silico methods including 3D-QSAR, homology modeling, molecular docking and molecular dynamics
simulations have been conducted on EPK and TBA in the present work. As far as we know, this study
presents the first 3D-QSAR study for these two kinds of PIs, which will provide detailed information for
understanding these two series of compounds and aid screening and design of novel inhibitors.
2. Materials and Methods
2.1. Data Sets
All potent inhibitors of β5 subunit of the human proteasome used in the present study are collected
from recent literatures [35,41]. Discarding compounds with undefined inhibitory activity or unspecified
stereochemistry, 45 compounds of EPK and 41 compounds of TBA are employed in this work. Each
group of compounds is divided into a training set for generating the 3D-QSAR models and a testing set
for evaluating the 3D-QSAR models at a ratio of 4:1. The compounds in the test set have a range of
biological activity values similar to that of the training set. Their IC50 values are converted into pIC50
(i.e., −logIC50) values and used as dependent variables in the CoMFA and CoMSIA calculation. The
pIC50 values of the EPK and TBA compounds cover an interval of three and four log units, respectively.
The structures of these two groups and their IC50 and pIC50 values are given in Appendix.
2.2. Molecular Modeling and Alignment
The 3D-QSAR study and molecular docking is performed using SYBYL 6.9 (Tripos, Inc). The 3D
structures of all compounds are constructed using the Sketch Molecule function with Sybyl software.
The geometry optimization of all compounds is carried out by using the TRIPOS force field with the
Gasteiger-Huckel (GH) charges, and repeated minimization is performed using Powell conjugated
gradient algorithm method with convergence criterion of 0.05 kcal/mol Å. Of note, molecules containing
boron atoms are not supported by SYBYL because it does not provide the force field parameters for the
boron atom in default settings. For this reason, we changed the boron atom in TBA derivatives to a
carbon atom ‘C.3’ in SYBYL according to the strategy adopted in the literatures [42] and colored it with
Int. J. Mol. Sci. 2011, 12
1810
‘magenta’ for distinction.
Structure alignment is considered as one of the most critical step in CoMFA and CoMSIA analysis, so
the template molecule selection for alignment and the alignment methods are crucial to the CoMFA and
CoMSIA models. The most active compound of each group is used as a template for superimposition,
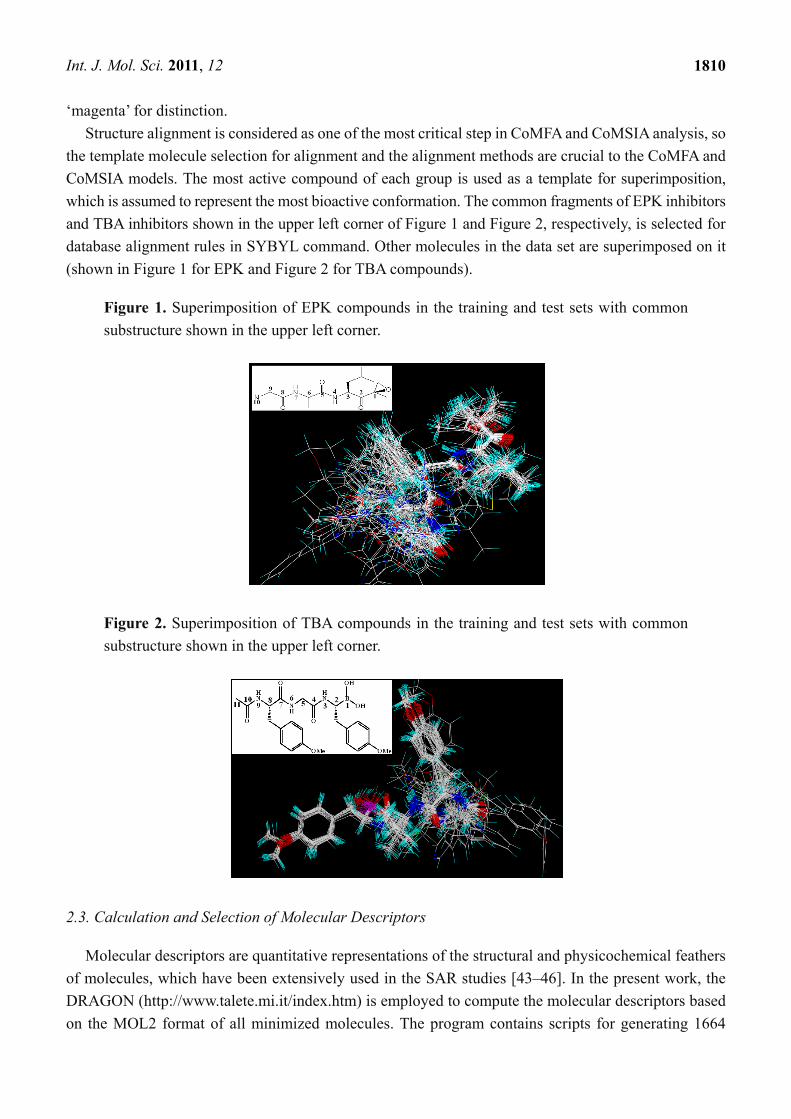
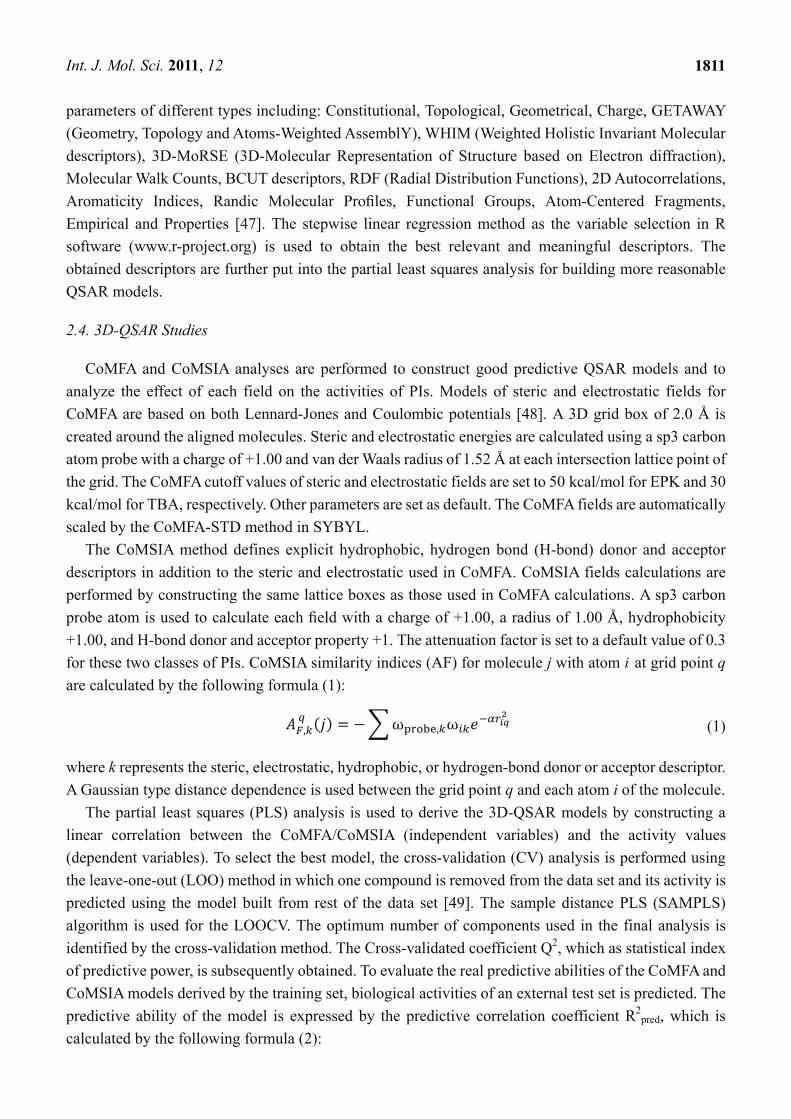
which is assumed to represent the most bioactive conformation. The common fragments of EPK inhibitors
and TBA inhibitors shown in the upper left corner of Figure 1 and Figure 2, respectively, is selected for
database alignment rules in SYBYL command. Other molecules in the data set are superimposed on it
(shown in Figure 1 for EPK and Figure 2 for TBA compounds).
Figure 1. Superimposition of EPK compounds in the training and test sets with common
substructure shown in the upper left corner.
Figure 2. Superimposition of TBA compounds in the training and test sets with common
substructure shown in the upper left corner.
2.3. Calculation and Selection of Molecular Descriptors
Molecular descriptors are quantitative representations of the structural and physicochemical feathers
of molecules, which have been extensively used in the SAR studies [43–46]. In the present work, the
DRAGON (http://www.talete.mi.it/index.htm) is employed to compute the molecular descriptors based
on the MOL2 format of all minimized molecules. The program contains scripts for generating 1664
Int. J. Mol. Sci. 2011, 12
1811
parameters of different types including: Constitutional, Topological, Geometrical, Charge, GETAWAY
(Geometry, Topology and Atoms-Weighted AssemblY), WHIM (Weighted Holistic Invariant Molecular
descriptors), 3D-MoRSE (3D-Molecular Representation of Structure based on Electron diffraction),
Molecular Walk Counts, BCUT descriptors, RDF (Radial Distribution Functions), 2D Autocorrelations,
Aromaticity Indices, Randic Molecular Profiles, Functional Groups, Atom-Centered Fragments,
Empirical and Properties [47]. The stepwise linear regression method as the variable selection in R
software (www.r-project.org) is used to obtain the best relevant and meaningful descriptors. The
obtained descriptors are further put into the partial least squares analysis for building more reasonable
QSAR models.
2.4. 3D-QSAR Studies
CoMFA and CoMSIA analyses are performed to construct good predictive QSAR models and to
analyze the effect of each field on the activities of PIs. Models of steric and electrostatic fields for
CoMFA are based on both Lennard-Jones and Coulombic potentials [48]. A 3D grid box of 2.0 Å is
created around the aligned molecules. Steric and electrostatic energies are calculated using a sp3 carbon
atom probe with a charge of +1.00 and van der Waals radius of 1.52 Å at each intersection lattice point of
the grid. The CoMFA cutoff values of steric and electrostatic fields are set to 50 kcal/mol for EPK and 30
kcal/mol for TBA, respectively. Other parameters are set as default. The CoMFA fields are automatically
scaled by the CoMFA-STD method in SYBYL.
The CoMSIA method defines explicit hydrophobic, hydrogen bond (H-bond) donor and acceptor
descriptors in addition to the steric and electrostatic used in CoMFA. CoMSIA fields calculations are
performed by constructing the same lattice boxes as those used in CoMFA calculations. A sp3 carbon
probe atom is used to calculate each field with a charge of +1.00, a radius of 1.00 Å, hydrophobicity
+1.00, and H-bond donor and acceptor property +1. The attenuation factor is set to a default value of 0.3
for these two classes of PIs. CoMSIA similarity indices (AF) for molecule j with atom i at grid point q
are calculated by the following formula (1):
, ω , ω (1)
where k represents the steric, electrostatic, hydrophobic, or hydrogen-bond donor or acceptor descriptor.
A Gaussian type distance dependence is used between the grid point q and each atom i of the molecule.
The partial least squares (PLS) analysis is used to derive the 3D-QSAR models by constructing a
linear correlation between the CoMFA/CoMSIA (independent variables) and the activity values
(dependent variables). To select the best model, the cross-validation (CV) analysis is performed using
the leave-one-out (LOO) method in which one compound is removed from the data set and its activity is
predicted using the model built from rest of the data set [49]. The sample distance PLS (SAMPLS)
algorithm is used for the LOOCV. The optimum number of components used in the final analysis is
identified by the cross-validation method. The Cross-validated coefficient Q2, which as statistical index
of predictive power, is subsequently obtained. To evaluate the real predictive abilities of the CoMFA and
CoMSIA models derived by the training set, biological activities of an external test set is predicted. The
predictive ability of the model is expressed by the predictive correlation coefficient R2pred, which is
calculated by the following formula (2):
Int. J. Mol. Sci. 2011, 12
1812
R SD PRESS SD (2)
Where SD is the sum of squared deviations between the biological activities of the test set and mean
activity of the training set compounds, PRESS is the sum of squared deviations between experimental
and predicted activities of the test set compounds.
2.5. Homology Modeling
For the rational design of new drugs, structural information about the target protein and specifically
binding ligands is of utmost importance [50]. Due to the unavailability of the X-ray structure of human
proteasome, the homology modeling for the protein structure from its primary sequence is performed.
The target protein is the β5 subunit of human proteasome whose amino acid sequence (ID CAA64838.1)
is obtained from the NCBI Web site (http://www.ncbi.nlm.nih.gov). The template protein (PDB entry
code 1G65 chain K, resolution: 2.25 Å) identified by Blast Search (http://www.ncbi.nlm.nih.gov/BLAS)
is employed here for the construction of the 3D model of the target protein. Its crystal structure is
downloaded from Brookhaven Protein Database (http://www.pdb.org/pdb/home/home.do).
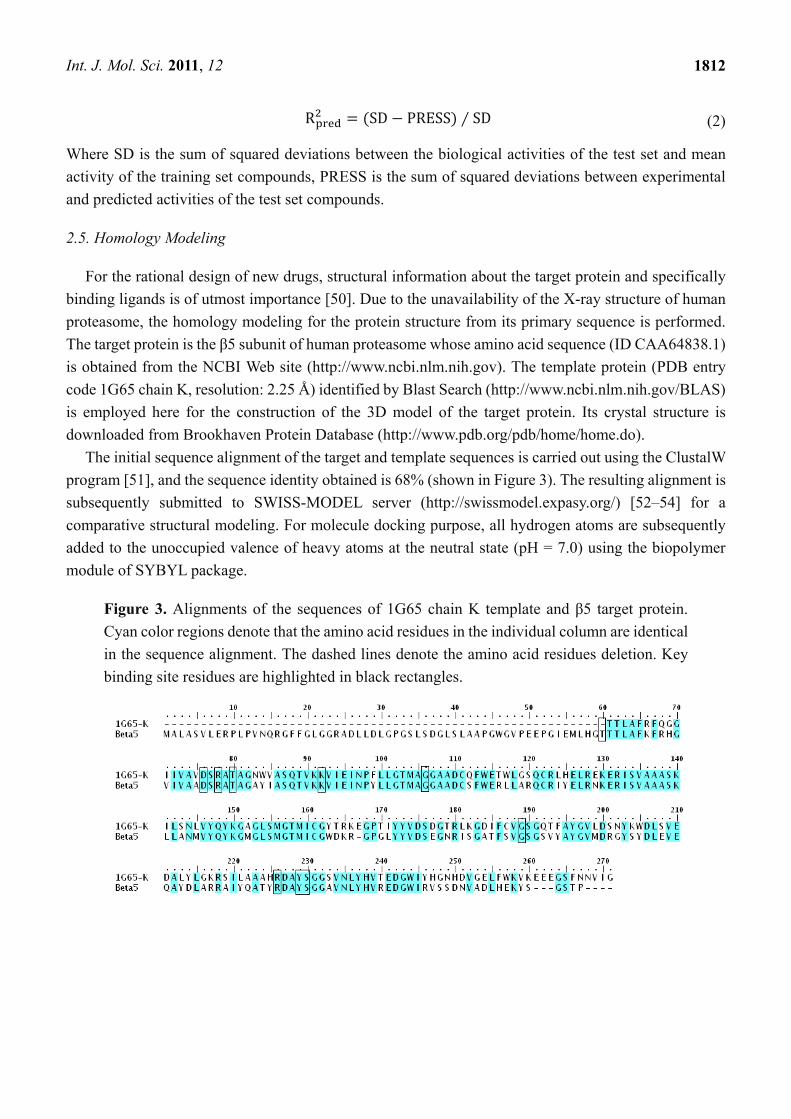
The initial sequence alignment of the target and template sequences is carried out using the ClustalW
program [51], and the sequence identity obtained is 68% (shown in Figure 3). The resulting alignment is
subsequently submitted to SWISS-MODEL server (http://swissmodel.expasy.org/) [52–54] for a
comparative structural modeling. For molecule docking purpose, all hydrogen atoms are subsequently
added to the unoccupied valence of heavy atoms at the neutral state (pH = 7.0) using the biopolymer
module of SYBYL package.
Figure 3. Alignments of the sequences of 1G65 chain K template and β5 target protein.
Cyan color regions denote that the amino acid residues in the individual column are identical
in the sequence alignment. The dashed lines denote the amino acid residues deletion. Key
binding site residues are highlighted in black rectangles.
Int. J. Mol. Sci. 2011, 12
1813
2.6. Molecular Docking
To understand the detailed interaction of the β5 subunit of human proteasome with its inhibitors and to
develop 3D-QSAR models, molecular docking analysis is carried out using the Surflex, which combines
Hammerhead’s empirical scoring function with a molecular similarity method (morphological similarity)
to generate putative poses of ligand fragments [55]. Two parameters, i.e., protomol_bloat and
protomol_threshold, determine how far a potential ligand should extend outside of the concavity and how
deep into the protein the atomic probes are used to define the protomol. Michael Groll and coworkers
have reported that the crystallized waters are of importance in mediating the interactions between the
epoxomicin (ligand) and the terminal Thr of β5 subunit (1G65_K) [32]. Thus, our docking analysis is
performed as follows: (1) The target protein structure is aligned with the template protein, then the
cocrystalized ligand (EPX) and water molecules of 1G65_K are merged into the corresponding sites of
the target protein structure; (2) The template 1G65_K is removed, while the original crystallized waters
and ligand are retained; (3) To EPK, the protomol is generated using a ligand approach considering the
ligand and water molecules with the specified 1_0.55 of bloat and threshold; to TBA, an automatic
approach considering the water molecules with specified 1_0.46 of bloat and threshold is applied to
generate the protomol. Meanwhile, the resulting homology protein structure is further developed using
the protein preparation and refinement utility provided by SYBYL. During docking processes, the
protein is considered rigid, and the ligand molecules are flexible. When the docking run is finished, it
affords the top 10 docking poses of each ligand ranked by total scores.
In addition, for validating whether the crystallized waters are significant, the docking studies are also
conducted in absence of the crystallized water molecules in the same conditions as mentioned above.
2.7. Molecular Dynamics Simulations
MD simulations are conducted with Amber 10 [56], utilizing the 3D structure of the docked complex
with compound 11 of EPK and compound 2 of TBA as starting conformations, respectively. The general
atom force field (GAFF) [57] and the AMI-BCC [58] method are employed to set the two ligand’s
parameters and charges via antechamber module of Amber 10. Standard AMBER force field for
bioorganic systems (ff99SB) [59] is chosen to depict the protein parameters. The initial conformers are
neutralized by adding sufficient Cl− counterions and solvated in a same size rectangular box
(71.55 × 93.08 × 77.68 Å3) of TIP3P water [60], both with a minimum solute-wall distance of 12 Å. The
cut-off distance for computing the nonbonded interactions is truncated at 10 Å; long-range electrostatic
interactions are calculated using the particle-mesh-Ewald (PME) method [61] with default values.
SHAKE [62] is applied to all bonds involving H-atoms.
Prior to MD simulations, each system is energetically minimized with the complex atoms constrained
to eliminate possible bad contacts through 2500 steepest descent steps and another 2500
conjugate-gradient steps. Following that, MD simulations commence by heating up the systems to 300 K
at a constant force of 2.0 kcal/mol Å−2 constraining the protein atoms. Then, a 50 ps of density
equilibrated is applied at 300 K with the complex atoms constrained. After that, the system is equilibrated
with a collision frequency of 1 ps−1 at a constant temperature and pressure. Finally, two 5 ns MD
simulations are performed with a 2 fs time step at the isothermic-isobaric (NPT) canonical
Int. J. Mol. Sci. 2011, 12
1814
ensemble and under the periodic boundary conditions. The total number of the atoms in each simulation
systems is 42,400 and 42,410 including complex and waters.
3. Results and Discussion
3.1. 3D-QSAR Models
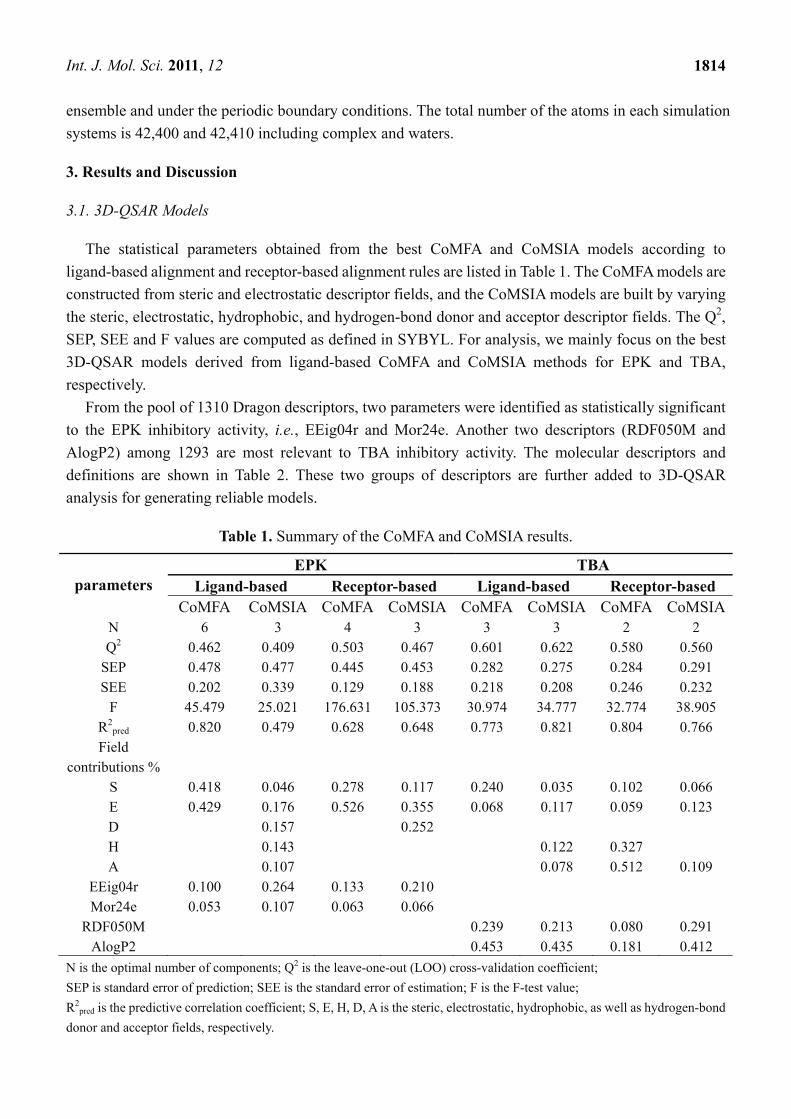
The statistical parameters obtained from the best CoMFA and CoMSIA models according to
ligand-based alignment and receptor-based alignment rules are listed in Table 1. The CoMFA models are
constructed from steric and electrostatic descriptor fields, and the CoMSIA models are built by varying
the steric, electrostatic, hydrophobic, and hydrogen-bond donor and acceptor descriptor fields. The Q2,
SEP, SEE and F values are computed as defined in SYBYL. For analysis, we mainly focus on the best
3D-QSAR models derived from ligand-based CoMFA and CoMSIA methods for EPK and TBA,
respectively.
From the pool of 1310 Dragon descriptors, two parameters were identified as statistically significant
to the EPK inhibitory activity, i.e., EEig04r and Mor24e. Another two descriptors (RDF050M and
AlogP2) among 1293 are most relevant to TBA inhibitory activity. The molecular descriptors and
definitions are shown in Table 2. These two groups of descriptors are further added to 3D-QSAR
analysis for generating reliable models.
Table 1. Summary of the CoMFA and CoMSIA results.
parameters
EPK TBA Ligand-based Receptor-based Ligand-based Receptor-based
CoMFA CoMSIA CoMFA CoMSIA CoMFA CoMSIA CoMFA CoMSIAN 6 3 4 3 3 3 2 2 Q2 0.462 0.409 0.503 0.467 0.601 0.622 0.580 0.560
SEP 0.478 0.477 0.445 0.453 0.282 0.275 0.284 0.291 SEE 0.202 0.339 0.129 0.188 0.218 0.208 0.246 0.232
F 45.479 25.021 176.631 105.373 30.974 34.777 32.774 38.905 R2
pred 0.820 0.479 0.628 0.648 0.773 0.821 0.804 0.766 Field
contributions %
S 0.418 0.046 0.278 0.117 0.240 0.035 0.102 0.066 E 0.429 0.176 0.526 0.355 0.068 0.117 0.059 0.123 D 0.157 0.252 H 0.143 0.122 0.327 A 0.107 0.078 0.512 0.109
EEig04r 0.100 0.264 0.133 0.210 Mor24e 0.053 0.107 0.063 0.066
RDF050M 0.239 0.213 0.080 0.291 AlogP2 0.453 0.435 0.181 0.412
N is the optimal number of components; Q2 is the leave-one-out (LOO) cross-validation coefficient;
SEP is standard error of prediction; SEE is the standard error of estimation; F is the F-test value;
R2pred is the predictive correlation coefficient; S, E, H, D, A is the steric, electrostatic, hydrophobic, as well as hydrogen-bond
donor and acceptor fields, respectively.
Int. J. Mol. Sci. 2011, 12
1815
Table 2. Symbols of the descriptors used in the models and their definitions.
Symbols Descriptor family Definition
EEig04r Topological Eigenvalue 04 from edge adj. matrix weighted by resonance integrals
Mor24e 3D-MoRSE 3D-MoRSE-signal 24/weighted by atomic Sandersonelectronegativities
RDF050M RDF Radial Distribution Function-5.0/weighted by atomic masses
AlogP2 Molecular properties
Squared Ghose-Crippen octanol-water partition coeff. (logP^2)
3.1.1. EPK
In terms of EPK, its CoMFA model validated internally yields the Q2 = 0.462 with six optimum
components. This model has a small SEE (0.202), suggesting that the CoMFA model is reliable and
predictive. The steric and electrostatic fields contribute 41.8% and 42.9%, respectively. Therefore, these
two fields have almost the same influence on the inhibitory activity of EPK. Furthermore, EEig04r and
Mor24e contribute 10% and 5.3% to this model, showing that topological molecular characters and
3D-MoRSE descriptors also affect the EPK inhibitory activity. Without these two parameters, the model
built by steric and electrostatic fields would be overfitting.
During the cross-validation procedure, compound 25 is detected as an outlier (residual between the
experimental value and predicted value is nearly to 1.0 log unit) for the CoMFA model. Some reasons
may result in this appearance as an outlier. Compound 25 has a unique structure feature, which is
different from other compounds. After removal of this compound, the predicted value changed from
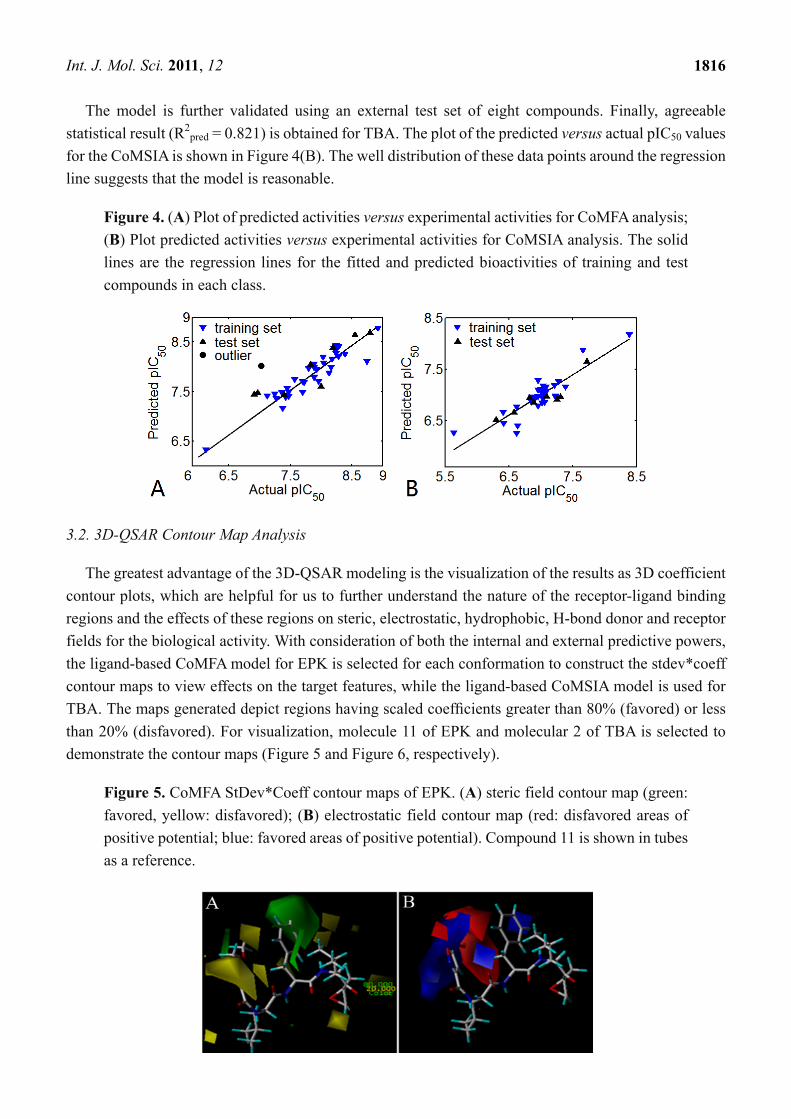
0.680 to 0.820. The plot of the predicted versus actual pIC50 for the CoMFA analyses is shown in Figure
4(A). It can be seen that the data points are uniformly distributed around the regression line, indicating
the reasonability of this model.
3.1.2. TBA
For TBA, the optimal CoMSIA model validated internally yields Q2 = 0.622 with three optimum
components. The small SEE (0.208) also indicates that this model is reliable and predictive. The steric,
electrostatic, hydrophobic and H-bond acceptor field contributions are 0.035%, 0.117%, 0.122%, and
0.078%, respectively. From the contributions, the electrostatic and hydrophobic interactions of the
ligand with the receptor are more important than the other two interactions to the inhibitory activity of
TBA. The contributions of RDF050M and AlogP2 are 21.3% and 43.5%, respectively, showing that
these two factors affect the TBA inhibitory activity dramatically. Formally, RDF code is based on the
radial distribution function of an ensemble with N atoms, i.e., probability distribution of finding atom on
a sphere with radius r [63]. For the RDF050m descriptor, the sphere radius is 0.5 Å and the atomic
weights are atomic masses (m). AlogP2 is the square of the Ghose-Crippen octanol-water coefficient
(AlogP), which denote the hydrophobic/hydrophilic character of the molecule. These two descriptors
reflect the importance of physicochemical and hydrophobility to their inhibitory activity.
Int. J. Mol. Sci. 2011, 12
1816
The model is further validated using an external test set of eight compounds. Finally, agreeable
statistical result (R2pred = 0.821) is obtained for TBA. The plot of the predicted versus actual pIC50 values
for the CoMSIA is shown in Figure 4(B). The well distribution of these data points around the regression
line suggests that the model is reasonable.
Figure 4. (A) Plot of predicted activities versus experimental activities for CoMFA analysis;
(B) Plot predicted activities versus experimental activities for CoMSIA analysis. The solid
lines are the regression lines for the fitted and predicted bioactivities of training and test
compounds in each class.
3.2. 3D-QSAR Contour Map Analysis
The greatest advantage of the 3D-QSAR modeling is the visualization of the results as 3D coefficient
contour plots, which are helpful for us to further understand the nature of the receptor-ligand binding
regions and the effects of these regions on steric, electrostatic, hydrophobic, H-bond donor and receptor
fields for the biological activity. With consideration of both the internal and external predictive powers,
the ligand-based CoMFA model for EPK is selected for each conformation to construct the stdev*coeff
contour maps to view effects on the target features, while the ligand-based CoMSIA model is used for
TBA. The maps generated depict regions having scaled coefficients greater than 80% (favored) or less
than 20% (disfavored). For visualization, molecule 11 of EPK and molecular 2 of TBA is selected to
demonstrate the contour maps (Figure 5 and Figure 6, respectively).
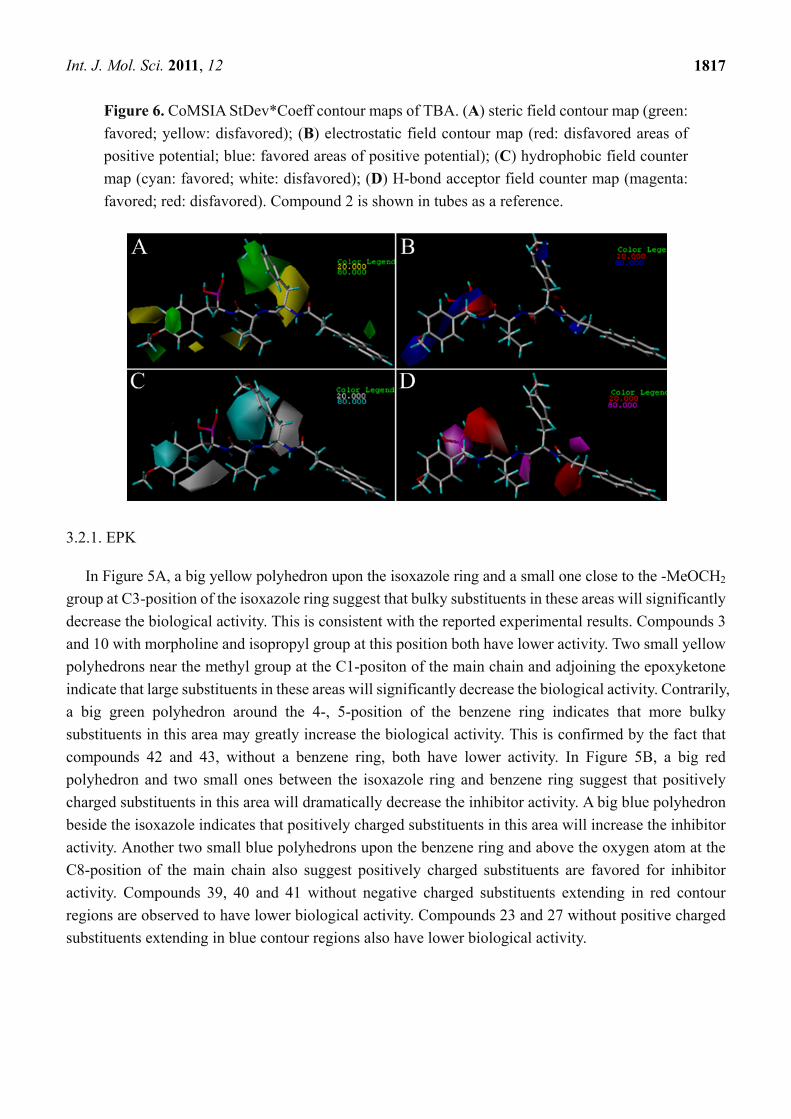
Figure 5. CoMFA StDev*Coeff contour maps of EPK. (A) steric field contour map (green:
favored, yellow: disfavored); (B) electrostatic field contour map (red: disfavored areas of
positive potential; blue: favored areas of positive potential). Compound 11 is shown in tubes
as a reference.
Int. J. Mol. Sci. 2011, 12
1817
Figure 6. CoMSIA StDev*Coeff contour maps of TBA. (A) steric field contour map (green:
favored; yellow: disfavored); (B) electrostatic field contour map (red: disfavored areas of
positive potential; blue: favored areas of positive potential); (C) hydrophobic field counter
map (cyan: favored; white: disfavored); (D) H-bond acceptor field counter map (magenta:
favored; red: disfavored). Compound 2 is shown in tubes as a reference.
3.2.1. EPK
In Figure 5A, a big yellow polyhedron upon the isoxazole ring and a small one close to the -MeOCH2
group at C3-position of the isoxazole ring suggest that bulky substituents in these areas will significantly
decrease the biological activity. This is consistent with the reported experimental results. Compounds 3
and 10 with morpholine and isopropyl group at this position both have lower activity. Two small yellow
polyhedrons near the methyl group at the C1-positon of the main chain and adjoining the epoxyketone
indicate that large substituents in these areas will significantly decrease the biological activity. Contrarily,
a big green polyhedron around the 4-, 5-position of the benzene ring indicates that more bulky
substituents in this area may greatly increase the biological activity. This is confirmed by the fact that
compounds 42 and 43, without a benzene ring, both have lower activity. In Figure 5B, a big red
polyhedron and two small ones between the isoxazole ring and benzene ring suggest that positively
charged substituents in this area will dramatically decrease the inhibitor activity. A big blue polyhedron
beside the isoxazole indicates that positively charged substituents in this area will increase the inhibitor
activity. Another two small blue polyhedrons upon the benzene ring and above the oxygen atom at the
C8-position of the main chain also suggest positively charged substituents are favored for inhibitor
activity. Compounds 39, 40 and 41 without negative charged substituents extending in red contour
regions are observed to have lower biological activity. Compounds 23 and 27 without positive charged
substituents extending in blue contour regions also have lower biological activity.
Int. J. Mol. Sci. 2011, 12
1818
3.2.2. TBA
In Figure 6A, a big yellow polyhedron area in the back of the C8-position of the main chain shows an
unfavorable steric interaction in this position, which indicates that a bulky substituent in this area
decreases the biological activity dramatically. This interprets why all compounds of this series do not
carry large subsitituents. Two small yellow polyhedrons beside the isopropyl group and near the anisole
group at the C2-position of the main chain suggest that bulk substituents in this position are not favored
for inhibitor activity. The big green polyhedron around the anisole group at the C8-position of the main
chain indicates that large substituent in this region have favorable steric interactions. Two small green
polyhedrons in the anisole group suggest that large substituents are favored in this region. In Figure 6B,
a red polyhedron area behind the B1-position of the main chain shows that electronegative groups are
favored here. In contrast, the blue polyhedrons show the electropositive favored regions. There is one
big blue region present beside the anisole group at the C2-position and two small blue regions present
adjacent to the methyl group of anisole group at the C8-position of the main chain and around the ethyl
group at the C11-position. In Figure 6C, two white polyhedrons show unfavorable hydrophobic
interaction regions. One appeared in the back of the C8-position of the main chain, the other appeared in
the left of isopropyl group. A big cyan polyhedron surrounding the anisole group at the C8-position and
a small one upon the anisole group at the C2-position of the main chain indicate favorable hydrophobic
interactions in these areas. In Figure 6D, a magenta polyhedron near the hydroxyl group at the
B1-position and two small ones beside the isopropyl group and upon the ethyl group at the C11-position
of the main chain indicate that these areas are favored for H-bond acceptor interactions, while another
two red polyhedrons with one above the N3-position of the main chain and the other below the
C11-position show disfavored regions for H-bond acceptor interactions.
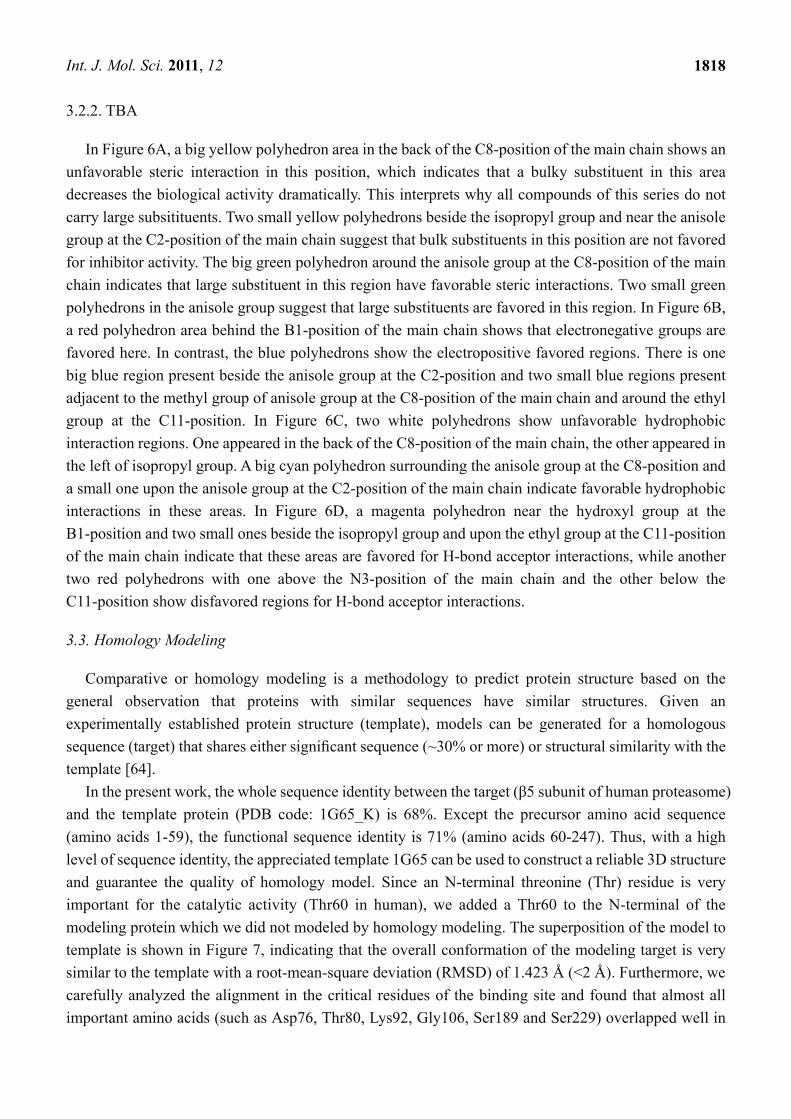
3.3. Homology Modeling
Comparative or homology modeling is a methodology to predict protein structure based on the
general observation that proteins with similar sequences have similar structures. Given an
experimentally established protein structure (template), models can be generated for a homologous
sequence (target) that shares either significant sequence (~30% or more) or structural similarity with the
template [64].
In the present work, the whole sequence identity between the target (β5 subunit of human proteasome)
and the template protein (PDB code: 1G65_K) is 68%. Except the precursor amino acid sequence
(amino acids 1-59), the functional sequence identity is 71% (amino acids 60-247). Thus, with a high
level of sequence identity, the appreciated template 1G65 can be used to construct a reliable 3D structure
and guarantee the quality of homology model. Since an N-terminal threonine (Thr) residue is very
important for the catalytic activity (Thr60 in human), we added a Thr60 to the N-terminal of the
modeling protein which we did not modeled by homology modeling. The superposition of the model to
template is shown in Figure 7, indicating that the overall conformation of the modeling target is very
similar to the template with a root-mean-square deviation (RMSD) of 1.423 Å (<2 Å). Furthermore, we
carefully analyzed the alignment in the critical residues of the binding site and found that almost all
important amino acids (such as Asp76, Thr80, Lys92, Gly106, Ser189 and Ser229) overlapped well in
Int. J. Mol. Sci. 2011, 12
1819
3D space for the two structures (The amino-acid numbering in the sequences of template and modeling
structures starts at the N-terminal catalytic threonines (Thr2 and Thr60)).
Figure 7. (A) The superposition of 1G65_K template (green ribbon) and the β5 subunit of
human proteasome (red ribbon) from homology modeling; (B) The enlargement of the
superposition structure of the active site with ligand EPX displayed as balls and sticks. The
residues from the template protein and the homology modeling protein are highlighted in
green and red colors, respectively. The same residues are labeled in blue color, while the
different residues between them are labeled in their own color.
3.4. Docking Analysis and Comparison with 3D Contour Maps
Molecular docking for all 86 inhibitors was performed to find the optimal conformation of the ligands
in the binding pocket of the β5 subunit of the human proteasome, and to understand the nature of
interactions between them, as well as to complement the 3D-QSAR studies for the rational design of
drugs.
The top ranked docked solution of each class was found in one favorable cluster of docking poses
with an average RMSD value of 2.27Å and 2.54Å, respectively, demonstrating the binding mode is
correctly reproduced [65]. By this performance, the binding modes for the most potent compound of
each group exhibited statistically significant total score results of 9.41 and 9.44, respectively. In addition,
some key residues such as Thr60, Arg78, Thr80, Lys92, Gly106, Ser189 and Ser229 appeared in the
binding cavity, which further demonstrated the reasonability of docking protocol.
As we expect, the docking result of EPK in the absence of the crystallized waters is not good. The
reason might be that crystallized waters are very important in mediating the interactions between the
epoxomicin and terminal Thr of the β5 subunit (1G65_K), as described in the previous work by Michael
Groll and coworkers [32]. Compared with the docking result with the crystallized waters, the total score
of the most active compound is lower (6.23). And the correlation between the activity value and the
score is bad (R2 = 0.0118). However, for TBA the docking result without the crystallized waters is almost
the same as that with crystallized waters, indicating that the crystallized waters have little effect on the
interaction between TBA and the β5 subunit.
Int. J. Mol. Sci. 2011, 12
1820
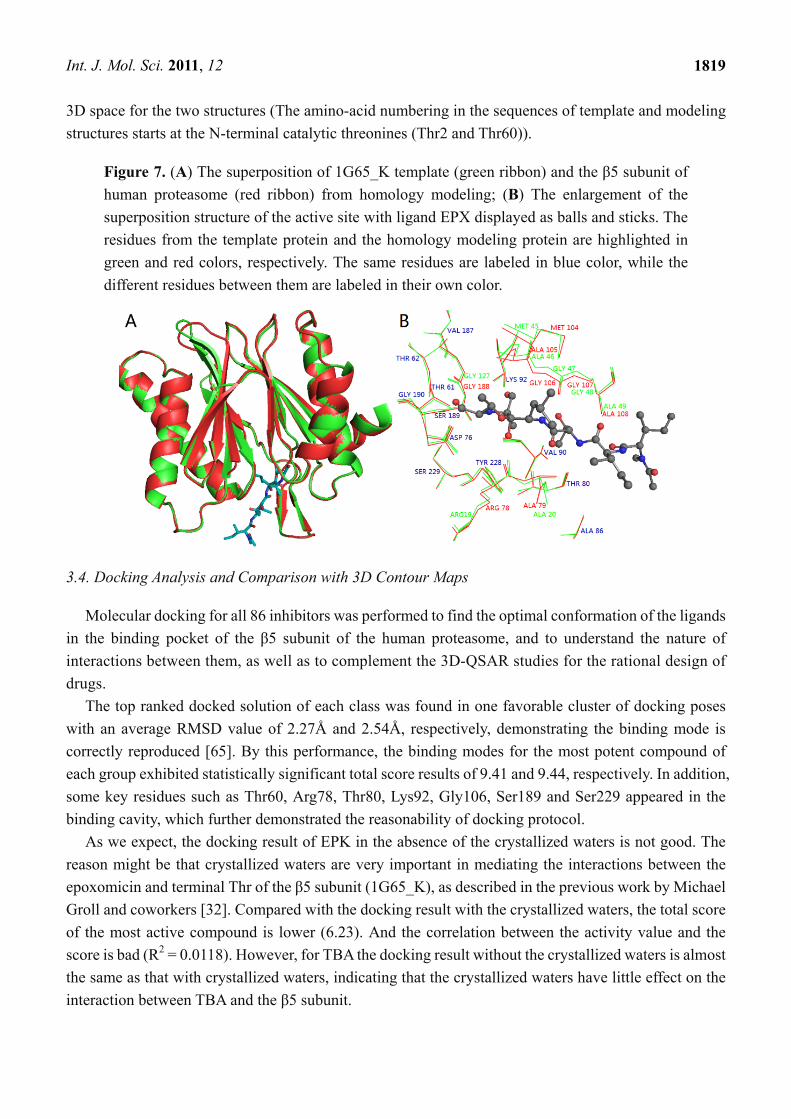
3.4.1. EPK
The binding mode of compound 11, shown in Figure 8, is taken as an example for analysis. The
ligand core is anchored in the binding site via four H-bonds and two water-mediated contacts with the
protein. The oxygen at C5-position of the main chain forms a H-bond with the backbone NH of Thr80
(–O···HN, 2.01 Å, 152.4°), and the oxygen at C2-position of the main chain forms a H-bond with the
side chain of Thr60 (-O···HO, 1.78 Å, 131.9°). While the two hydrogen atoms at the N4- and N7- positions
of the main chain form two H-bonds with the backbone carboxyl group of Gly106 (-O···HN, 1.69 Å,
146.5°) and the backbone carbonyl group of Thr80 (–O···HN, 1.85 Å, 160.0°), respectively.
Additionally, it is worth noting that water plays an essential role in mediating the interaction between
EPK and the β5 subunit. The interaction between the ketone oxygen with the side chain of Ser189 and
the carboxyl group of Tyr228 is bridged by a structural water molecule (W3046), and the interaction
between the oxygen at the C8-position of the main chain and the nitrogen of the isoxazole ring with
Ala108 and Ala109 is bridged by another structural water molecule (W3027).
Figure 8. Docked conformations derived for molecule 11 of EPK (shown in ball and stick
model) with the β5 subunit of human proteasome. H-bonds formed between residues and
molecule directly and mediated by water indirectly are shown as dotted lines with blue and
red color, respectively. W3027 and W3046 represent water molecules. The nonpolar
hydrogen atoms are removed for clarity.
Interestingly, the docking result is consistent with the CoMFA contour map analysis, which further
validates the 3D-QSAR model overall. No amino acid residues appeared upon the area of the benzene
ring, indicating that bulky substituents in this position are favored for inhibitor activity. While the area
above the isoxazole ring is occupied by residues of Ala109, Asp110, Cys111 and Gly107, suggesting
that bulky substituents in this position will conflict with these residues and decrease the inhibitor activity.
Similarly, the area beside the epoxyketone is occupied by residues Thr60, Arg78 and Ser189, where
large substituents are also not favored. The electrostatic contour map can also be validated by the
docking study. Due to the H-bond formed by the hydrogen at the N7-position of the main chain and
backbone carbonyl group of Thr80, where the hydrogen is a hydrogen donor and Thr80 is a hydrogen
Int. J. Mol. Sci. 2011, 12
1821
receptor, negative charged substituents in this area is disfavored for inhibitor activity, while in the
interaction bridged by W3027, where the oxygen at the C8-position of the main chain and the nitrogen of
the isoxazole ring act as H-bond receptor, the backbone NH of Ala108 and Ala109 act as hydrogen donor,
hence, positive charged substituents around the isoxazole are favored for inhibitor activity.
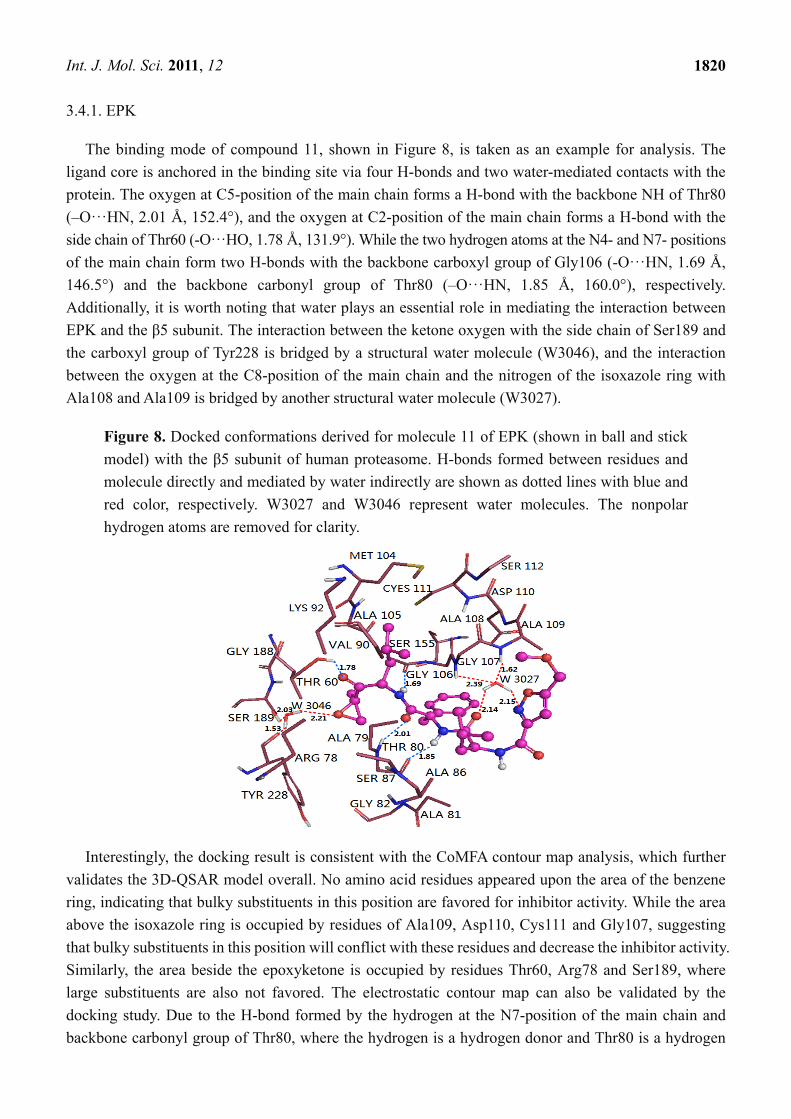
3.4.2. TBA
The binding mode of compound 2 shown in Figure 9 is taken as a docking model for analysis. The
ligand core is anchored in the binding site by nine H-bonds contacting the protein. The two oxygen
atoms at the C7- and C4-positions of the main chain form two H-bonds with the backbone NH of Ser189
(−O···HN, 2.30 Å, 134.3°) and backbone NH of Gly106 (−O···HN, 2.26 Å, 137.2°), respectively. While
the two hydroxyl oxygen atoms at B1-position of the main chain, acting as hydrogen acceptors, form two
H-bonds with the same hydroxyl hydrogen of Thr60 (–O···HO, 1.68 Å, 115.4°) and (–O···HO, 2.25 Å,
116.2°), respectively. The hydroxyl oxygen of Thr60 forms two H-bonds with the two hydroxyl
hydrogen atoms at the B1-position of the main chain (−O···HO, 2.70 Å, 53.4°) and (−O···HO, 2.53 Å,
95.2°), respectively. Another hydroxyl oxygen of Thr80 forms a H-bond with hydrogen at the N3-
position of the main chain (-O···HN, 2.30 Å, 154.8°), the carbonyl oxygen of Arg78 forms a H-bond
with one hydroxyl hydrogen at the B1-position (-O···HO, 1.84 Å, 163.9°), meanwhile, the oxygen of
this hydroxyl forms another H-bond with the backbone NH of Lys92 (-O···HN, 2.75 Å, 95.6°).
Figure 9. Docked conformations derived for molecule 2 of TBA (shown in ball and stick
model) with the β5 subunit of human proteasome. H-bonds formed between residues and
molecule are shown as dotted lines with blue color. The nonpolar hydrogen atoms are
removed for clarity.
Similarly, we found that docking result is in agreement with CoMSIA maps overall. Residues of
Ser189, Gly188 and Gly157 occupied the left area of the anisole group of the main chain, thus large
substituents in this area conflict with these residues and are not favored for molecular activity. In
contrary, no residues exist upon this anisole group, indicating that bulk substituents are favored in this
region. These findings and the steric contour map validate each other well. For the electrostatic countour
Int. J. Mol. Sci. 2011, 12
1822
map, one big blue polyhedron beside the anisole group at the C2-position and two small ones adjacent to
the methyl group of the anisole group at the C8- position and around the ethyl group at the C11-position
of the main chain can be explained by the facts that two hydroxyl oxygen atoms at the B1-position of the
main chain are H-bond acceptors in this area, where electropositive substituents are good to increase the
activity of molecules. Similarly, a red polyhedron behind the B1-position of the main chain can also be
interpreted by the two hydrogen atoms at the B1-position of the main chain as hydrogen bond acceptors,
where electropositive substituents are favored. A series of hydrophobic residues Tyr288, Ala105, Ser229,
Gly188 and Gly157 in the upper regions of the middle part of the molecule may interact with this part
through hydrophobic interactions, suggesting that adding hydrophobic substituents in this region may
increase the inhibitor activity. However, Thr80 and Gly106 residues interact with the ligand through
H-bonds interaction; thus, more hydrophobic residues surrounding this area will decrease inhibitor
activity. To the H-bond acceptor counter map, two hydroxyl oxygen atoms at the B1-position, acting as
hydrogen acceptors, are involved in hydrogen bonding interactions with the backbone of Lys93 and side
chain of Thr60. Thus, both the red and magenta polyhedrons are observed nearby the hydroxyl groups at
the B1-position of the main chain, suggesting that a negatively charged substituent with hydrogen bond
accepting capacity added to this position would engage in interactions with the donor and enhance the
inhibitory activity.
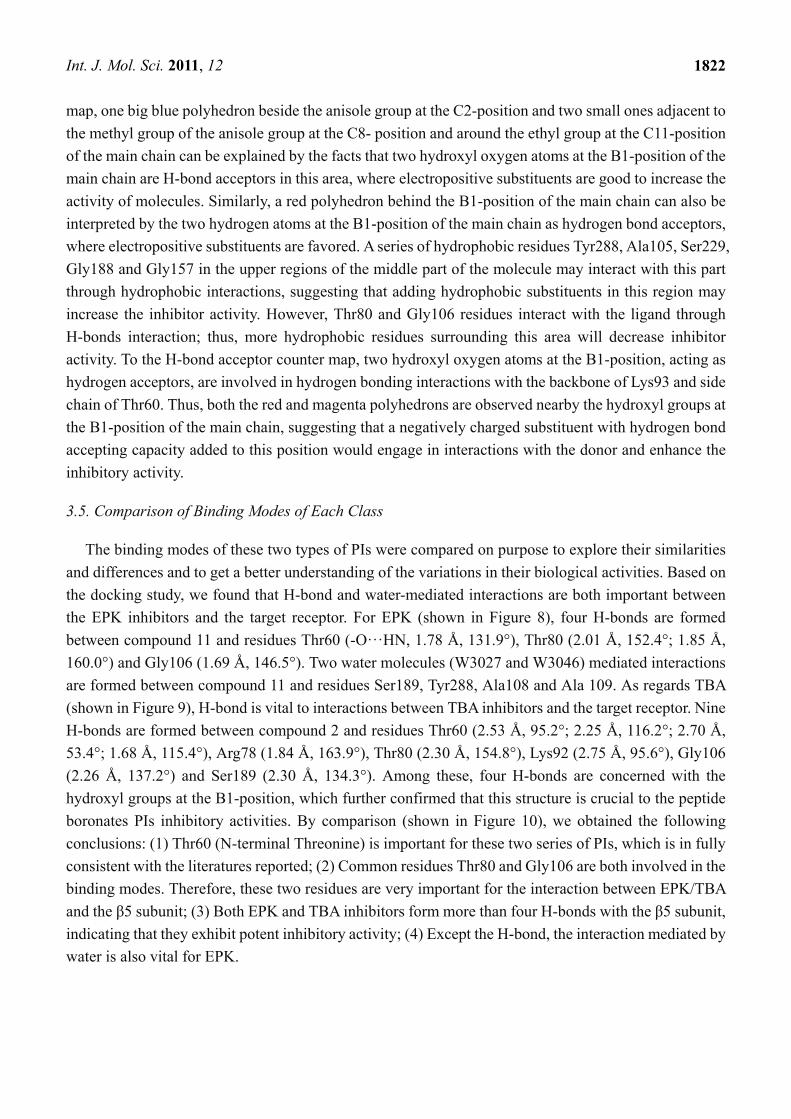
3.5. Comparison of Binding Modes of Each Class
The binding modes of these two types of PIs were compared on purpose to explore their similarities
and differences and to get a better understanding of the variations in their biological activities. Based on
the docking study, we found that H-bond and water-mediated interactions are both important between
the EPK inhibitors and the target receptor. For EPK (shown in Figure 8), four H-bonds are formed
between compound 11 and residues Thr60 (-O···HN, 1.78 Å, 131.9°), Thr80 (2.01 Å, 152.4°; 1.85 Å,
160.0°) and Gly106 (1.69 Å, 146.5°). Two water molecules (W3027 and W3046) mediated interactions
are formed between compound 11 and residues Ser189, Tyr288, Ala108 and Ala 109. As regards TBA
(shown in Figure 9), H-bond is vital to interactions between TBA inhibitors and the target receptor. Nine
H-bonds are formed between compound 2 and residues Thr60 (2.53 Å, 95.2°; 2.25 Å, 116.2°; 2.70 Å,
53.4°; 1.68 Å, 115.4°), Arg78 (1.84 Å, 163.9°), Thr80 (2.30 Å, 154.8°), Lys92 (2.75 Å, 95.6°), Gly106
(2.26 Å, 137.2°) and Ser189 (2.30 Å, 134.3°). Among these, four H-bonds are concerned with the
hydroxyl groups at the B1-position, which further confirmed that this structure is crucial to the peptide
boronates PIs inhibitory activities. By comparison (shown in Figure 10), we obtained the following
conclusions: (1) Thr60 (N-terminal Threonine) is important for these two series of PIs, which is in fully
consistent with the literatures reported; (2) Common residues Thr80 and Gly106 are both involved in the
binding modes. Therefore, these two residues are very important for the interaction between EPK/TBA
and the β5 subunit; (3) Both EPK and TBA inhibitors form more than four H-bonds with the β5 subunit,
indicating that they exhibit potent inhibitory activity; (4) Except the H-bond, the interaction mediated by
water is also vital for EPK.
Int. J. Mol. Sci. 2011, 12
1823
Figure 10. Stereo view of the docked conformations with compounds 11 and 2 in the active
site of the β5 subunit. The H-bonds formed between residues and molecule directly and
mediated by water indirectly are shown as dotted lines with black and blue color,
respectively. Compounds 11 and 2, colored with magenta and blue, are presented in (A) and
(B). The important amino acid residues, Thr60, Arg78, Thr80, Lys92, Ser106, Ala108,
Ala109, Ser189 and Tyr228 and water molecules (stick rendering) are colored by atom type
(C, yellow; N, blue; H, white; O, red). The nonpolar hydrogen atoms are removed for clarity.
3.6. MD Simulations Analysis
When predicting the posing of a ligand into a protein, docking can provide a good starting point for
further calculations with the aim of evaluating the stability of the predicted interactions involved in
binding [66]. In order to investigate the positional and conformational changes of inhibitors relative to
the active pocket and reveal the binding stability, two 5 ns MD simulations were further performed based
on the aforementioned docking complex structures considering the effects of the receptor flexibility and
the explicit water solvation.
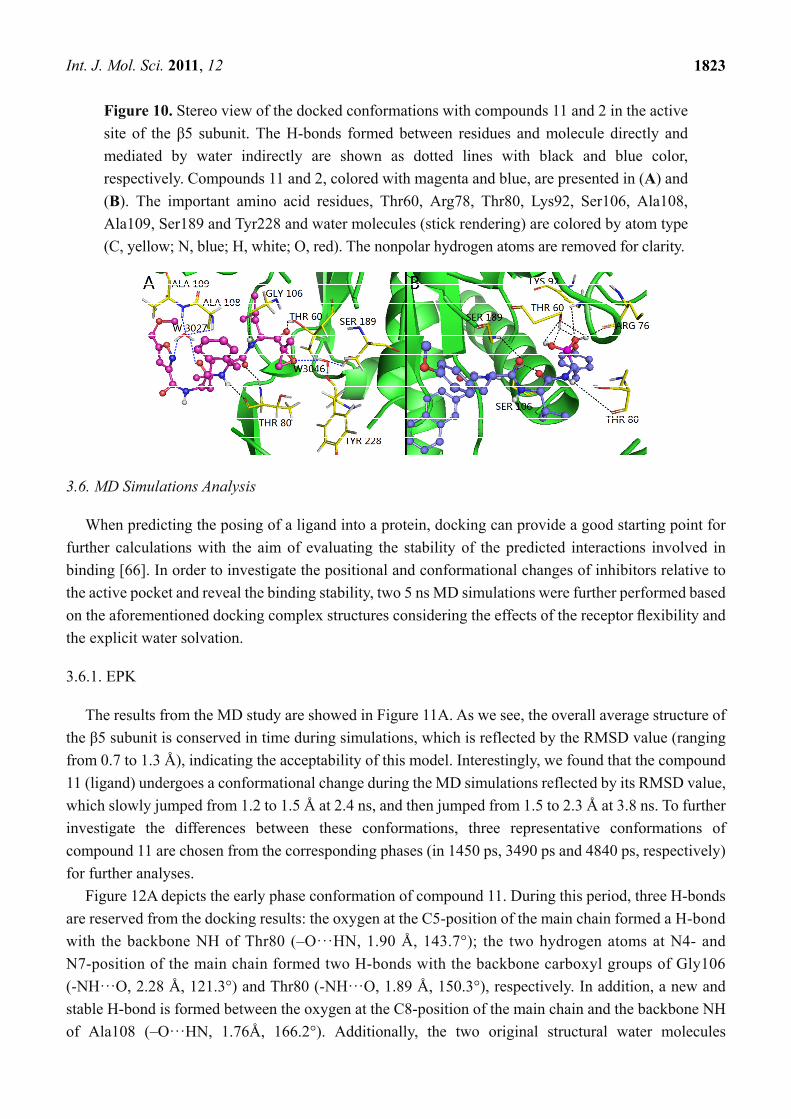
3.6.1. EPK
The results from the MD study are showed in Figure 11A. As we see, the overall average structure of
the β5 subunit is conserved in time during simulations, which is reflected by the RMSD value (ranging
from 0.7 to 1.3 Å), indicating the acceptability of this model. Interestingly, we found that the compound
11 (ligand) undergoes a conformational change during the MD simulations reflected by its RMSD value,
which slowly jumped from 1.2 to 1.5 Å at 2.4 ns, and then jumped from 1.5 to 2.3 Å at 3.8 ns. To further
investigate the differences between these conformations, three representative conformations of
compound 11 are chosen from the corresponding phases (in 1450 ps, 3490 ps and 4840 ps, respectively)
for further analyses.
Figure 12A depicts the early phase conformation of compound 11. During this period, three H-bonds
are reserved from the docking results: the oxygen at the C5-position of the main chain formed a H-bond
with the backbone NH of Thr80 (–O···HN, 1.90 Å, 143.7°); the two hydrogen atoms at N4- and
N7-position of the main chain formed two H-bonds with the backbone carboxyl groups of Gly106
(-NH···O, 2.28 Å, 121.3°) and Thr80 (-NH···O, 1.89 Å, 150.3°), respectively. In addition, a new and
stable H-bond is formed between the oxygen at the C8-position of the main chain and the backbone NH
of Ala108 (–O···HN, 1.76Å, 166.2°). Additionally, the two original structural water molecules
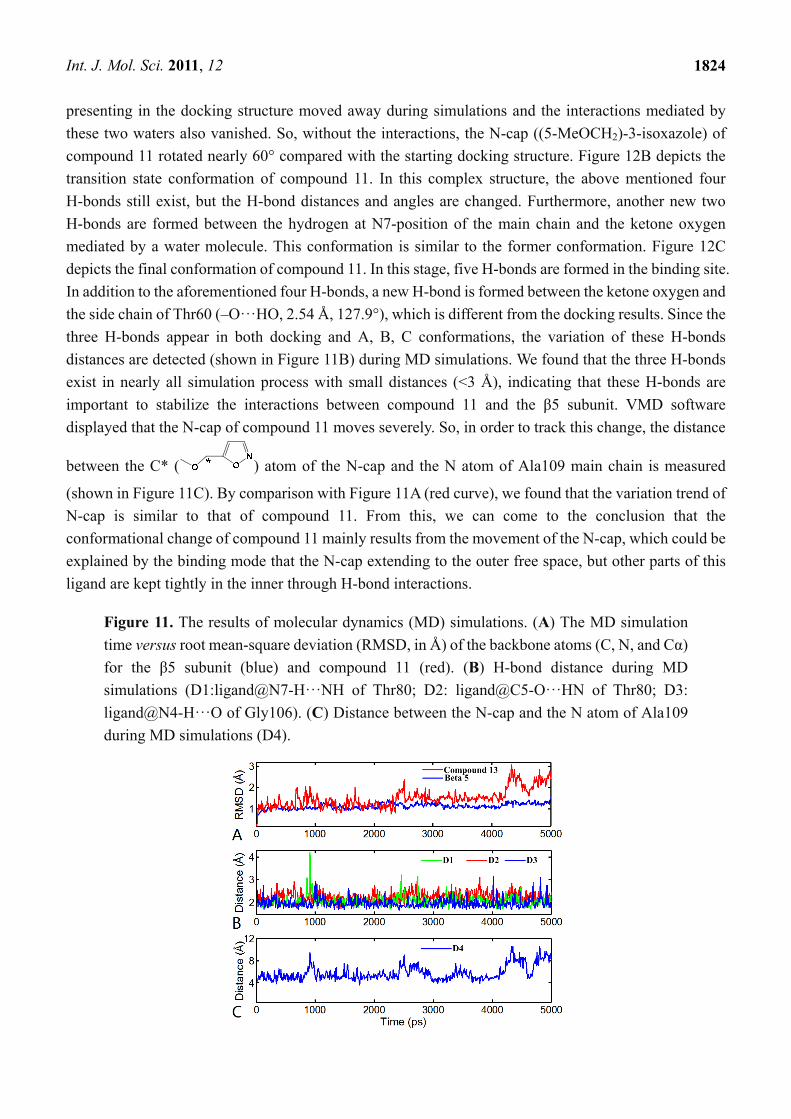
Int. J. Mol. Sci. 2011, 12
1824
presenting in the docking structure moved away during simulations and the interactions mediated by
these two waters also vanished. So, without the interactions, the N-cap ((5-MeOCH2)-3-isoxazole) of
compound 11 rotated nearly 60° compared with the starting docking structure. Figure 12B depicts the
transition state conformation of compound 11. In this complex structure, the above mentioned four
H-bonds still exist, but the H-bond distances and angles are changed. Furthermore, another new two
H-bonds are formed between the hydrogen at N7-position of the main chain and the ketone oxygen
mediated by a water molecule. This conformation is similar to the former conformation. Figure 12C
depicts the final conformation of compound 11. In this stage, five H-bonds are formed in the binding site.
In addition to the aforementioned four H-bonds, a new H-bond is formed between the ketone oxygen and
the side chain of Thr60 (–O···HO, 2.54 Å, 127.9°), which is different from the docking results. Since the
three H-bonds appear in both docking and A, B, C conformations, the variation of these H-bonds
distances are detected (shown in Figure 11B) during MD simulations. We found that the three H-bonds
exist in nearly all simulation process with small distances (<3 Å), indicating that these H-bonds are
important to stabilize the interactions between compound 11 and the β5 subunit. VMD software
displayed that the N-cap of compound 11 moves severely. So, in order to track this change, the distance
between the C* ( ) atom of the N-cap and the N atom of Ala109 main chain is measured
(shown in Figure 11C). By comparison with Figure 11A (red curve), we found that the variation trend of
N-cap is similar to that of compound 11. From this, we can come to the conclusion that the
conformational change of compound 11 mainly results from the movement of the N-cap, which could be
explained by the binding mode that the N-cap extending to the outer free space, but other parts of this
ligand are kept tightly in the inner through H-bond interactions.
Figure 11. The results of molecular dynamics (MD) simulations. (A) The MD simulation
time versus root mean-square deviation (RMSD, in Å) of the backbone atoms (C, N, and Cα)
for the β5 subunit (blue) and compound 11 (red). (B) H-bond distance during MD
simulations (D1:ligand@N7-H···NH of Thr80; D2: ligand@C5-O···HN of Thr80; D3:
ligand@N4-H···O of Gly106). (C) Distance between the N-cap and the N atom of Ala109
during MD simulations (D4).
Int. J. Mol. Sci. 2011, 12
1825
Interestingly, we found that the final conformation of compound 11 has identical molecular
orientation with the conformation of EPX extracted from the template 1G65_K (shown in Figure 12D).
Therefore, the obtained results of MD simulations of the protein-ligand system suggest that this class of
PIs adopts the same conformation to interact with the β5 subunit. Although the ligand undergoes several
movements to yield different conformations (from conformation A to C), the binding site is always same
during the whole dynamic process.
Figure 12. Different conformations derived for molecule 11 (shown in ball and stick with
magenta color) with the β5 subunit of human proteasome in MD simulations: (A) 1450 ps;
(B) 3490 ps; and (C) 4840 ps. (D) The conformation derived for EPX (shown as ball and
sticks with green color) with template protein. H-bonds are shown as dotted lines with blue
color. The nonpolar hydrogen atoms are removed for clarity.
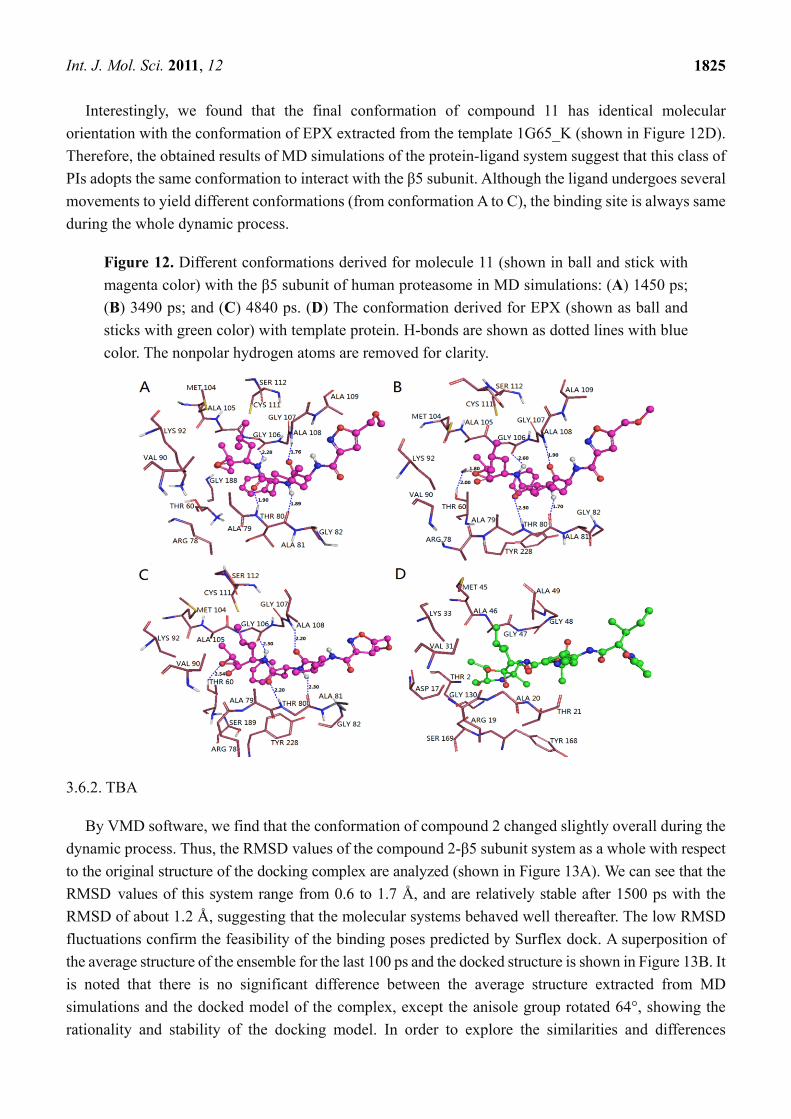
3.6.2. TBA
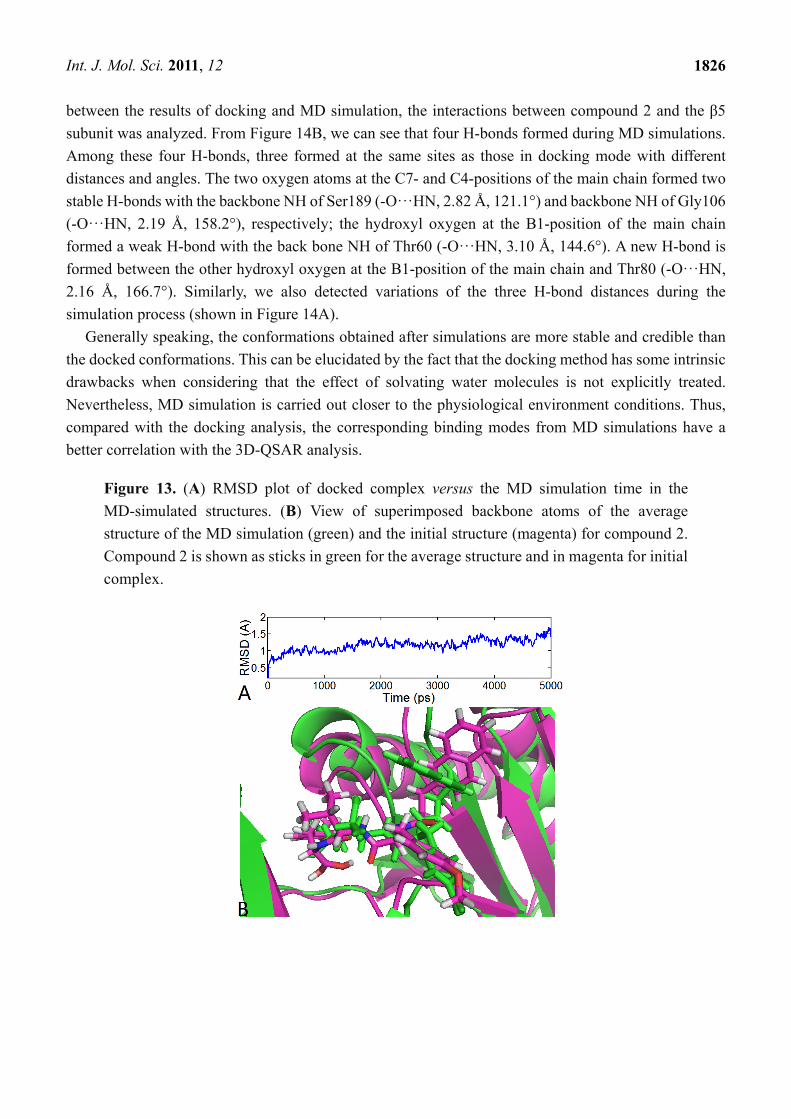
By VMD software, we find that the conformation of compound 2 changed slightly overall during the
dynamic process. Thus, the RMSD values of the compound 2-β5 subunit system as a whole with respect
to the original structure of the docking complex are analyzed (shown in Figure 13A). We can see that the
RMSD values of this system range from 0.6 to 1.7 Å, and are relatively stable after 1500 ps with the
RMSD of about 1.2 Å, suggesting that the molecular systems behaved well thereafter. The low RMSD
fluctuations confirm the feasibility of the binding poses predicted by Surflex dock. A superposition of
the average structure of the ensemble for the last 100 ps and the docked structure is shown in Figure 13B. It
is noted that there is no significant difference between the average structure extracted from MD
simulations and the docked model of the complex, except the anisole group rotated 64°, showing the
rationality and stability of the docking model. In order to explore the similarities and differences
Int. J. Mol. Sci. 2011, 12
1826
between the results of docking and MD simulation, the interactions between compound 2 and the β5
subunit was analyzed. From Figure 14B, we can see that four H-bonds formed during MD simulations.
Among these four H-bonds, three formed at the same sites as those in docking mode with different
distances and angles. The two oxygen atoms at the C7- and C4-positions of the main chain formed two
stable H-bonds with the backbone NH of Ser189 (-O···HN, 2.82 Å, 121.1°) and backbone NH of Gly106
(-O···HN, 2.19 Å, 158.2°), respectively; the hydroxyl oxygen at the B1-position of the main chain
formed a weak H-bond with the back bone NH of Thr60 (-O···HN, 3.10 Å, 144.6°). A new H-bond is
formed between the other hydroxyl oxygen at the B1-position of the main chain and Thr80 (-O···HN,
2.16 Å, 166.7°). Similarly, we also detected variations of the three H-bond distances during the
simulation process (shown in Figure 14A).
Generally speaking, the conformations obtained after simulations are more stable and credible than
the docked conformations. This can be elucidated by the fact that the docking method has some intrinsic
drawbacks when considering that the effect of solvating water molecules is not explicitly treated.
Nevertheless, MD simulation is carried out closer to the physiological environment conditions. Thus,
compared with the docking analysis, the corresponding binding modes from MD simulations have a
better correlation with the 3D-QSAR analysis.
Figure 13. (A) RMSD plot of docked complex versus the MD simulation time in the
MD-simulated structures. (B) View of superimposed backbone atoms of the average
structure of the MD simulation (green) and the initial structure (magenta) for compound 2.
Compound 2 is shown as sticks in green for the average structure and in magenta for initial
complex.
Int. J. Mol. Sci. 2011, 12
1827
Figure 14. (A) H-bond distance during MD simulations (D1:ligand@B-OH···NH of Thr60;
D2: ligand@N7-O···HN of Ser189; D3: ligand@C4-O···O of Gly106); (B) The
conformation derived for compound 2 (shown in ball and stick with blue color) with the β5
subunit of human proteasome in MD simulations. H-bonds formed by residues and molecule
are shown as dotted lines with blue color. The nonpolar hydrogen atoms are removed for
clarity.
4. Conclusion
In this study, the ligand-based and receptor-based 3D-QSAR studies using CoMFA and CoMSIA
methods have been performed on two kinds of PIs. The 3D-QSAR studies involving Dragon-descriptors
yielded stable and statistically significant predictive models with relatively high Q2, small SEE and high
Rpre2 values. Overall, for EPK, the study of its optimal model reveals that both steric and electrostatic
fields and molecular descriptors EEig04r, Mor24e are critical to its inhibitory activities, and TBA
optimal model implies that the electrostatic, hydrophobic fields and Dragon-descriptors, RDF050M and
AlogP2 are more important to its inhibitory activities. Satisfyingly, the interactions identified from the
3D contour maps are in good correlation with the specific interactions between the inhibitors and the
amino acid residues identified in the docked binding structures. Residues Thr60, Thr80, Gly106 and
Ser189 are demonstrated to be vital in facilitating β5 subunit recognition of its inhibitors. MD simulation
results of compound 11-β5 subunit complex revealed that EPK inhibitors undergo a conformational
change to interact with the receptor, which is consistent with the crystal structure (PDB code: 1G65_K).
In general, the good consistency between the 3D-QSAR, docking and MD results further implies the
robustness of the established 3D-QSAR models. Therefore, the obtained models can be used in guiding
future structural modifications and synthesizing novel potent inhibitors against the β5 subunit of human
proteasome.
Int. J. Mol. Sci. 2011, 12
1828
Acknowledgements
This work is financially supported by the Foundation of Bureau Science of Shaanxi (Grant
No.2009K01_25) and the Foundation of Education Bureau of Shaanxi (Grant No.2010JC22). The
authors are grateful to L. Yang for access of Sybyl software. The research is also supported by
high-performance computing platform of Northwest A & F University.
References
1. De Bettignies, G.; Coux, O.; Proteasome inhibitors: Dozens of molecules and still counting.
Biochimie 2010, 92, 1–16.
2. Wehenkel, M.; Ho, Y.K.; Kim, K.-B. Proteasome inhibitors: Recent progress and future directions.
Modul. Protein Stab. Cancer Ther. 2009, 99–119.
3. Golab, J.; Bauer, T.M.; Daniel, V.; Naujokat, C. Role of the ubiquitin-proteasome pathway in the
diagnosis of human diseases. Clin. Chim. Acta 2004, 340, 27–40.
4. Griffin, T.A.; Nandi, D.; Cruz, M.; Fehling, H.J.; Van Kaer, L.; Monaco, J.J.; Colbert, R.A.
Immunoproteasome assembly: Cooperative incorporation of interferon γ (IFN-γ)-inducible
subunits. J. Exp. Med. 1998, 187 (1), 97–104.
5. Kisselev, A.F.; Goldberg, A.L. Proteasome inhibitors: From research tools to drug candidates.
Chem. Biol. 2001, 8, 739–758.
6. Groll, M.; Ditzel, L.; Löwe, J.; Stock, D.; Bochtler, M.; Bartunik, H.D.; Huber, R. Structure of 20S
proteasome from yeast at 2.4 Å resolution. Nature 1997, 386, 463–471.
7. Löwe, J.; Stock, D.; Jap, B.; Zwickl, P.; Baumeister, W.; Huber, R. Crystal structure of the 20S
proteasome from the Archaeon T. acidophilum at 3.4 Å resolution. Science 1995, 268, 533–539.
8. Groll, M.; Berkers, C.R.; Ploegh, H.L.; Ovaa. H. Crystal structure of the boronic acid-based
proteasome inhibitor bortezomib in complex with the Yeast 20S proteasome. Structure 2005, 14,
451–456.
9. Unno, M.; Mizushima, T.; Morimoto, Y.; Tomisugi, Y.; Tanaka, K.; Yasuko, N.; Tsukihara T.
Structure determination of the constitutive 20S Proteasome from bovine liver at 2.75 Å resolution. J.
Biochem. 2002, 131,171–173.
10. Jung, T.; Catalgol, B.; Grune, T. The proteasomal system. Mol. Aspect. Med. 2009, 30, 191–296.
11. Rivett, A.J. The multicatalytic proteinase: Multiple proteolytic activities. J. Biol. Chem. 1989, 264,
12215–12219.
12. Chen, P.; Hochstrasser, M. Autocatalytic subunit processing couples active site formation in the 20S
proteasome to completion of assembly. Cell 1996, 86, 961–972.
13. Kisselev, A.F.; Akopian, T.N.; Castillo, V.; Goldberg, A.L. Proteasome active sites allosterically
regulate each other, suggesting a cyclical bite-chew mechanism for protein breakdown. Mol. Cell
1999, 4, 395–402. 14. Baumeister, W.; Walz, J.; Zuhl, F.; Seemuller, E. The proteasome: Paradigm of
self-compartmentalizing protease. Cell 1998, 92, 367–380.
15. Groll, M.; Bajorek, M.; Kohler, A.; Moroder, L.; Rubin, D.M.; Huber, R.; Glickman, M.H.; Finley, D. A
gated channel into the proteasome core particle. Nat. Struct. Biol. 2000, 7, 1062–1067.
Int. J. Mol. Sci. 2011, 12
1829
16. Jäger, S.; Groll, M.; Huber, R.; Wolf, D.H.; Heinemeyer, W. Proteasome β-type Subunits: Unequal
roles of propeptides in core particle maturation and a hierarchy of active site function. J. Mol. Biol.
1999, 291, 997–1013.
17. Lam, Y.A.; Pockart, C.M.; Alban, A.; Landon, M.; Jamieson, C.; Ramage, R.; Mayer, R.J.; Layfield,
R. Inhibition of the ubiquitin-proteasome system in Alzheimer’s disease. PANS 2000, 97 (18),
9902–9906.
18. Ding, Q.; Keller, J.N. Proteasome and proteasome inhibiton in the central nervous system. Biol.
Med. 2001, 31 (5), 574–584.
19. Marfella, R.; D’Amico, M.; Esposito, K.; Baldi, A.; Di Filippo, C.; Siniscalchi, M.; Sasso, F.C.;
Portoghese, M.; Cirillo, F.; Cacciapuoti, F.; et al. The ubiquitin-proteasome system and
inflammatory activity in diabetic atherosclerotic plaques. Diabetes 2006, 55, 622–632.
20. Xu, J.; Wu, Y.; Zhang, M.; Wang, S.; Zou, M.H. Proteasome-dependent degradation of guanosine
5’-triphosphate cyclohydrolase I causes tetrahydrobiopterin deficiency in diabetes mellitus.
Circulation 2007, 116, 944–953.
21. Wojcik, C.; Di Napoli, M. Ubiquitin-proteasome system and proteasome inhibition: New strategies
in sroke therapy. Stroke 2004, 35, 1506–1518.
22. Wu, W.K.K.; Cho, C.H.; Lee, C.W.; Wu, K.; Fan, D.; Yu, J.; Sung, J.J. Proteasome inhibition: A
new therapeutic strategy to cancer treatment. Cancer Lett. 2010, 293, 15–22.
23. Hideshima, T.; Chauhan, D.; Richardson, P.; Mitsiades, C.; Mitsiades, N.; Hayashi, T.; Munshi, N.;
Dang, L.; Castro, A.; Palombella.; Adams, J.; Anderson, K.C. NF-kappa B as a therapeutic target in
multiple myeloma. J. Biol. Chem. 2002, 277, 16639–16647.
24. Lopes, U.G.; Erhardt, P.; Yao, R.; Cooper, G.M. p53-Dependent induction of apoptosis by
proteasome inhibitors. J. Biol. Chem. 1997, 272 (20), 12893–12896.
25. Pleban, E.; Bury, M.; M1ynarczuk, I.; Wójcik, C. Effects of proteasome inhibitor PSI on neoplastic
and non-transformed cell lines. Folia Histochem. Cytobiol. 2001, 39, 133–134.
26. Adams, J.; Kauffman, M. Development of the proteasome inhibitor VelcadeTM (Bortezomib).
Cancer Investig. 2004, 22 (2), 304–311.
27. Adams, J. Proteasome inhibition: A novel approach to cancer therapy. Trends Mol. Med. 2002, 8
(Suppl. 4), S49-S54.
28. Richardson, P.G.; Briemberg, H.; Jagannath, S.; Wen, P.K.; Barlogie, B.; Berenson, J.; Singhal, S.;
Siegel, D.S.; Irwin, D.; Schuster, M.; et al. Frequency, characteristics, and reversibility of
peripheral neuropathy during treatment of advanced multiple myelomawith bortezomib. J. Clin.
Oncol. 2006, 24 (19), 3113–3120.
29. Sugawara, K.; Hatori, M.; Nishiyama, Y.; Tomita, K.; Kamei, H.; Konishi, M.; Oki, T. Eponemycin,
a new antibiotic active against B16 melanoma. I. Production, isolation, structure and biological
activity. J. Antibiot. 1990, 43, 8–18.
30. Hanada, M.; Sugawara, K.; Kaneta, K.; Toda, S.; Nishiyama, Y.; Tomita, K.; Yamamoto, H.;
Konishi, M.; Oki, T. Epoxomicin, a new antitumor agent of microbial origin. J. Antibiot. 1992, 45,
1746–1752.
31. Meng, L.; Mohan, R.; Kwok, B.H.B.; Elofsson, M.; Crews, C.M. Epoxomicin, a potent and
selective proteasome inhibitor, exhibits in vivo antiinflammatory activity. Med. Sci. 1999, 96,
10403–10408.
Int. J. Mol. Sci. 2011, 12
1830
32. Groll, M.; Kim, K.B.; Kairies, N.; Huber, R.; Crews, C.M. Crystal structure of epoxomicin: 20S
proteasome reveals a molecular basis for selectivity of α’, β’-epoxyketone proteasome inhibitors. J.
Am. Chem. Soc. 2000, 122, 1237–1238.
33. Elofsson, M.; Splittgerber, U.; Myung, J.; Mohan, R.; Crews, C.M. Towards subunit-specific
proteasome inhibitors: Synthesis and evaluation of peptide alpha’, beta’-epoxyketones. Chem. Biol.
1999, 6, 811–822.
34. Momose, I.; Sekizawa, R.; Hashizume, H.; Kinoshita, N.; Homma, Y.; Hamada, M.; Iinuma, H.;
Takeuchi, T. Tyropeptins A and B, new proteasome inhibitors produced by Kitasatospora sp.
MK993-dF2. J. Antibiot. 2001, 54 (12), 997–1012.
35. Watanabe, T.; Abe, H.; Momose, I.; Takahashi, Y.; Ikeda, D.; Akamatsu, Y. Structure-activity
relationship of boronic acid derivatives of tyropeptin: Proteasome inhibitors. Bioorg. Med. Chem.
Lett. 2010, 20, 5839–5842.
36. Liao, S.Y.; Chen, J.C.; Qian, L.; Shen, Y.; Zheng, K.C. QSAR studies and molecular design of
phenanthrene-based tylophorine derivatives with anticancer activity. QSAR Comb. Sci. 2008, 27,
280–288.
37. Wei, S.P.; Ji, Z.Q.; Zhang, H.X.; Zhang, J.W.; Wang, Y.H.; Wu, W.J. Isolation, biological
evaluation and 3D-QSAR studies of insecticidal/narcotic sesquiterpene polyol esters. J. Mol. Model.
2010, DOI: 10.1007/s00894–010–0765-x.
38. Wang, X.; Yang, W.; Xu, X.; Zhang, H.; Wang, Y. Studies of benzothiadiazine derivatives as
Hepatitis C Virus NS5B polymerase inhibitors using 3D-QSAR, molecular docking and molecular
dynamics. Curr. Med. Chem. 2010, 17, 2788–2803.
39. Zhu, Y.-Q.; Pei, J.-F.; Liu, Z.-M.; Lai, L.-H. 3D-QSAR studies on tripeptide aldehyde inhibitors of
proteasome using CoMFA and CoMSIA methods. Bioorg. Med. Chem. 2006, 14, 1483–1496.
40. Zhu, Y.-Q.; Lei, M.; Lu, A.-J.; Zhao, X.; Yin, X.-J.; Gao, Q.-Z. 3D-QSAR studies of
boron-containing dipeptides as proteasome inhibitors with CoMFA and CoMSIA methods. Europ. J.
Med. Chem. 2009, 44, 1486–1499.
41. Zhou, H.-J.; Aujay, M.A.; Bennett, M.K.; Dajee, M.; Demo, S.D.; Fang, Y.; Ho, M.N.; Jiang, J.;
Kirk, C.J.; Laidig, G.J.; Lewis, E.R.; Lu, Y.; Muchamuel, T.; Parlati, F.; Ring, E.; Shenk, K.D.;
Shields, J.; Shwonek, P.J.; Stanton, T.; Sun, C.M.; Sylvain, C.; Woo, T.M.; Yang, J. Design and
synthesis of an orally bioavaliable and selective peptide epoxyketone proteasome inhibitor
(PR-047). J. Med. Chem. 2009, 52, 3028–3038.
42. Johnsamuel, J.; Byun, Y.; Jones, T.P.; Endo, Y.; Tjarks, W. A new strategy for molecular modeling
and receptor-based design of carborane containing compounds. J. Organometal. Chem. 2003, 680,
223–231.
43. Li, Y.; Wang, Y.-H.; Ding, J.; Wang, Y.; Chang, Y.-Q.; Zhang, S.-W. In silico prediction of
androgenic and nonandrogenic compounds using random forest. QSAR Comb. Sci. 2009, 28 (4),
396–405.
44. Wang, Y.-H.; Li, Y.; Yang, S.-L.; Yang, L. An in silico approach for screening flavonoids as
P-glycoprotein inhibitors based on a Bayesian-regularized neural network. J. Comput. Aid Mol.
Design 2005, 19, 137–147.
Int. J. Mol. Sci. 2011, 12
1831
45. Wang, Y.-H.; Li, Y.; Yang, S.-L.; Yang, L. Classification of substrates and inhibitors of
p-glycoprotein using unsupervised machine learning approach. J. Chem. Inf. Model. 2005, 45,
750–757.
46. Wang, Y.-H.; Li, Y.; Li, Y.-H.;Yang, S.-L.; Yang, L. Modeling Km values using electrotopological
state: Substrates for cytochrome P450 3A4-mediated metabolism. Bioorg. Med. Chem. Lett. 2005,
15, 4076–4084.
47. Todeschini, R.; Consonni, V. Handbook of Molecular Descriptors; Wiley VCH: Weinheim,
Germany, 2000.
48. Cramer III, R.D.; Patterson, D.E.; Bunce, J.D. Comparative molecular field analysis (CoMFA). 1.
Effect of shape on binding of steroids to carrier proteins. J. Am. Chem. Soc. 1988, 110, 5959–5967.
49. Tetko, I.V.; Tanchuk, V.Y.; Villa, A.E. Prediction of n-octanol/water partition coefficients from
PHYSPROP database using artificial neural networks and E-state indices. J. Chem. Inf. Comput. Sci.
2001, 41, 1407–1421.
50. Schafferhans, A.; Klebe, G. Docking ligands onto binding site representations derived from
proteins built by homology modelling. J. Mol. Biol. 2001, 307, 407–427.
51. Thompson, J.D.; Higgins, D.G.; Gibson, T.J. CLUSTAL W: Improving the sensitivity of
progressive multiple sequence alignment through sequence weighting, position-specific gap
penalties and weight matrix choice. Nucleic Acids Res. 1994, 22, 4673–4680.
52. Arnold, K.; Bordoli, L.; Kopp, J.; Schwede, T. The SWISS-MODEL workspace: A web-based
environment for protein structure homology modeling. Bioinformatics 2006, 22, 195–201.
53. Schwede, T.; Kopp, J.; Guex, N.; Peitsch, M.C. SWISS-MODEL: An automated protein
homology-modeling server. Nucleic Acids Res. 2003, 31, 3381–3385.
54. Guex, N.; Peitsch, M.C. SWISS-MODEL and the Swiss-PdbViewer: An environment for
comparative protein modeling. Electrophoresis 1997, 18, 2714–2723.
55. Jain, A.N. Surflex: Fully automatic flexible molecular docking using a molecular similarity-based
search engine. J. Med. Chem. 2003, 46, 499–511.
56. Case, D.A.; Darden, T.A.; Cheatham, I.; Simmerling, C.L.; Wang, J.; Duke, R.E.; Luo, R.;
Crowley, M.; Walker, R.C.; Zhang, W.; et al. AMBER 10; University of California, San Francisco,
CA, USA, 2008.
57. Wang, J.; Wolf, R.M.; Caldwell, J.W.; Kollman, P.A.; Case, D.A. Development and testing of a
general amber force field. J. Comput. Chem. 2004, 25, 1157–1174.
58. Jakalian, A.; Jack, D.B.; Bayly, C.I. Fast, efficient generation of high-quality atomic charges.
AM1-BCC model: II. Parameterization and validation. J. Comput. Chem. 2002, 23, 1623–1641.
59. Hummer, G.; Rasaiah, J.C.; Noworyta, J.P. Water conduction through the hydrophobic channel of a
carbon nanotube. Nature 2001, 414, 188–190.
60. Jorgensen, W.L.; Chandrasekhar, J.; Madura, J.D.; Klein, M.L. Comparison of simple potential
functions for simulating liquid water. J. Chem. Phys. 1983, 79, 926–935.
61. Essmann, U.; Perera, L.; Berkowitz, M.L.; Darden, T. A smooth particle mesh Ewald method.
J. Chem. Phys. 1995, 103, 8577–9593.
Int. J. Mol. Sci. 2011, 12
1832
N-cap
62. Ryckaert, J.P.; Ciccotti, G.; Berendsen, H.J.C. Numerical integration of the cartesian equations of
motion of a system with constraints: Molecular dynamics of n-alkanes. J. Comput. Phys. 1977, 23,
327–341.
63. Hammer, M.C.; Steinhauer, V.; Gasteiger, J. Deriving the 3D structure of organic molecules from
their infrared spectra. Vib. Spectrosc. 1999, 19, 151–164.
64. Cavasotto, C.N.; Phatak, S.S. Homology modeling in drug discovery: Current trends and
applications. Drug Discov. Today 2009, 14 (13), 676–683.
65. Zhang, B.; Li, Y.; Zhang, H.; Ai, C. 3D-QSAR and molecular docking studies on derivatives of
MK-0457, GSK1070916 and SNS-314 as inhibitors against Aurora B Kinase. Int. J. Mol. Sci. 2010,
11, 4326–4347.
66. Lavecchia, A.; Cosconati, S.; Novellino, E.; Calleri, E.; Temporini, C.; Massolini, G.; Carbonara,
G.; Fracchiolla, G.; Loiodice, F. Exploring the molecular basis of the enantioselective binding of
penicillin G acylase towards a series of 2-aryloxyalkanoic acids: A docking and molecular
dynamics study. J. Mol. Graph. Model. 2007, 25, 773–783.
Appendix
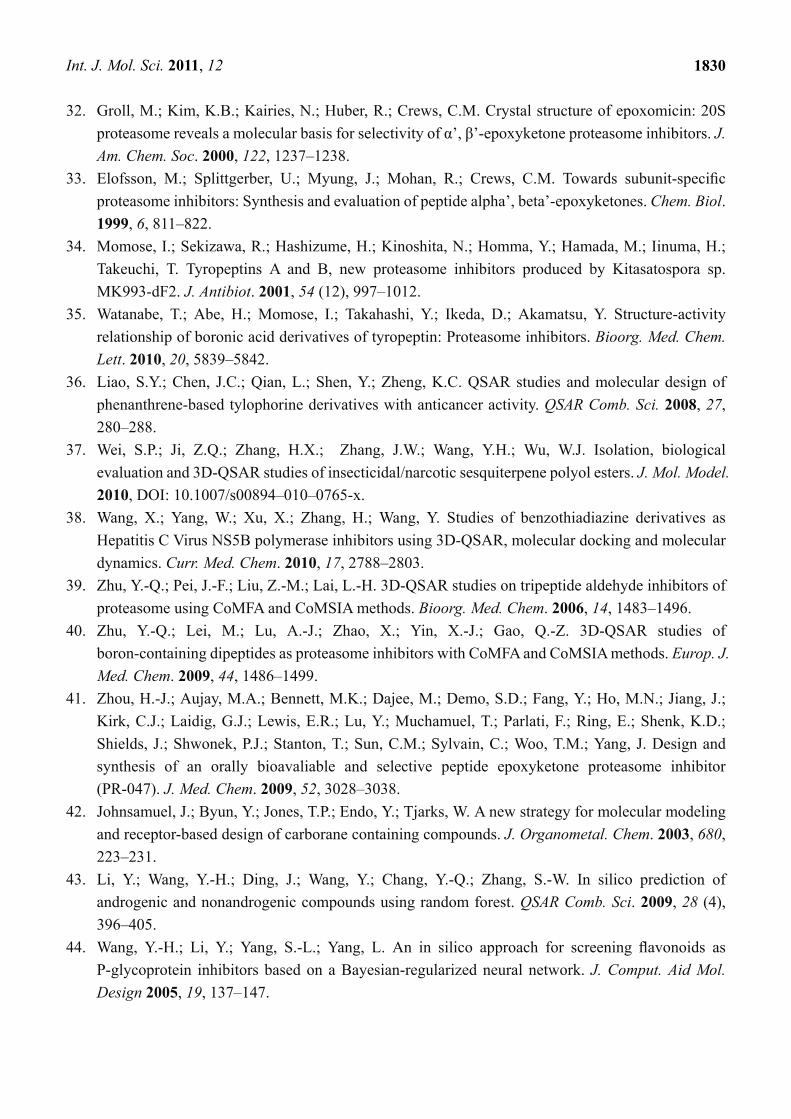
Appendix 1. EPK structures and their chymotrypsin-like (CT-L) inhibitory activity.
Compd. structure IC50(nM) pIC50
1
5.7
8.2441
2
1000
6.000
Compd. N-cap IC50(nM) pIC50 3 Morpholine-CH2 57 7.2441 4 3-furan 34 7.4685 5b 2-thiophene 10 8.0000 6 5-oxazole 27 7.5686 7 5-isoxazole 5.8 8.2366 8 3-isoxazole 7.4 8.1308 9 (5-Me)-3-isoxazole 1.8 8.7447 10 (5-iPr)-3-isoxazole 6.3 8.2007 11 (5-MeOCH2)-3-isoxazole 1.2 8.9208 12 3-pyrazole 36 7.4437 13b 2-imidazole 107 6.9706 14 (N-Me)-3-pyrazole 76 7.1192
Int. J. Mol. Sci. 2011, 12
1833
Appendix 1. Cont.
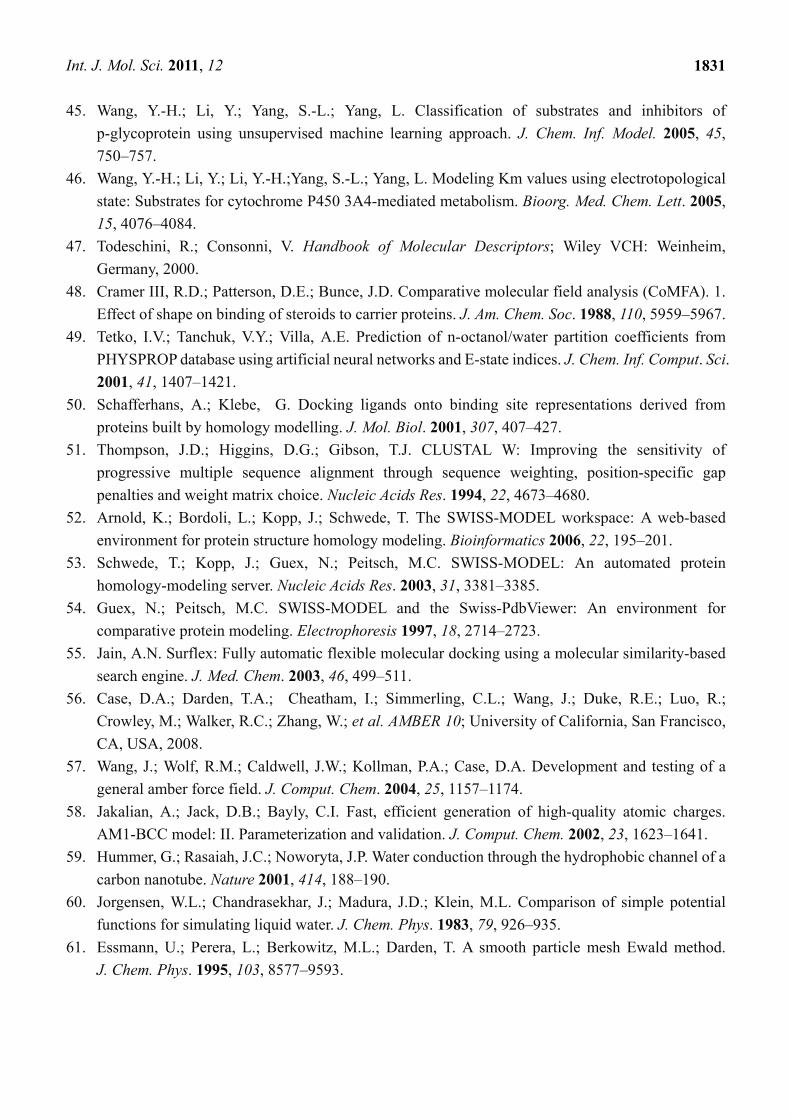
Compd. N-cap IC50(nM) pIC50
15b (N-Me)-2-imidazole 122 6.9136 16 (5-Me)-3-pyrazole 38 7.4202 17 4-pyridine 20 7.6990 18 4-pyridazine 12 7.9208 19 2-pyrazine 752 6.1238 20 2-(R)-tetrahydrofuran 34 7.4685 21 2-(S)-tetrahydrofuran 42 7.3768 22 (5-Me)-3- isoxazole-NH 13 7.8861
Compd. R P3 IC50(nM) pIC50 23 1-(1,2,4)-triazole-CH2 Leu 13 7.8861 24b 1-imidazole-CH2 Leu 15 7.8239 25b N-Me-piperazine-CH2 Leu 94 7.0269 26 Me Leu 4.1 8.3872 27 Morpholine-CH2 Ser(OMe) 9.3 8.0315 28 Me Ser(OMe) 5.7 8.2441 29 Me (4-Thiazolyl)-ala 6.7 8.1739 30 Morpholine-CH2 (4-Thiazolyl)-ala 6.9 8.1611 31 Me (2-Py)-ala 13 7.8861 32 Morpholine-CH2 (2-Py)-ala 5.2 8.284 33b Me (3-Py)-ala 1.6 8.7959 34b Morpholine-CH2 (3-Py)-ala 6.4 8.1938 35b Me (4-Py)-ala 2.8 8.5528 36 Morpholine-CH2 (4-Py)-ala 5.1 8.2924
Compd. P2 IC50(nM) pIC50
37 cyhxy-ala 13 7.8861
38 3-thienyl-ala 9.2 8.0362
39 4-thiazolyl-ala 16 7.7959
40 Val 44 7.3565
41 Leu 20 7.6990
42 Ala 19 7.7212
43 Abu 54 7.2676
44b CN-Ala 40 7.3979
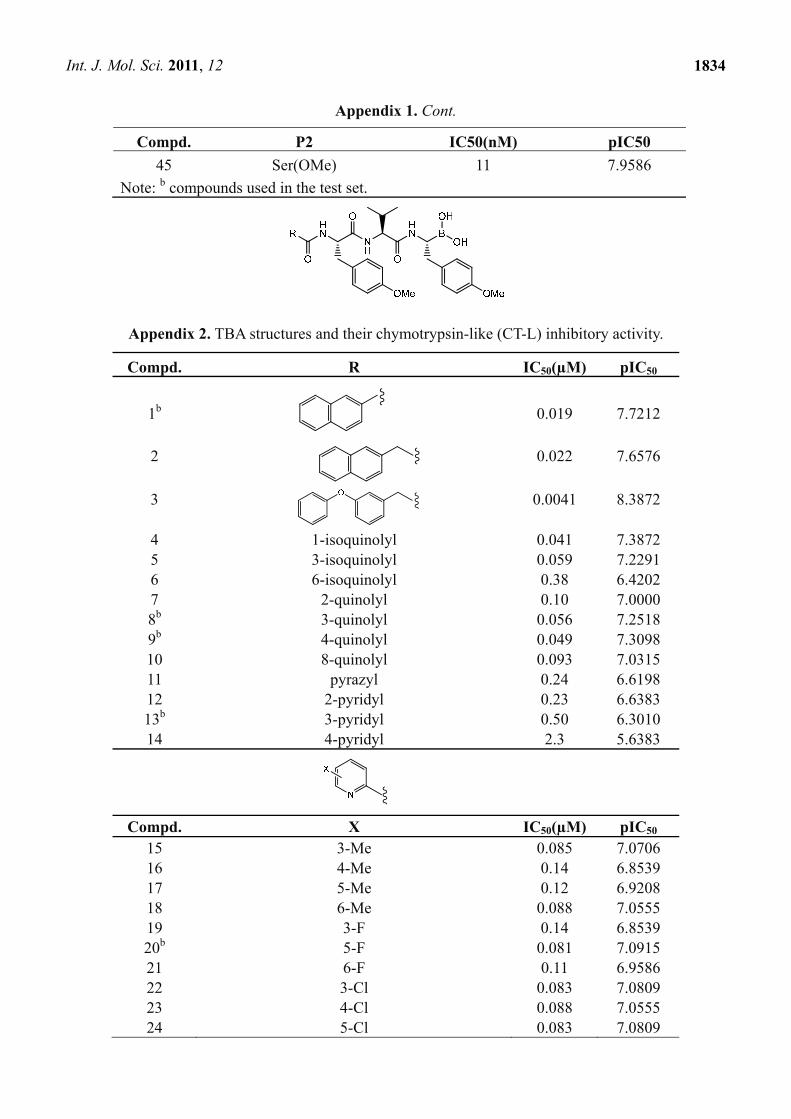
Int. J. Mol. Sci. 2011, 12
1834
Appendix 1. Cont.
Compd. P2 IC50(nM) pIC50
45 Ser(OMe) 11 7.9586
Note: b compounds used in the test set.
Appendix 2. TBA structures and their chymotrypsin-like (CT-L) inhibitory activity.
Compd. R IC50(µM) pIC50
1b
0.019
7.7212
2 0.022 7.6576
3
0.0041 8.3872
4 1-isoquinolyl 0.041 7.3872 5 3-isoquinolyl 0.059 7.2291 6 6-isoquinolyl 0.38 6.4202 7 2-quinolyl 0.10 7.0000 8b 3-quinolyl 0.056 7.2518 9b 4-quinolyl 0.049 7.3098 10 8-quinolyl 0.093 7.0315 11 pyrazyl 0.24 6.6198 12 2-pyridyl 0.23 6.6383 13b 3-pyridyl 0.50 6.3010 14 4-pyridyl 2.3 5.6383
Compd. X IC50(µM) pIC50 15 3-Me 0.085 7.0706 16 4-Me 0.14 6.8539 17 5-Me 0.12 6.9208 18 6-Me 0.088 7.0555 19 3-F 0.14 6.8539 20b 5-F 0.081 7.0915 21 6-F 0.11 6.9586 22 3-Cl 0.083 7.0809 23 4-Cl 0.088 7.0555 24 5-Cl 0.083 7.0809
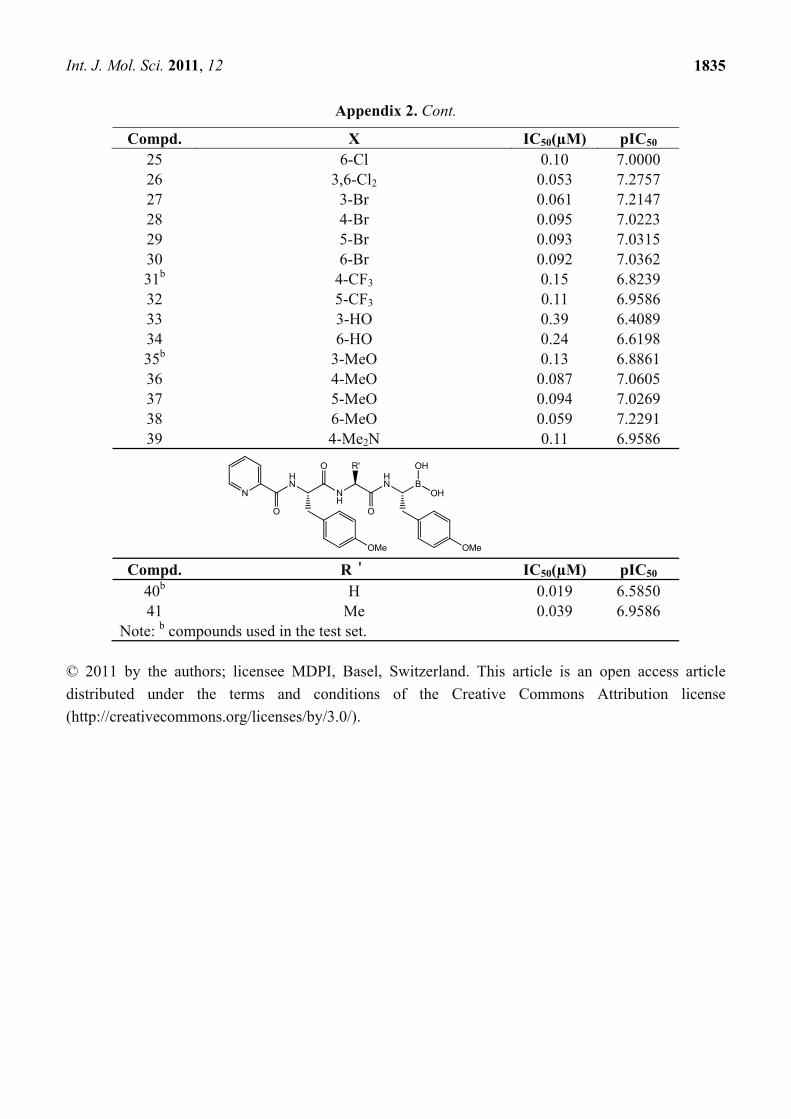
Int. J. Mol. Sci. 2011, 12
1835
Appendix 2. Cont.
Compd. X IC50(µM) pIC50
36 4-MeO 0.087 7.0605 37 5-MeO 0.094 7.0269 38 6-MeO 0.059 7.2291 39 4-Me2N 0.11 6.9586
Compd. R' IC50(µM) pIC50 40b H 0.019 6.5850 41 Me 0.039 6.9586
Note: b compounds used in the test set.
© 2011 by the authors; licensee MDPI, Basel, Switzerland. This article is an open access article
distributed under the terms and conditions of the Creative Commons Attribution license
(http://creativecommons.org/licenses/by/3.0/).
HN
O
NH
O R'HN
O
B
OH
OH
OMeOMe
N
25 6-Cl 0.10 7.0000 26 3,6-Cl2 0.053 7.2757 27 3-Br 0.061 7.2147 28 4-Br 0.095 7.0223 29 5-Br 0.093 7.0315 30 6-Br 0.092 7.0362 31b 4-CF3 0.15 6.8239 32 5-CF3 0.11 6.9586 33 3-HO 0.39 6.4089 34 6-HO 0.24 6.6198 35b 3-MeO 0.13 6.8861