International Journal of Electrical Energy, Vol. 4, No. 1 ...
5
A Study of Modified Vertical Axis Tidal Turbine to Improve Lift Performance Nu Rhahida Arini, Stephen R. Turnock, and Mingyi Tan FSI Group, Boldrewood Campus, University of Southampton, Southampton, United Kingdom Email: [email protected] Abstract—A design of Darrieus vertical axis tidal turbine using modified airfoil was studied numerically in this work. The turbine design was evaluated in 2D CFD model using k- ω turbulence model, upwind interpolation scheme and simulated using OpenFOAM. The turbine had three blades which were arranged symmetrically. The blades were of NACA 0012 airfoil which had been modified in the trailing edge region to increase its lift performance. The modification was made by truncating the trailing edge at the 15% of chord length from the trailing edge. Single normal and blunt airfoil were modelled and investigated prior to the turbine design evaluation. For generating the mesh, C- structured grid was employed to the single airfoil model and hybrid mesh to the vertical axis tidal turbine model. From the single airfoil simulations, it was found that blunt NACA0012 had 12% higher lift coefficient than normal airfoil and the pressure coefficient magnitude of blunt vertical axis tidal turbine significantly rise two times from vertical axis tidal turbine using normal NACA0012 airfoil. Index Terms—vertical axis tidal turbine, Darrieus turbine, truncated Naca0012, blunt airfoil I. INTRODUCTION Renewable energy has become a high demand over the past few years because of the fuel price increase as the effect of energy crisis. Natural resources ideally become alternative energy which are more environmental friendly and lower cost regarding its recovery and renewability. For some countries which are surrounded by oceans, waves and tides can become promising resources to gain renewable energy. Lundin [1] mentioned several designs of device which were commonly used for capturing marine and tidal current. One renewable energy device which is considered to have progressive development is vertical axis tidal turbine. The vertical axis tidal turbine is a recommended device for a country which intends to gain renewable energy from abundant tidal energy resources. Vertical Axis Tidal Turbine (VATT) uses force from the tide which acts on each blade, to rotate its rotor and generate mechanical energy. Amongst many vertical turbines, Darrieus type is the widely used for harnessing energy. Khalid [2] overviewed the use of VATT for power generation and found that it was more environmental friendly than other tidal device such as tidal barrack. Manuscript received June 30, 2015; revised December 28, 2015. Environmental effect of tidal turbine operation was also investigated by Lloyd [3] regarding the underwater noise and potential impact on the marine environment. In the turbine operation, fluid flow is perceived to be turbulent. The turbulence condition which is characterized by the irregularity and diffusivity leads to the fluid structure interactions complexity thus increases the difficulties of solving the problem as precise as the real condition. Computational Fluid Dynamic (CFD) method likely becomes an approach to overcome with an accurate result. In this work, CFD was implemented in the study of a single blunt NACA0012 airfoil and compare the result with normal airfoil prior to the evaluation of VATT. The result then was applied to the design of symmetric three bladed VATT using the blunt NACA0012 airfoil. Some parameters are of importance in turbine design as studied by Gosselin [4]. He found that solidity, number of blades, Reynolds number (Re), blade pitch angle (fixed and variable) and blade thickness strongly affected the dynamic configuration of Darrieus vertical axis turbine. One of his postulates was to find the optimal radius-based solidity for vertical axis turbine which was around 0.2. II. CFD DESIGN A. Airfoil Design Fitzeger [5] explained rigorously the CFD method including the stage of preprocessing, processing and postprocessing. The success of this method depends on the preprocessing stage in which the mesh is generated. In this stage, basically a domain which represents a region over where the fluid passes through is discretised into number of cells. The discretization exhibits grids and form a CFD mesh. The grids should be arranged in a high quality manner which is stated by terms like aspect ratio or skewness, in order to obtain high quality mesh on all over the domain and yield an accurate simulation result. The mesh should be sufficiently fine to capture the turbulence phenomena around an airfoil but in other hand it also requires to be feasibly coarse to ensure the calculation reliably doable. Date [6] showed a topology to generate mesh in the modified NACA0012 airfoil vicinity. He refined the trailing edge region around the flap which had similar profile to the blunt trailing edge airfoil. His result showed the refine grid (number of grid was 49) had good agreement with his experiment. International Journal of Electrical Energy, Vol. 4, No. 1, March 2016 ©2016 International Journal of Electrical Energy 37 doi: 10.18178/ijoee.4.1.37-41
Transcript of International Journal of Electrical Energy, Vol. 4, No. 1 ...
A Study of Modified Vertical Axis Tidal Turbine
to Improve Lift Performance
Nu Rhahida Arini, Stephen R. Turnock, and Mingyi Tan FSI Group, Boldrewood Campus, University of Southampton, Southampton, United Kingdom
Email: [email protected]
Abstract—A design of Darrieus vertical axis tidal turbine
using modified airfoil was studied numerically in this work.
The turbine design was evaluated in 2D CFD model using k-
ω turbulence model, upwind interpolation scheme and
simulated using OpenFOAM. The turbine had three blades
which were arranged symmetrically. The blades were of
NACA 0012 airfoil which had been modified in the trailing
edge region to increase its lift performance. The
modification was made by truncating the trailing edge at the
15% of chord length from the trailing edge. Single normal
and blunt airfoil were modelled and investigated prior to the
turbine design evaluation. For generating the mesh, C-
structured grid was employed to the single airfoil model and
hybrid mesh to the vertical axis tidal turbine model. From
the single airfoil simulations, it was found that blunt
NACA0012 had 12% higher lift coefficient than normal
airfoil and the pressure coefficient magnitude of blunt
vertical axis tidal turbine significantly rise two times from
vertical axis tidal turbine using normal NACA0012 airfoil.
Index Terms—vertical axis tidal turbine, Darrieus turbine,
truncated Naca0012, blunt airfoil
I. INTRODUCTION
Renewable energy has become a high demand over the
past few years because of the fuel price increase as the
effect of energy crisis. Natural resources ideally become
alternative energy which are more environmental friendly
and lower cost regarding its recovery and renewability.
For some countries which are surrounded by oceans,
waves and tides can become promising resources to gain
renewable energy. Lundin [1] mentioned several designs
of device which were commonly used for capturing
marine and tidal current.
One renewable energy device which is considered to
have progressive development is vertical axis tidal
turbine. The vertical axis tidal turbine is a recommended
device for a country which intends to gain renewable
energy from abundant tidal energy resources. Vertical
Axis Tidal Turbine (VATT) uses force from the tide
which acts on each blade, to rotate its rotor and generate
mechanical energy. Amongst many vertical turbines,
Darrieus type is the widely used for harnessing energy.
Khalid [2] overviewed the use of VATT for power
generation and found that it was more environmental
friendly than other tidal device such as tidal barrack.
Manuscript received June 30, 2015; revised December 28, 2015.
Environmental effect of tidal turbine operation was also
investigated by Lloyd [3] regarding the underwater noise
and potential impact on the marine environment.
In the turbine operation, fluid flow is perceived to be
turbulent. The turbulence condition which is
characterized by the irregularity and diffusivity leads to
the fluid structure interactions complexity thus increases
the difficulties of solving the problem as precise as the
real condition. Computational Fluid Dynamic (CFD)
method likely becomes an approach to overcome with an
accurate result. In this work, CFD was implemented in
the study of a single blunt NACA0012 airfoil and
compare the result with normal airfoil prior to the
evaluation of VATT. The result then was applied to the
design of symmetric three bladed VATT using the blunt
NACA0012 airfoil. Some parameters are of importance
in turbine design as studied by Gosselin [4]. He found
that solidity, number of blades, Reynolds number (Re),
blade pitch angle (fixed and variable) and blade thickness
strongly affected the dynamic configuration of Darrieus
vertical axis turbine. One of his postulates was to find the
optimal radius-based solidity for vertical axis turbine
which was around 0.2.
II. CFD DESIGN
A. Airfoil Design
Fitzeger [5] explained rigorously the CFD method
including the stage of preprocessing, processing and
postprocessing. The success of this method depends on
the preprocessing stage in which the mesh is generated.
In this stage, basically a domain which represents a
region over where the fluid passes through is discretised
into number of cells. The discretization exhibits grids and
form a CFD mesh. The grids should be arranged in a high
quality manner which is stated by terms like aspect ratio
or skewness, in order to obtain high quality mesh on all
over the domain and yield an accurate simulation result.
The mesh should be sufficiently fine to capture the
turbulence phenomena around an airfoil but in other hand
it also requires to be feasibly coarse to ensure the
calculation reliably doable. Date [6] showed a topology to
generate mesh in the modified NACA0012 airfoil vicinity.
He refined the trailing edge region around the flap which
had similar profile to the blunt trailing edge airfoil. His
result showed the refine grid (number of grid was 49) had
good agreement with his experiment.
International Journal of Electrical Energy, Vol. 4, No. 1, March 2016
©2016 International Journal of Electrical Energy 37doi: 10.18178/ijoee.4.1.37-41
In the processing stage, Navier stokes equation is
imposed to all cells and solved by the chosen turbulence
model. There is no definite rule or specific criteria to
consider in choosing turbulence model for solving CFD
cases, however the model impact the simulation stability
and solution accuracy. In this work, k-ω SST RANS
turbulence model was chosen for both cases, single airfoil
and VATT simulation. Any other parameters which were
taken into account such as airfoil vicinity, mesh topology
and boundary conditions for VATT design were also the
same as in single airfoil model.
Normal NACA0012 with 0.75 m chord length and had
Reynolds number of 3.07×10⁶, was primarily simulated and
validated to assure that mesh topology was valid to model
the blunt airfoil in the following step. The generated
single airfoil mesh employed C-strucutred grid as
illustrated in Fig. 1. The mesh was divided into nine
subdomains including boundary layers around the airfoil,
nose part, the upper and lower surface of airfoil, the
streamwise region and five far field region which was
away from airfoil surface. The airfoil had the same
number of points on the upper and lower surface which
was 200. The nose part had 65o of angle and contained of
100 points along the nose surface. The streamwise mesh
region was drawn from the trailing edge to the outlet of
the domain which was 200 and also set to have the same
nodes for upper and lower part.
Eleni et al. [7] simulated a model of NACA0012 with
C-structured grid which showed that independent mesh
simulation was performed when number of cell reached
80,000. Total number of cells in this domain reached
380,221. The airfoil was located in the centre of the
domain. The inlet was half circle with 17c in diameter to
avoid blockage effect as seen in the Fig. 1. The vertical
direction mesh was configured with the same nodes for
upper and lower part.
Figure 1. Domain of single airfoil
Figure 2. Mesh topology of single NACA 0012 at 0o angle of attack
Both, normal and blunt, single airfoil were simulated at
-8o, -6
o, -4
o, -2
o, 0
o, 2
o, 4
o, 6
o, 8
o angle of attack. There
were seven mesh boundaries used in the simulation of
single airfoil including inlet, outlet, top, bottom, front,
back and wall of the airfoil. The mesh topology of single
airfoil at 0° angle of attack is depicted in Fig. 2.
For blunt airfoil, Ramjee [8] studied experimentally
four different truncations and found that the highest lift
coefficient accured at airfoil with 15% of truncation. In
this blunt airfoil model, NACA0012 was truncated at
15% of chord length from trailing edge as drawn in the
Fig. 3.
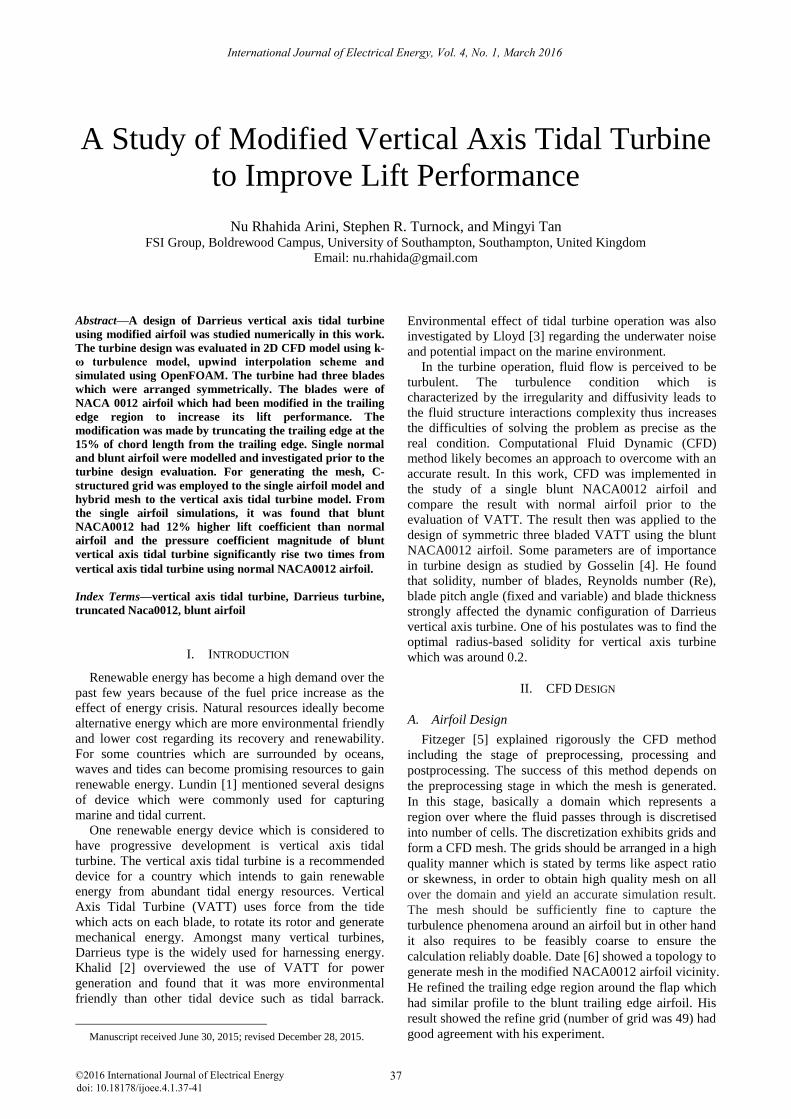
Figure 3. Mesh topology of single blunt NACA 0012 at 0° angle of attack
The mesh topology and boundary conditions of the
blunt airfoil was the same as the normal one except for
the trailing edge region. Behind the trailing edge,
boundary layers were added and refined to resolve the
turbulence phenomena. The boundary had 30 layers in
total. Total cells in the blunt airfoil domain was 391,879
and simulated using SIMPLE (Semi-Implicit Method for
Pressure-Linked Equations) algorithm in OpenFoam.
B. Turbine Design
VATT was designed using hybrid grid which
combined structured and unstructured mesh. From his
work, Gretton [9] suggested a VATT topology using O-
structured grid to model the turbine and unstructured grid
for far field region. Gosselin [4] was also meshing using
similar topology as Gretton’s. Both simulation came with
the same agreement as their experiment. Similar mesh
topology was also conducted by Lanzafame [10] who
generated a Darrieus turbine model with hybrid mesh.
The VATT domain was decomposed from a rotating and
fixed part named rotor and stator respectively as
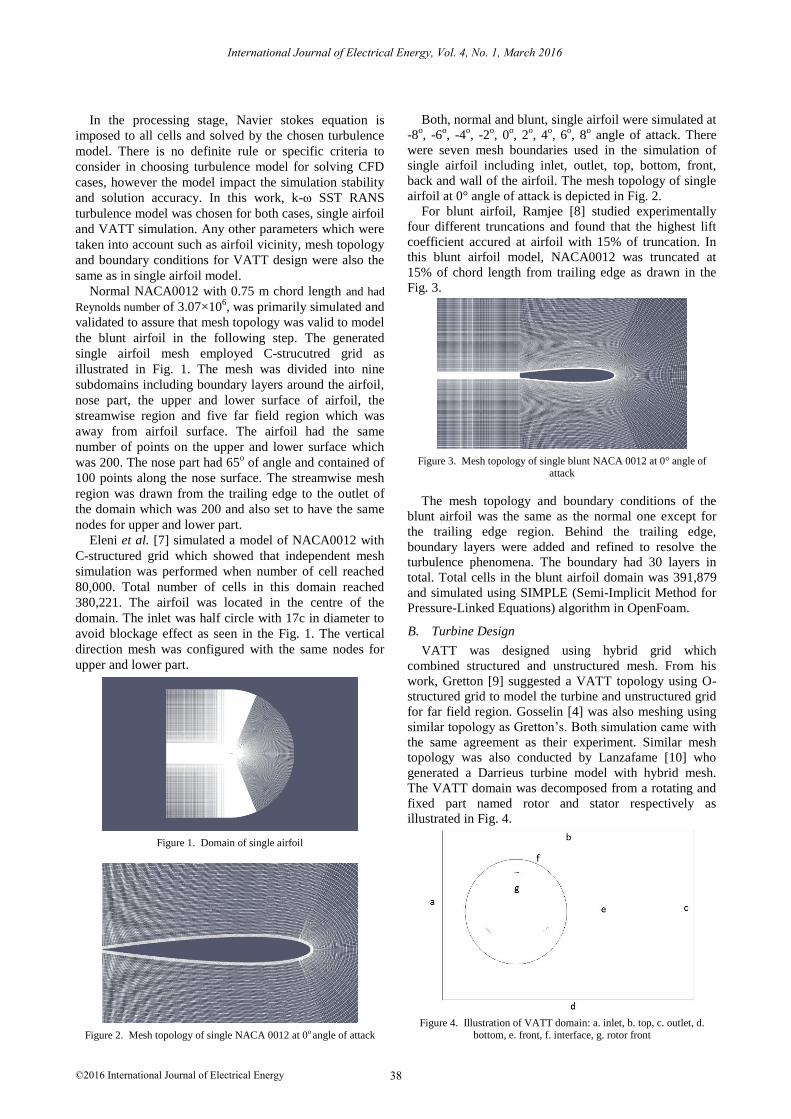
illustrated in Fig. 4.
Figure 4. Illustration of VATT domain: a. inlet, b. top, c. outlet, d. bottom, e. front, f. interface, g. rotor front
International Journal of Electrical Energy, Vol. 4, No. 1, March 2016
©2016 International Journal of Electrical Energy 38
The rotating domain represented the vertical axis
turbine which rotated with respect to its vertical axis,
normal to the flow direction. The stator model the
environment of the far field region and remained fixed
during the simulation. There were nine boundaries
utilized in the VATT model which were inlet, outlet, top,
bottom, front, back, airfoil wall, stator and rotor which
shared a surface as an interface. Incoming flow entered
the domain from the stator inlet, went across and swept
the rotor part prior to the final discharge at the outlet of
stator. The rotor radius was 3c of which the centre was
located in the middle of vertical direction as can be seen
in Fig. 5. The domain size was 17c height and 13c from
inlet of 62c length domain.
Figure 5. Rotor and stator mesh
The domain of the stator was set to have equal
distribution for all sides. For the interface between rotor
and stator, there were 258 points in total with equal
distribution at circumference and all connector lines of
the three blade domains. The total number of cells was
188,753 which exceeded the minimum cells required for
independence mesh. The examination of the mesh gave
the skewness and aspect ratio mesh value of 0.6 and 2.5.
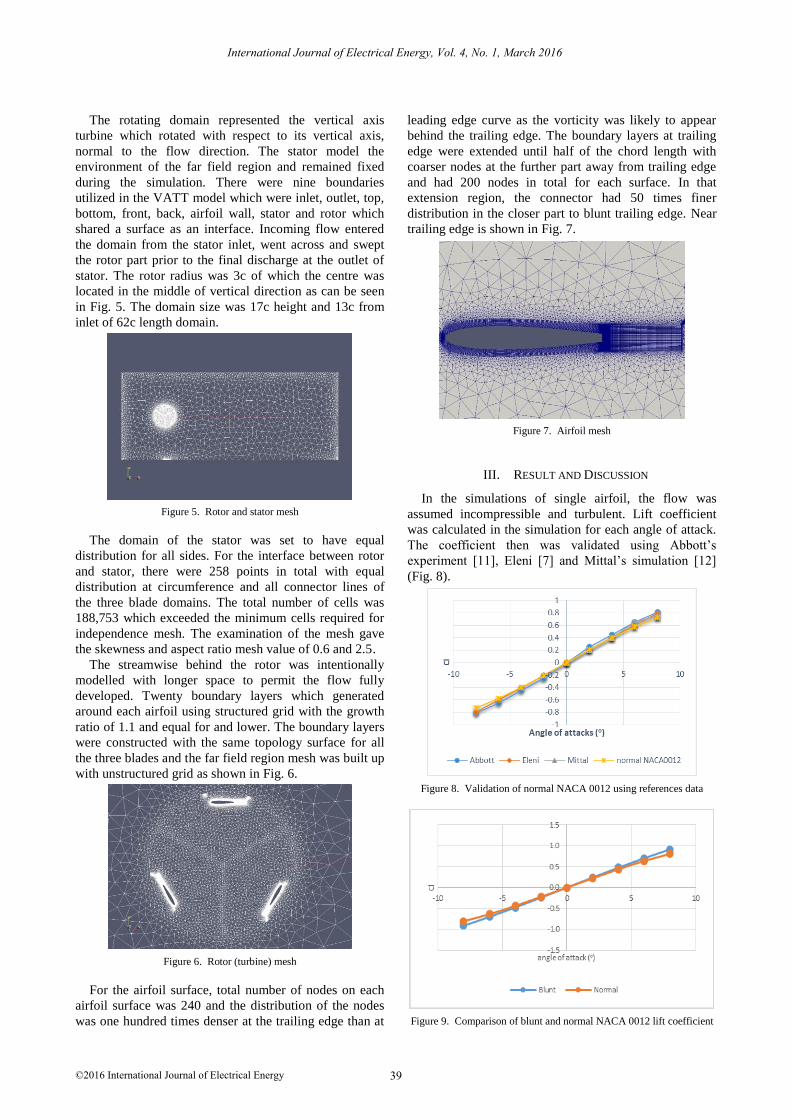
The streamwise behind the rotor was intentionally
modelled with longer space to permit the flow fully
developed. Twenty boundary layers which generated
around each airfoil using structured grid with the growth
ratio of 1.1 and equal for and lower. The boundary layers
were constructed with the same topology surface for all
the three blades and the far field region mesh was built up
with unstructured grid as shown in Fig. 6.
Figure 6. Rotor (turbine) mesh
For the airfoil surface, total number of nodes on each
airfoil surface was 240 and the distribution of the nodes
was one hundred times denser at the trailing edge than at
leading edge curve as the vorticity was likely to appear
behind the trailing edge. The boundary layers at trailing
edge were extended until half of the chord length with
coarser nodes at the further part away from trailing edge
and had 200 nodes in total for each surface. In that
extension region, the connector had 50 times finer
distribution in the closer part to blunt trailing edge. Near
trailing edge is shown in Fig. 7.
Figure 7. Airfoil mesh
III. RESULT AND DISCUSSION
In the simulations of single airfoil, the flow was
assumed incompressible and turbulent. Lift coefficient
was calculated in the simulation for each angle of attack.
The coefficient then was validated using Abbott’s
experiment [11], Eleni [7] and Mittal’s simulation [12]
(Fig. 8).
Figure 8. Validation of normal NACA 0012 using references data
Figure 9. Comparison of blunt and normal NACA 0012 lift coefficient
International Journal of Electrical Energy, Vol. 4, No. 1, March 2016
©2016 International Journal of Electrical Energy 39
In general at 2° angle of attack, the error was found to
be maximum amongst all angle of attacks simulated. The
maximum error was 6% from the Abbott’s experiment
and 10% from Eleni’s and Mittal’s simulation. The error
was contributed mainly by the fixed mesh which cannot
be adapted automatically by the change of angle and
likely the mesh of 2° angle was the most distorted. From
that error it can be deduced, the model was accurate
enough for evaluating blunt airfoil and the comparison of
normal and blunt result are shown in Fig. 9.
The maximum Cl increase was found at 8° angle of
attack and reached 12% from normal airfoil. At the blunt
airfoil, the fluid was accelerated more abruptly because of
sudden change of the truncation profile at the trailing
edge. The truncation profile was considered as a gap
between upper and lower surface which created a sudden
change in fluid velocity. The drastically velocity
alteration drove the fluid to move faster across the blunt
airfoil surface than in the normal airfoil. The effect
appeared stronger at the higher angle of attack.
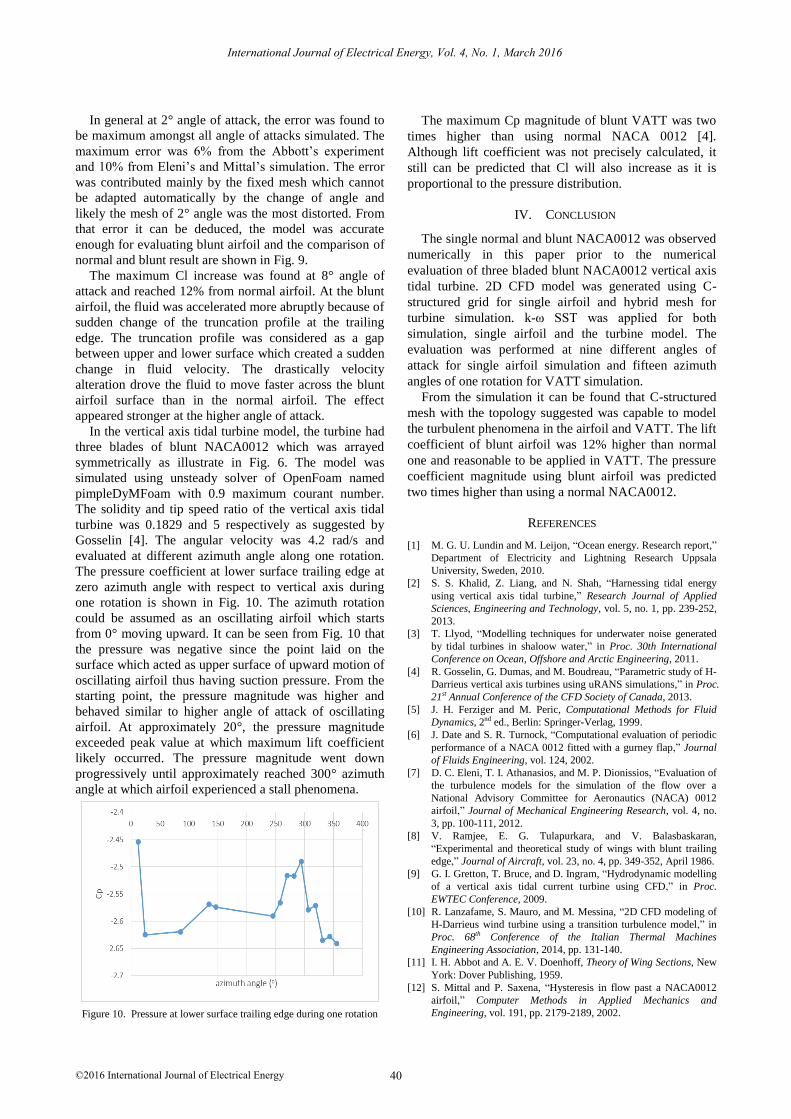
In the vertical axis tidal turbine model, the turbine had
three blades of blunt NACA0012 which was arrayed
symmetrically as illustrate in Fig. 6. The model was
simulated using unsteady solver of OpenFoam named
pimpleDyMFoam with 0.9 maximum courant number.
The solidity and tip speed ratio of the vertical axis tidal
turbine was 0.1829 and 5 respectively as suggested by
Gosselin [4]. The angular velocity was 4.2 rad/s and
evaluated at different azimuth angle along one rotation.
The pressure coefficient at lower surface trailing edge at
zero azimuth angle with respect to vertical axis during
one rotation is shown in Fig. 10. The azimuth rotation
could be assumed as an oscillating airfoil which starts
from 0° moving upward. It can be seen from Fig. 10 that
the pressure was negative since the point laid on the
surface which acted as upper surface of upward motion of
oscillating airfoil thus having suction pressure. From the
starting point, the pressure magnitude was higher and
behaved similar to higher angle of attack of oscillating
airfoil. At approximately 20°, the pressure magnitude
exceeded peak value at which maximum lift coefficient
likely occurred. The pressure magnitude went down
progressively until approximately reached 300° azimuth
angle at which airfoil experienced a stall phenomena.
Figure 10. Pressure at lower surface trailing edge during one rotation
The maximum Cp magnitude of blunt VATT was two
times higher than using normal NACA 0012 [4].
Although lift coefficient was not precisely calculated, it
still can be predicted that Cl will also increase as it is
proportional to the pressure distribution.
IV. CONCLUSION
The single normal and blunt NACA0012 was observed
numerically in this paper prior to the numerical
evaluation of three bladed blunt NACA0012 vertical axis
tidal turbine. 2D CFD model was generated using C-
structured grid for single airfoil and hybrid mesh for
turbine simulation. k-ω SST was applied for both
simulation, single airfoil and the turbine model. The
evaluation was performed at nine different angles of
attack for single airfoil simulation and fifteen azimuth
angles of one rotation for VATT simulation.
From the simulation it can be found that C-structured
mesh with the topology suggested was capable to model
the turbulent phenomena in the airfoil and VATT. The lift
coefficient of blunt airfoil was 12% higher than normal
one and reasonable to be applied in VATT. The pressure
coefficient magnitude using blunt airfoil was predicted
two times higher than using a normal NACA0012.
REFERENCES
[1] M. G. U. Lundin and M. Leijon, “Ocean energy. Research report,”
Department of Electricity and Lightning Research Uppsala
University, Sweden, 2010.
[2] S. S. Khalid, Z. Liang, and N. Shah, “Harnessing tidal energy
using vertical axis tidal turbine,” Research Journal of Applied
Sciences, Engineering and Technology, vol. 5, no. 1, pp. 239-252,
2013.
[3] T. Llyod, “Modelling techniques for underwater noise generated
by tidal turbines in shaloow water,” in Proc. 30th International
Conference on Ocean, Offshore and Arctic Engineering, 2011.
[4] R. Gosselin, G. Dumas, and M. Boudreau, “Parametric study of H-
Darrieus vertical axis turbines using uRANS simulations,” in Proc.
21st Annual Conference of the CFD Society of Canada, 2013.
[5] J. H. Ferziger and M. Peric, Computational Methods for Fluid
Dynamics, 2nd ed., Berlin: Springer-Verlag, 1999.
[6] J. Date and S. R. Turnock, “Computational evaluation of periodic
performance of a NACA 0012 fitted with a gurney flap,” Journal
of Fluids Engineering, vol. 124, 2002.
[7] D. C. Eleni, T. I. Athanasios, and M. P. Dionissios, “Evaluation of
the turbulence models for the simulation of the flow over a
National Advisory Committee for Aeronautics (NACA) 0012
airfoil,” Journal of Mechanical Engineering Research, vol. 4, no.
3, pp. 100-111, 2012.
[8] V. Ramjee, E. G. Tulapurkara, and V. Balasbaskaran,
“Experimental and theoretical study of wings with blunt trailing
edge,” vol. 23, no. 4, pp. 349-352, April 1986.
[9] G. I. Gretton, T. Bruce, and D. Ingram, “Hydrodynamic modelling
of a vertical axis tidal current turbine using CFD,” in Proc.
EWTEC Conference, 2009.
[10] R. Lanzafame, S. Mauro, and M. Messina, “2D CFD modeling of
H-Darrieus wind turbine using a transition turbulence model,” in
Proc. 68th Conference of the Italian Thermal Machines
Engineering Association, 2014, pp. 131-140.
[11] I. H. Abbot and A. E. V. Doenhoff, Theory of Wing Sections, New
York: Dover Publishing, 1959.
[12] S. Mittal and P. Saxena, “Hysteresis in flow past a NACA0012
airfoil,” Computer Methods in Applied Mechanics and
Engineering, vol. 191, pp. 2179-2189, 2002.
International Journal of Electrical Energy, Vol. 4, No. 1, March 2016
©2016 International Journal of Electrical Energy 40
Journal of Aircraft,

Nu Rhahida Arini received her bachelor and master degree from mechanical engineering
department at Intitut Teknologi Bandung in
Bandung, Indonesia. Her interest in fluid mechanics and energy conversion drives her
attention to focus her research on renewable energy. Currently she is taking PhD study on
tidal current turbine in University of
Southampton. She is a senior lecturer in electronic
engineering polytechnic institute of Surabaya, in Surabaya, Indonesia. She published some papers in renewable energy and control system.
International Journal of Electrical Energy, Vol. 4, No. 1, March 2016
©2016 International Journal of Electrical Energy 41