Innovative Natural-Gas Technologies for Efficiency Gain in ... Annual... · Innovative Natural-Gas...
18
Innovative Natural-Gas Technologies for Efficiency Gain in Reliable and Affordable Thermochemical Electricity- Generation DE-FOA-0001797 (INTEGRATE) Annual Meeting 17 September 2019 Atlanta, GA
Transcript of Innovative Natural-Gas Technologies for Efficiency Gain in ... Annual... · Innovative Natural-Gas...
Innovative Natural-Gas Technologies for Efficiency Gain in
Reliable and Affordable Thermochemical Electricity-
Generation
DE-FOA-0001797 (INTEGRATE)
Annual Meeting
17 September 2019
Atlanta, GA
Renewable Nuclear
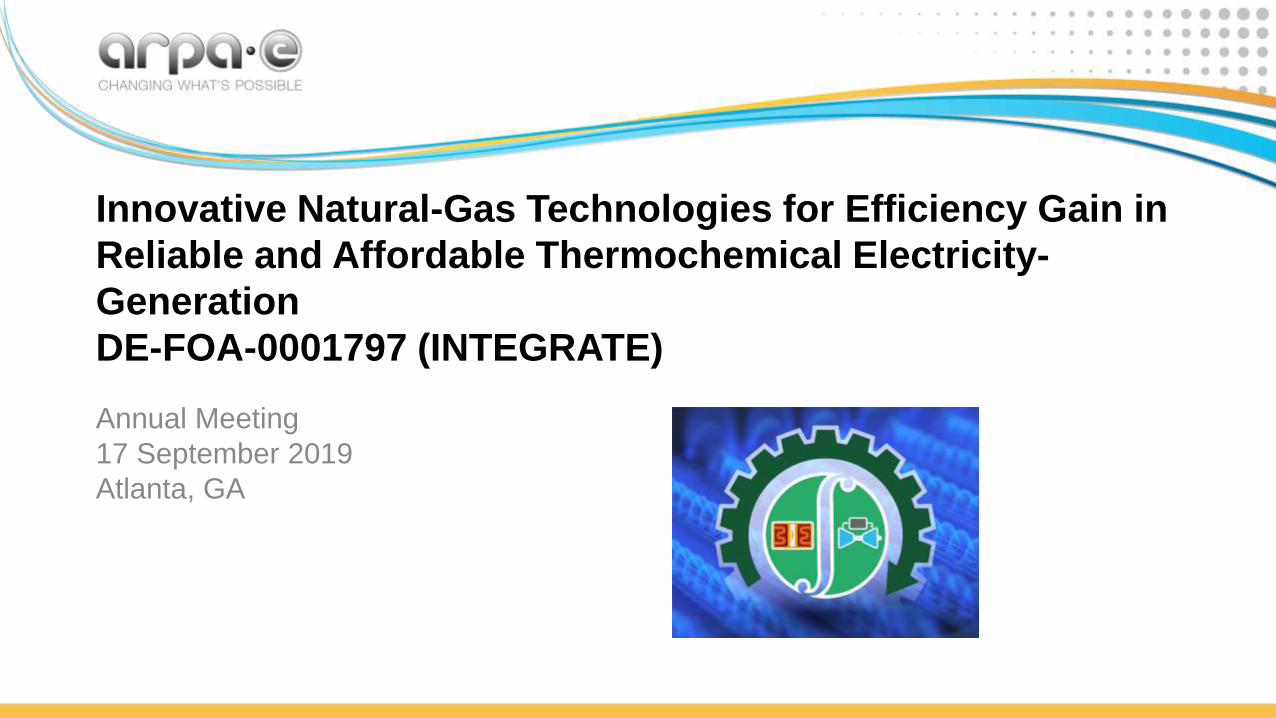
INTEGRATE Program Objective
Gen η T&D η Net η
36% 94% 34%36% 94% 34%
Fossil
Electric Efficiency 70%
Installed Price $1800/kW
Maintenance Cost $0.02/kWh
Market requirements for 1 Quad/yr
of primary energy savings for
commercial electricity*
Lower the cost & emissions associated with electricity generation
1
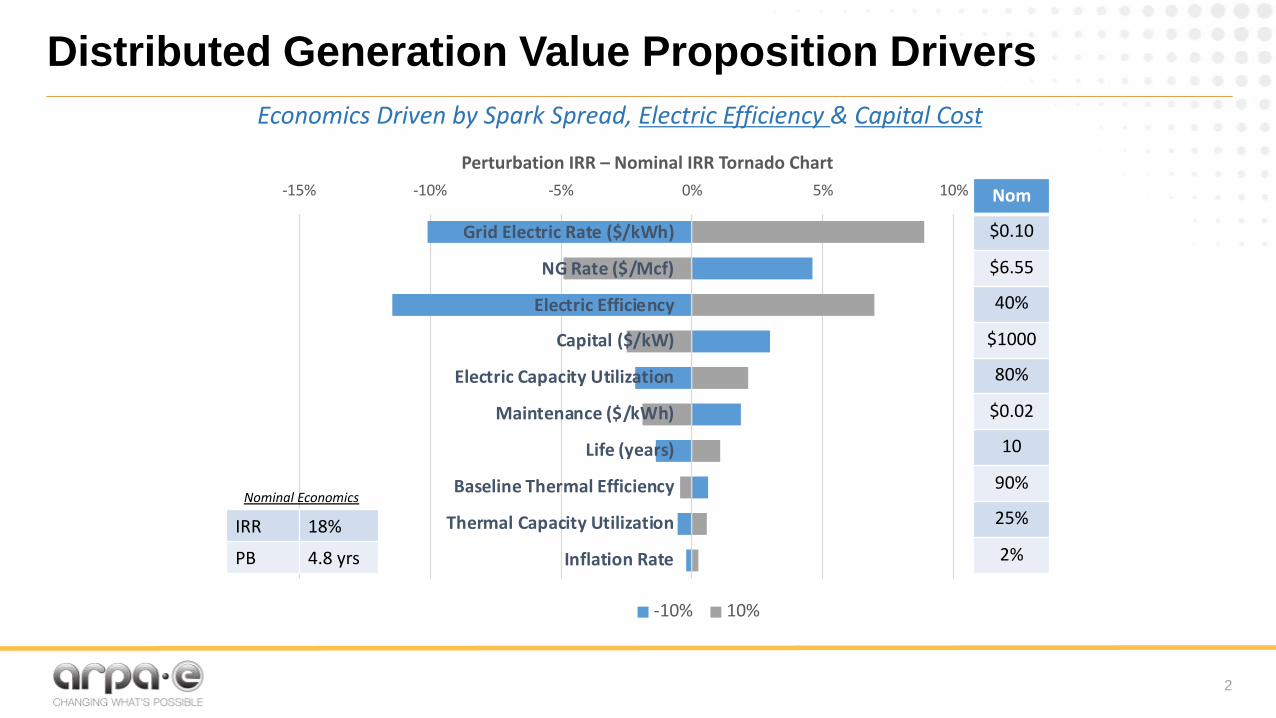
Distributed Generation Value Proposition Drivers
Economics Driven by Spark Spread, Electric Efficiency & Capital Cost
-15% -10% -5% 0% 5% 10%
Grid Electric Rate ($/kWh)
NG Rate ($/Mcf)
Electric Efficiency
Capital ($/kW)
Electric Capacity Utilization
Maintenance ($/kWh)
Life (years)
Baseline Thermal Efficiency
Thermal Capacity Utilization
Inflation Rate
Perturbation IRR – Nominal IRR Tornado Chart
-10% 10%
Nom
$0.10
$6.55
40%
$1000
80%
$0.02
10
90%
25%
2%
IRR 18%
PB 4.8 yrs
Nominal Economics
2
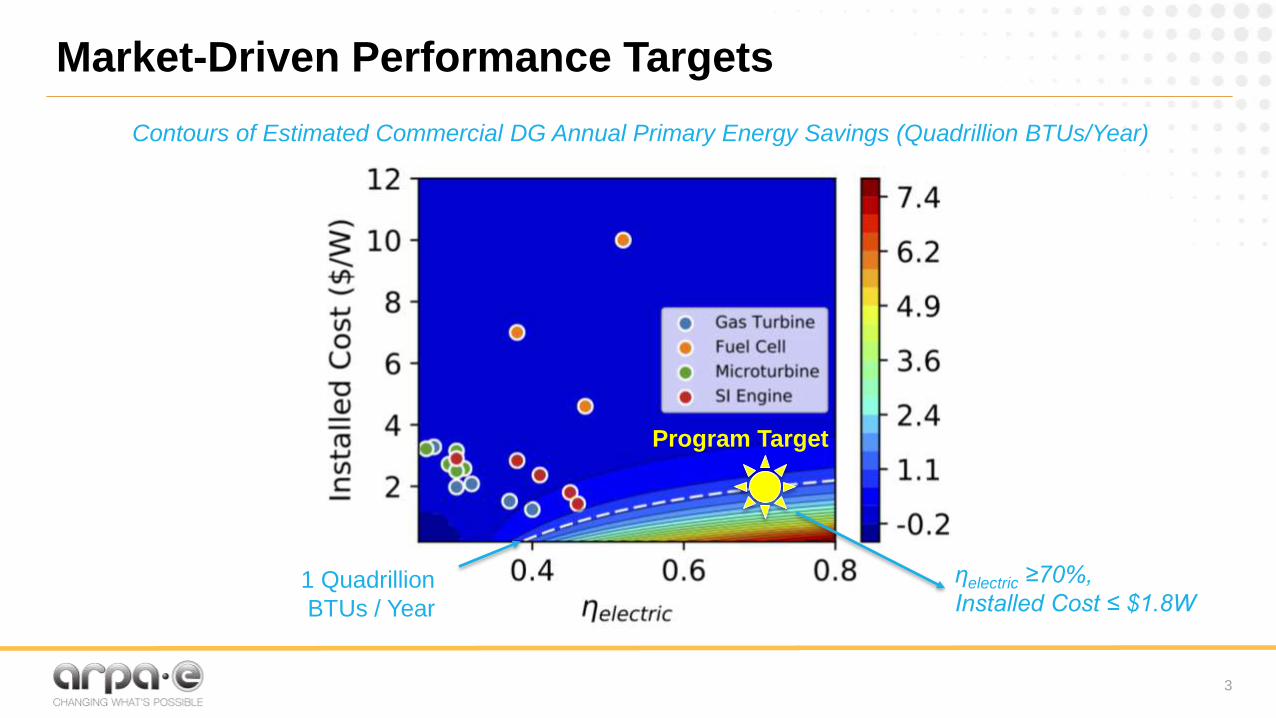
Market-Driven Performance Targets
Program Target
ηelectric ≥70%,
Installed Cost ≤ $1.8W
Contours of Estimated Commercial DG Annual Primary Energy Savings (Quadrillion BTUs/Year)
1 Quadrillion
BTUs / Year
3
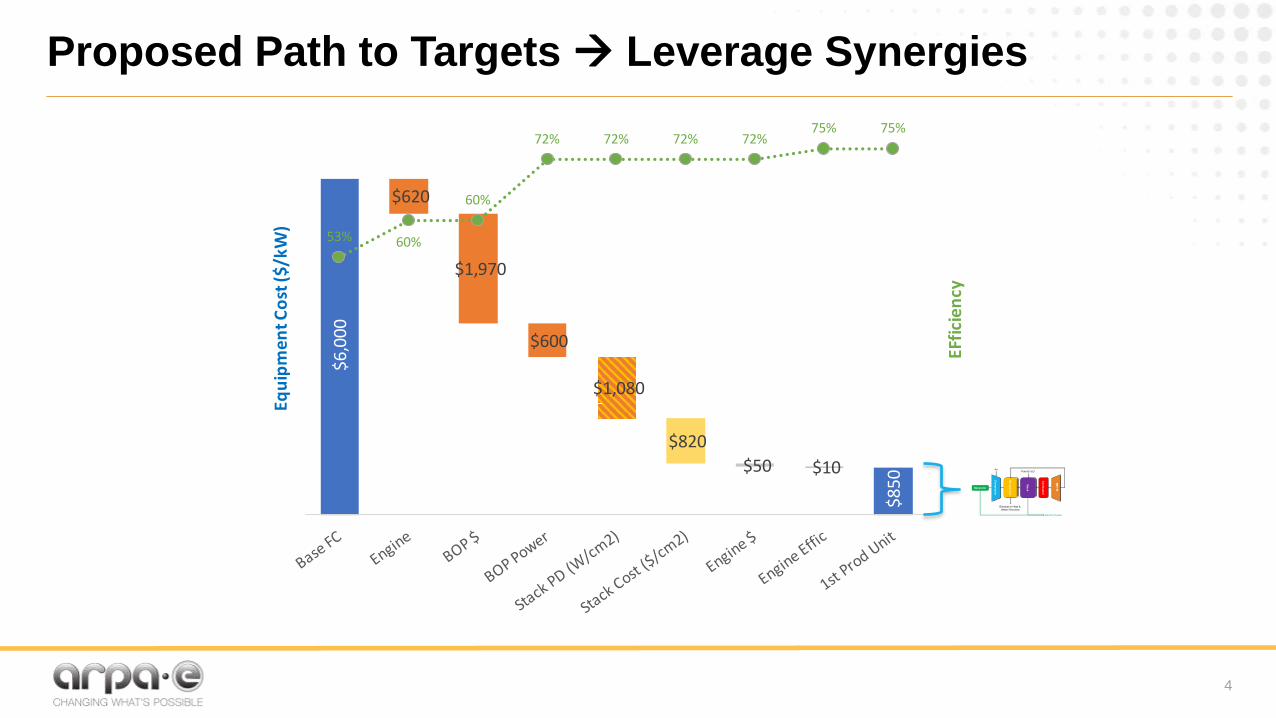
Proposed Path to Targets Leverage Synergies
Electric Power
Compressor
Combustor
Stack
AirFuel & H2O
Generator
Exhaust to Heat & Water Recovery
Recuperator
$6
,00
0
$8
50
$8
50
$620
$1,970
$600
$1,080
$820
$50 $10
53% 60%
60%
72% 72% 72% 72%75% 75%
0
0.1
0.2
0.3
0.4
0.5
0.6
0.7
0.8
$0
$1,000
$2,000
$3,000
$4,000
$5,000
$6,000
$7,000
EFf
icie
ncy
Eq
uip
me
nt
Co
st(
$/k
W)
4
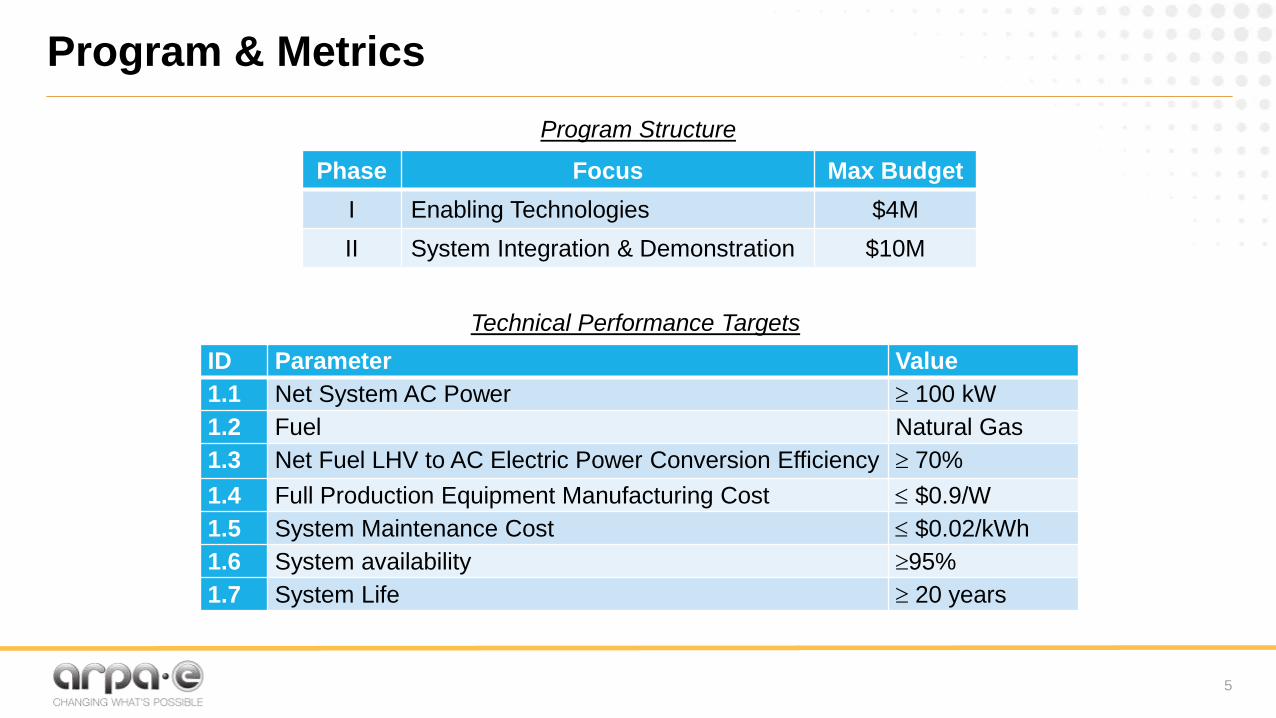
Program & Metrics
ID Parameter Value
1.1 Net System AC Power 100 kW
1.2 Fuel Natural Gas
1.3 Net Fuel LHV to AC Electric Power Conversion Efficiency 70%
1.4 Full Production Equipment Manufacturing Cost $0.9/W
1.5 System Maintenance Cost $0.02/kWh
1.6 System availability 95%
1.7 System Life 20 years
Phase Focus Max Budget
I Enabling Technologies $4M
II System Integration & Demonstration $10M
Technical Performance Targets
Program Structure
5
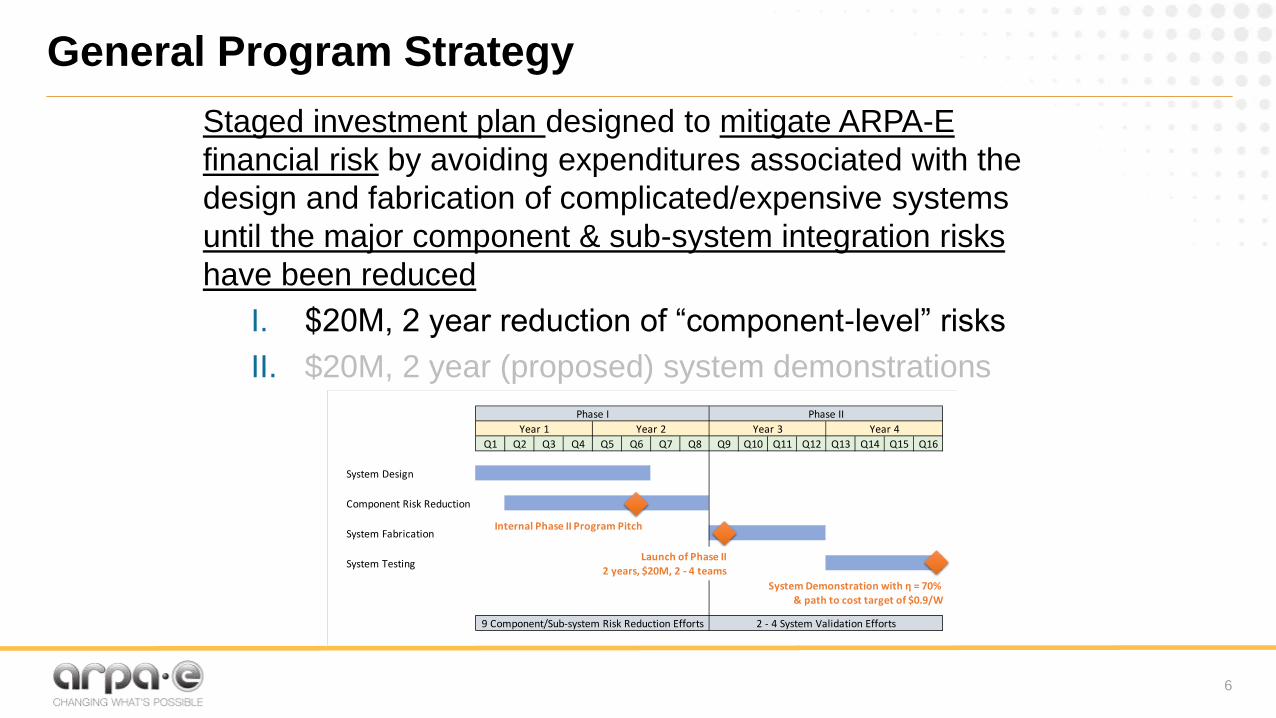
General Program Strategy
Staged investment plan designed to mitigate ARPA-E
financial risk by avoiding expenditures associated with the
design and fabrication of complicated/expensive systems
until the major component & sub-system integration risks
have been reduced
I. $20M, 2 year reduction of “component-level” risks
II. $20M, 2 year (proposed) system demonstrations
Q1 Q2 Q3 Q4 Q5 Q6 Q7 Q8 Q9 Q10 Q11 Q12 Q13 Q14 Q15 Q16
System Design
Component Risk Reduction
System Fabrication
System Testing
9 Component/Sub-system Risk Reduction Efforts 2 - 4 System Validation Efforts
Year 1 Year 2 Year 3 Year 4
Phase I Phase II
Internal Phase II Program Pitch
Launch of Phase II
2 years, $20M, 2 - 4 teams
System Demonstration with η = 70% & path to cost target of $0.9/W
6
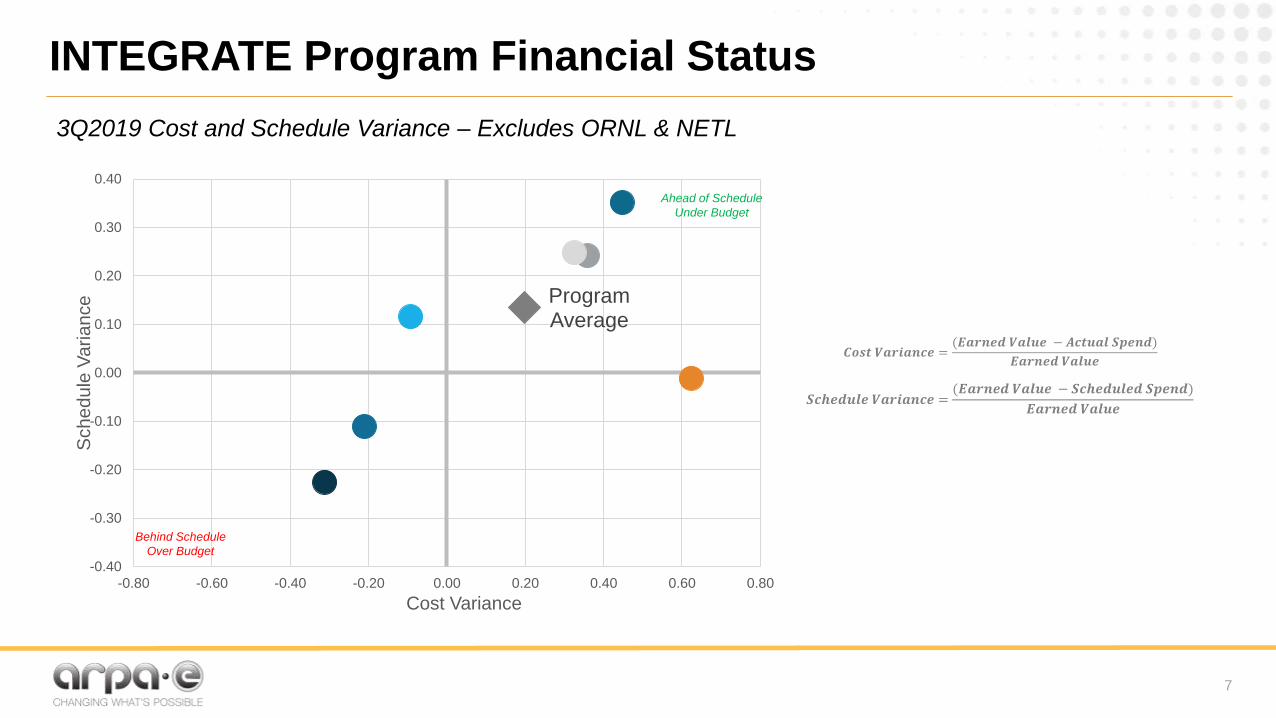
Program Average
-0.40
-0.30
-0.20
-0.10
0.00
0.10
0.20
0.30
0.40
-0.80 -0.60 -0.40 -0.20 0.00 0.20 0.40 0.60 0.80
Sch
ed
ule
Va
ria
nce
Cost Variance
Ahead of Schedule
Under Budget
Behind Schedule
Over Budget
INTEGRATE Program Financial Status
𝑪𝒐𝒔𝒕 𝑽𝒂𝒓𝒊𝒂𝒏𝒄𝒆 =(𝑬𝒂𝒓𝒏𝒆𝒅 𝑽𝒂𝒍𝒖𝒆 − 𝑨𝒄𝒕𝒖𝒂𝒍 𝑺𝒑𝒆𝒏𝒅)
𝑬𝒂𝒓𝒏𝒆𝒅 𝑽𝒂𝒍𝒖𝒆
𝑺𝒄𝒉𝒆𝒅𝒖𝒍𝒆 𝑽𝒂𝒓𝒊𝒂𝒏𝒄𝒆 =(𝑬𝒂𝒓𝒏𝒆𝒅 𝑽𝒂𝒍𝒖𝒆 − 𝑺𝒄𝒉𝒆𝒅𝒖𝒍𝒆𝒅 𝑺𝒑𝒆𝒏𝒅)
𝑬𝒂𝒓𝒏𝒆𝒅 𝑽𝒂𝒍𝒖𝒆
3Q2019 Cost and Schedule Variance – Excludes ORNL & NETL
7
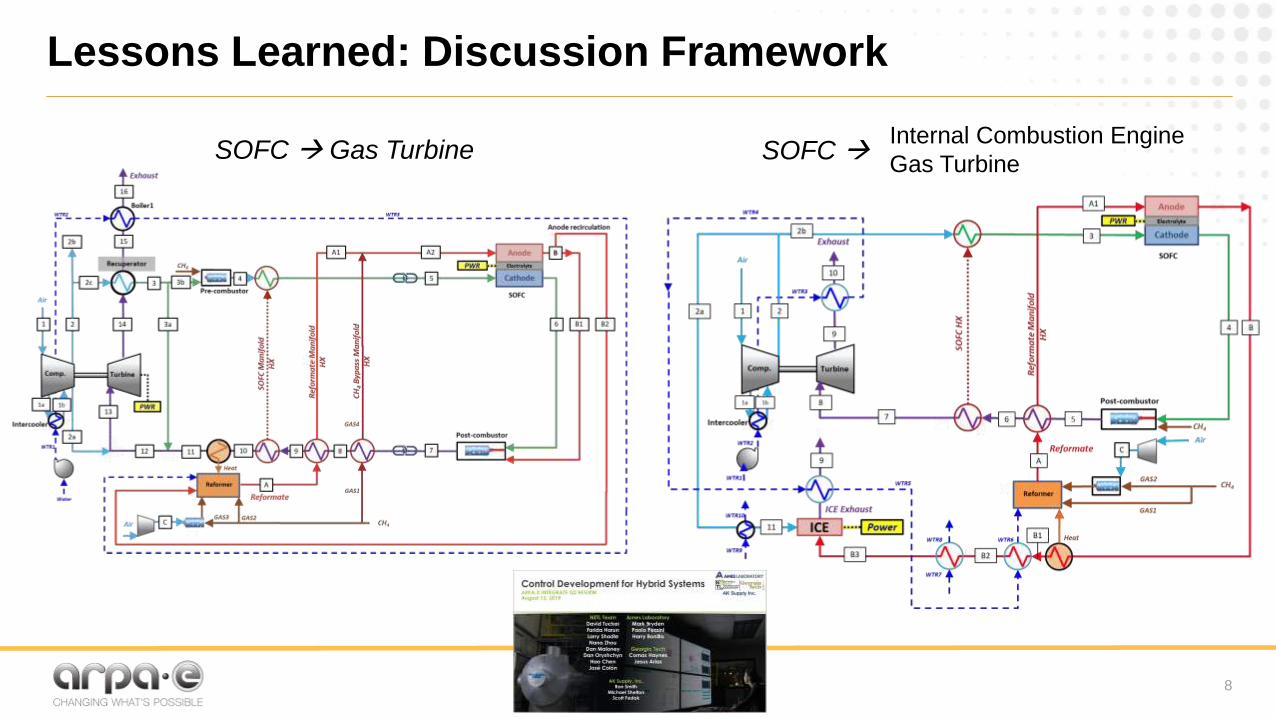
Lessons Learned: Discussion Framework
SOFC Gas Turbine SOFC Internal Combustion Engine
Gas Turbine
8
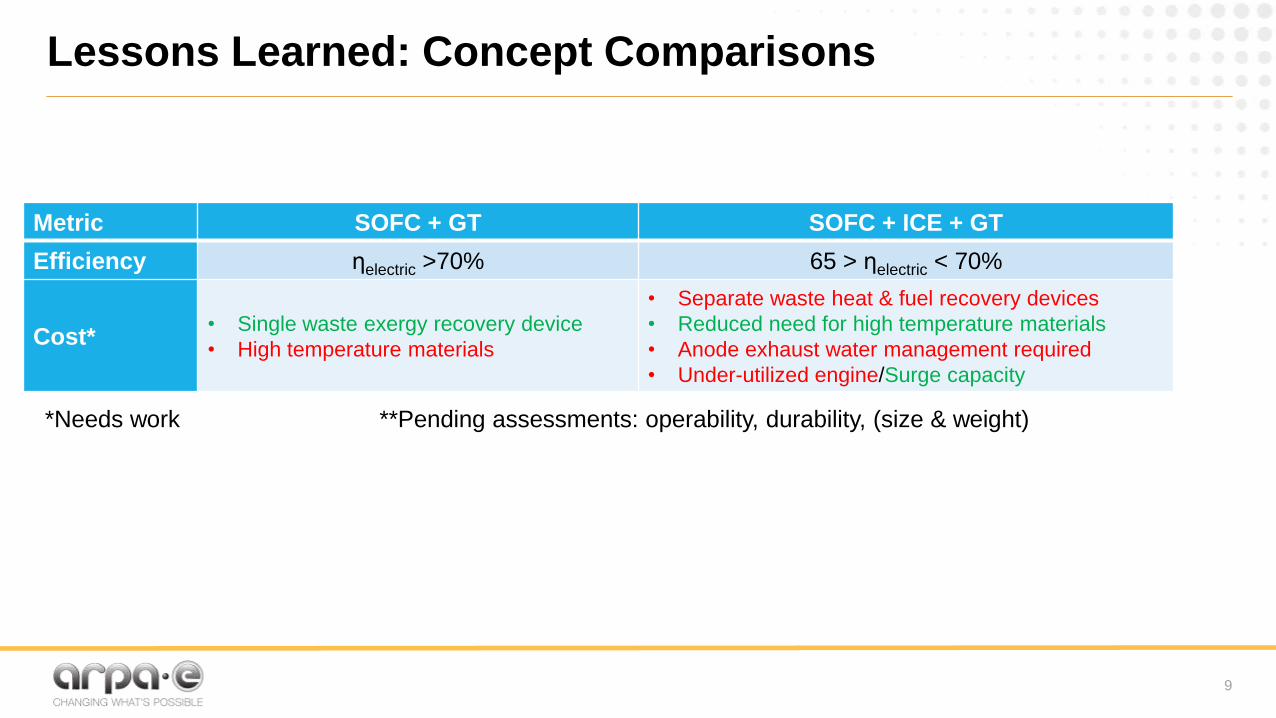
Lessons Learned: Concept Comparisons
Metric SOFC + GT SOFC + ICE + GT
Efficiency ηelectric >70% 65 > ηelectric < 70%
Cost*• Single waste exergy recovery device
• High temperature materials
• Separate waste heat & fuel recovery devices
• Reduced need for high temperature materials
• Anode exhaust water management required
• Under-utilized engine/Surge capacity
*Needs work **Pending assessments: operability, durability, (size & weight)
9
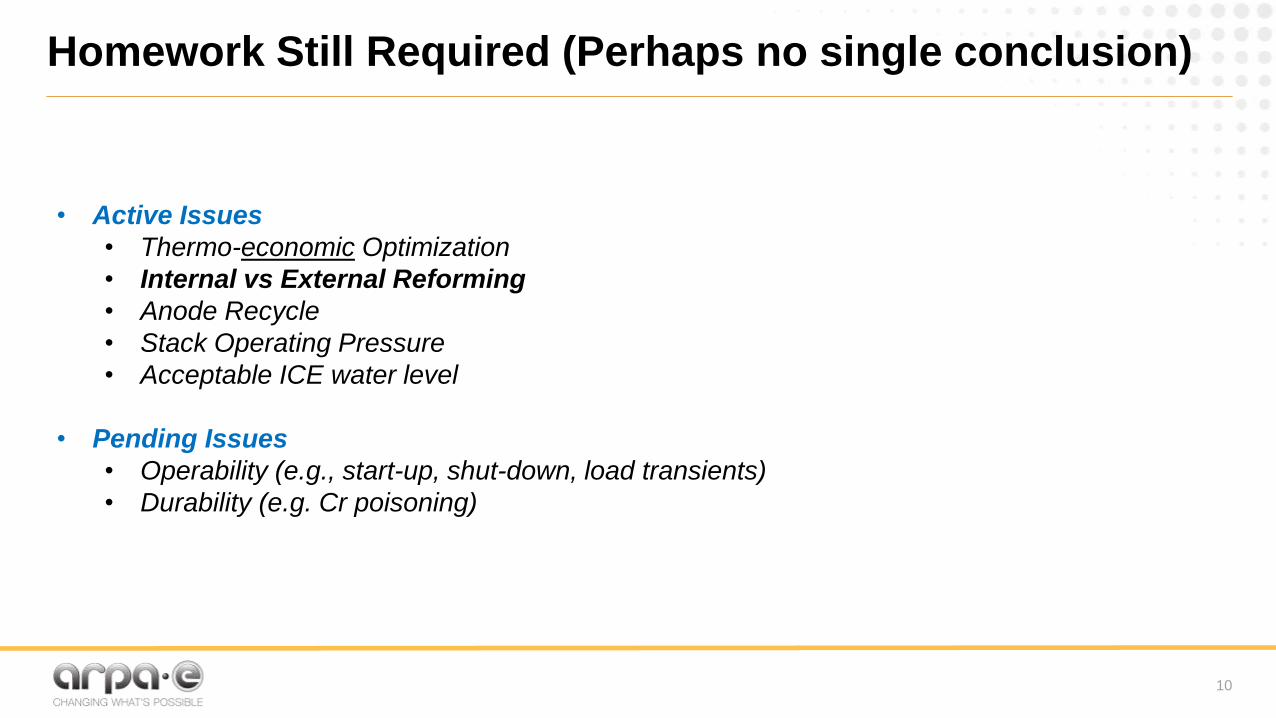
Homework Still Required (Perhaps no single conclusion)
• Active Issues
• Thermo-economic Optimization
• Internal vs External Reforming
• Anode Recycle
• Stack Operating Pressure
• Acceptable ICE water level
• Pending Issues
• Operability (e.g., start-up, shut-down, load transients)
• Durability (e.g. Cr poisoning)
10
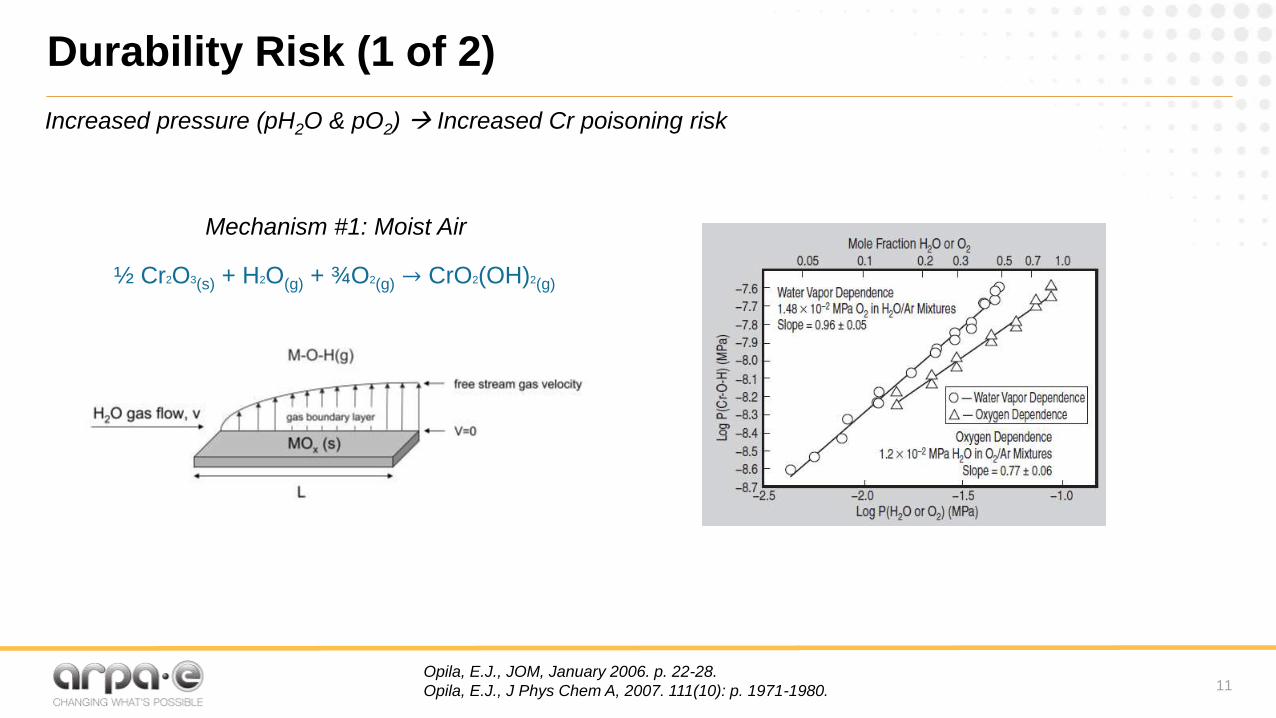
Durability Risk (1 of 2)
Increased pressure (pH2O & pO2) Increased Cr poisoning risk
½ Cr2O3(s) + H2O(g) + ¾O2(g) → CrO2(OH)2(g)
Opila, E.J., JOM, January 2006. p. 22-28.
Opila, E.J., J Phys Chem A, 2007. 111(10): p. 1971-1980.
Mechanism #1: Moist Air
11
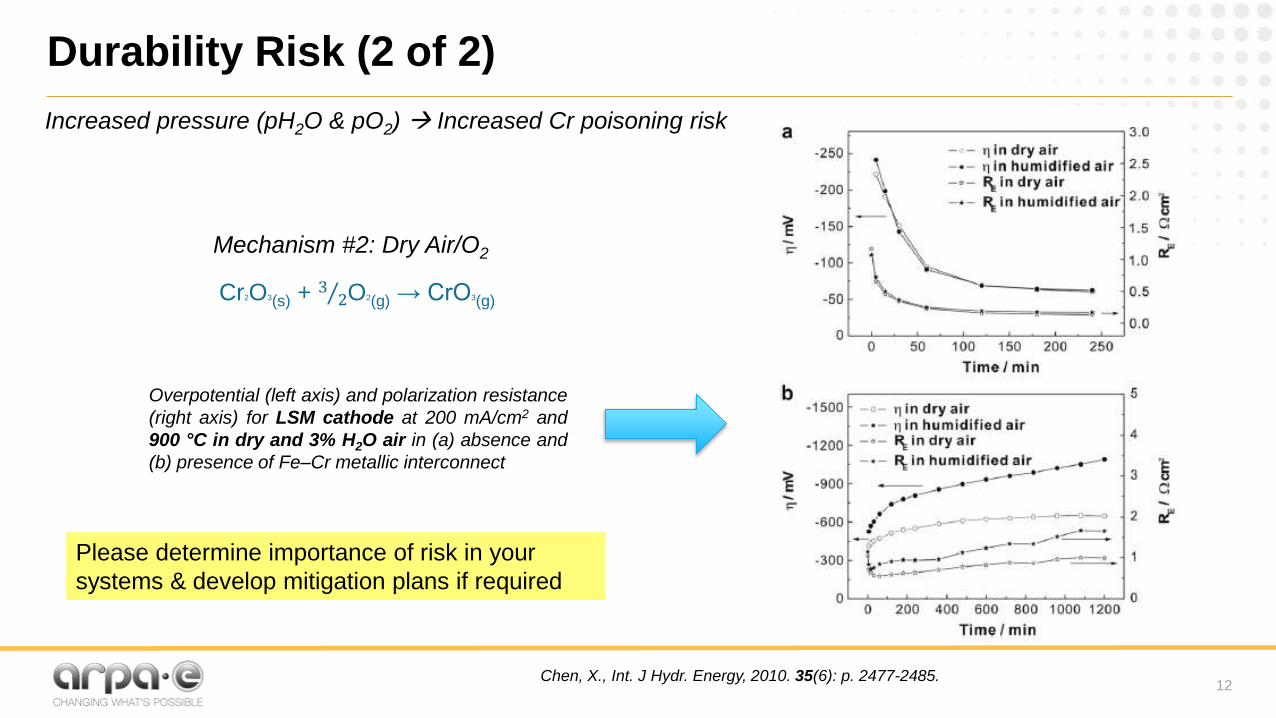
Durability Risk (2 of 2)
Increased pressure (pH2O & pO2) Increased Cr poisoning risk
Cr2O3(s) + 3 2O2(g) → CrO3(g)
Mechanism #2: Dry Air/O2
Chen, X., Int. J Hydr. Energy, 2010. 35(6): p. 2477-2485.
Overpotential (left axis) and polarization resistance
(right axis) for LSM cathode at 200 mA/cm2 and
900 °C in dry and 3% H2O air in (a) absence and
(b) presence of Fe–Cr metallic interconnect
Please determine importance of risk in your
systems & develop mitigation plans if required
12
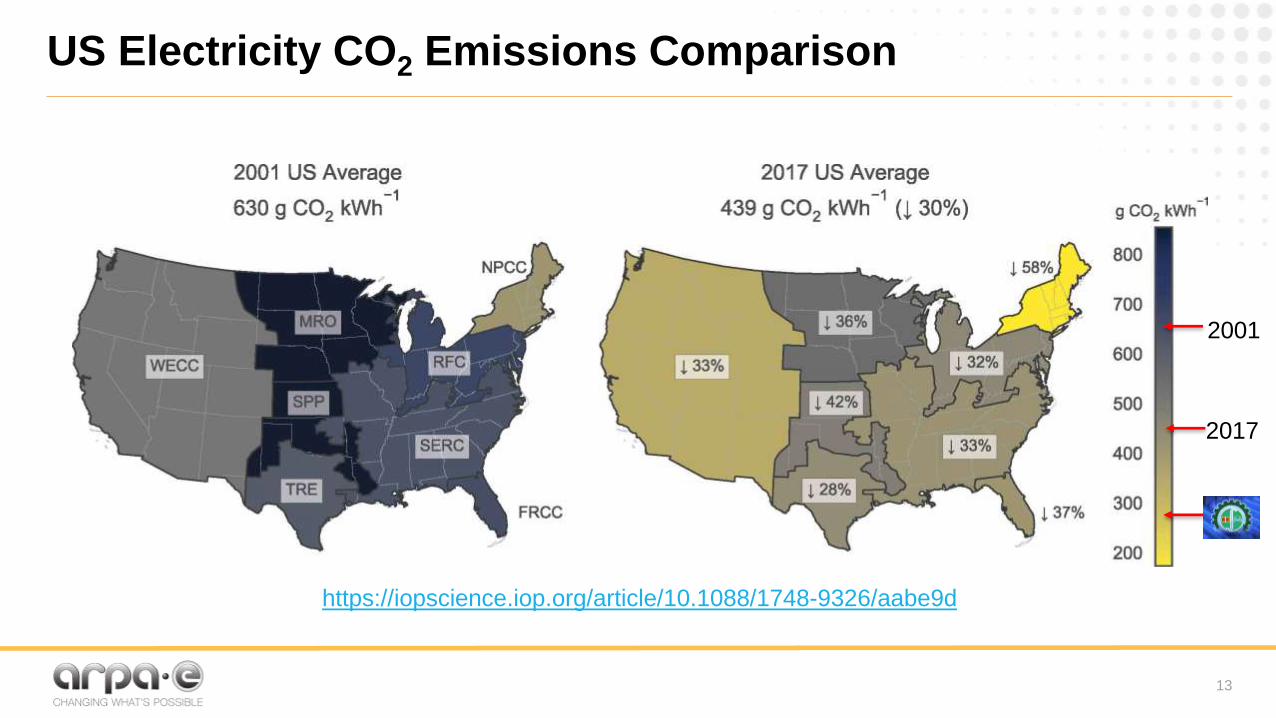
US Electricity CO2 Emissions Comparison
https://iopscience.iop.org/article/10.1088/1748-9326/aabe9d
2017
2001
13
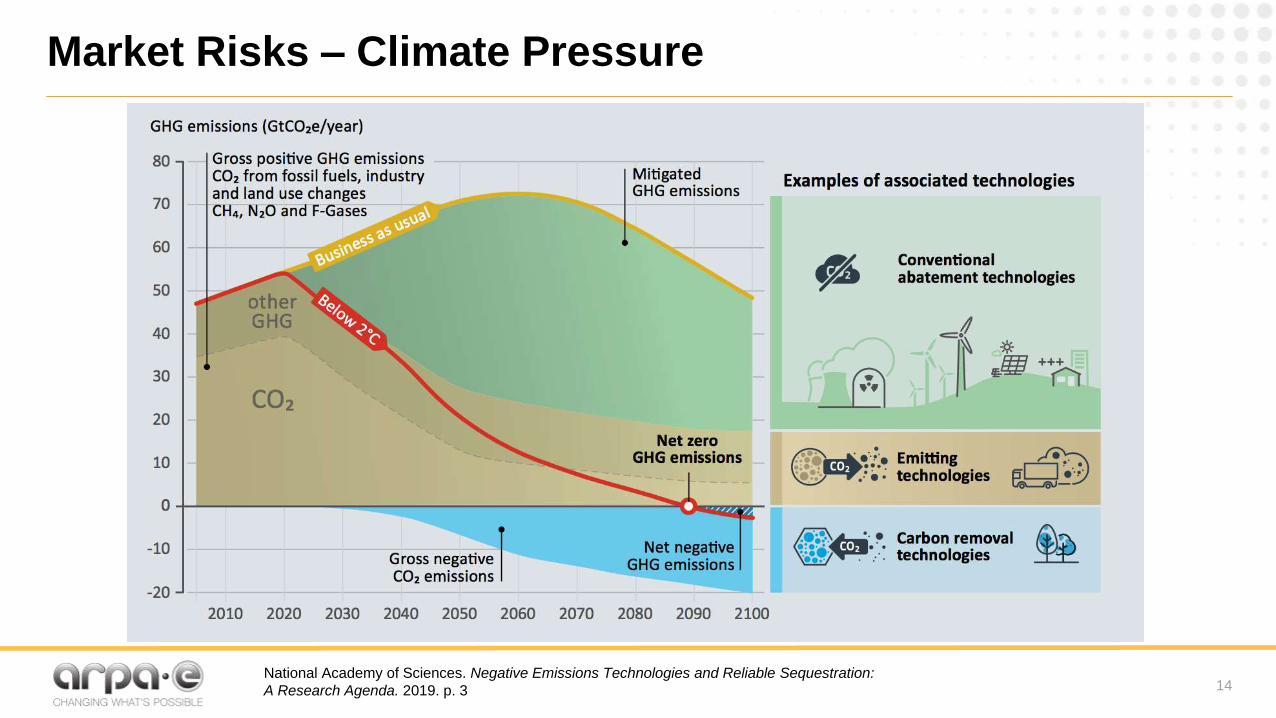
Market Risks – Climate Pressure
National Academy of Sciences. Negative Emissions Technologies and Reliable Sequestration:
A Research Agenda. 2019. p. 3 14
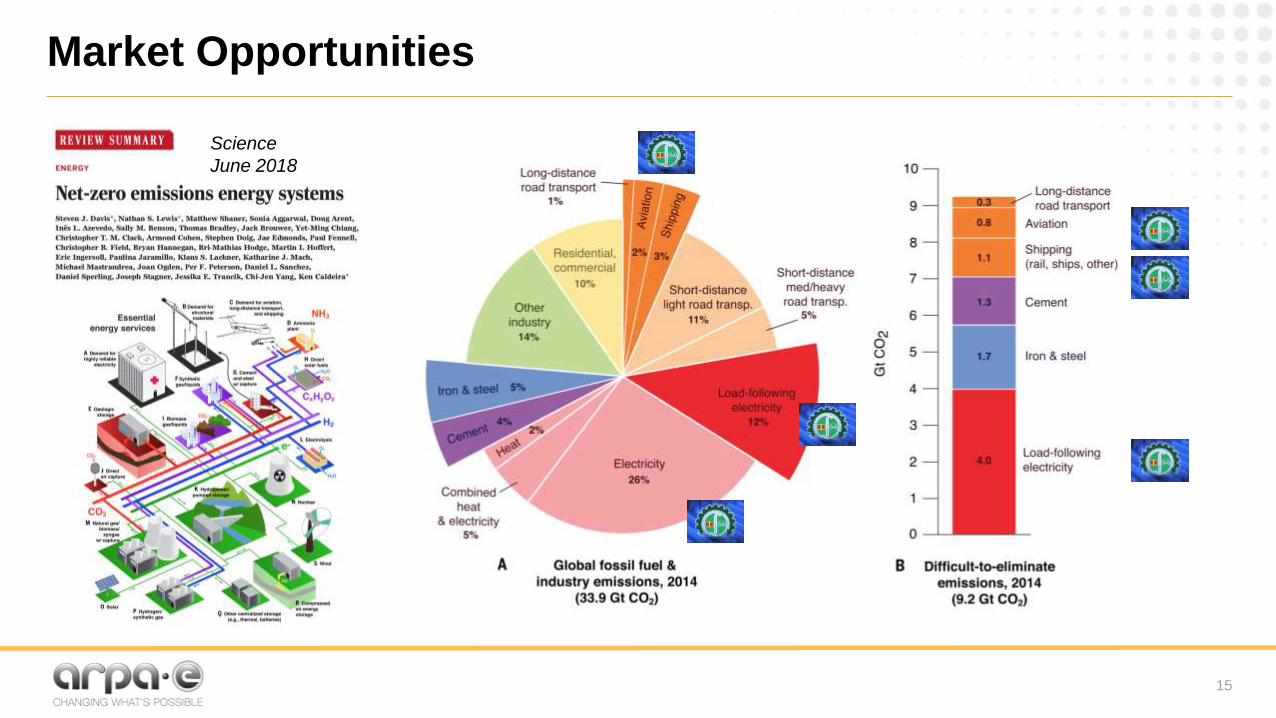
Market Opportunities
Science
June 2018
15
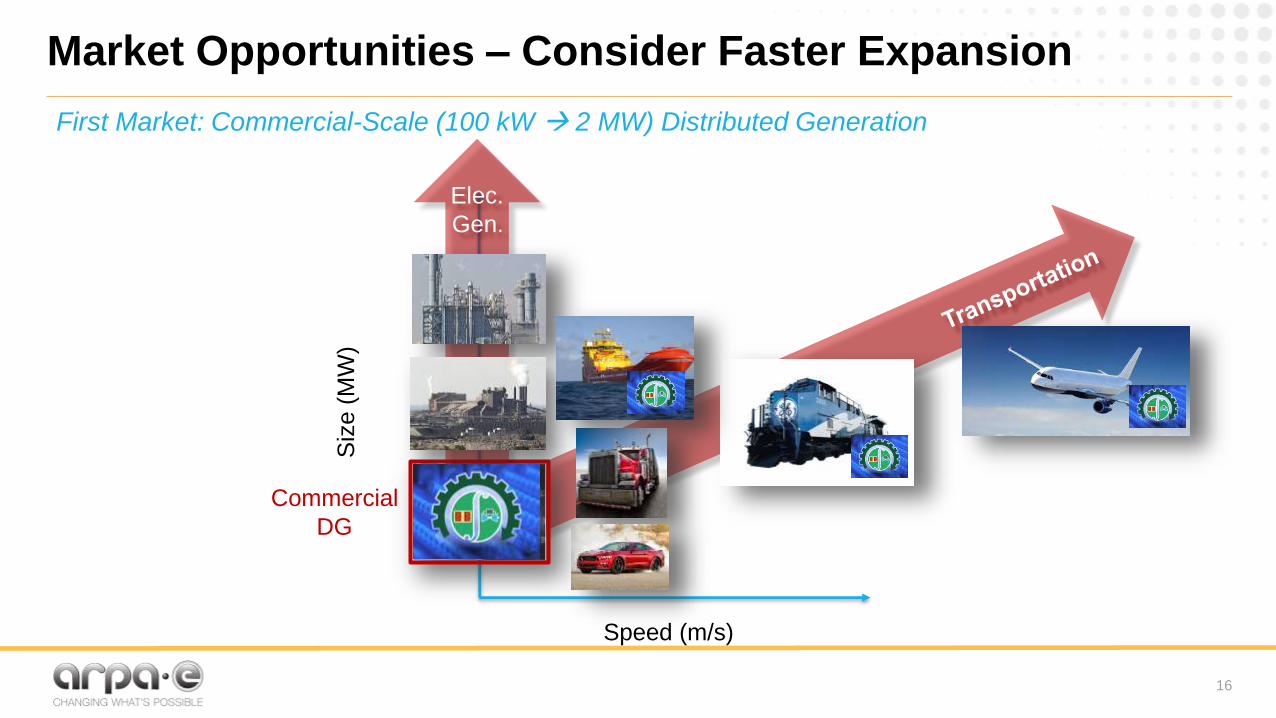
Market Opportunities – Consider Faster Expansion
Siz
e (
MW
)
Speed (m/s)
Commercial
DG
First Market: Commercial-Scale (100 kW 2 MW) Distributed Generation
Elec.
Gen.
16

17