INDICATOR RESULTS FACTSHEET -...
16
April 2009 1 INDICATOR RESULTS FACTSHEET ΤRΑ14: MOBILITY FEATURES IN EGNATIA MOTORWAY DEFINITION - OBJECTIVE RESULTS – ASSESSMENT The indicator is currently assessed focusing on the study of the origin – destination of vehicles on the axis of the Egnatia Motorway. The primary information concern the year 2006 and is provided by model elaborated with the use of VISUM software by the Traffic Department- Operation and Maintenance Division of “Egnatia Odos SA”. For comparison reasons, additional information has been used, provided by the National Origin- Destination Survey (O & D Survey) for the year 1993. The information studied concern only the counties crossed by the Egnatia Motorway and in particular those for which valid data for both years of reference (1993 and 2006) are available. Respectively, the references at a regional and prefectural level concern only the selected counties. In 2006, the part of the Egnatia Motorway from Thessaloniki to Grevena had been completed, while parts of the motorway had also been completed in the prefectures of Ioannina and Igoumenitsa. On the route Thessaloniki – Kipi the Egnatia Motorway was fully operational, with the exception of three parts: a) A part over the lake of Volvi, from Vayohori IC to Redina IC, b) the “inland alignment” of Kavala Prefecture, from Strymonas IC to Agios Andreas IC and c) a part out of Xanthi, from Hrysoupoli IC to West Xanthi IC. The counties crossed by the Egnatia Motorway, for which valid information is available, form 48 origin – destination pairs. The total number of movements between them has been estimated to reach approximately 98,000, while for the same areas of O & D Research for 1993, the number reached 45,000. In other words, the number of movements has overdoubled (an increase of 116%). The indicator assesses the following features of movements on the Egnatia motorway: a) origin – destination, b) purpose, c) frequency and d) time of journey. The impacts on the movements’ features imposed by the motorway are relative to the changes as regards the mobility, the elongation of journeys and the functional interconnection between areas served by the motorway.
Transcript of INDICATOR RESULTS FACTSHEET -...
April 2009
1
INDICATOR RESULTS FACTSHEET
ΤRΑ14: MOBILITY FEATURES IN EGNATIA MOTORWAY
DEFINITION - OBJECTIVE
RESULTS – ASSESSMENT
The indicator is currently assessed focusing on the study of the origin – destination of vehicles on the axis of the Egnatia Motorway. The primary information concern the year 2006 and is provided by model elaborated with the use of VISUM software by the Traffic Department- Operation and Maintenance Division of “Egnatia Odos SA”. For comparison reasons, additional information has been used, provided by the National Origin- Destination Survey (O & D Survey) for the year 1993.
The information studied concern only the counties crossed by the Egnatia Motorway and in particular those for which valid data for both years of reference (1993 and 2006) are available. Respectively, the references at a regional and prefectural level concern only the selected counties. In 2006, the part of the Egnatia Motorway from Thessaloniki to Grevena had been completed, while parts of the motorway had also been completed in the prefectures of Ioannina and Igoumenitsa. On the route Thessaloniki – Kipi the Egnatia Motorway was fully operational, with the exception of three parts: a) A part over the lake of Volvi, from Vayohori IC to Redina IC, b) the “inland alignment” of Kavala Prefecture, from Strymonas IC to Agios Andreas IC and c) a part out of Xanthi, from Hrysoupoli IC to West Xanthi IC.
The counties crossed by the Egnatia Motorway, for which valid information is available, form 48 origin – destination pairs. The total number of movements between them has been estimated to reach approximately 98,000, while for the same areas of O & D Research for 1993, the number reached 45,000. In other words, the number of movements has overdoubled (an increase of 116%).
The indicator assesses the following features of movements on the Egnatia motorway: a) origin – destination, b) purpose, c) frequency and d) time of journey. The impacts on the movements’ features imposed by the motorway are relative to the changes as regards the mobility, the elongation of journeys and the functional interconnection between areas served by the motorway.
RESULTS FACTSHEET TRA14: MOBILITY FEATURES IN EGNATIA MOTORWAY
April 2009
2
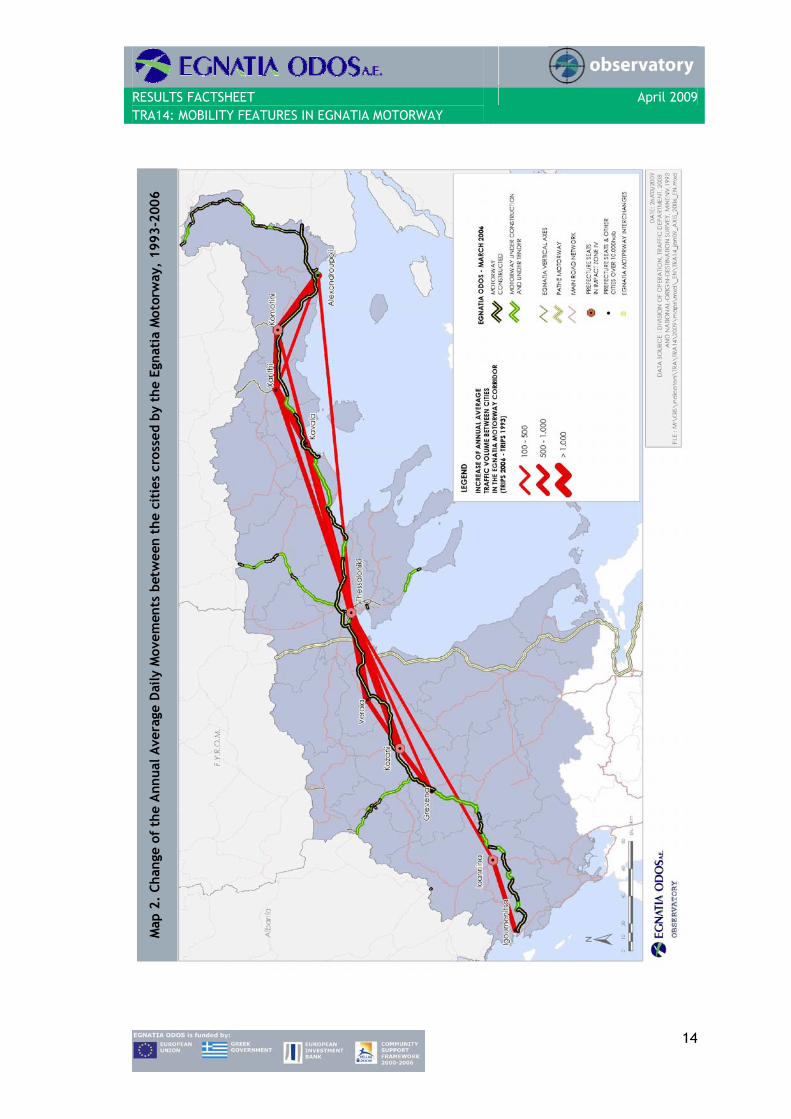
When examining the change in absolute values, we observe that the biggest increase in movements occurs in the area between Thessaloniki and Lagadas. The average daily movements between Thessaloniki and Lagadas have been increased from 11,000 to approximately 27,000. High increase in the annual average daily movements in absolute values ranging from 5,000 to 7,000 is observed in between the counties of Kavala – Paggeo and Kavala – Nestos. These are followed by the movements between Thessaloniki and Imathia, where there is an increase of 2,500 annual average daily movements. However, by examining the percentage changes, the highest increase (exceeding 160%) has been observed on the eastern and western section of the Egnatia Motorway, in counties where the motorway was fully or almost operational in 2006 (Paggeo - Kavala, Kavala - Chryroupoli, Chrysoupoli - Xanthi, Komotini - Alexandroupoli, Igoumenitsa - Paramythia).
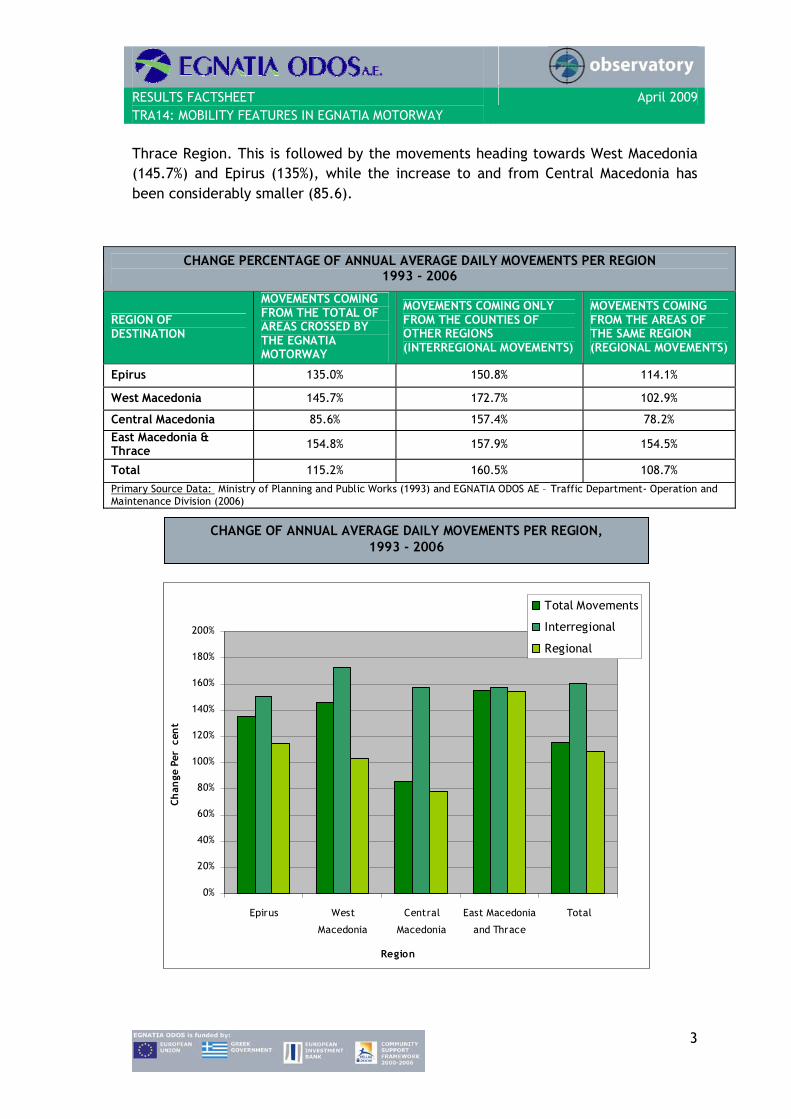
By examining interregional movements, (meaning the movements from one region to another exclusively for the counties crossed by the motorway axis), with the exception of the movements between East Macedonia and Epirus, (for which we are not able to draw reliable conclusions), we observed an increase in the absolute values in all pairs of Regions. The total of interregional movements has been increased by 160%, surpassing the number of 12,000 in absolute values. In 1993, most movements between regions have been observed between Central Macedonia and East Macedonia and Thrace, which consist 55.6% of the total of annual average daily movements between regions. These were followed by the movements between Central and West Macedonia (39.3%). In 2006, all movements between regions overdoubled. Indicatively we mention the movements between Central Macedonia and West Macedonia, which overdoubled (176.7% increase), due to the full operation of the Egnatia Motorway all along the route Thessaloniki- Grevena.
ANNUAL AVERAGE DAILY MOVEMENTS BETWEEN REGIONS, 1993 and 2006
As a percentage of the total PAIRS OF REGIONS
1993 2006
Change in the absolute number of movements
1993-2006
Central Macedonia – East Macedonia & Thrace 55.6% 53.0% 148.5%
Central Macedonia – West Macedonia 39.3% 41.8% 176.7%
Central Macedonia - Epirus 4.7% 4.3% 134.5%
West Macedonia - Epirus 0.4% 1.0% 544.4%
Total 100% 100% 160.5% Primary Source Data: Ministry of Planning and Public Works (1993) and EGNATIA ODOS AE – Traffic Department- Operation and Maintenance Division (2006)
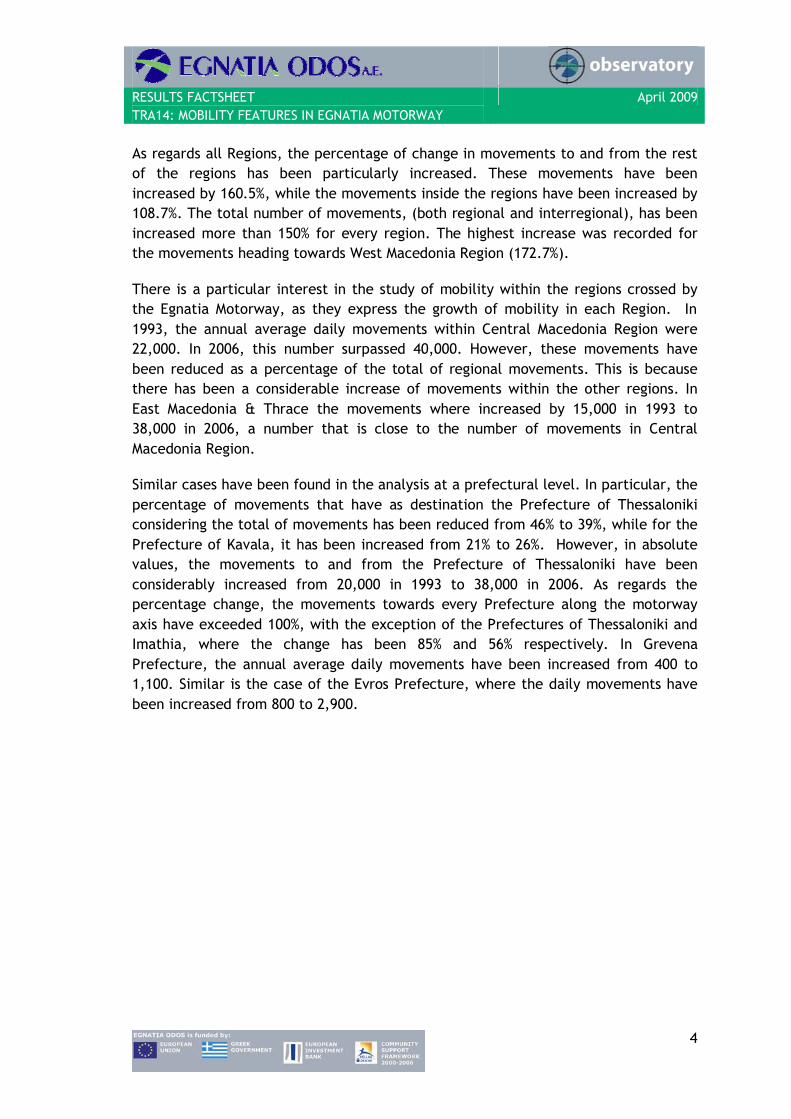
The following table presents in detail the movements between all regions crossed by the Egnatia Motorway, including the areas within the region in question (meaning the movements inside the regions themselves). The total of interregional movements has been considerably increased, surpassing 150%, which is observed in East Macedonia &
RESULTS FACTSHEET TRA14: MOBILITY FEATURES IN EGNATIA MOTORWAY
April 2009
3
Thrace Region. This is followed by the movements heading towards West Macedonia (145.7%) and Epirus (135%), while the increase to and from Central Macedonia has been considerably smaller (85.6).
CHANGE PERCENTAGE OF ANNUAL AVERAGE DAILY MOVEMENTS PER REGION 1993 - 2006
REGION OF DESTINATION
MOVEMENTS COMING FROM THE TOTAL OF AREAS CROSSED BY THE EGNATIA MOTORWAY
MOVEMENTS COMING ONLY FROM THE COUNTIES OF OTHER REGIONS (INTERREGIONAL MOVEMENTS)
MOVEMENTS COMING FROM THE AREAS OF THE SAME REGION (REGIONAL MOVEMENTS)
Epirus 135.0% 150.8% 114.1%
West Macedonia 145.7% 172.7% 102.9%
Central Macedonia 85.6% 157.4% 78.2% East Macedonia & Thrace 154.8% 157.9% 154.5%
Total 115.2% 160.5% 108.7% Primary Source Data: Ministry of Planning and Public Works (1993) and EGNATIA ODOS AE – Traffic Department- Operation and Maintenance Division (2006)
CHANGE OF ANNUAL AVERAGE DAILY MOVEMENTS PER REGION, 1993 - 2006
0%
20%
40%
60%
80%
100%
120%
140%
160%
180%
200%
Epirus West
Macedonia
Central
Macedonia
East Macedonia
and Thrace
Total
Region
Chan
ge P
er c
ent
Total Movements
Interregional
Regional
RESULTS FACTSHEET TRA14: MOBILITY FEATURES IN EGNATIA MOTORWAY
April 2009
4
As regards all Regions, the percentage of change in movements to and from the rest of the regions has been particularly increased. These movements have been increased by 160.5%, while the movements inside the regions have been increased by 108.7%. The total number of movements, (both regional and interregional), has been increased more than 150% for every region. The highest increase was recorded for the movements heading towards West Macedonia Region (172.7%).
There is a particular interest in the study of mobility within the regions crossed by the Egnatia Motorway, as they express the growth of mobility in each Region. In 1993, the annual average daily movements within Central Macedonia Region were 22,000. In 2006, this number surpassed 40,000. However, these movements have been reduced as a percentage of the total of regional movements. This is because there has been a considerable increase of movements within the other regions. In East Macedonia & Thrace the movements where increased by 15,000 in 1993 to 38,000 in 2006, a number that is close to the number of movements in Central Macedonia Region.
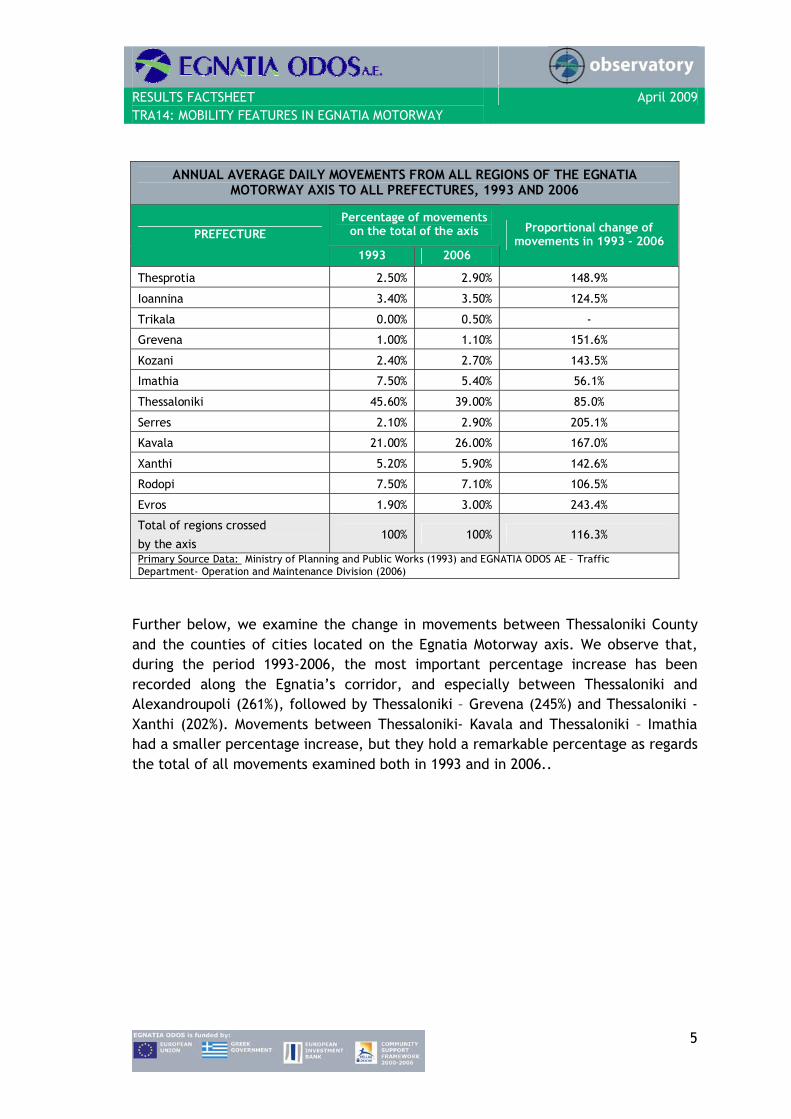
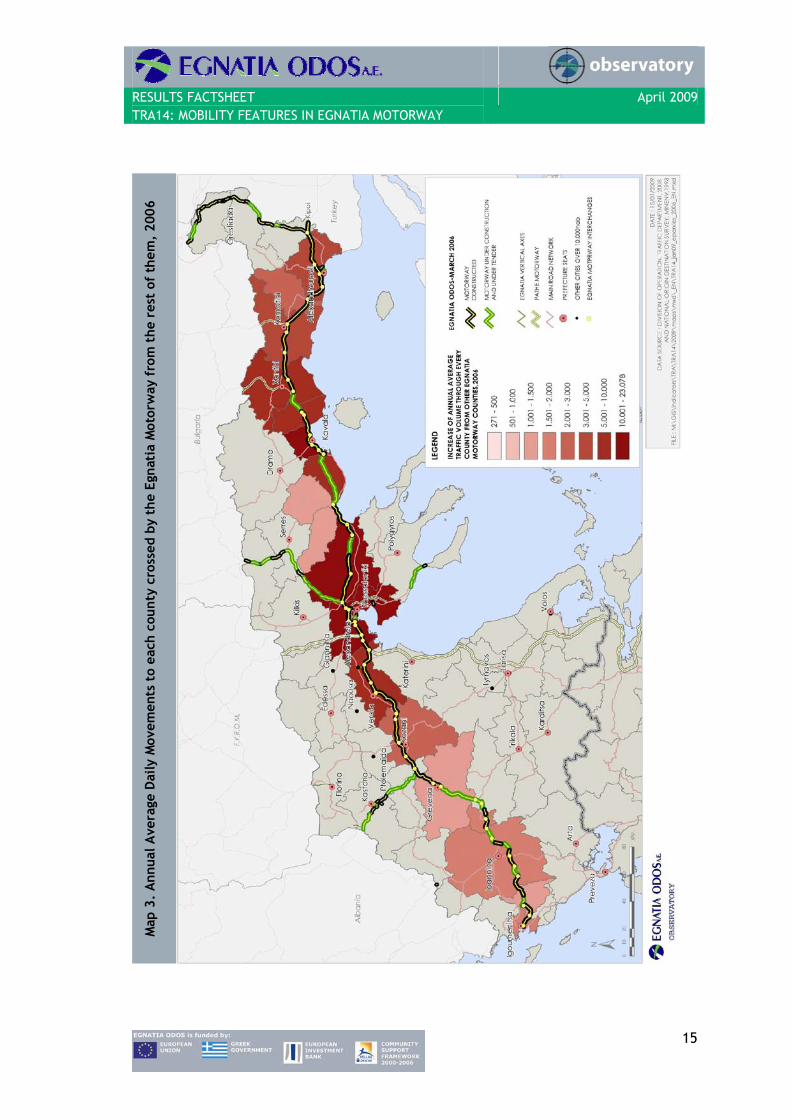
Similar cases have been found in the analysis at a prefectural level. In particular, the percentage of movements that have as destination the Prefecture of Thessaloniki considering the total of movements has been reduced from 46% to 39%, while for the Prefecture of Kavala, it has been increased from 21% to 26%. However, in absolute values, the movements to and from the Prefecture of Thessaloniki have been considerably increased from 20,000 in 1993 to 38,000 in 2006. As regards the percentage change, the movements towards every Prefecture along the motorway axis have exceeded 100%, with the exception of the Prefectures of Thessaloniki and Imathia, where the change has been 85% and 56% respectively. In Grevena Prefecture, the annual average daily movements have been increased from 400 to 1,100. Similar is the case of the Evros Prefecture, where the daily movements have been increased from 800 to 2,900.
RESULTS FACTSHEET TRA14: MOBILITY FEATURES IN EGNATIA MOTORWAY
April 2009
5
ANNUAL AVERAGE DAILY MOVEMENTS FROM ALL REGIONS OF THE EGNATIA
MOTORWAY AXIS TO ALL PREFECTURES, 1993 AND 2006
Percentage of movements on the total of the axis PREFECTURE
1993 2006
Proportional change of movements in 1993 - 2006
Thesprotia 2.50% 2.90% 148.9%
Ioannina 3.40% 3.50% 124.5%
Trikala 0.00% 0.50% -
Grevena 1.00% 1.10% 151.6%
Kozani 2.40% 2.70% 143.5%
Imathia 7.50% 5.40% 56.1%
Thessaloniki 45.60% 39.00% 85.0%
Serres 2.10% 2.90% 205.1%
Kavala 21.00% 26.00% 167.0%
Xanthi 5.20% 5.90% 142.6%
Rodopi 7.50% 7.10% 106.5%
Evros 1.90% 3.00% 243.4%
Total of regions crossed
by the axis 100% 100% 116.3%
Primary Source Data: Ministry of Planning and Public Works (1993) and EGNATIA ODOS AE – Traffic Department- Operation and Maintenance Division (2006)
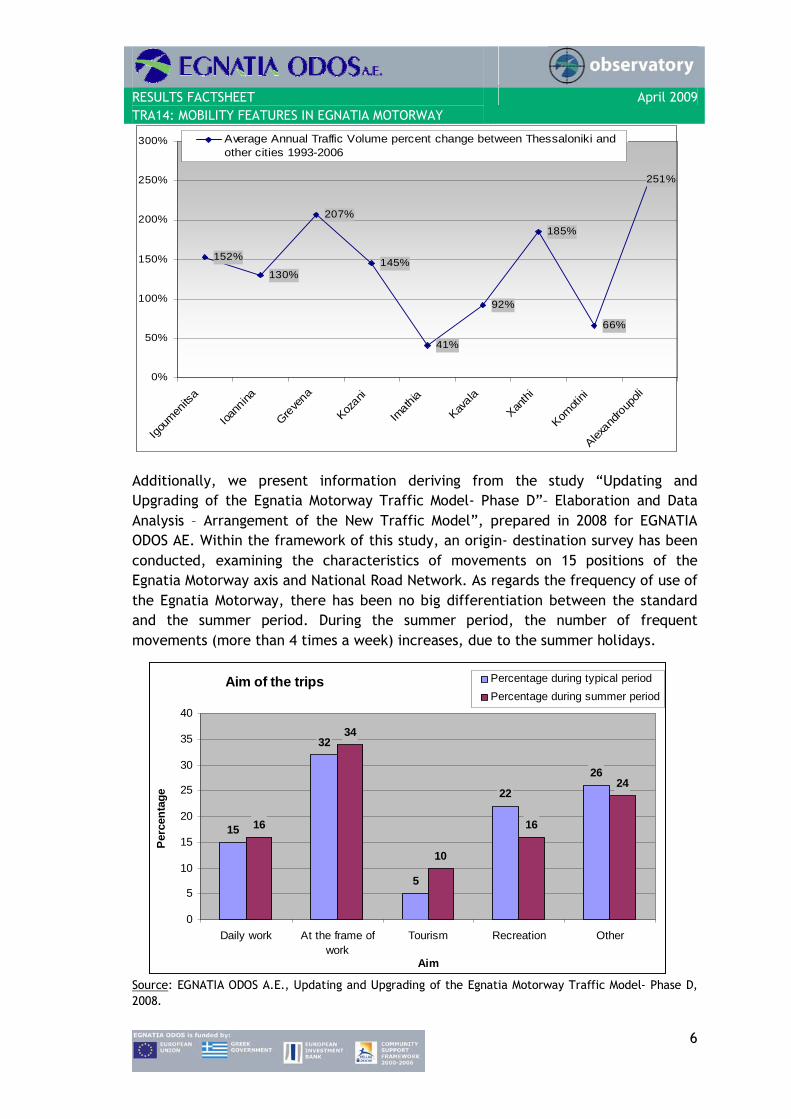
Further below, we examine the change in movements between Thessaloniki County and the counties of cities located on the Egnatia Motorway axis. We observe that, during the period 1993-2006, the most important percentage increase has been recorded along the Egnatia’s corridor, and especially between Thessaloniki and Alexandroupoli (261%), followed by Thessaloniki – Grevena (245%) and Thessaloniki - Xanthi (202%). Movements between Thessaloniki- Kavala and Thessaloniki – Imathia had a smaller percentage increase, but they hold a remarkable percentage as regards the total of all movements examined both in 1993 and in 2006..
RESULTS FACTSHEET TRA14: MOBILITY FEATURES IN EGNATIA MOTORWAY
April 2009
6
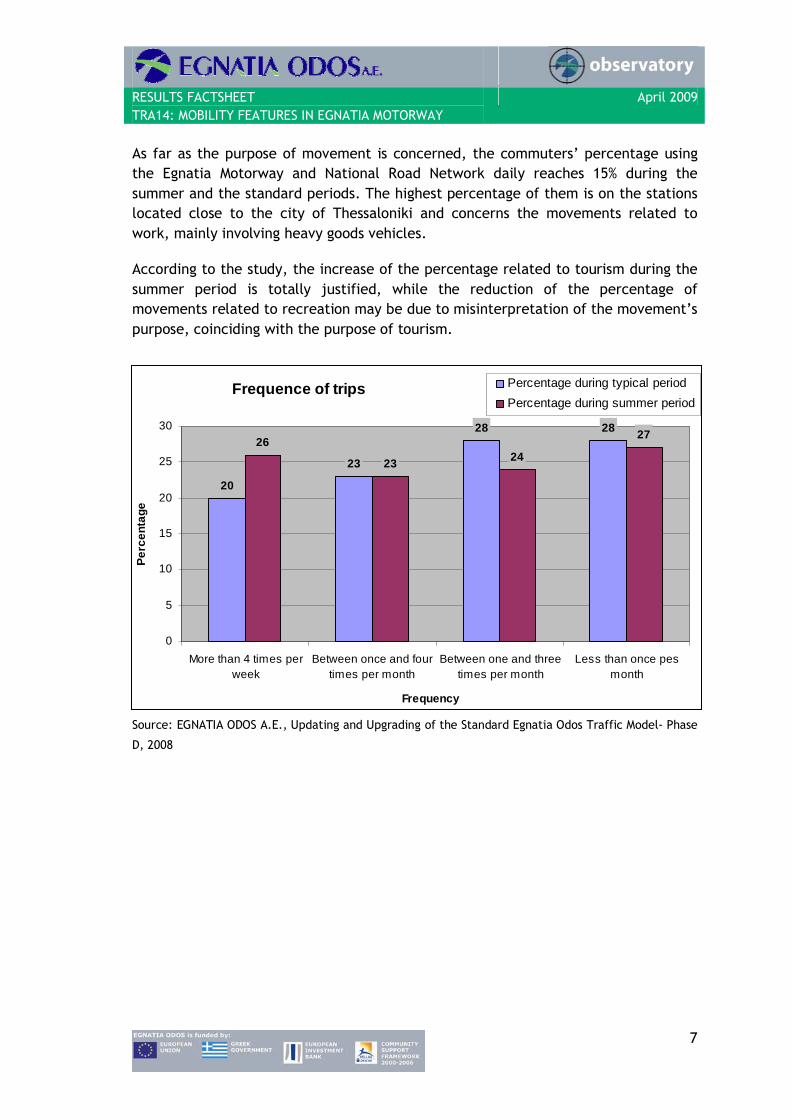
Additionally, we present information deriving from the study “Updating and Upgrading of the Egnatia Motorway Traffic Model- Phase D”– Elaboration and Data Analysis – Arrangement of the New Traffic Model”, prepared in 2008 for EGNATIA ODOS AE. Within the framework of this study, an origin- destination survey has been conducted, examining the characteristics of movements on 15 positions of the Egnatia Motorway axis and National Road Network. As regards the frequency of use of the Egnatia Motorway, there has been no big differentiation between the standard and the summer period. During the summer period, the number of frequent movements (more than 4 times a week) increases, due to the summer holidays.
Source: EGNATIA ODOS Α.Ε., Updating and Upgrading of the Egnatia Motorway Traffic Model- Phase D, 2008.
152%
130%
207%
145%
41%
92%
185%
66%
251%
0%
50%
100%
150%
200%
250%
300%
Igoum
enits
a
Ioann
ina
Greve
na
Kozani
Imath
ia
Kavala
Xanthi
Komoti
ni
Alexand
roupoli
Average Annual Traffic Volume percent change between Thessaloniki andother cities 1993-2006
Aim of the trips
15
32
5
22
26
16
34
10
16
24
0
5
10
15
20
25
30
35
40
Daily work At the frame ofwork
Tourism Recreation Other
Aim
Perc
enta
ge
Percentage during typical periodPercentage during summer period
RESULTS FACTSHEET TRA14: MOBILITY FEATURES IN EGNATIA MOTORWAY
April 2009
7
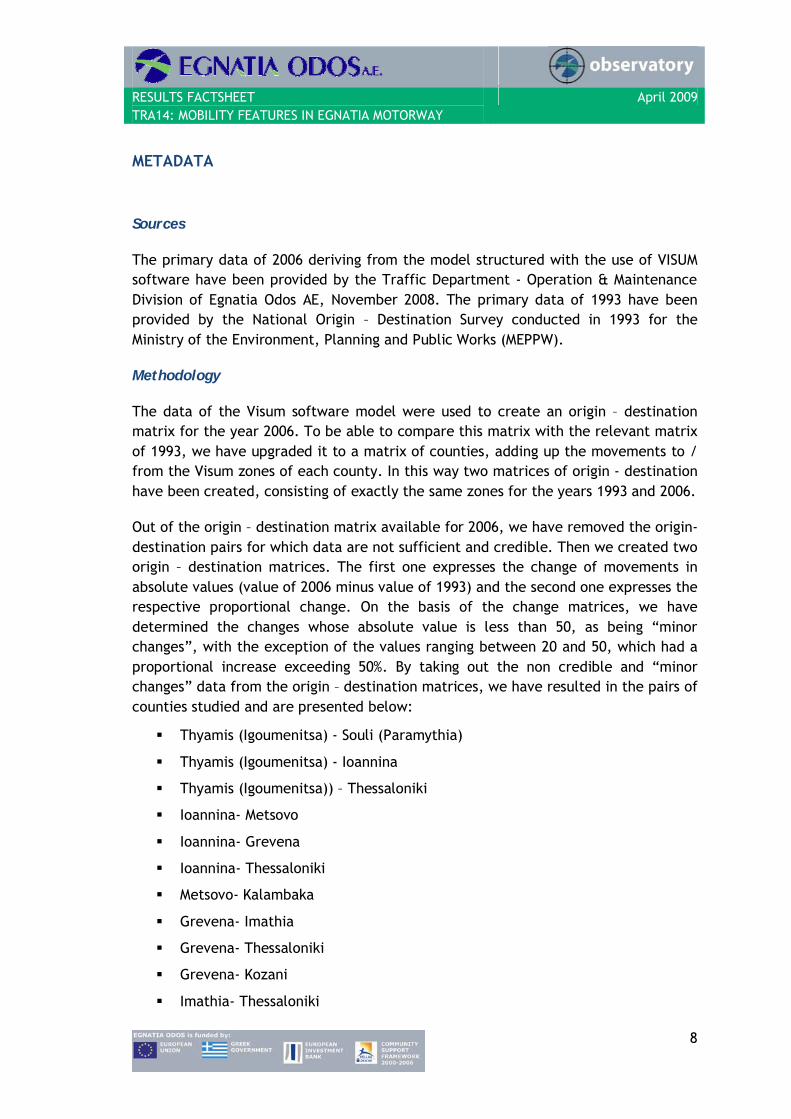
As far as the purpose of movement is concerned, the commuters’ percentage using the Egnatia Motorway and National Road Network daily reaches 15% during the summer and the standard periods. The highest percentage of them is on the stations located close to the city of Thessaloniki and concerns the movements related to work, mainly involving heavy goods vehicles.
According to the study, the increase of the percentage related to tourism during the summer period is totally justified, while the reduction of the percentage of movements related to recreation may be due to misinterpretation of the movement’s purpose, coinciding with the purpose of tourism.
Source: EGNATIA ODOS Α.Ε., Updating and Upgrading of the Standard Egnatia Odos Traffic Model- Phase
D, 2008
Frequence of trips
20
23
28 2826
23 24
27
0
5
10
15
20
25
30
More than 4 times perweek
Between once and fourtimes per month
Between one and threetimes per month
Less than once pesmonth
Frequency
Perc
enta
ge
Percentage during typical periodPercentage during summer period
RESULTS FACTSHEET TRA14: MOBILITY FEATURES IN EGNATIA MOTORWAY
April 2009
8
METADATA
Sources
The primary data of 2006 deriving from the model structured with the use of VISUM software have been provided by the Traffic Department - Operation & Maintenance Division of Egnatia Odos AE, November 2008. The primary data of 1993 have been provided by the National Origin – Destination Survey conducted in 1993 for the Ministry of the Environment, Planning and Public Works (MEPPW).
Methodology
The data of the Visum software model were used to create an origin – destination matrix for the year 2006. To be able to compare this matrix with the relevant matrix of 1993, we have upgraded it to a matrix of counties, adding up the movements to / from the Visum zones of each county. In this way two matrices of origin - destination have been created, consisting of exactly the same zones for the years 1993 and 2006.
Out of the origin – destination matrix available for 2006, we have removed the origin-destination pairs for which data are not sufficient and credible. Then we created two origin – destination matrices. The first one expresses the change of movements in absolute values (value of 2006 minus value of 1993) and the second one expresses the respective proportional change. On the basis of the change matrices, we have determined the changes whose absolute value is less than 50, as being “minor changes”, with the exception of the values ranging between 20 and 50, which had a proportional increase exceeding 50%. By taking out the non credible and “minor changes” data from the origin – destination matrices, we have resulted in the pairs of counties studied and are presented below:
Thyamis (Igoumenitsa) - Souli (Paramythia)
Thyamis (Igoumenitsa) - Ioannina
Thyamis (Igoumenitsa)) – Thessaloniki
Ioannina- Metsovo
Ioannina- Grevena
Ioannina- Thessaloniki
Metsovo- Kalambaka
Grevena- Imathia
Grevena- Thessaloniki
Grevena- Kozani
Imathia- Thessaloniki
RESULTS FACTSHEET TRA14: MOBILITY FEATURES IN EGNATIA MOTORWAY
April 2009
9
Imathia- Lagathas
Imathia- Kavala
Imathia- Kozani
Thessaloniki- Lagathas
Thessaloniki- Kavala
Thessaloniki- Paggeo (Nea Peramos)
Thessaloniki- Kozani
Thessaloniki- Fylida (Alistrati)
Thessaloniki- Alexandroupoli
Thessaloniki- Xanthi
Thessaloniki- Komotini
Lagathas – Paggeo (Nea Peramos)
Lagathas - Kozani
Lagathas- Visaltia (Nigrita)
Lagathas- Filida (Alistrati)
Lagathas- Xanthi
Kavala- Nestos (Hrysoupoli)
Kavala- Paggeo (Nea Peramos)
Kavala- Alexandroupoli
Kavala- Xanthi
Kavala- Komotini
Nestos (Hrysoupοli)- Paggeo
Nestos (Hrysoupοli)- Alexandroupoli
Nestos (Hrysoupοli)- Xanthi
Nestos (Hrysoupοli)- Komotini
Paggeo (Nea Peramos) – Fylida (Alistrati)
Paggeo (Nea Peramos) – Xanthi
Visaltia (Nigrita) – Fylida (Alistrati)
Visaltia (Nigrita) – Xanthi
Alexandroupoli- Xanthi
Alexandroupoli- Komotini
Alexandroupoli- Sappes
Soufli- Sappes
RESULTS FACTSHEET TRA14: MOBILITY FEATURES IN EGNATIA MOTORWAY
April 2009
10
Soufli- Komotini
Xanthi- Komotini
Xanthi- Sappes
Komotini- Sappes
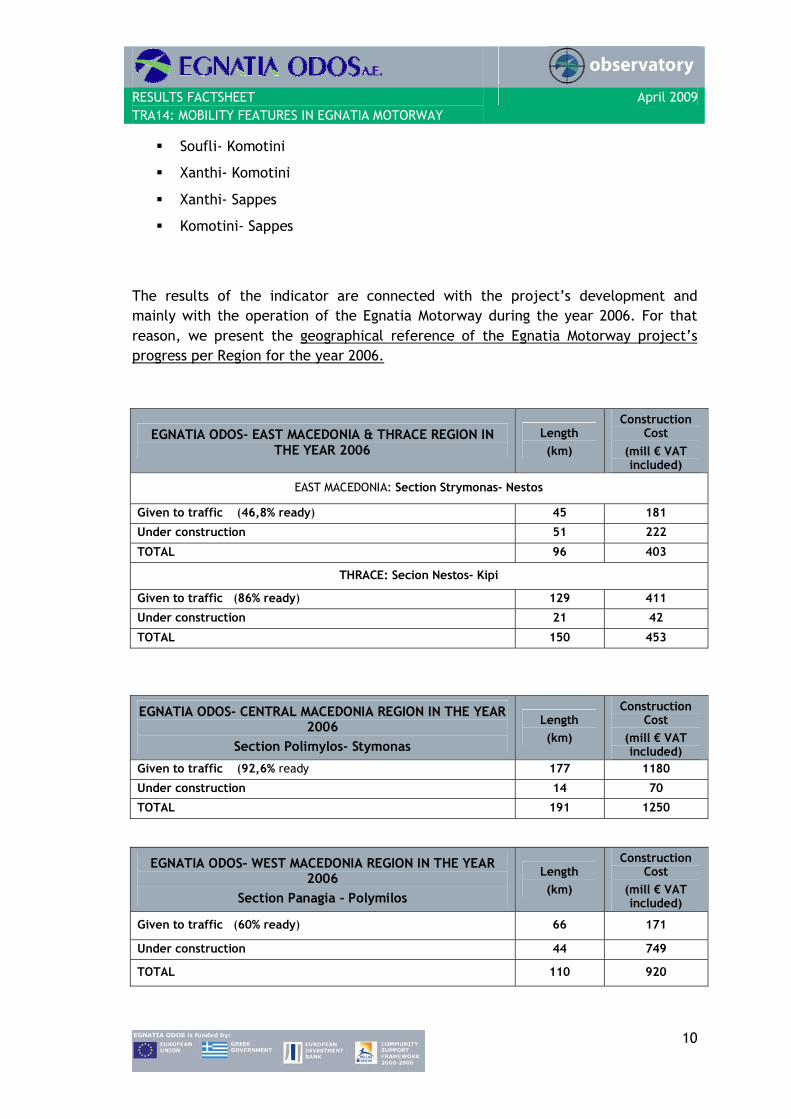
The results of the indicator are connected with the project’s development and mainly with the operation of the Egnatia Motorway during the year 2006. For that reason, we present the geographical reference of the Egnatia Motorway project’s progress per Region for the year 2006.
EGNATIA ODOS- EAST MACEDONIA & THRACE REGION IN THE YEAR 2006
Length (km)
Construction Cost
(mill € VAT included)
EAST MACEDONIA: Section Strymonas- Nestos
Given to traffic (46,8% ready) 45 181
Under construction 51 222
TOTAL 96 403
THRACE: Secion Nestos- Kipi
Given to traffic (86% ready) 129 411
Under construction 21 42
TOTAL 150 453
EGNATIA ODOS- CENTRAL MACEDONIA REGION IN THE YEAR 2006
Section Polimylos- Stymonas
Length (km)
Construction Cost
(mill € VAT included)
Given to traffic (92,6% ready 177 1180
Under construction 14 70
TOTAL 191 1250
EGNATIA ODOS- WEST MACEDONIA REGION IN THE YEAR
2006 Section Panagia - Polymilos
Length (km)
Construction Cost
(mill € VAT included)
Given to traffic (60% ready) 66 171
Under construction 44 749
TOTAL 110 920
RESULTS FACTSHEET TRA14: MOBILITY FEATURES IN EGNATIA MOTORWAY
April 2009
11
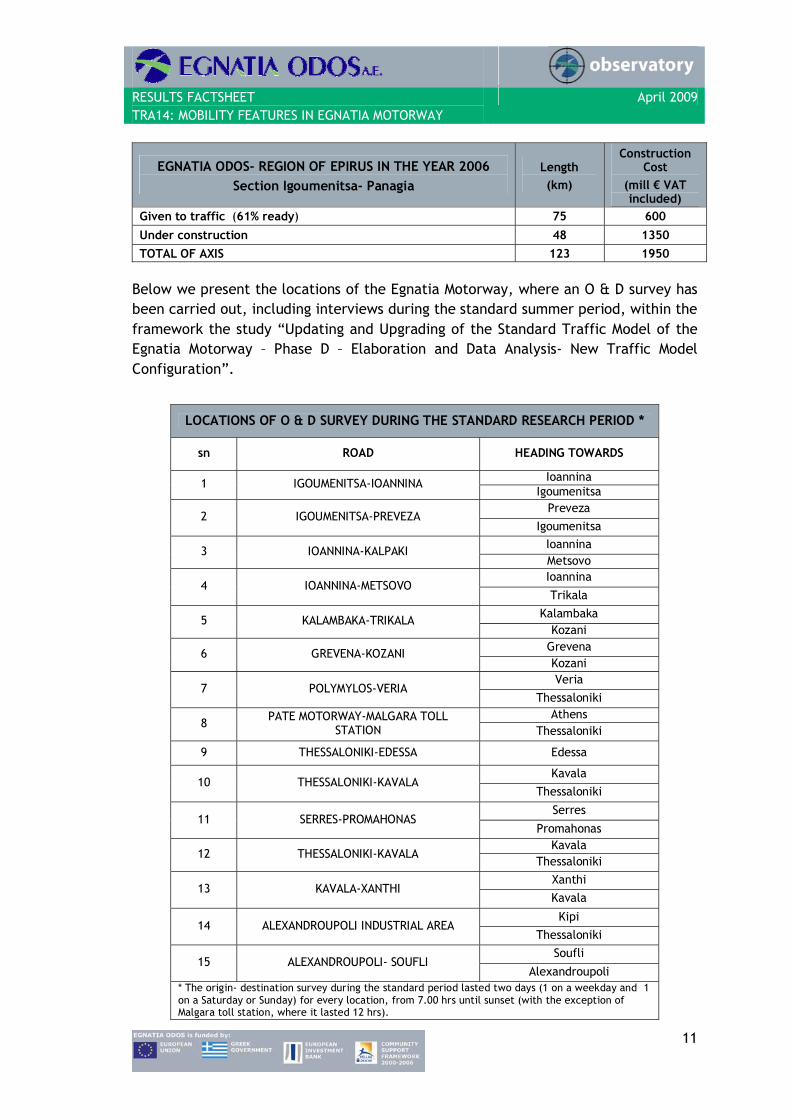
EGNATIA ODOS- REGION OF EPIRUS IN THE YEAR 2006 Section Igoumenitsa- Panagia
Length (km)
Construction Cost
(mill € VAT included)
Given to traffic (61% ready) 75 600 Under construction 48 1350 TOTAL OF AXIS 123 1950
Below we present the locations of the Egnatia Motorway, where an O & D survey has been carried out, including interviews during the standard summer period, within the framework the study “Updating and Upgrading of the Standard Traffic Model of the Egnatia Motorway – Phase D – Elaboration and Data Analysis- New Traffic Model Configuration”.
LOCATIONS OF O & D SURVEY DURING THE STANDARD RESEARCH PERIOD *
sn ROAD HEADING TOWARDS
Ioannina 1 IGOUMENITSA-IOANNINA Igoumenitsa
Preveza 2 IGOUMENITSA-PREVEZA
Igoumenitsa Ioannina 3 IOANNINA-KALPAKI Metsovo Ioannina
4 IOANNINA-METSOVO Trikala
Kalambaka 5 KALAMBAKA-TRIKALA Kozani
Grevena 6 GREVENA-KOZANI Kozani Veria
7 POLYMYLOS-VERIA Thessaloniki
Athens 8 PATE MOTORWAY-MALGARA TOLL
STATION Thessaloniki
9 THESSALONIKI-EDESSA Edessa
Kavala 10 THESSALONIKI-KAVALA
Thessaloniki
Serres 11 SERRES-PROMAHONAS
Promahonas Kavala
12 THESSALONIKI-KAVALA Thessaloniki
Xanthi 13 KAVALA-XANTHI
Kavala
Kipi 14 ALEXANDROUPOLI INDUSTRIAL AREA
Thessaloniki Soufli
15 ALEXANDROUPOLI- SOUFLI Alexandroupoli
* The origin- destination survey during the standard period lasted two days (1 on a weekday and 1 on a Saturday or Sunday) for every location, from 7.00 hrs until sunset (with the exception of Malgara toll station, where it lasted 12 hrs).
RESULTS FACTSHEET TRA14: MOBILITY FEATURES IN EGNATIA MOTORWAY
April 2009
12
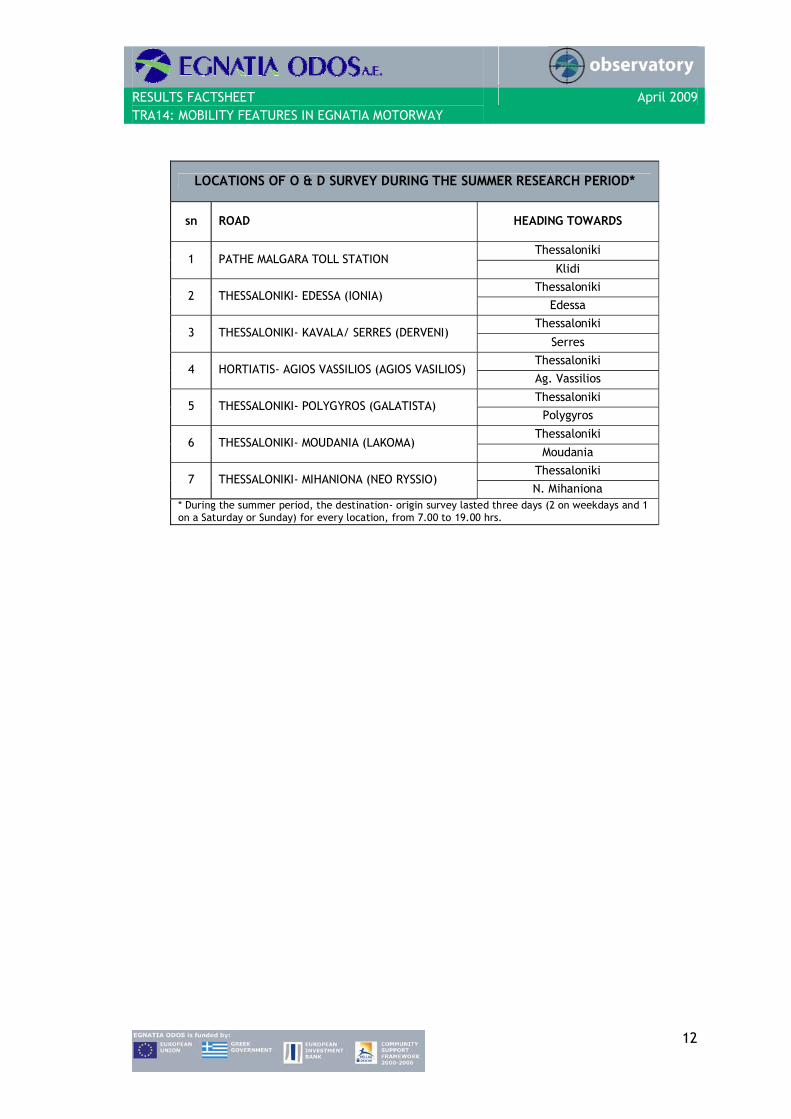
LOCATIONS OF O & D SURVEY DURING THE SUMMER RESEARCH PERIOD*
sn ROAD HEADING TOWARDS
Thessaloniki 1 PATHE MALGARA TOLL STATION
Klidi Thessaloniki
2 THESSALONIKI- EDESSA (ΙOΝΙΑ) Edessa
Thessaloniki 3 THESSALONIKI- KAVALA/ SERRES (DERVENI)
Serres Thessaloniki
4 HORTIATIS- AGIOS VASSILIOS (AGIOS VASILIOS) Ag. Vassilios
Thessaloniki 5 THESSALONIKI- POLYGYROS (GALATISTA)
Polygyros
Thessaloniki 6 THESSALONIKI- MOUDANIA (LAKOMA)
Moudania Thessaloniki
7 THESSALONIKI- MIHANIONA (NEO RYSSIO) Ν. Mihaniona
* During the summer period, the destination- origin survey lasted three days (2 on weekdays and 1 on a Saturday or Sunday) for every location, from 7.00 to 19.00 hrs.
RESULTS FACTSHEET TRA14: MOBILITY FEATURES IN EGNATIA MOTORWAY
April 2009
13
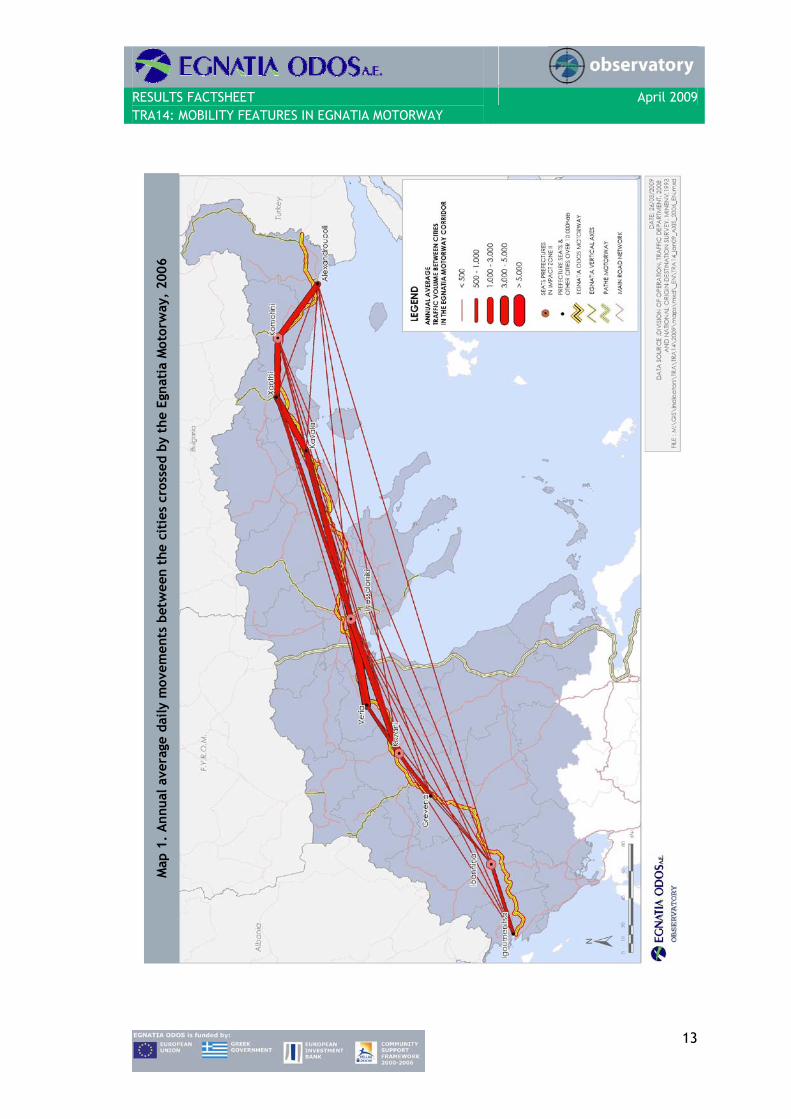
Map
1.
Annu
al a
vera
ge d
aily
mov
emen
ts b
etw
een
the
citi
es c
ross
ed b
y th
e Eg
nati
a M
otor
way
, 20
06
RESULTS FACTSHEET TRA14: MOBILITY FEATURES IN EGNATIA MOTORWAY
April 2009
14
Map
2.
Chan
ge o
f th
e A
nnua
l Ave
rage
Dai
ly M
ovem
ents
bet
wee
n th
e ci
ties
cro
ssed
by
the
Egna
tia
Mot
orw
ay,
1993
-200
6
RESULTS FACTSHEET TRA14: MOBILITY FEATURES IN EGNATIA MOTORWAY
April 2009
15
Map
3.
Annu
al A
vera
ge D
aily
Mov
emen
ts t
o ea
ch c
ount
y cr
osse
d by
the
Egn
atia
Mot
orw
ay f
rom
the
res
t of
the
m,
2006
RESULTS FACTSHEET TRA14: MOBILITY FEATURES IN EGNATIA MOTORWAY
April 2009
16
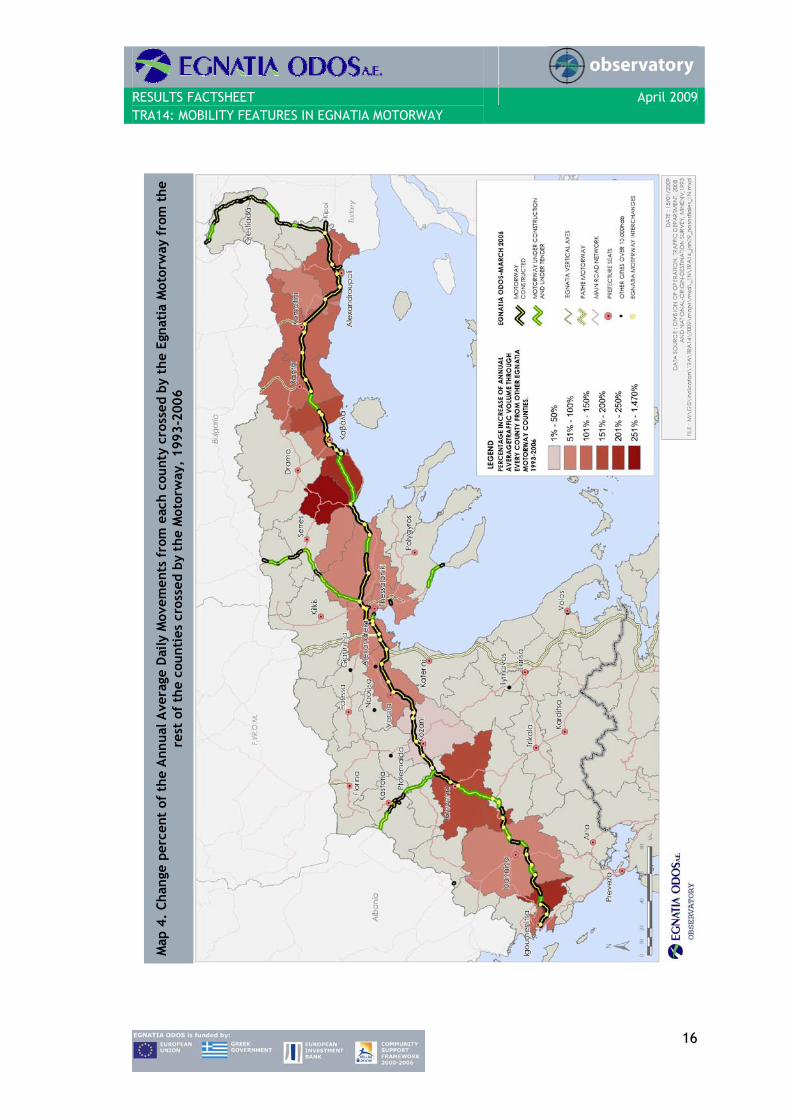
M
ap 4
. Ch
ange
per
cent
of
the
Ann
ual A
vera
ge D
aily
Mov
emen
ts f
rom
eac
h co
unty
cro
ssed
by
the
Egna
tia
Mot
orw
ay f
rom
the
re
st o
f th
e co
unti
es c
ross
ed b
y th
e M
otor
way
, 19
93-2
006