INC 112 Basic Circuit Analysis Week 13 Frequency Response.
29
INC 112 Basic Circuit Analysis Week 13 Frequency Response
-
Upload
rose-tucker -
Category
Documents
-
view
221 -
download
0
Transcript of INC 112 Basic Circuit Analysis Week 13 Frequency Response.
INC 112 Basic Circuit Analysis
Week 13
Frequency Response
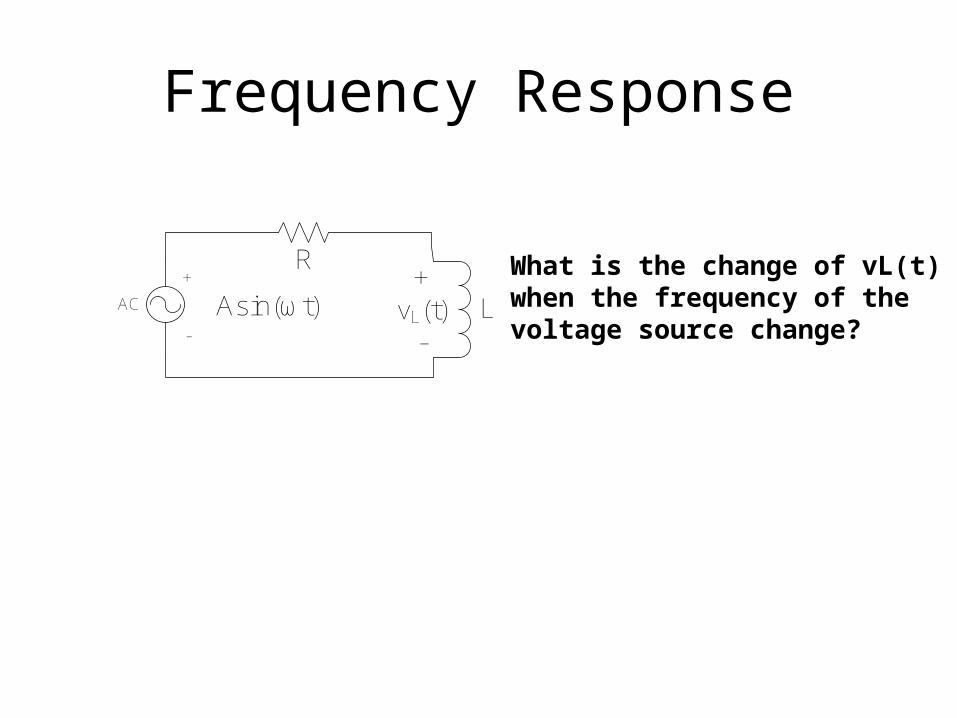
Frequency Response
AC
+
-
Asin(ωt) L
R+
vL(t)-
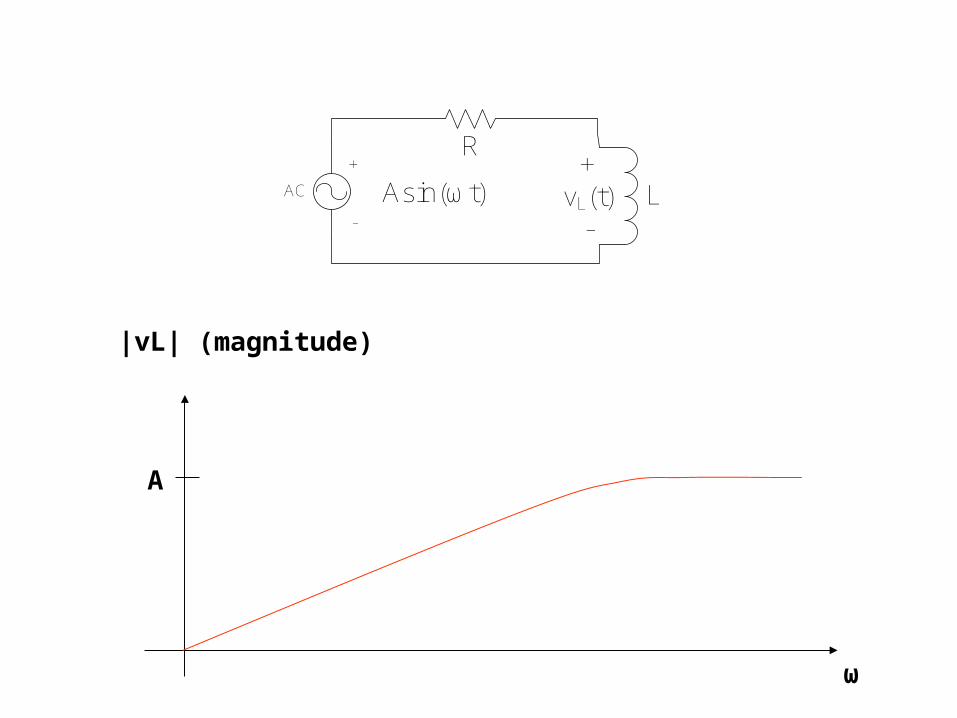
What is the change of vL(t)when the frequency of thevoltage source change?
AC
+
-
Asin(ωt) L
R+
vL(t)-
ω
|vL| (magnitude)
A
Log ω
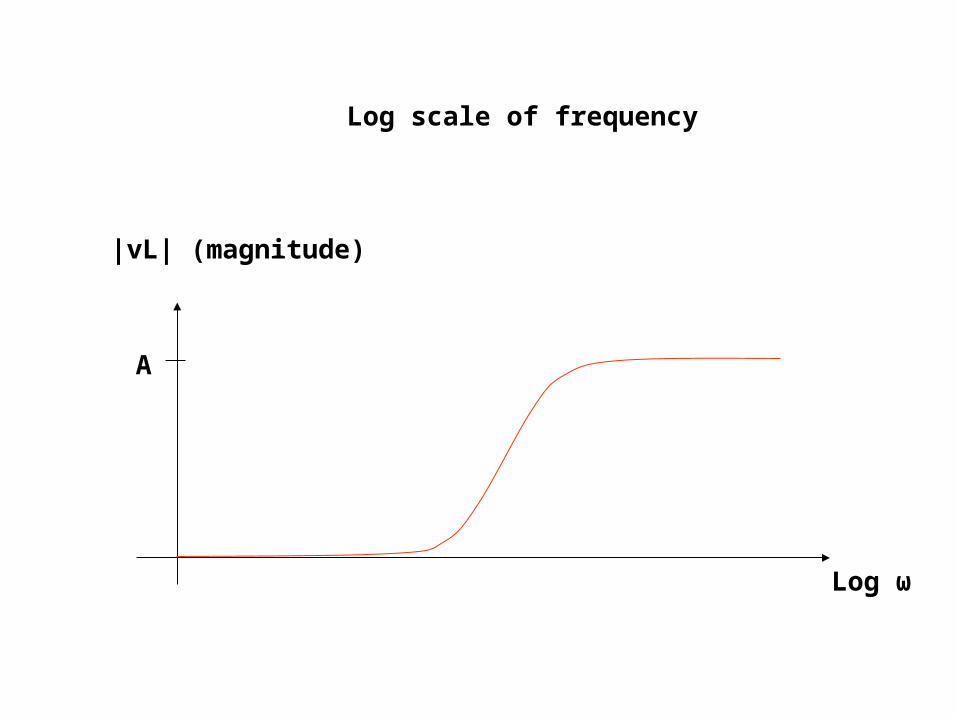
|vL| (magnitude)
Log scale of frequency
A
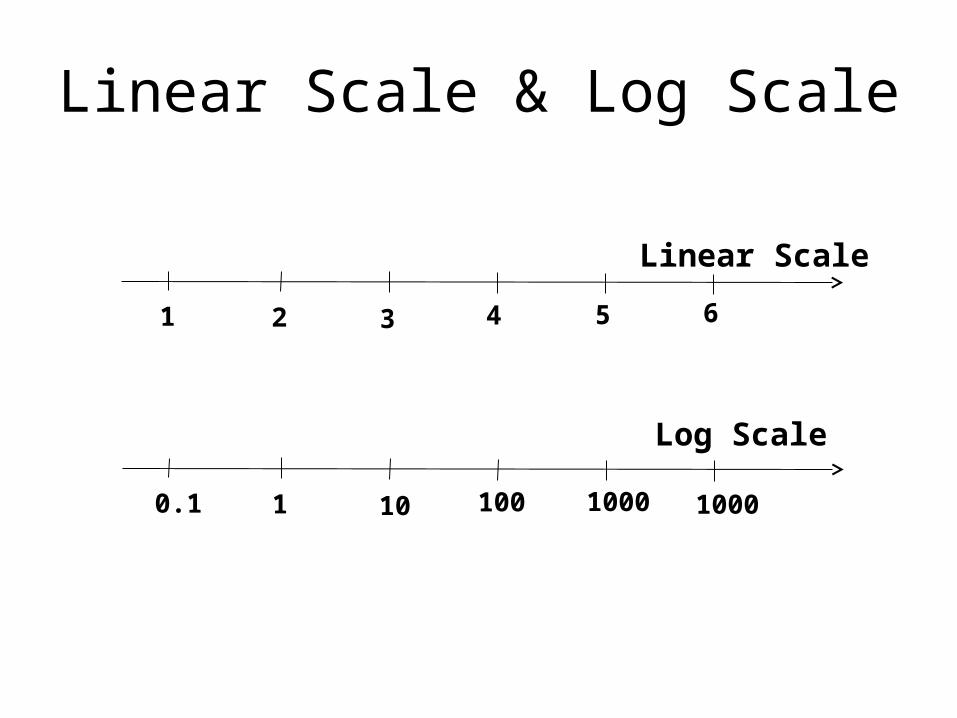
Linear Scale & Log Scale
1 2 3 4 5 6
0.1 1 10 100 1000 1000
Linear Scale
Log Scale
AC
+
-
Asin(ωt)
R+
vC(t)-
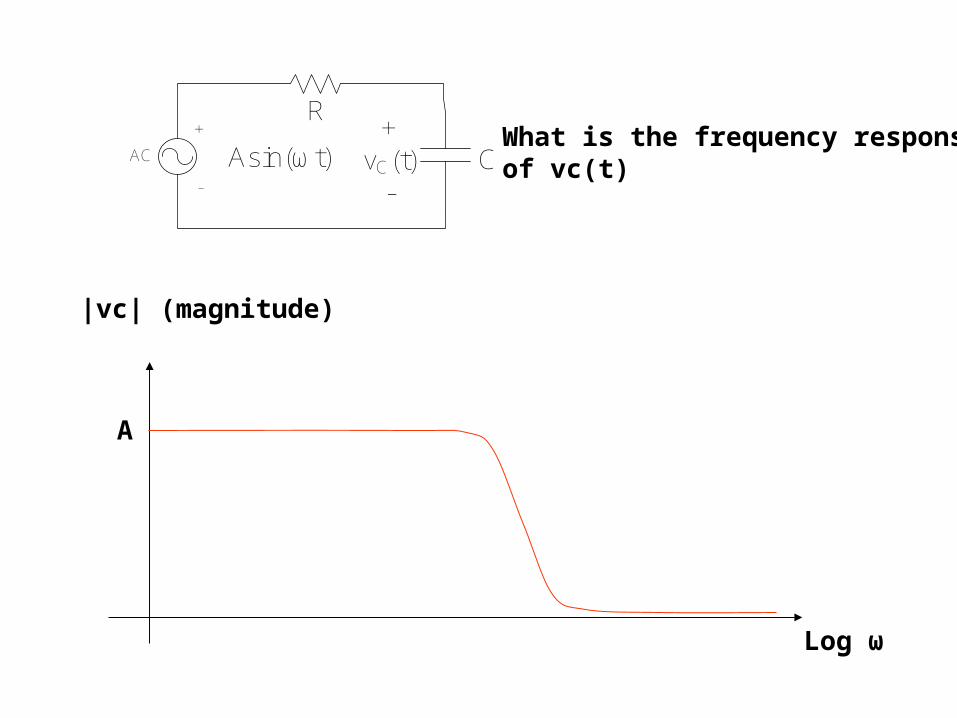
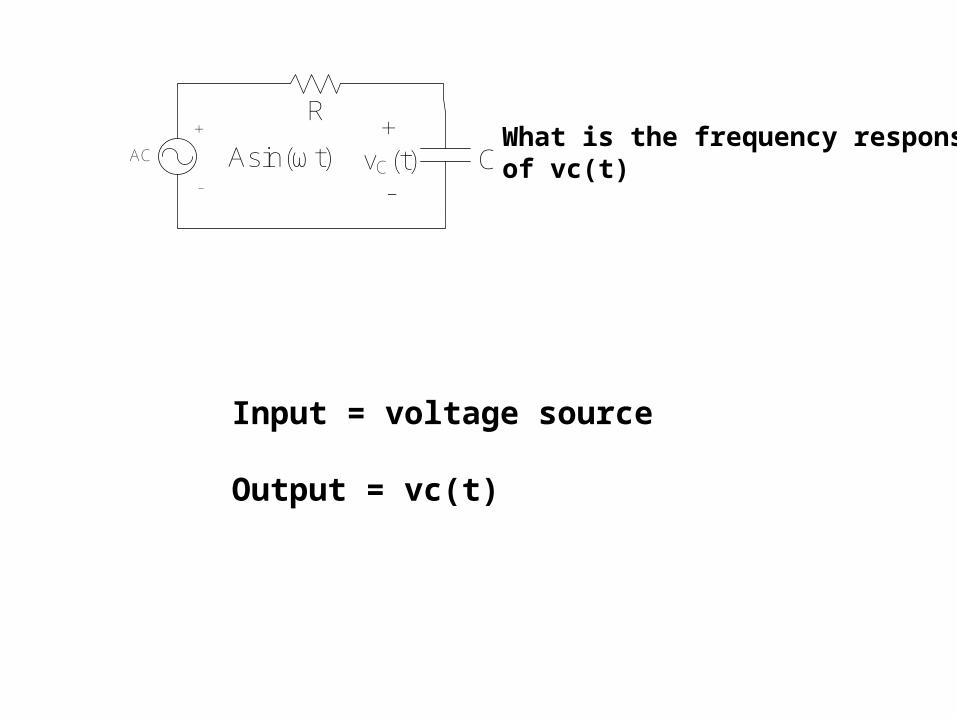
CWhat is the frequency responseof vc(t)
Log ω
|vc| (magnitude)
A
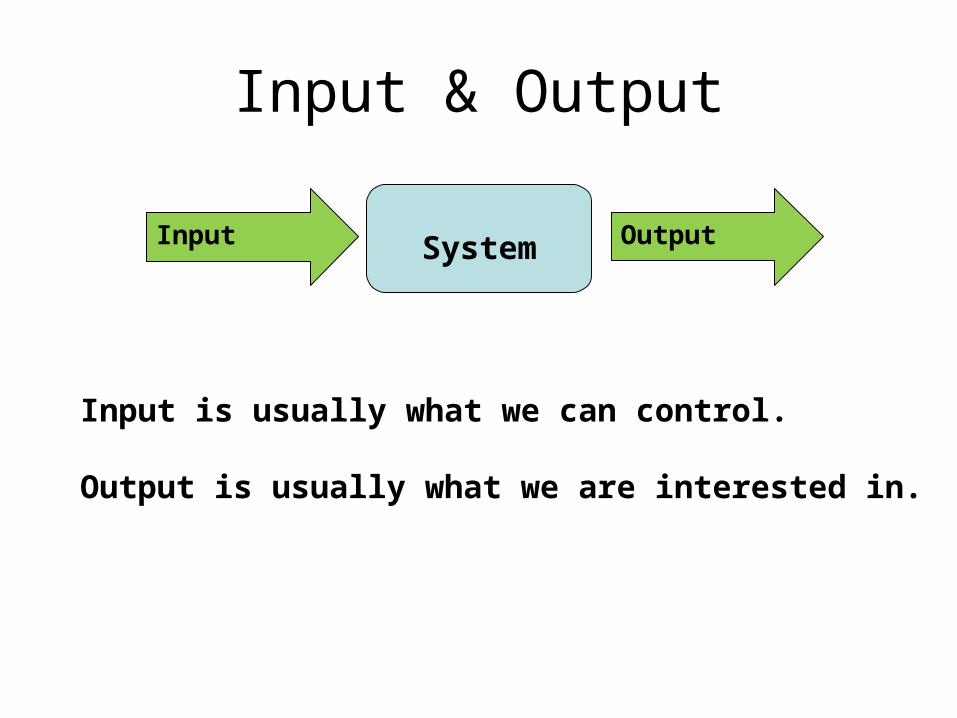
Input & Output
SystemInput Output
Input is usually what we can control.
Output is usually what we are interested in.
AC
+
-
Asin(ωt)
R+
vC(t)-
CWhat is the frequency responseof vc(t)
Input = voltage source
Output = vc(t)
Frequency Domain
Frequency domain is another point of view of things in the world.
Some analysis are easier done in frequency domain than time domain.
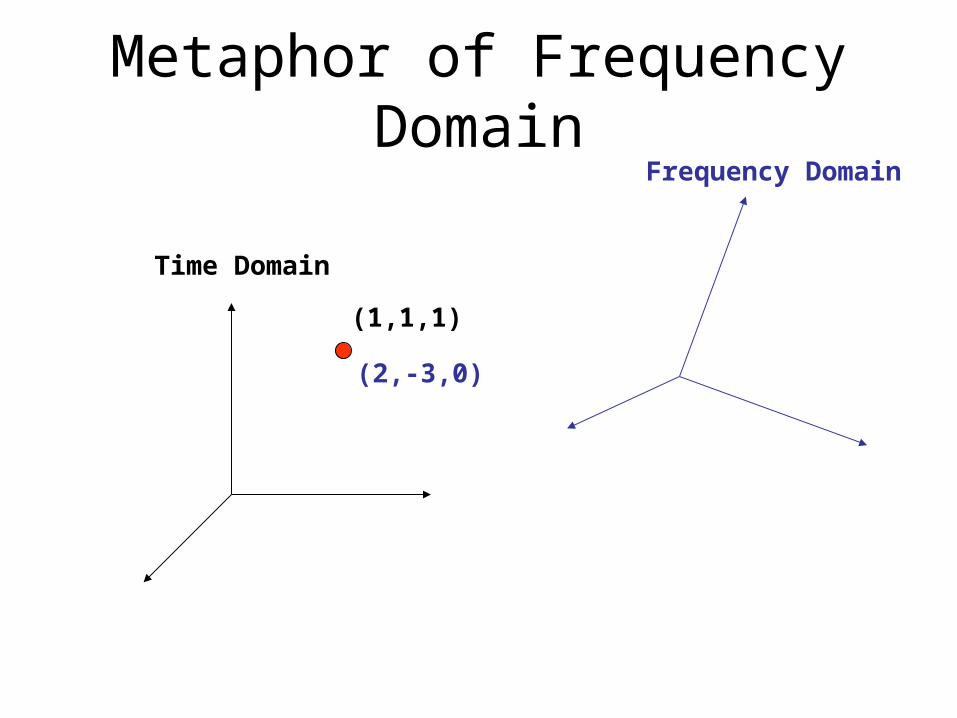
Metaphor of Frequency Domain
(1,1,1)
(2,-3,0)
Time Domain
Frequency Domain
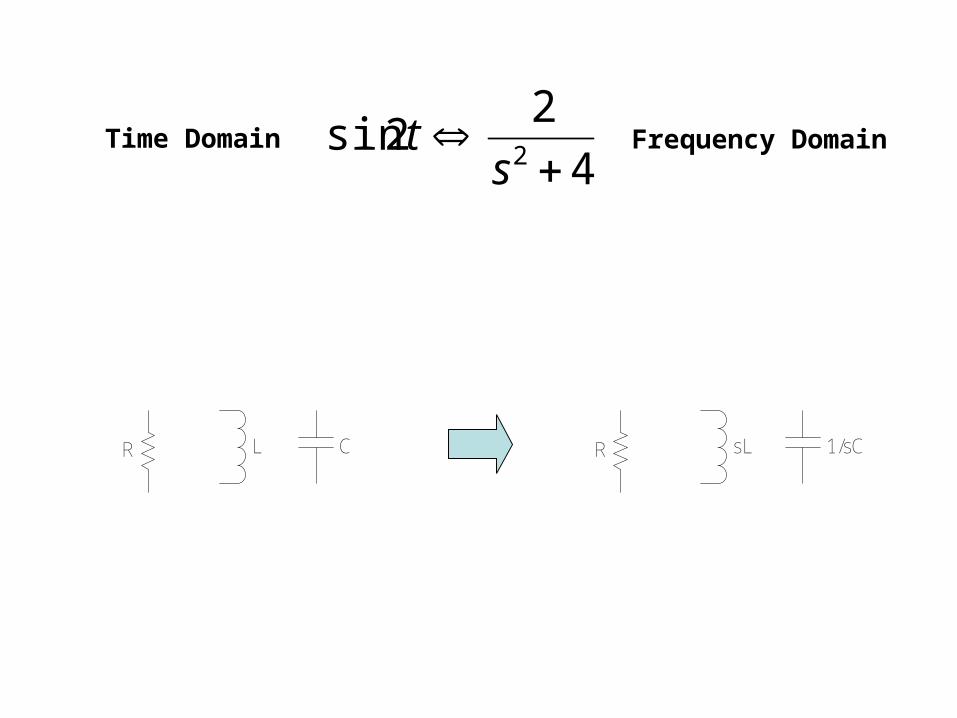
4
22sin
2 s
tTime Domain Frequency Domain
R L C R sL 1/sC
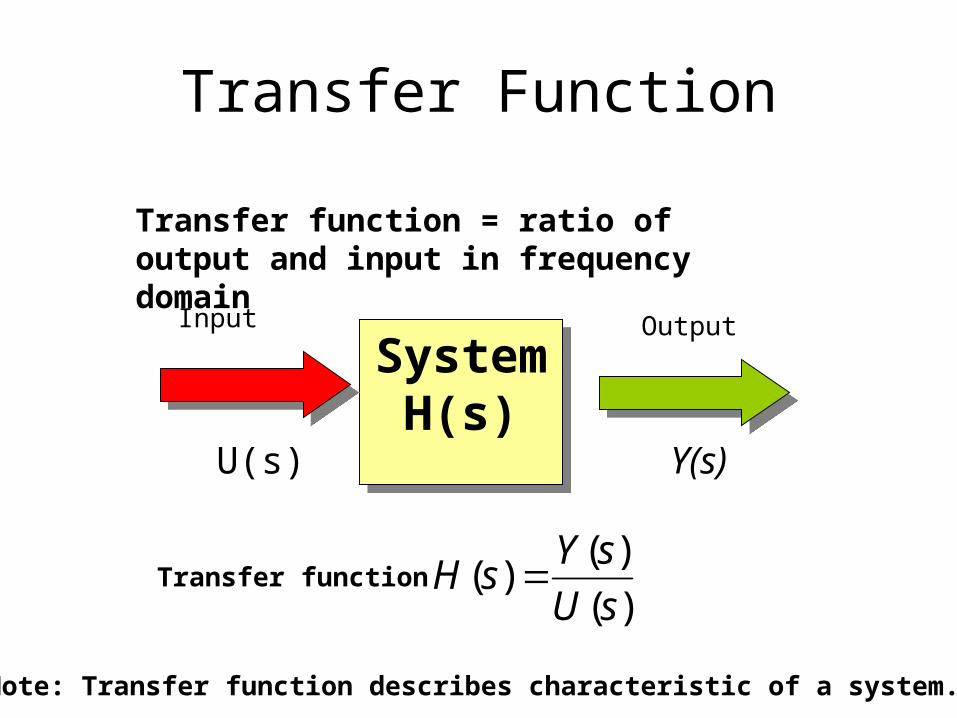
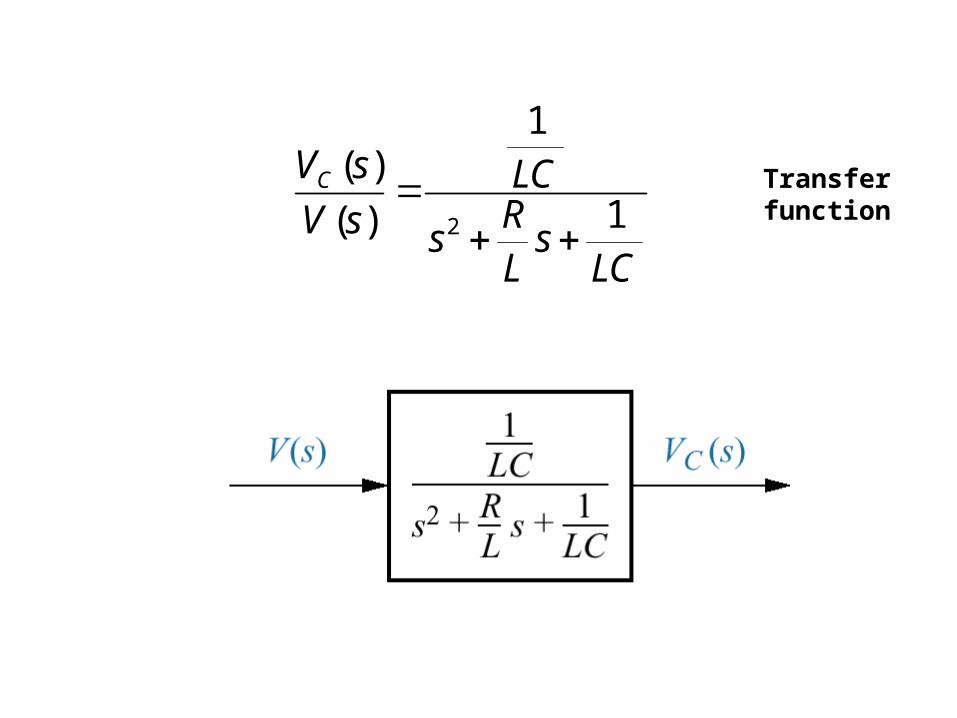
Transfer Function
Transfer function = ratio of output and input in frequency domain
System
H(s)
System
H(s)
Input Output
U(s) Y(s)
)(
)()(
sU
sYsH Transfer function
Note: Transfer function describes characteristic of a system.
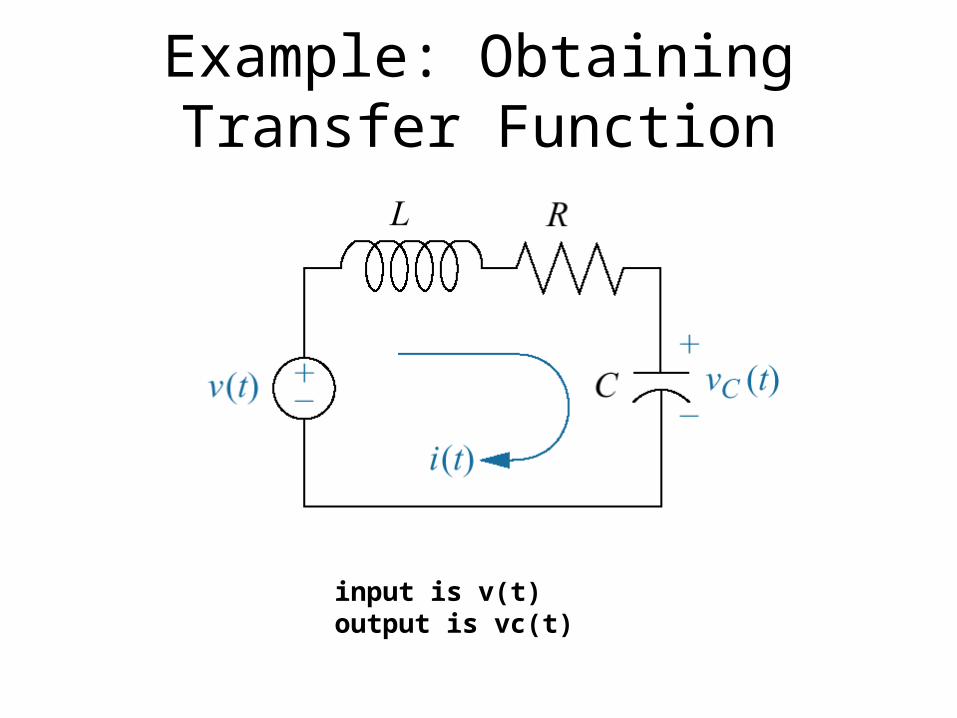
Example: Obtaining Transfer Function
input is v(t)output is vc(t)
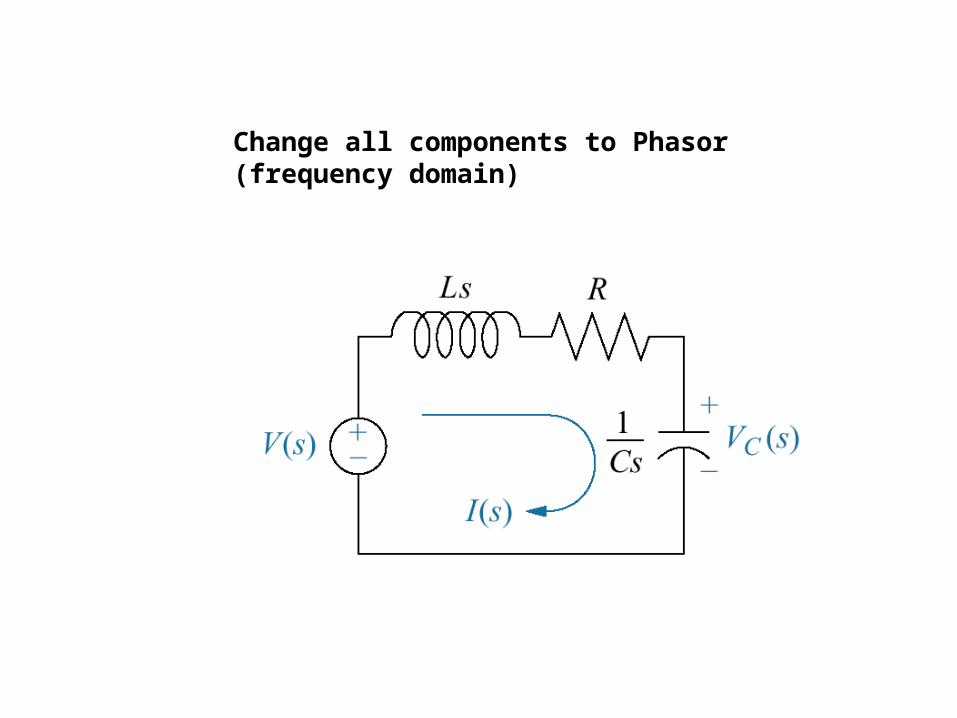
Change all components to Phasor(frequency domain)
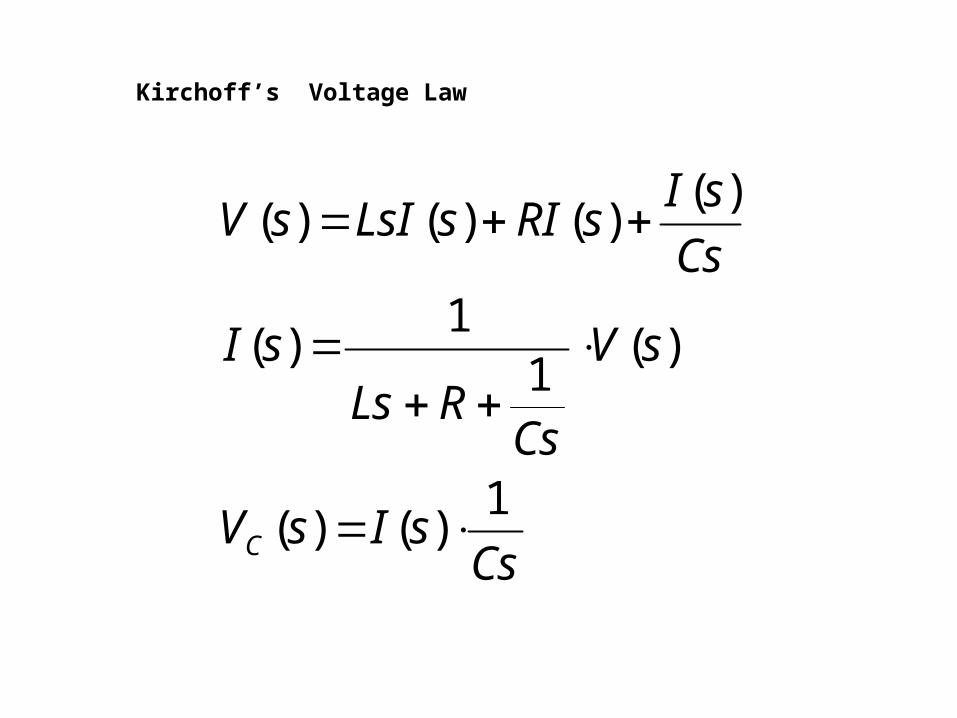
Kirchoff’s Voltage Law
CssIsV
sV
CsRLs
sI
Cs
sIsRIsLsIsV
C
1)()(
)(1
1)(
)()()()(
LCs
LR
s
LCsV
sVC1
1
)(
)(
2 Transfer
function
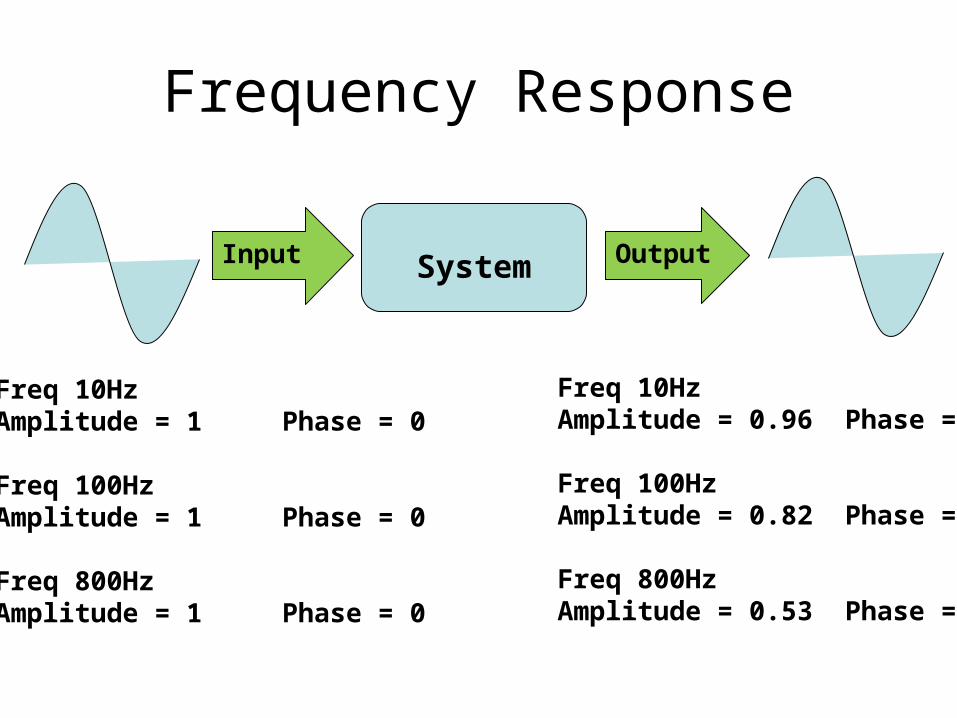
Frequency Response
SystemInput Output
Freq 10HzAmplitude = 1 Phase = 0
Freq 100HzAmplitude = 1 Phase = 0
Freq 800HzAmplitude = 1 Phase = 0
Freq 10HzAmplitude = 0.96 Phase = 12
Freq 100HzAmplitude = 0.82 Phase = 44
Freq 800HzAmplitude = 0.53 Phase = 56
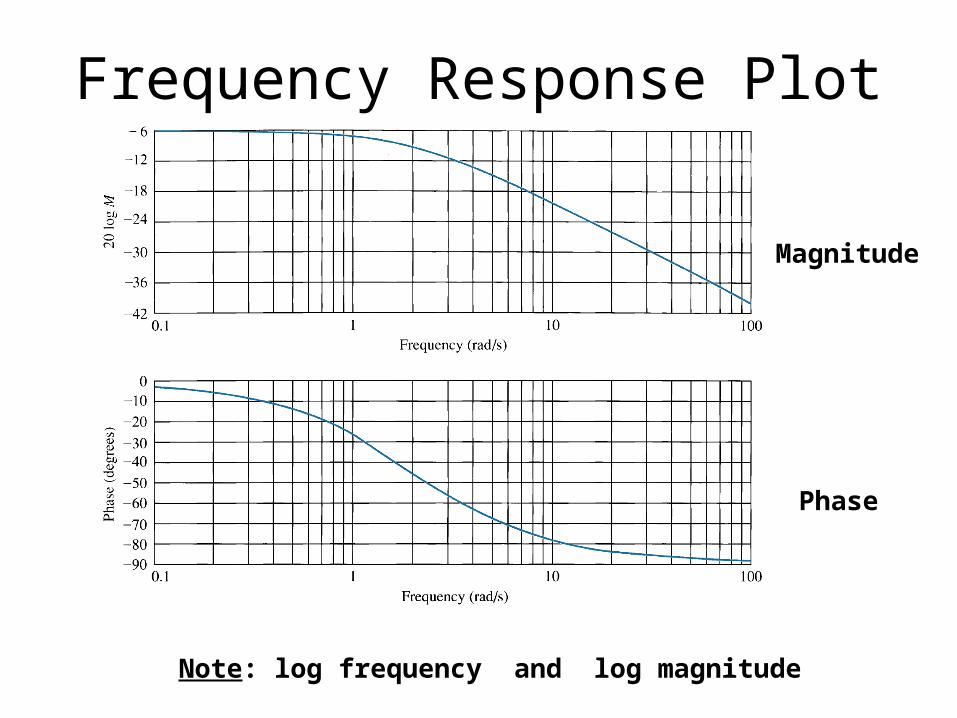
Frequency Response Plot
Note: log frequency and log magnitude
Magnitude
Phase
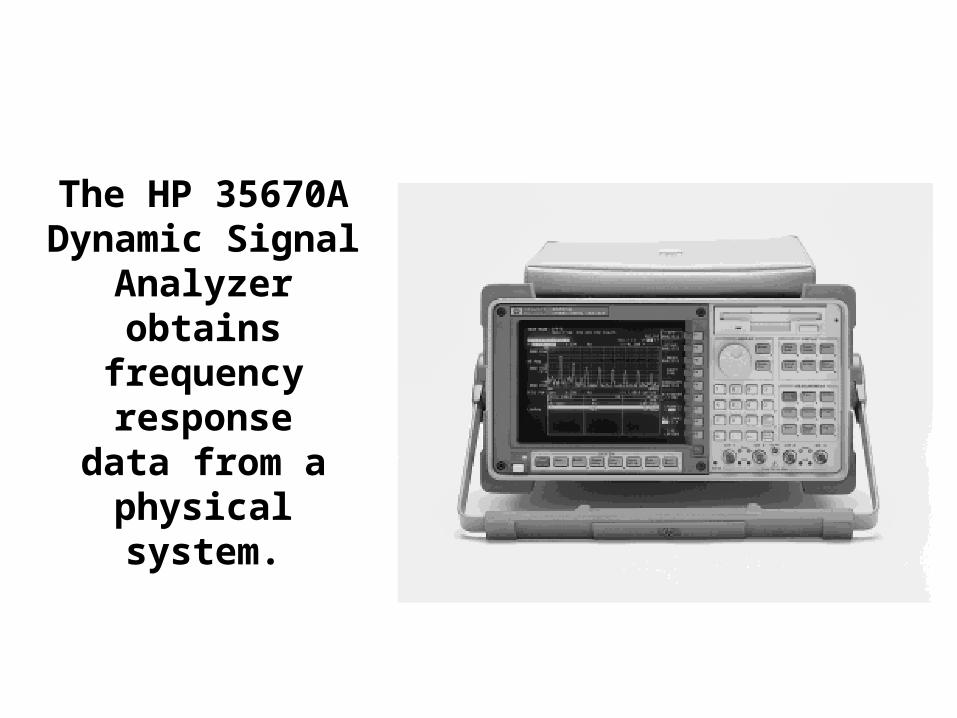
The HP 35670A Dynamic Signal Analyzer obtains
frequency responsedata from a
physicalsystem.
Fourier Series
“Any periodic signal can be written in the sum of sine wave signalsat different frequency.”
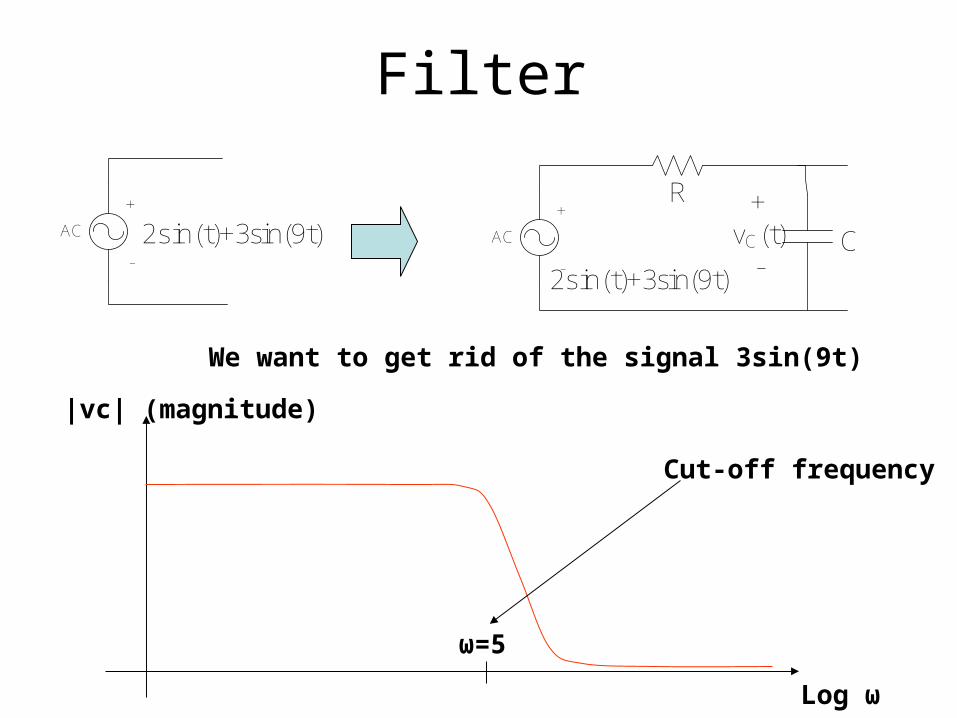
Filter
AC
+
-2sin(t)+3sin(9t)
R +vC(t)
-C
Log ω
|vc| (magnitude)
We want to get rid of the signal 3sin(9t)
AC
+
-
2sin(t)+3sin(9t)
ω=5
Cut-off frequency
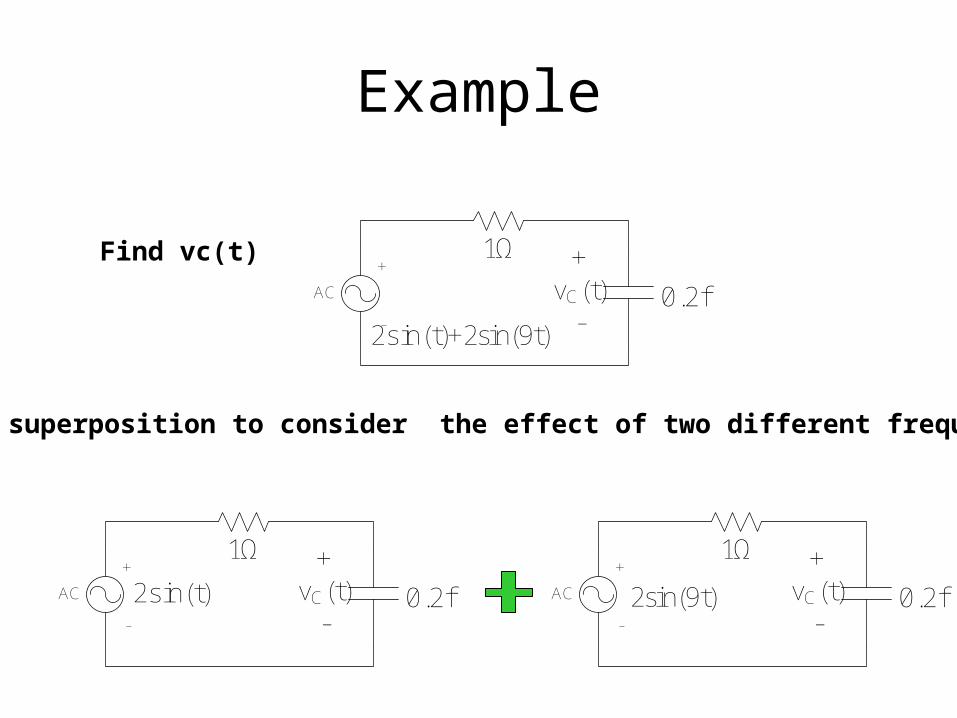
Example
AC
+
-2sin(t)+2sin(9t)
1Ω +vC(t)
-0.2f
Find vc(t)
Use superposition to consider the effect of two different frequencies
AC
+
-
2sin(t)
1Ω +vC(t)
-0.2f AC
+
-
2sin(9t)
1Ω +vC(t)
-0.2f
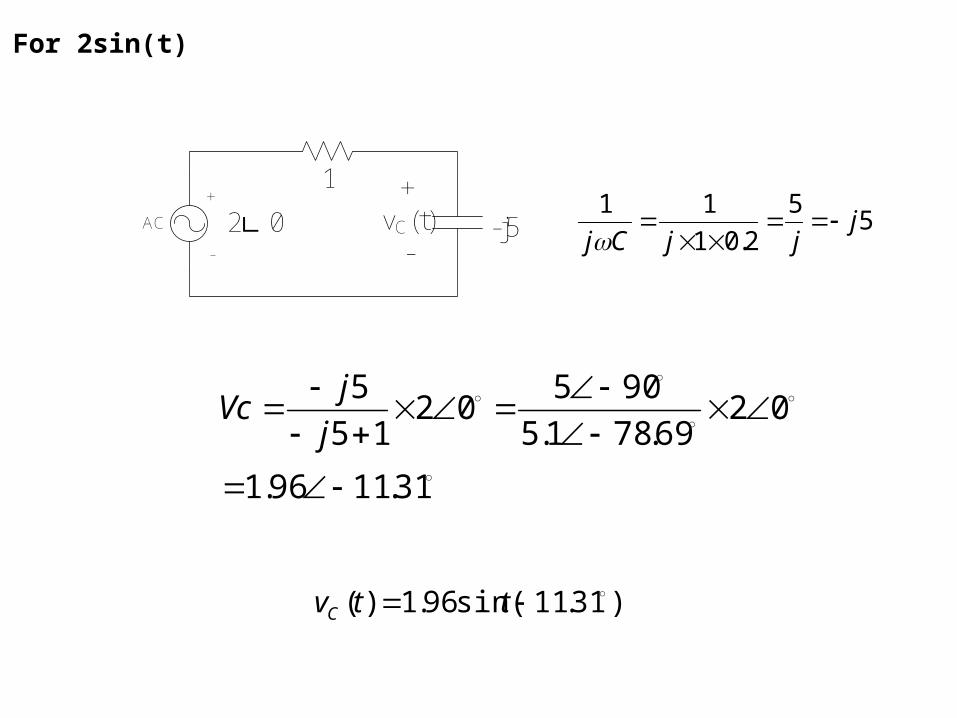
AC
+
-
2∟0
1 +vC(t)
--j5
For 2sin(t)
55
2.01
11j
jjCj
31.1196.1
0269.781.5
90502
15
5
j
jVc
)31.11sin(96.1)( ttvC
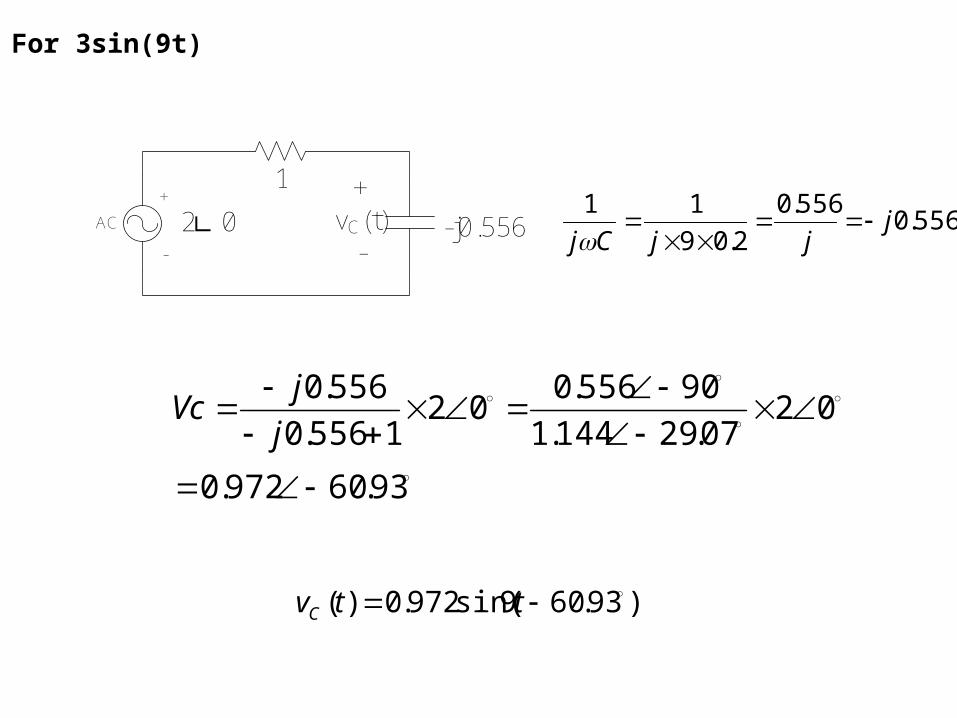
AC
+
-
2∟0
1 +vC(t)
--j0.556
For 3sin(9t)
556.0556.0
2.09
11j
jjCj
93.60972.0
0207.29144.1
90556.002
1556.0
556.0
j
jVc
)93.609sin(972.0)( ttvC
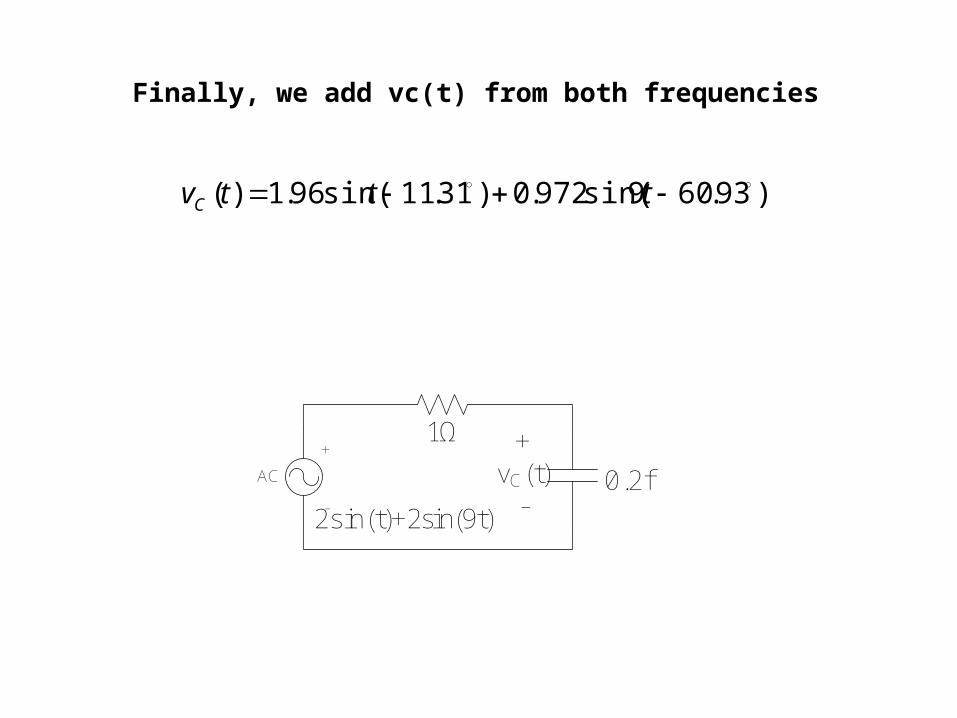
Finally, we add vc(t) from both frequencies
)93.609sin(972.0)31.11sin(96.1)( tttvC
AC
+
-2sin(t)+2sin(9t)
1Ω +vC(t)
-0.2f
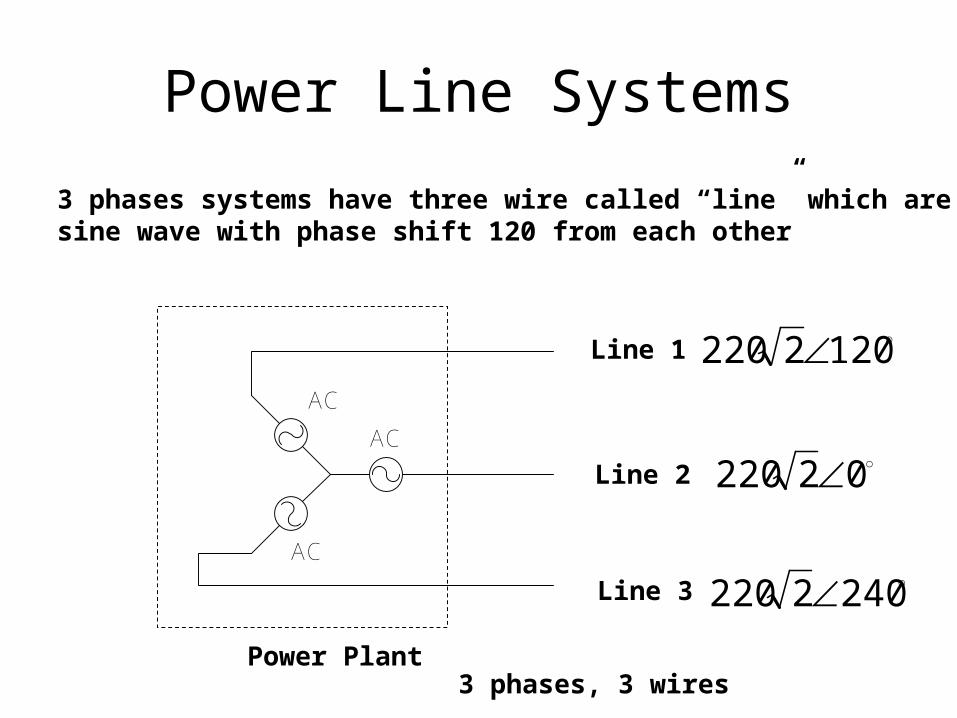
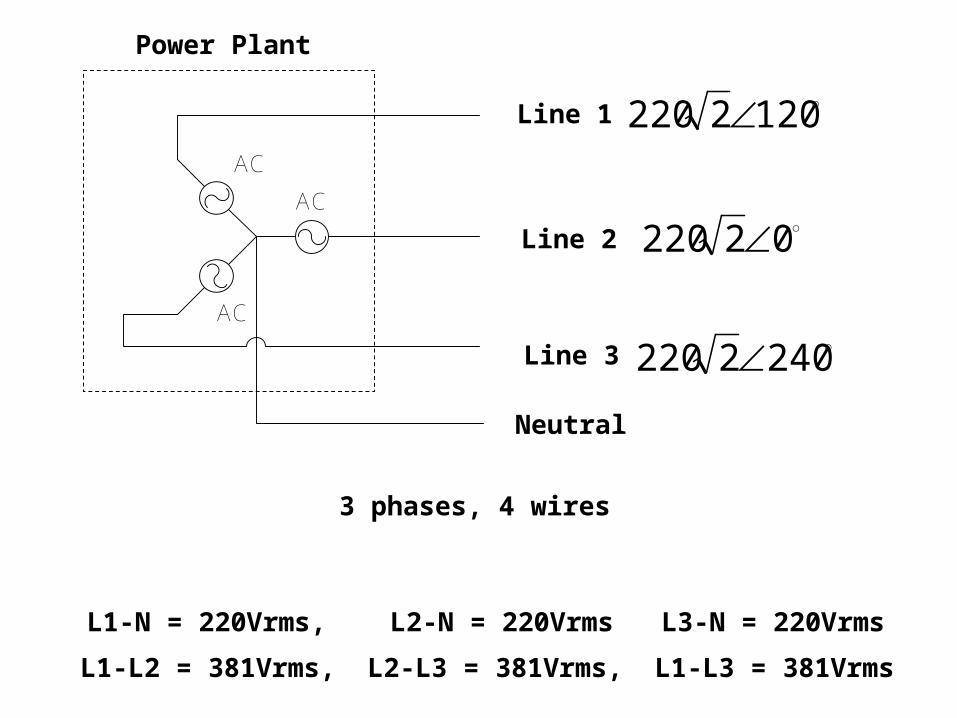
Power Line Systems
3 phases systems have three wire called “line” which aresine wave with phase shift 120 from each other
AC
AC
AC
Power Plant
Line 1
Line 2
Line 3
02220
2402220
1202220
3 phases, 3 wires
AC
AC
AC
Power Plant
Line 1
Line 2
Line 3
02220
2402220
1202220
3 phases, 4 wires
Neutral
L1-N = 220Vrms, L2-N = 220Vrms L3-N = 220Vrms
L1-L2 = 381Vrms, L2-L3 = 381Vrms, L1-L3 = 381Vrms
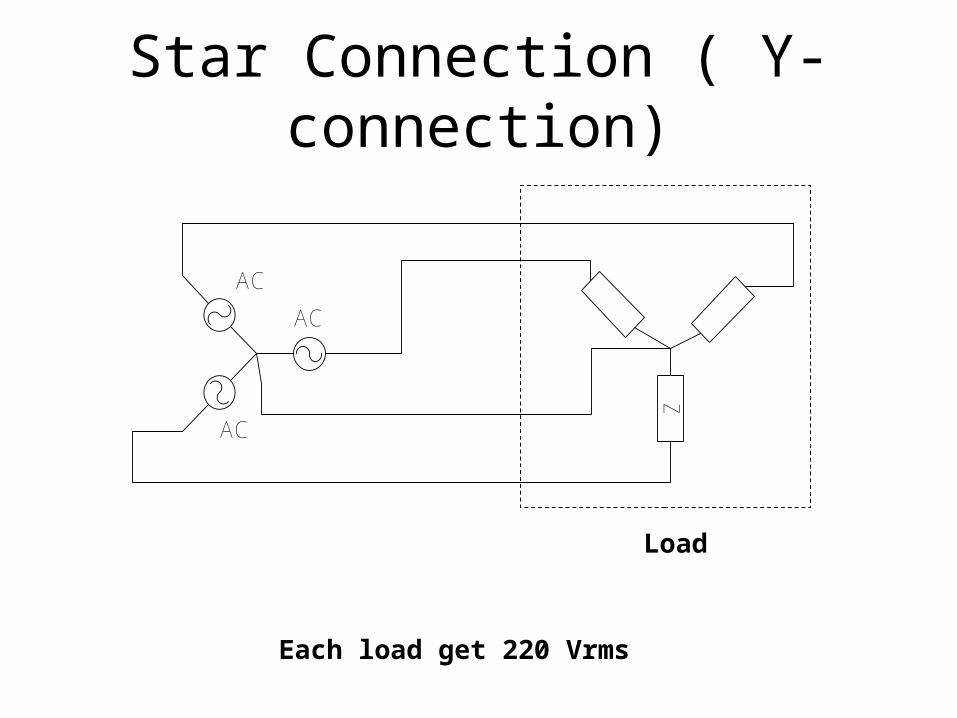
Star Connection ( Y-connection)
AC
AC
AC
Z
Load
Each load get 220 Vrms
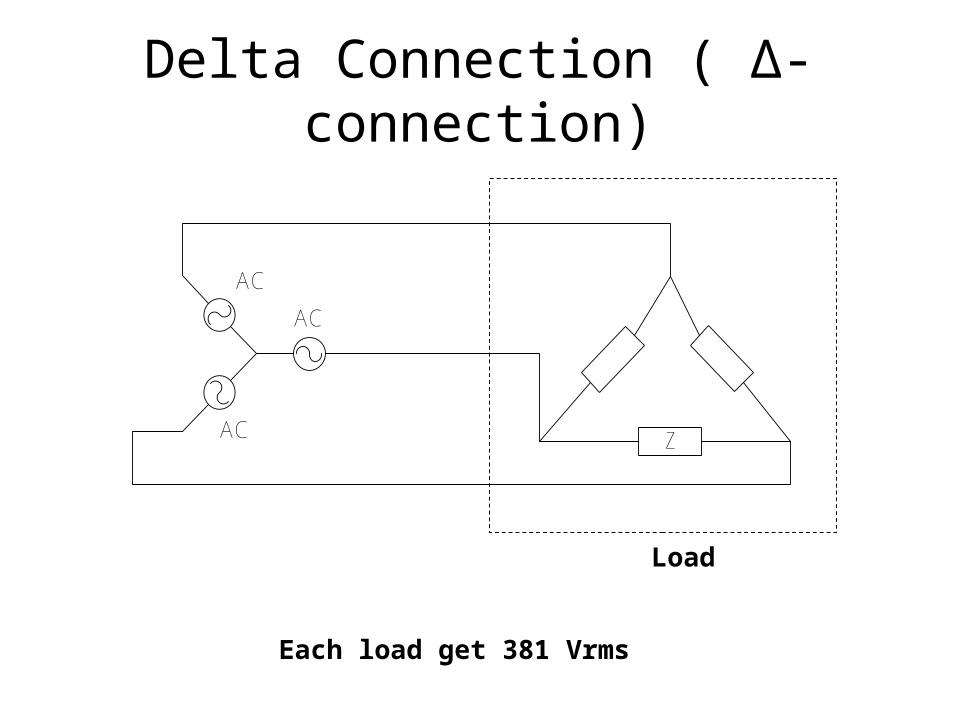
Delta Connection ( Δ-connection)
AC
AC
AC Z
Load
Each load get 381 Vrms


![[AIESEC] Welcome Week Presentation](https://static.fdocument.org/doc/165x107/55ab73551a28ab9b4b8b4589/aiesec-welcome-week-presentation.jpg)