ICOS ligation recruits the p50 α PI3K regulatory subunit to ...
1
INACTIVATION OF NF-κB P50 LEADS TO INSULIN SENSITIZATION IN LIVER THROUGH POST-TRANSLATIONAL INHIBITION OF P70S6K
Zhanguo Gao1, Jun Yin1, Jin Zhang1, Qing He1, Owen P. McGuinness2 and Jianping Ye1
From 1Pennington Biomedical Research Center, Louisiana State University System, Baton Rouge, Louisiana 70808; 2Department of Molecular Physiology and Biophysics, Vanderbilt University
Medical Center, Nashville, Tennessee, 37232. Running head: Regulation of S6K by NF-kB
Address correspondence to: Jianping Ye, MD, 6400 Perkins Road, Baton Rouge, LA 70808. Fax: 225-763-3030. E-mail: [email protected]
In this study, we investigated the metabolic
phenotype of the NF-κB p50 knockout (p50-KO) mice. Compared to the wild type mice, the p50-KO had an increase in food intake, but a decrease in body fat content. On chow diet, their blood glucose dropped much more than the wild type (WT) mice in the insulin tolerance test. Their glucose infusion rate was 30% higher than that of the WT mice in the hyperinsulinemic-euglycemic clamp. Their hepatic glucose production was suppressed more actively by insulin, and their insulin-induced glucose uptake was not altered in the skeletal muscle or adipose tissue. In the liver, their P70S6K (S6K1) protein was significantly lower, and TNF-α expression was much higher. Their S6K1 protein was reduced by TNF-α treatment in the primary culture of hepatocytes. The S6K1 reduction was blocked by the proteasome inhibitor MG132. In their liver, the IKK2 (IKKβ) activity was reduced together with IKKγ. Their S6K1 degradation was dependent on the IKK2 deficiency. Reconstitution of the S6K1 protein in their liver blocked the increase in insulin sensitivity. The S6K1 degradation was not observed in hepatocytes of the WT mice. The data suggest that inactivation of NF-κB p50 leads to suppression of the IKK2 activity in the liver. The IKK2 deficiency leads to S6K1 inhibition through TNF-induced protein degradation. The S6K1 reduction may contribute to insulin sensitivity in the p50-KO mice. The study suggests that hepatic S6K1 may be a drug target in the treatment of insulin resistance.
Chronic inflammation occurs in the adipose
tissue and liver in obesity (1,2). It is generally believed that inflammation contributes to pathogenesis of insulin resistance through
activation of IKK/NF-kB and JNK signaling pathways. The serine kinase IKK2 (IKKβ) contributes to insulin resistance by activation of transcription factor NF-kB (3-6) or induction of IRS-1 serine phosphorylation (7,8). Data from the IKK2 transgenic mice suggests that NF-kB may be involved in pathogenesis of insulin resistance (4). However, the role of NF-kB has not been directly tested by gene knockout in mice.
NF-kB contains two subunits, p50 (NF-kB1)
and p65 (RelA), in most cases. The p50 knockout (p50-KO) mice were first reported in 1995, in which the p50 gene was globally inactivated by gene deletion (9). The mice are normal in growth, but deficient in B lymphocyte function. The p50-KO mice have been used in the study of many biological systems including the immune system (10,11), muscle dystrophy (12), liver regeneration (13,14), aging (15) and brain function (16). However, the metabolic phenotype remains unclear in this line of KO mice. Whole body knockout of p65 (P65-KO) was reported in 1995 for embryonic lethality (17,18).
S6K1 (p70 ribosomal protein S6 kinase) is a
serine kinase in the PI3K/Akt signaling pathway. It mediates nutrient (amino acid and glucose) and insulin signals in the regulation of insulin sensitivity (19,20). Global inactivation of S6K1 in the knockout mice protects the mice against diet-induced insulin resistance (21). An increase in the S6K1 activity leads to insulin resistance in mice (22). In humans, inhibition of the S6K activity by rapamycin leads to protection against insulin resistance (23). S6K1 contributes to insulin resistance by phosphorylation of IRS-1 at several serine residues (24-28). However, it is largely unknown how S6K1 protein abundance is regulated in cells.
http://www.jbc.org/cgi/doi/10.1074/jbc.M109.007260The latest version is at JBC Papers in Press. Published on May 11, 2009 as Manuscript M109.007260
Copyright 2009 by The American Society for Biochemistry and Molecular Biology, Inc.
by guest on June 2, 2018http://w
ww
.jbc.org/D
ownloaded from
2
To collect direct evidence for regulation of
insulin resistance by NF-kB, we conducted hyperinsulinemic-euglycemic clamp assay in the p50-KO mice. The data suggest that global inactivation of NF-kB p50 enhances insulin sensitivity in mice primarily through the liver. The molecular mechanism is related to inhibition of the S6K1 activity through a proteasome-dependent mechanism, which is a consequence of increased TNF-α activity and reduced IKK2 activity in the liver of p50-KO mice.
Experimental Procedures Animal models- Male p50-KO (NF-kB1 KO) mice in the B6X129PF2 gene background were purchased at 4 weeks of age from the Jackson Laboratory (Bar Harbor, ME). The age- and gender-matched wild type mice in the same gene background were purchased and used as the control. The mice were subject to one week quarantine after arrival. All of the mice were housed at 4 mice/box in the animal facility with a 12:12-h light-dark cycle and constant temperature (22–24°C). The mice were free to access water and the chow diet. All procedures were performed in accordance with the National Institutes of Health guidelines for the care and use of animals and approved by the Institutional Animal Care and Use Committee at the Pennington Biomedical Research Center. High fat diet (HFD) – HFD (D12331, Research Diets, New Brunswick, NJ) contains 58% of kcal as fat. The mice were fed the HFD beginning at 5 wks of age. Their body weight and body composition were examined every two weeks. Cell culture and Reagents- Mouse embryonic fibroblast (MEFs) cell lines including WT and IKK2-KO (IKK2-/-) were described elsewhere (7). The cells were maintained in 10% FBS DMEM in a 5% CO2 incubator. The cells were starved in DMEM containing 0.2% fatty acid free BSA overnight before treatment with 10 ng/ml of TNF-α (T-6674 Sigma). Rapamycin (A-275) was purchased from Biomol International (Plymouth Meeting, PA). 15PdGJ2 (cat. #538927) was from Calbiochem (EMD, Gibbstown, NJ).
Nuclear magnetic resonance- Body composition was measured using quantitative nuclear magnetic
resonance (NMR) as described elsewhere (29). In the test, a 6 week old conscious and unrestrained mouse was placed into a small tube and then the tube was inserted into a Brucker model mq10
NMR analyzer (Brucker, Milton ON, Canada). The fat and lean mass were recorded within 1 min. Measurements were made in triplicate. Intraperitoneal glucose tolerance test (GTT) and insulin tolerance test (ITT) - GTT was conducted by i.p. injection of glucose at 250 mg/kg body weight in mice after an overnight fast. ITT was conducted by i.p. injection of insulin (I9278, Sigma) at 0.75 U/kg body weight in mice after a 4 hour fast as described elsewhere (29). Blood glucose was monitored in the tail vein blood using the FreeStyle blood glucose monitoring system (TheraSense, Phoenix, AZ). Hyperinsulinemic-euglycemic clamp- The p50-KO mice and wild type control mice were purchased from the Jackson laboratory at 5 weeks of age and shipped to the Mouse Metabolic Phenotype Center of Vanderbilt University (Nashville, Tennessee). The mice were fed a chow diet at the animal facility center of Vanderbilt University. The clamp was conducted in mice at 10 weeks of age. The clamp was performed in chronically catheterized (jugular vein and carotid artery) conscious mice after a 5-h-fast (29). Catheters were inserted 4-5 days prior to performing the clamp. Only mice returning to within ~10% of presurgical body weight were studied. The arterial catheter was used for blood sampling, and the venous catheter was used for infusing glucose, blood, tracers and insulin. Catheters were attached to a swivel. Mice were unrestrained and not handled thereafter to minimize stress. The clamp period (t=0–min) began at 1300 h. A primed continuous [3-3H] glucose infusion (5 μCi bolus and 0.05 μCi/min) was given at t = -120 min to measure glucose turnover. An insulin infusion was started at t = 0 min (2 mU/kg/min; Humulin R; Eli Lilly). Saline-washed erythrocytes were infused (5–6 μl/min) during the experimental period to prevent a ~5% fall in hematocrit. The [3-3H] glucose was increased to 0.1 μCi/min to minimize changes in specific activity. Glucose (5 μL) was measured
by guest on June 2, 2018http://w
ww
.jbc.org/D
ownloaded from
3
every 10 min, and euglycemia was maintained using a variable glucose infusion rate (GIR). Samples (10 μl) to determine glucose specific activity were taken at t =-5 min and every 10 min from t = 80–120 min. At t=120 min a bolus of [14C] 2-deoxyglucose was given and samples were taken at t=122,125,130,135,145 min. At t=145 min animals were anesthetized and tissues were collected and rapidly frozen for subsequent analysis. Samples (50 μl) were taken to measure plasma insulin at t = 0, 120, and 145 min. Western Blot- Fresh fat and muscles were collected and frozen in liquid nitrogen. The whole cell lysate protein was extracted in lysis buffer with sonication and analyzed in western blots as described elsewhere (29). Antibodies to IKK1 (sc-7182), IkBa (sc-371), IRS-1 (sc-7200), pIRS-1 Y632 (Y628 in mouse) (sc-17196), IRS-2 (sc-8299), IKKγ (sc-8330) and p65 (sc-8008x) were purchased from Santa Cruz. Antibodies to Tubulin (ab7291), Beta-Actin (ab6276), p50 (ab7971), pIRS-1 S636 (S632 in mouse) (ab53038) and S6K (ab9366) were from Abcam (Cambridge, UK). IKK2 antibody (05-535) was from Upstate, and pAkt Ser473 (KP24001) was from Calbiochem. pAkt Thr308 (#9275), pS6K (Thr389, #9205) and pIKK (IKK1Ser180/IKK2 Ser181, #2681) were from Cell Signaling Technology (Danvers, MA 01923). To detect multiple signals from one membrane, the membrane was stripped with a stripping buffer. S6K Reconstitution- The S6K adenovirus was constructed by subcloning of mouse S6K cDNA into the adenoviral vector in the ViraPower Adenoviral Expression System (K4930-00, Invitrogen Life Technologies, Carlsbad, CA). The S6K cDNA was amplified in PCR from a plasmid vector of HA-S6K1 (8984, Addgene, Cambridge, MA). Then, it was inserted into the adenovirus plasmid vector pAd/CMV/V5-DEST through the TOPO pENTR vector (K2400-20). The viral vector was transfected into 293A cells for virus production after digestion with the Pac I endonuclease. The adenovirus was purified and titrated according to the manufacturer’s instructions. The P50-/- mice were injected with the S6K adenovirus or GFP adenovirus at 1x10⁹ virus/mice at the age of 8 weeks through the tail
vein. Three days later, ITT was performed to evaluate insulin sensitivity after a 4 hour fast. Primary hepatocytes- The Primary hepatocytes were isolated from mice at 6 weeks of age according to the procedure described elsewhere (30). Briefly, the mice were anesthetized by i.p. injection of Ketamine at a dosage of 100 mg/kg body weight. The liver was first perfused with Ca2+-free Hanks' Balanced Solution (Invitrogen) at a rate of 5 ml/min for 8 min through the vena cava, and then followed by continuous perfusion for 12 min with serum-free Williams' Medium E (Invitrogen) containing collagenase (Worthington, Type II, 50 units/ml) and 10 mM HEPES. Hepatocytes were harvested after centrifugation on Percoll (Sigma). The purified hepatocytes were placed into collagen-coated plates in Williams' Medium E supplemented with 10% FBS for 24 hrs before experiment. The cytokine treatment was conducted in serum-free medium after overnight serum starvation. Quantative real-time RT-PCR- mRNA was examined in total RNA that was extracted from frozen tissues (kept at -80 oC) or cultured cells using Tri-Reagent (T9424, Sigma) as described elsewhere (31). Taqman RT-PCR primers and probes were used to determine mRNA for TNF-α (Mm00443258_m1), IL-6 (Mm00446190_m1), and S6K (Mm00659517_m1). The reagents were purchased from Applied Biosystems (Foster City, CA). Mouse ribosome 18S rRNA_s1 (without intron-exon junction) was used as an internal control. The mRNA result for each gene was normalized with the 18S signal. The reaction was conducted with a 7900 HT Fast real time PCR System (Applied Biosystems, Foster City, CA). Cytokine assay- Proteins for TNF-α and IL-6 were measured in the hepatocyte lysate using ELISA Kits (MTA00, and M6000B, R&D Systems, Inc., Minneapolis, MN 55413). The assay was conducted according to the manufacturer's instructions. Hematoxylin and Eosin (H&E) staining- The fresh liver was collected immediately after sacrifice of the mouse and fixed in 10% neutral buffered formalin solution (HT50-1-2, Sigma). The tissue slides were obtained through serial cross-section
by guest on June 2, 2018http://w
ww
.jbc.org/D
ownloaded from
4
cutting at 8 um thickness and processed with a standard procedure. Briefly, the slides were deparaffinated and stained in haematoxylin (#101542, Surgipath) for 15 min, and rinsed in water until sections were blue. Then, slides were stained in Eosin (E4009, Sigma), dehydrated quickly in 95% ethanol and treated with phenazine methosulfate. The sections were mounted and the image was taken with a Nikon microscope (Eclipse TS100, Japan). Statistical analysis- All in vitro experiments were repeated independently at least three times with consistent results. Signals in Western blots were quantified by densitometry using the NIH ImageJ software. Student’s t-test was used in statistical analysis of the data. P < 0.05 was considered as statistical significance.
RESULTS
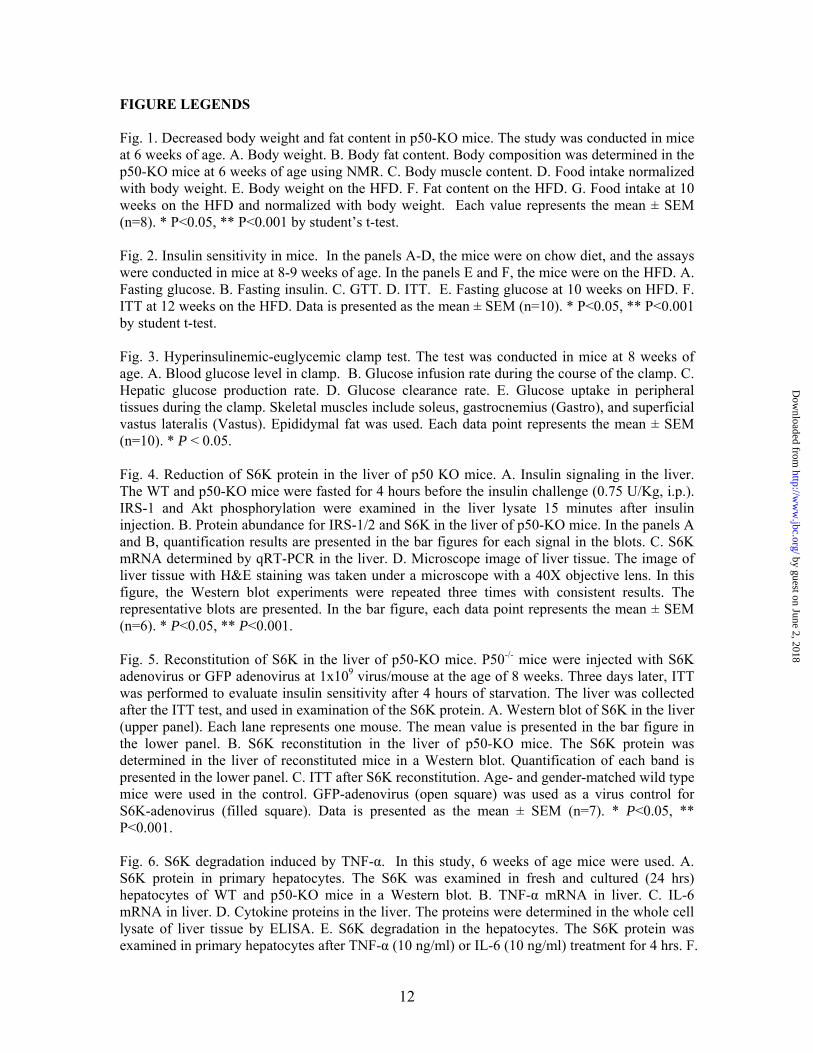
The p50-KO mice are lean and resistant to dietary obesity. The p50-KO mice are normal in development, growth and reproduction (9). To understand their metabolism, we monitored the body weight, fat mass, and food intake. Compared to the wild type (WT) mice, the p50-KO mice had 10% less body weight at 6 weeks of age (Fig. 1A). Their fat mass was 50% less (Fig. 1B). Their lean body mass was 3% higher (Fig. 1C). Their food intake was higher after normalization with body weight (Fig. 1D). On the high fat diet (HFD), these differences remained between the KO and WT mice. The KO mice were lower in the body weight and fat content (Fig. 1, E and F). Their food intake was higher than that of the WT mice (Fig. 1G). The data suggest that the p50-KO mice have a lean phenotype and are resistant to diet-induced obesity (DIO).
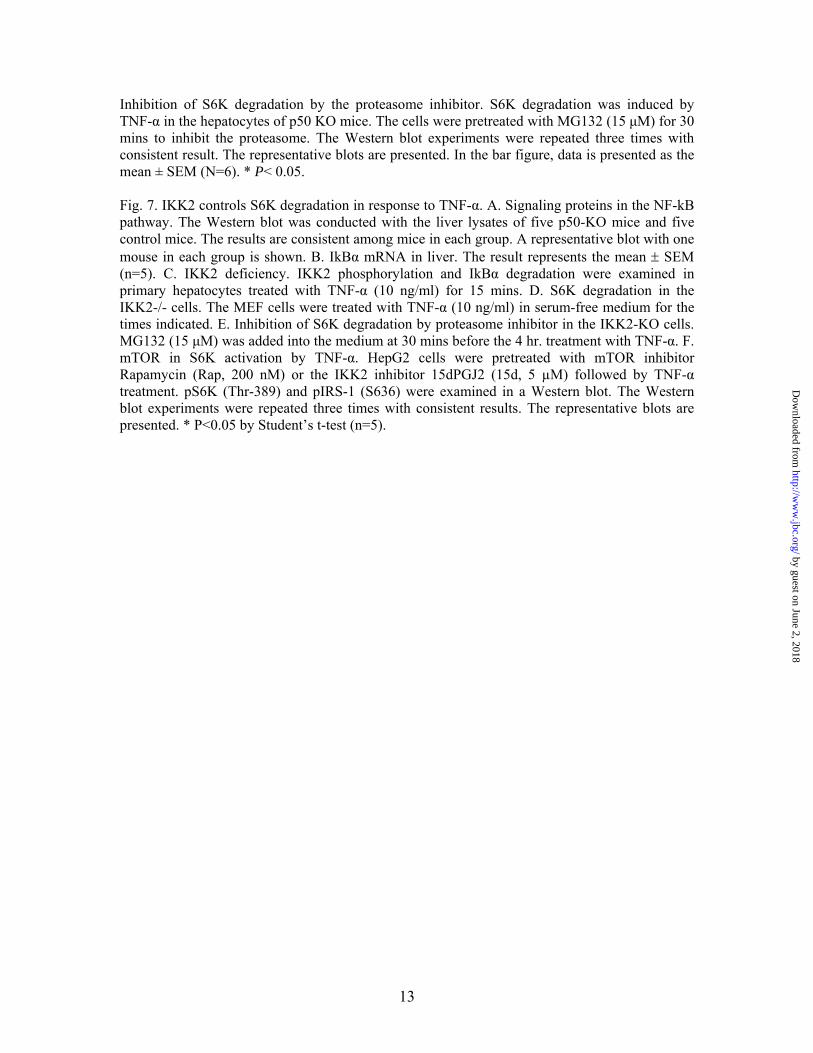
Insulin sensitivity is enhanced in the p50-KO
mice. The p50-KO mice were normal in fasting glucose, but their fasting insulin was lower compared to that of the WT mice (Fig. 2, A and B). Their glucose metabolism was evaluated in a glucose tolerance test (GTT) and an insulin tolerance test (ITT). Their glucose tolerance was not altered (Fig, 2C), but their insulin tolerance was enhanced significantly. The blood glucose dropped much faster in the KO mice as indicated by the ITT result (Fig. 2D), suggesting a higher
level of insulin sensitivity. On the HFD, the KO mice had a similar phenotype regarding glucose metabolism, as they exhibited an identical fasting glucose as the WT mice (Fig. 2E). Their insulin tolerance remained higher (Fig. 2F). In GTT, no difference was observed between the KO and WT mice (data not shown). The result suggests that the p50-KO mice are more sensitive to insulin, and they are protected from diet-induced insulin resistance.
The role of liver in the enhanced insulin
sensitivity. To identify the tissues/organs that are responsible for the increased insulin sensitivity, we performed the hyperinsulinemic-euglycemic clamp test in the p50-KO mice after a 5 hr fast. During the clamp, the blood glucose was maintained at the same level in the KO and WT mice (Fig. 3A). Arterial insulin concentration was increased from 0.5±0.1 to 1.3±0.2 ng/ml in the KO mice, and 0.9±0.1 to 1.7±0.2 ng/ml in the WT mice during the clamp. In the p50-KO mice, the glucose infusion rate was 30% higher (Fig. 3B), and the endogenous glucose production was suppressed by insulin more significantly. In the KO mice, the hepatic glucose production was almost not detectable during the clamp (Fig. 3C). In the WT mice, the hepatic glucose production was only suppressed by 40% of the basal level. The whole body glucose utilization rate was not different between the KO and WT mice (Fig. 3D). The tissue-specific glucose uptake was examined in the major insulin-sensitive tissues including soleus, vastus lateralis and gastrocnemius muscles, epididymal fat, diaphragm, and heart. The brain was examined as a negative control. No difference was observed between the KO and WT mice in most of the tissues although the glucose uptake was modestly increased in the vastus lateralis muscle of the KO mice (Fig. 3E). These results exclude the role of peripheral tissues, and highlight the role of liver in the insulin sensitivity in the p50-KO mice.
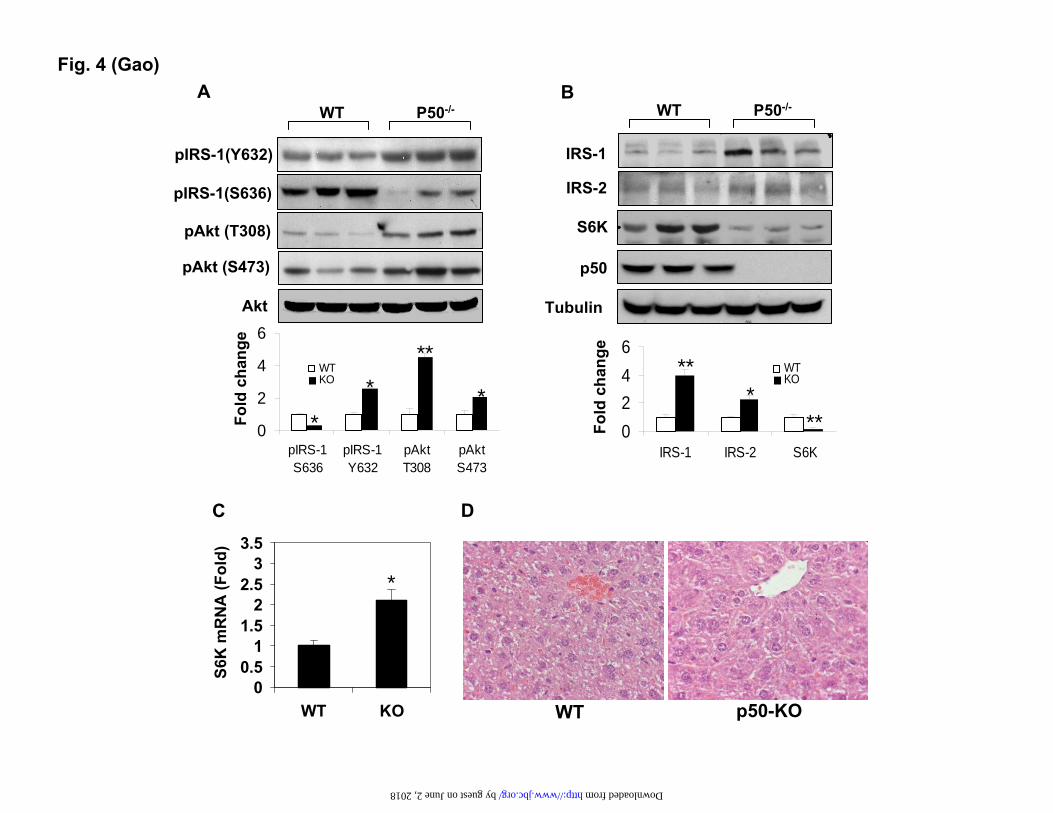
Increased IRS activities and reduced S6K protein in the liver. To understand the molecular mechanism of insulin sensitivity in the liver, we examined the insulin signaling pathway in the liver tissue after the mice were challenged with a bolus of insulin. The pathway activity was determined by phosphorylation status and protein
by guest on June 2, 2018http://w
ww
.jbc.org/D
ownloaded from
5
abundance of the signaling proteins. Tyrosine (Tyr) phosphorylation of IRS-1 is catalyzed by the insulin receptor, and is responsible for activation of PI3K/Akt kinases, which are required for the Glut4 translocation and glucose uptake. The tyrosine phosphorylation was monitored with a phospho-specific antibody to Tyr632 (Tyr628 in the mouse IRS-1), a parameter of the insulin receptor-activity (32). The tyrosine phosphorylation was enhanced in the p50-KO mice (Fig. 4A). Consistently, the Akt phosphorylation at Thr308 and Ser473 was increased in the KO mice (Fig. 4A), suggesting an enhancement in the insulin signaling activity. Serine phosphorylation of IRS-1 generally leads to inhibition of the insulin signaling, and often serves as an insulin resistance marker. We examined the IRS-1 serine phosphorylation with a phospho-specific antibody to S636, which is a target of S6K1 serine kinase in the human IRS-1 (S632 in the mouse IRS-1) (21,28). In the p50-KO mice, the IRS-1 serine phosphorylation was reduced significantly (Fig. 4A). The reduction was associated with a 2 fold elevation in the IRS-1 protein (Fig. 4B), suggesting less degradation of the IRS-1 protein. The serine phosphorylation usually promotes degradation of the IRS-1 protein. The protein abundance was also increased in the IRS-2 protein in the KO mice (Fig. 4B).
Interestingly, the protein abundance of S6K was dramatically reduced in the KO mice (Fig. 4B, S6K). As a major serine kinase in the negative feedback loop in the insulin signaling pathway, S6K may contribute to the increased insulin activity through the reduction in activity. S6K mRNA was examined, and its level was increased by 100% in the KO liver (Fig. 4C). Association of the increased mRNA with the reduced protein suggests a quick turnover of S6K protein in the liver of p50-KO mice. No change was observed in the protein abundance or phosphorylation in the insulin receptor (data not shown). Absence of the NF-kB p50 protein was confirmed in the liver of KO mice (Fig. 4B). Morphology of the liver was examined under a microscope. With H&E staining, no difference was observed in structure or cell morphology in the livers of control and KO mice (Fig. 4D).
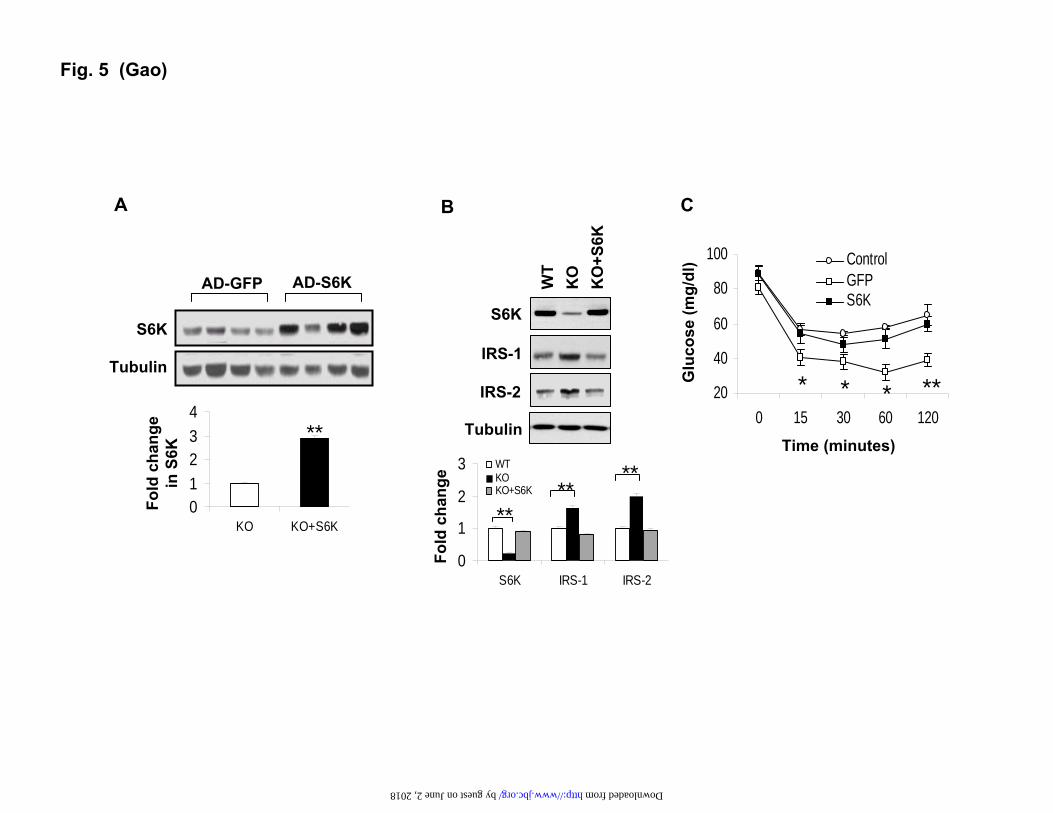
Reduced insulin sensitivity after reconstitution of S6K in liver. Given the role of S6K in the regulation of IRS-1 function (21,27,28,33), we hypothesized that loss of S6K might be responsible for the increased insulin sensitivity in the liver of p50-KO mice. To test this possibility, we restored the S6K protein abundance in the liver of p50-KO mice by expression of an exogenous S6K gene. The restoration was completed by injection of S6K adenovirus into the tail vein. The control mice were injected with a GFP adenovirus. In this model, the S6K protein was increased by 2 fold in the liver of KO mice (Fig. 5A). The restored level is comparable to that in the WT liver (Fig. 5B). After S6K restoration, the IRS-1 and IRS-2 proteins were reduced in the liver of KO mice reaching the levels comparable to those in the WT mice (Fig. 5B). ITT was conducted after S6K reconstitution to determine the insulin sensitivity. The difference in insulin sensitivity between the p50-KO and WT mice became undetectable following the restoration of S6K (Fig. 5C). These data suggest that the decrease in S6K activity may contribute to the insulin sensitization in the p50-KO mice.
S6K degradation in the hepatocytes of p50-KO
mice. To investigate the mechanism of S6K reduction, we examined the S6K protein in the primary hepatocytes of p50-KO mice. In the freshly-isolated hepatocytes, the S6K protein was significantly lower in the p50-KO mice (Fig. 6A). However, after 24 hrs in cell culture, the difference was no longer detectable, suggesting that the S6K degradation was dependent on the micro-environment in the liver. In search of the liver-associated factors, we examined gene expressions and observed an up-regulation of TNF-α and IL-6 in mRNA in the p50-KO mice (Fig. 6, B and C). In the p50-KO mice, expression of the two genes was 7 fold (TNF-α) and 9 fold (in IL-6) higher than those of WT mice, respectively. The increase was detected in protein as well in the liver lysates (Fig. 6D).
The increase in S6K mRNA in the liver of
p50-KO mice (Fig. 4C) suggests that the S6K protein reduction may not be a result of inhibition at the mRNA level. In an early study, we observed that TNF-α was able to induce serine phosphorylation of S6K (34). Protein degradation
by guest on June 2, 2018http://w
ww
.jbc.org/D
ownloaded from
6
is commonly observed after serine phosphorylation. It is possible that the serine modification is involved in the control of S6K1 protein stability. To test this possibility, we examined S6K1 degradation in primary hepatocytes after TNF-α treatment. A reduction in the S6K protein was observed in the cells of p50-KO mice, but not in those of the WT mice (Fig. 6E). When IL-6 was tested in the same system, no change was observed in the S6K protein. These data suggest that TNF-α is a key factor in the liver for the S6K reduction. The TNF-induced S6K degradation was blocked by the proteasome inhibitor MG132 (Fig. 6F), suggesting that the proteasome activity is required for the S6K degradation. This group of data suggests that in the absence P50, TNF-α may induce degradation of the S6K protein in a proteasome-dependent manner.
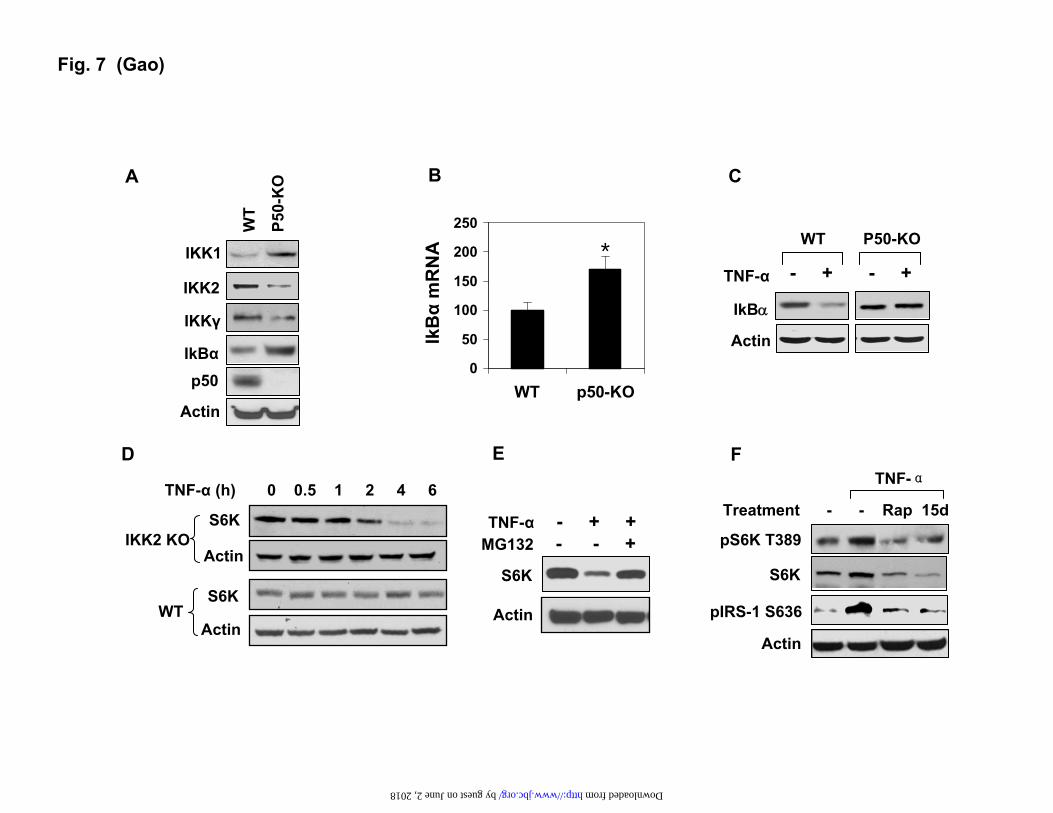
Decreased IKK2 activity in the p50-KO cells.
The above data suggest that the TNF-induced degradation is specific to the p50-KO hepatocytes. In search of the molecular mechanism, we examined the IKK2 activity since IKK2 was reported to induce S6K phosphorylation through mTOR (35). In the p50-KO liver, IKK2 protein was reduced by 70% in the whole cell lysate as shown by a Western blot (Fig. 7A). In the IKK complex, the IKK2 activity is usually controlled by IKKγ (NEMO). IKKγ was also reduced in the p50-KO cells. Interestingly, protein abundance in IKK1 (IKKα) and IkBα was increased more than 50% in the p50-KO cells (Fig. 7A). The increase in IkBα protein was consistent with elevated mRNA of IkBα (Fig. 7B), suggesting a constant elevation of transcriptional activity of NF-kB p65. To determine the signaling activity of IKK2 in the p50-KO cells, the IkBα degradation was examined in the primary hepatocytes. IkBα is a substrate of IKK2 and its degradation depends on IKK2-mediated phosphorylation. The degradation was induced by TNF-α in the WT cells, but not in the p50-KO cells (Fig. 7C). These data suggest that IKK2 activity is deficient in the KO cells.
Association of the IKK2 deficiency with the
S6K reduction led us to test the role of IKK2 in the control of S6K degradation. The IKK2-/- MEF cells were used in this study. In the WT MEF, S6K
protein was not changed by the TNF-α treatment. In the IKK2 null cells, the S6K degradation was induced by TNF-α (Fig. 7D). The degradation was time-dependent. At 4 hrs into the TNF-α treatment, 90% of S6K protein disappeared in the IKK2-/- MEFs. The degradation was completely inhibited by the proteasome inhibitor MG132 (Fig. 7E), but not influenced by inhibitors to JNK (SP600125, SP), mTOR (Rapamycin, Rap) or IKK2 (15dPGJ2, 15d) (data not shown). This group of data suggests a role of IKK2 in the control of the stability of the S6K protein.
mTOR controls S6K degradation. It was reported that both mTOR and IKK2 are required for S6K serine phosphorylation in response to TNF-α (35). If this pathway is deficient in the p50-KO mice, the phosphorylation of S6K by mTOR will be reduced. Such reduction may leads to the S6K protein degradation. To test this possibility, we examined S6K degradation after inhibition of mTOR or IKK2. Rapamycin was used to block the mTOR activity in the HepG2. As expected, Rapamycin reduced the S6K phosphorylation at Thr-389, and IRS-1 phosphorylation at Ser636 (Fig. 7F). IRS-1 is a substrate of S6K1. When IKK2 was inhibited by 15PdGJ2, a similar inhibition was observed in the S6K activity (Fig. 7F). In these conditions, S6K protein was reduced in the TNF-treated cells (Fig. 7F). In the absence of mTOR or IKK2 inhibition, S6K protein was increased by TNF-α. These data suggest that TNF-α induces S6K activation through the IKK2-mTOR pathway. This pathway may protect S6K from degradation.
DISCUSSION
The metabolic phenotype of p50-KO mice is
characterized by an increase in hepatic insulin sensitivity. The increase in insulin sensitivity is supported by the reduction in fasting insulin and enhancement in the insulin tolerance. The results from hyperinsulinemic-euglycemic clamp suggest that the liver contributes to the increase in the glucose infusion rate in the p50-KO mice. The clamp study suggests that the peripheral tissues may not contribute to the insulin sensitivity since the glucose uptake was not significantly changed in the skeletal muscles and fat tissues. Additionally, the p50-KO mice are lean and
by guest on June 2, 2018http://w
ww
.jbc.org/D
ownloaded from
7
protected against diet-induced obesity. The mechanism of the lean phenotype may be related to the increase in energy expenditure in the KO mice.
The cellular and molecular mechanisms were
investigated for insulin sensitivity in the liver. The result suggests that the IKK2 activity is reduced in the p50-KO liver. This was observed with elevated expression of NF-kB target genes (TNF-α, IkBα, and IL-6), suggesting an elevation of the transcriptional activity of NF-kB p65. This is not surprising as p50 inhibits the p65 activity in the transcriptional activation of target genes (36,37). The IKK2 inhibition may be a result of negative feedback in the NF-kB pathway. Although p50-KO mice have been used in a variety of studies (10-16), the IKK2 activity was not examined in those studies. We believe that expression of NF-kB target genes, such as A20 (38,39) or CYLD (40), two cytoplasmic proteins (40,41), may contribute to the IKK2 inhibition. A20 and CYLD act through modification of ubiquitination. A20 is able to inactivate IKKγ in the IKK complex through deubiquitination (42). We observed that the IKKγ protein was reduced together with IKK2 in the liver of p50-KO mice.
The current study enriches the concept about
inflammation in the regulation of insulin sensitivity. In the inflammation signaling pathway, the IKK2 activity contributes to the development of insulin resistance in the liver (4,43). In transgenic mice, over-expression of IKK2 decreased insulin sensitivity (4), and knockout of IKK2 protected mice from insulin resistance (43). The IKK2 deficiency from IKKγ knockout also enhanced insulin sensitivity in mice (44). These studies suggest that in the absence of IKK2 activity, inflammation will not be able to induce insulin resistance. However, it was not tested if insulin sensitivity is enhanced over the control when IKK2 is inhibited. In the current study, our data suggest that inflammation enhances insulin sensitivity when IKK2 is deficient in the liver.
The current study suggests a new role of IKK2
in the regulation of S6K activity. IKK2 was reported to induce S6K phosphorylation through mTOR (35). The report provides a link between IKK2 and S6K in the TNF-α signaling pathway.
However, it is not clear if the IKK2-induced phosphorylation controls stability of the S6K protein. Our data suggest that the IKK2-mediated S6K phosphorylation acts to stabilize the protein in the physiological condition. In the absence of IKK2 activity, the S6K protein will be degraded in response to TNF-α. This was observed in the p50-KO hepatocytes, the IKK2 null cells, and cells treated with the IKK2 inhibitor. With normal activity, IKK2 should protect S6K from degradation in the wild type cells.
Hepatic S6K represents a new target for
insulin sensitization. In the molecular mechanism of insulin signaling, TNF-α activates multiple serine kinases including IKK2, JNK or S6K (1,34). Signal integration of these serine kinases remains to be investigated. The current study suggests that signals of IKK2 and S6K are integrated in the TNF-α signaling pathway. S6K inhibits insulin sensitivity by phosphorylation of IRS-1 proteins at several serine residues (21,27,28,33). In the liver of p50-KO mice, the IRS-1 phosphorylation was enhanced at Y632, and reduced at S636. These changes were associated with the increase in IRS-1/IRS-2 proteins, and elevated phosphorylation of Akt (T308 and S473). This pattern of changes provides a molecular mechanism of insulin sensitization in the liver of KO mice. Restoration of S6K activity by the S6K adenovirus reversed insulin sensitivity in the KO mice. The data suggest a critical role of S6K in the liver. It is expected that inhibition of the hepatic S6K by a pharmacological agent should improve insulin sensitivity.
The proteasome-mediated degradation of S6K
may represent a new level of S6K regulation. In the PI3K/Akt/mTOR pathway, S6K activity is regulated by serine phosphorylation from the mTOR kinase. In the p50-KO mice, the phosphorylation catalyzed by the IKK2-mTOR pathway may not lead to the S6K degradation. The association of deficiency in this pathway with S6K degradation suggests that mTOR may protect S6K from degradation. Regulation of S6K protein by degradation is largely unknown. Two recent studies suggest that a recombinant S6K protein can be ubiquitinated and degraded in a proteasome-dependent manner (45,46). However, the full length S6K protein was not used in the
by guest on June 2, 2018http://w
ww
.jbc.org/D
ownloaded from
8
studies. It is not clear if the full length S6K protein is subject to the degradation. Additionally, it is not clear under what biological conditions the S6K degradation occurs. We found that the full length S6K was degraded in response to TNF-α in the p50-KO hepatocytes.
In the current study, TNF-α was shown to
induce degradation of endogenous S6K in the p50-KO cells. Absence of IKK2 activation is required for the TNF-activity, suggesting that mTOR activation by IKK2 may protect S6K protein from degradation induced by TNF-α. The S6K reduction was detected in the freshly-isolated hepatocytes, but not in cultured primary hepatocytes. This conditional degradation might be related to dilution of TNF-α by the culture medium or loss of Kupffer cells, which are macrophage-like cells in the liver with a strong potential in the TNF-α production. In the cultured primary hepatocytes, addition of exogenous TNF-α led to degradation of the S6K protein in the p50-KO cells, but not in the WT cells.
The current study was based on comparison of
p50-KO mice with wild type mice. Compensation of gene deficiency is a common biological response to gene knockout in animal models. In some cases, the compensation may lead to an unpredictable phenotype. The current study
presents a unique phenotype in p50 KO mice. Compensation for the absence of the p50 gene may contribute to the phenotype. In the human body, the complete loss of p50 function may not occur. Such a phenotype may not apply to humans. However, the study suggests that hepatic S6K may be a drug target in the treatment of insulin resistance.
In summary, the metabolic phenotypes and
molecular mechanisms have been studied in the p50-KO mice with a focus on insulin sensitivity. Based on the findings, we proposed a molecular mechanism of insulin sensitivity in the p50-KO mice. In the absence of NF-kB p50, the S6K inhibition leads to the insulin sensitization by increasing the IRS-1 and IRS-2 activities in the liver. The S6K inhibition is from the S6K protein degradation that is induced by TNF-α, whose expression is increased in the liver through the elevated transcriptional activity of NF-kB p65. The TNF-induced S6K degradation is dependent on reduction in the IKK2 activity, which is decreased in the liver probably through a negative feedback from the enhanced activity of NF-kB p65. The data suggest that hepatic S6K is a potential target in the treatment of insulin resistance.
REFERENCES
1. Hotamisligil, G. S. (2006) Nature 444, 860-867 2. Shoelson, S. E., Lee, J., and Goldfine, A. B. (2006) J. Clin. Invest. 116, 1793-1801 3. Yuan, M., Konstantopoulos, N., Lee, J., Hansen, L., Li, Z. W., Karin, M., and Shoelson, S. E.
(2001) Science 293, 1673-1677. 4. Cai, D., Yuan, M., Frantz, D. F., Melendez, P. A., Hansen, L., Lee, J., and Shoelson, S. E. (2005)
Nat Med 11, 183-190 5. Greten, F. R., Eckmann, L., Greten, T. F., Park, J. M., Li, Z. W., Egan, L. J., Kagnoff, M. F., and
Karin, M. (2004) Cell 118, 285-296 6. Gao, Z., He, Q., Peng, B., Chiao, P. J., and Ye, J. (2006) J Biol Chem 281, 4540-4547 7. Gao, Z., Hwang, D., Bataille, F., Lefevre, M., York, D., Quon, M. J., and Ye, J. (2002) J Biol
Chem 277, 48115-48121 8. Herschkovitz, A., Liu, Y.-F., Ilan, E., Ronen, D., Boura-Halfon, S., and Zick, Y. (2007) J. Biol.
Chem. 282, 18018-18027 9. Sha, W. C., Liou, H. C., Tuomanen, E. I., and Baltimore, D. (1995) Cell 80, 321-330. 10. Zhong, H., Voll, R. E., and Ghosh, S. (1998) Mol Cell 1, 661-671 11. Bohuslav, J., Kravchenko, V. V., Parry, G. C. N., Erlich, J. H., Gerondakis, S., Mackman, N., and
Ulevitch, R. J. (1998) J. Clin. Invest. 102, 1645-1652 12. Hunter, R. B., and Kandarian, S. C. (2004) J. Clin. Invest. 114, 1504-1511
by guest on June 2, 2018http://w
ww
.jbc.org/D
ownloaded from
9
13. Tharappel, J. C., Nalca, A., Owens, A. B., Ghabrial, L., Konz, E. C., Glauert, H. P., and Spear, B. T. (2003) Toxicol Sci 75, 300-308
14. Tharappel, J. C., Spear, B. T., and Glauert, H. P. (2008) Toxicol Appl Pharmacol 226, 338-344 15. Lu, Z. Y., Yu, S. P., Wei, J. F., and Wei, L. (2006) Neuroscience 139, 965-978 16. Jhaveri, K. A., Ramkumar, V., Trammell, R. A., and Toth, L. A. (2006) Am J Physiol Regul Integr
Comp Physiol 291, R1516-1526 17. Beg, A. A., Sha, W. C., Bronson, R. T., Ghosh, S., and Baltimore, D. (1995) Nature 376, 167-170. 18. Doi, T. S., Takahashi, T., Taguchi, O., Azuma, T., and Obata, Y. (1997) J Exp Med 185, 953-961. 19. Patti, M. E., and Kahn, B. B. (2004) Nat Med 10, 1049-1050 20. Um, S. H., D'Alessio, D., and Thomas, G. (2006) Cell Metab 3, 393-402 21. Um, S. H., Frigerio, F., Watanabe, M., Picard, F., Joaquin, M., Sticker, M., Fumagalli, S.,
Allegrini, P. R., Kozma, S. C., Auwerx, J., and Thomas, G. (2004) Nature 431, 200-205 22. Le Bacquer, O., Petroulakis, E., Paglialunga, S., Poulin, F., Richard, D., Cianflone, K., and
Sonenberg, N. (2007) J. Clin. Invest. 117, 387-396 23. Krebs, M., Brunmair, B., Brehm, A., Artwohl, M., Szendroedi, J., Nowotny, P., Roth, E., Furnsinn,
C., Promintzer, M., Anderwald, C., Bischof, M., and Roden, M. (2007) Diabetes 56, 1600-1607 24. Ozes, O. N., Akca, H., Mayo, L. D., Gustin, J. A., Maehama, T., Dixon, J. E., and Donner, D. B.
(2001) Proc Natl Acad Sci U S A 98, 4640-4645 25. Harrington, L. S., Findlay, G. M., Gray, A., Tolkacheva, T., Wigfield, S., Rebholz, H., Barnett, J.,
Leslie, N. R., Cheng, S., Shepherd, P. R., Gout, I., Downes, C. P., and Lamb, R. F. (2004) J Cell Biol 166, 213-223
26. Carlson, C. J., White, M. F., and Rondinone, C. M. (2004) Biochem Biophys Res Commun 316, 533-539
27. Tremblay, F., Brule, S., Hee Um, S., Li, Y., Masuda, K., Roden, M., Sun, X. J., Krebs, M., Polakiewicz, R. D., Thomas, G., and Marette, A. (2007) PNAS 104, 14056-14061
28. Zhang, J., Gao, Z., Yin, J., Quon, M. J., and Ye, J. (2008) J Biol Chem 283, 35375-35382 29. Gao, Z., Wang, Z., Zhang, X., Butler, A. A., Zuberi, A., Gawronska-Kozak, B., Lefevre, M., York,
D., Ravussin, E., Berthoud, H. R., McGuinness, O., Cefalu, W. T., and Ye, J. (2007) Am J Physiol Endocrinol Metab 292, E84-91
30. Liu, H.-Y., Collins, Q. F., Xiong, Y., Moukdar, F., Lupo, E. G., Jr., Liu, Z., and Cao, W. (2007) J. Biol. Chem. 282, 14205-14212
31. Ye, J., Gao, Z., Yin, J., and He, H. (2007) Am J Physiol Endocrinol Metab 293, E1118-E1128 32. Esposito, D. L., Li, Y., Cama, A., and Quon, M. J. (2001) Endocrinology 142, 2833-2840 33. Khamzina, L., Veilleux, A., Bergeron, S., and Marette, A. (2005) Endocrinology 146, 1473-1481 34. Gao, Z., Zuberi, A., Quon, M., Dong, Z., and Ye, J. (2003) J Biol Chem 278, 24944-24950 35. Lee, D.-F., Kuo, H.-P., Chen, C.-T., Hsu, J.-M., Chou, C.-K., Wei, Y., Sun, H.-L., Li, L.-Y., Ping,
B., Huang, W.-C., He, X., Hung, J.-Y., Lai, C.-C., Ding, Q., Su, J.-L., Yang, J.-Y., Sahin, A. A., Hortobagyi, G. N., Tsai, F.-J., Tsai, C.-H., and Hung, M.-C. (2007) Cell 130, 440-455
36. Ballard, D. W., Dixon, E. P., Peffer, N. J., Bogerd, H., Doerre, S., Stein, B., and Greene, W. C. (1992) Proc Natl Acad Sci U S A 89, 1875-1879
37. Ruben, S. M., Narayanan, R., Klement, J. F., Chen, C. H., and Rosen, C. A. (1992) Mol Cell Biol 12, 444-454
38. Opipari, A. W., Jr., Hu, H. M., Yabkowitz, R., and Dixit, V. M. (1992) J. Biol. Chem. 267, 12424-12427
39. Zhang, S. Q., Kovalenko, A., Cantarella, G., and Wallach, D. (2000) Immunity 12, 301-311 40. Kovalenko, A., Chable-Bessia, C., Cantarella, G., Israel, A., Wallach, D., and Courtois, G. (2003)
Nature 424, 801-805 41. Song, H. Y., Rothe, M., and Goeddel, D. V. (1996) Proc Natl Acad Sci U S A 93, 6721-6725 42. Mauro, C., Pacifico, F., Lavorgna, A., Mellone, S., Iannetti, A., Acquaviva, R., Formisano, S.,
Vito, P., and Leonardi, A. (2006) J Biol Chem 281, 18482-18488 43. Arkan, M. C., Hevener, A. L., Greten, F. R., Maeda, S., Li, Z. W., Long, J. M., Wynshaw-Boris,
A., Poli, G., Olefsky, J., and Karin, M. (2005) Nat Med 11, 191-198 44. Wunderlich, F. T., Luedde, T., Singer, S., Schmidt-Supprian, M., Baumgartl, J., Schirmacher, P.,
Pasparakis, M., and Bruning, J. C. (2008) Proc Natl Acad Sci U S A 105, 1297-1302 45. Panasyuk, G., Nemazanyy, I., Filonenko, V., and Gout, I. (2008) Biochem Biophys Res Commun
369, 339-343
by guest on June 2, 2018http://w
ww
.jbc.org/D
ownloaded from
10
46. Wang, M. L., Panasyuk, G., Gwalter, J., Nemazanyy, I., Fenton, T., Filonenko, V., and Gout, I. (2008) Biochem Biophys Res Commun 369, 382-387
by guest on June 2, 2018http://w
ww
.jbc.org/D
ownloaded from
11
ACKNOWLEDGEMENT
We highly appreciate support from Dr. Jianhua Shao at the University of Kentucky in purification of adenovirus and conduction of S6K reconstitution in the p50-KO mice. We highly appreciate the outstanding editorial support from Dr. Michael Keenan at the Department of Human Ecology, LSU. This study is supported by NIH fund (DK68036) and ADA research award (7-07-RA-189) to J. Ye. The qRT-PCR study was conducted in the genomic core that is supported by the CNRU Grant (1P30 DK072476) from NIDDK. Hyperinsulinemic-euglycemic clamp studies were performed at the Vanderbilt Mouse Metabolic Phenotyping Center which was supported by U24-DK59637.
FOOTNOTES The abbreviations used are: DIO, diet-induced obesity; HFD, high fat diet, 58% calorie in fat; IkBα, inhibitor kappa B alpha; IKK2, IkBα kinase 2 (IKKβ); JNK, c-JUN NH2 terminal kinase; NF-kB, nuclear factor kappa B; p50 (NF-kB1), NF-kB p50 subunit; p65 (RelA), NF-kB p65 subunit; S6K, p70 ribosomal protein S6 kinase; TNF-α, tumor necrosis factor alpha; mTOR, mammalian target of rapamycin.
by guest on June 2, 2018http://w
ww
.jbc.org/D
ownloaded from
12
FIGURE LEGENDS Fig. 1. Decreased body weight and fat content in p50-KO mice. The study was conducted in mice at 6 weeks of age. A. Body weight. B. Body fat content. Body composition was determined in the p50-KO mice at 6 weeks of age using NMR. C. Body muscle content. D. Food intake normalized with body weight. E. Body weight on the HFD. F. Fat content on the HFD. G. Food intake at 10 weeks on the HFD and normalized with body weight. Each value represents the mean ± SEM (n=8). * P<0.05, ** P<0.001 by student’s t-test.
Fig. 2. Insulin sensitivity in mice. In the panels A-D, the mice were on chow diet, and the assays were conducted in mice at 8-9 weeks of age. In the panels E and F, the mice were on the HFD. A. Fasting glucose. B. Fasting insulin. C. GTT. D. ITT. E. Fasting glucose at 10 weeks on HFD. F. ITT at 12 weeks on the HFD. Data is presented as the mean ± SEM (n=10). * P<0.05, ** P<0.001 by student t-test. Fig. 3. Hyperinsulinemic-euglycemic clamp test. The test was conducted in mice at 8 weeks of age. A. Blood glucose level in clamp. B. Glucose infusion rate during the course of the clamp. C. Hepatic glucose production rate. D. Glucose clearance rate. E. Glucose uptake in peripheral tissues during the clamp. Skeletal muscles include soleus, gastrocnemius (Gastro), and superficial vastus lateralis (Vastus). Epididymal fat was used. Each data point represents the mean ± SEM (n=10). * P < 0.05. Fig. 4. Reduction of S6K protein in the liver of p50 KO mice. A. Insulin signaling in the liver. The WT and p50-KO mice were fasted for 4 hours before the insulin challenge (0.75 U/Kg, i.p.). IRS-1 and Akt phosphorylation were examined in the liver lysate 15 minutes after insulin injection. B. Protein abundance for IRS-1/2 and S6K in the liver of p50-KO mice. In the panels A and B, quantification results are presented in the bar figures for each signal in the blots. C. S6K mRNA determined by qRT-PCR in the liver. D. Microscope image of liver tissue. The image of liver tissue with H&E staining was taken under a microscope with a 40X objective lens. In this figure, the Western blot experiments were repeated three times with consistent results. The representative blots are presented. In the bar figure, each data point represents the mean ± SEM (n=6). * P<0.05, ** P<0.001. Fig. 5. Reconstitution of S6K in the liver of p50-KO mice. P50-/- mice were injected with S6K adenovirus or GFP adenovirus at 1x10⁹ virus/mouse at the age of 8 weeks. Three days later, ITT was performed to evaluate insulin sensitivity after 4 hours of starvation. The liver was collected after the ITT test, and used in examination of the S6K protein. A. Western blot of S6K in the liver (upper panel). Each lane represents one mouse. The mean value is presented in the bar figure in the lower panel. B. S6K reconstitution in the liver of p50-KO mice. The S6K protein was determined in the liver of reconstituted mice in a Western blot. Quantification of each band is presented in the lower panel. C. ITT after S6K reconstitution. Age- and gender-matched wild type mice were used in the control. GFP-adenovirus (open square) was used as a virus control for S6K-adenovirus (filled square). Data is presented as the mean ± SEM (n=7). * P<0.05, ** P<0.001. Fig. 6. S6K degradation induced by TNF-α. In this study, 6 weeks of age mice were used. A. S6K protein in primary hepatocytes. The S6K was examined in fresh and cultured (24 hrs) hepatocytes of WT and p50-KO mice in a Western blot. B. TNF-α mRNA in liver. C. IL-6 mRNA in liver. D. Cytokine proteins in the liver. The proteins were determined in the whole cell lysate of liver tissue by ELISA. E. S6K degradation in the hepatocytes. The S6K protein was examined in primary hepatocytes after TNF-α (10 ng/ml) or IL-6 (10 ng/ml) treatment for 4 hrs. F.
by guest on June 2, 2018http://w
ww
.jbc.org/D
ownloaded from
13
Inhibition of S6K degradation by the proteasome inhibitor. S6K degradation was induced by TNF-α in the hepatocytes of p50 KO mice. The cells were pretreated with MG132 (15 μM) for 30 mins to inhibit the proteasome. The Western blot experiments were repeated three times with consistent result. The representative blots are presented. In the bar figure, data is presented as the mean ± SEM (N=6). * P< 0.05. Fig. 7. IKK2 controls S6K degradation in response to TNF-α. A. Signaling proteins in the NF-kB pathway. The Western blot was conducted with the liver lysates of five p50-KO mice and five control mice. The results are consistent among mice in each group. A representative blot with one mouse in each group is shown. B. IkBα mRNA in liver. The result represents the mean ± SEM (n=5). C. IKK2 deficiency. IKK2 phosphorylation and IkBα degradation were examined in primary hepatocytes treated with TNF-α (10 ng/ml) for 15 mins. D. S6K degradation in the IKK2-/- cells. The MEF cells were treated with TNF-α (10 ng/ml) in serum-free medium for the times indicated. E. Inhibition of S6K degradation by proteasome inhibitor in the IKK2-KO cells. MG132 (15 μM) was added into the medium at 30 mins before the 4 hr. treatment with TNF-α. F. mTOR in S6K activation by TNF-α. HepG2 cells were pretreated with mTOR inhibitor Rapamycin (Rap, 200 nM) or the IKK2 inhibitor 15dPGJ2 (15d, 5 µM) followed by TNF-α treatment. pS6K (Thr-389) and pIRS-1 (S636) were examined in a Western blot. The Western blot experiments were repeated three times with consistent results. The representative blots are presented. * P<0.05 by Student’s t-test (n=5).
by guest on June 2, 2018http://w
ww
.jbc.org/D
ownloaded from
0
4
8
12
Fig. 1 (Gao)
Fat %
BW
WT KO
A B D
*
Food
(g/g
BW
/d)
WT KO
C
BW
(g)
010
2030
WT KO
*
00.05
0.10.15
0.2 *
WT KO
Mus
cle
% B
W
70
80
90**
E F
Weeks on HFD
G
45
35
25
150 4 8 12 16 20
BW
(g)
*********1 2 3 4 5 6 7 8 9 10
Day
** ** ******
0.020.040.060.080.100.12 p50 WT
p50 KOp50 WTp50 KO
0 4 8 12 16 20Weeks on HFD
40
20
0
p50 WTp50 KO
Fat %
BW
*********** Food
(g/g
BW
/d)
by guest on June 2, 2018 http://www.jbc.org/ Downloaded from
C
D
400
200
0Glu
cose
(mg/
dl)
0 15 30 60 120Minutes
Glu
cose
(mg/
dl)
A B
Fig. 2 (Gao)
WT KO0
50
100
150
0
50
100
150
200
pg/m
l
WT KO
mg/
dl
**
0
50
100
150
Minutes
***
**
F
Minutesm
g/dL
E
0
50
100
150
200
mg/
dl
WT KO0
75150225300
p50 WTp50 KO
p50 WTp50 KO
0 15 30 60 1200 15 30 60 120
p50 WTp50 KO
** ** **
by guest on June 2, 2018 http://www.jbc.org/ Downloaded from
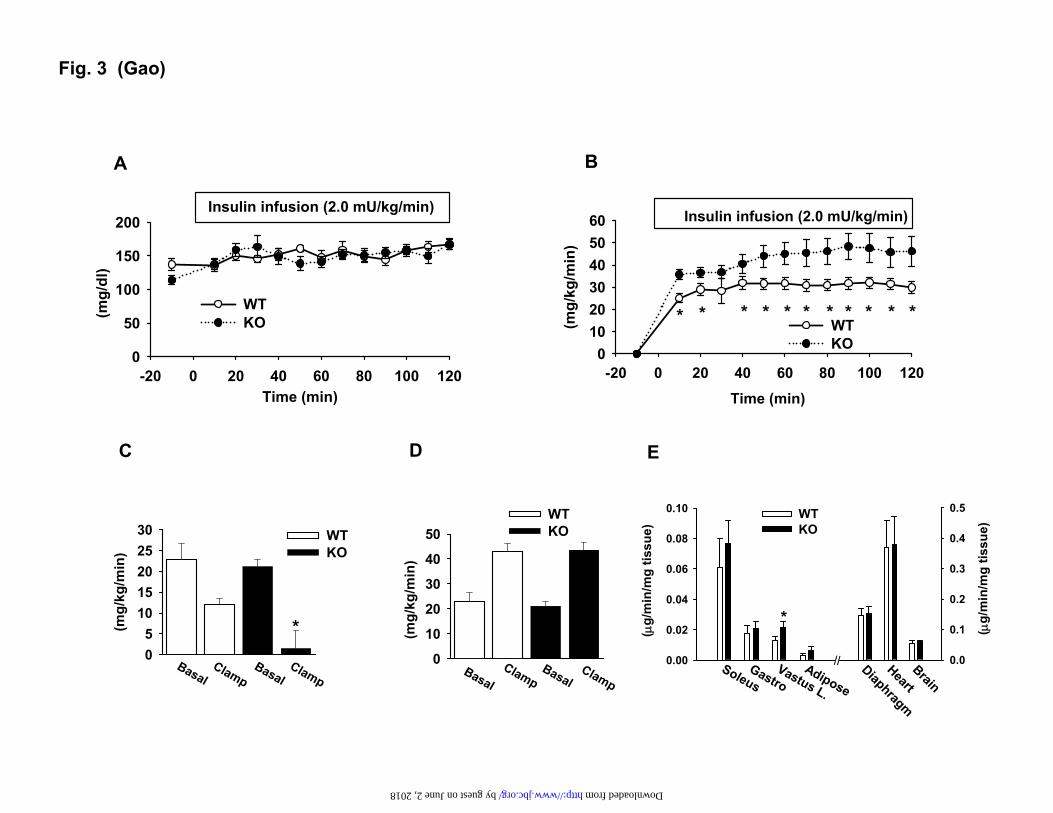
Fig. 3 (Gao)
-20 0 20 40 60 80 100 120
(m
g/dl
)
0
50
100
150
200
WTKO
Insulin infusion (2.0 mU/kg/min)
Time (min)
*
-20 0 20 40 60 80 100 120
(mg/
kg/m
in)
0102030405060
WTKO
Time (min)
Insulin infusion (2.0 mU/kg/min)
* * * * * * * * ** *
A BDiaphragmHeartBrain
0.0
0.1
0.2
0.3
0.4
0.5
SoleusGastro
Vastus L.
Adipose
0.00
0.02
0.04
0.06
0.08
0.10 WTKO
( μg/
min
/mg
tissu
e)
( μg/
min
/mg
tissu
e)
//
*
ED
(mg/
kg/m
in)
0
10
20
30
40
50WTKO
BasalClamp
BasalClamp
C
(mg/
kg/m
in)
05
1015202530 WT
KO
BasalClamp
BasalClamp
*
by guest on June 2, 2018 http://www.jbc.org/ Downloaded from
WT P50-/-B
IRS-1
Tubulin
p50
S6K
Fig. 4 (Gao)
pAkt (S473)
Akt
AWT P50-/-
S6K
mR
NA
(Fol
d)
C
IRS-2
00.5
11.5
22.5
33.5
WT KO
*
WT p50-KO
D
pAkt (T308)
pIRS-1(Y632)
Fold
cha
nge
0
2
4
6
pIRS-1S636
pIRS-1Y632
pAktT308
pAktS473
WTKO
*
**
**
0246
IRS-1 IRS-2 S6K
WTKO
Fold
cha
nge
***
**
pIRS-1(S636)
by guest on June 2, 2018 http://www.jbc.org/ Downloaded from
S6K
Tubulin
AD-GFP AD-S6K
A
Fig. 5 (Gao)
WT
KO
KO
+S6K
B C
Tubulin
S6K
IRS-1
IRS-2 * **
Time (minutes)
Glu
cose
(mg/
dl)
*20
40
60
80
100
0 15 30 60 120
ControlGFPS6K
*
Fold
cha
nge
in S
6K
01234
KO KO+S6K
**Fo
ld c
hang
e
0
1
2
3
S6K IRS-1 IRS-2
WTKOKO+S6K
****
**
by guest on June 2, 2018 http://www.jbc.org/ Downloaded from
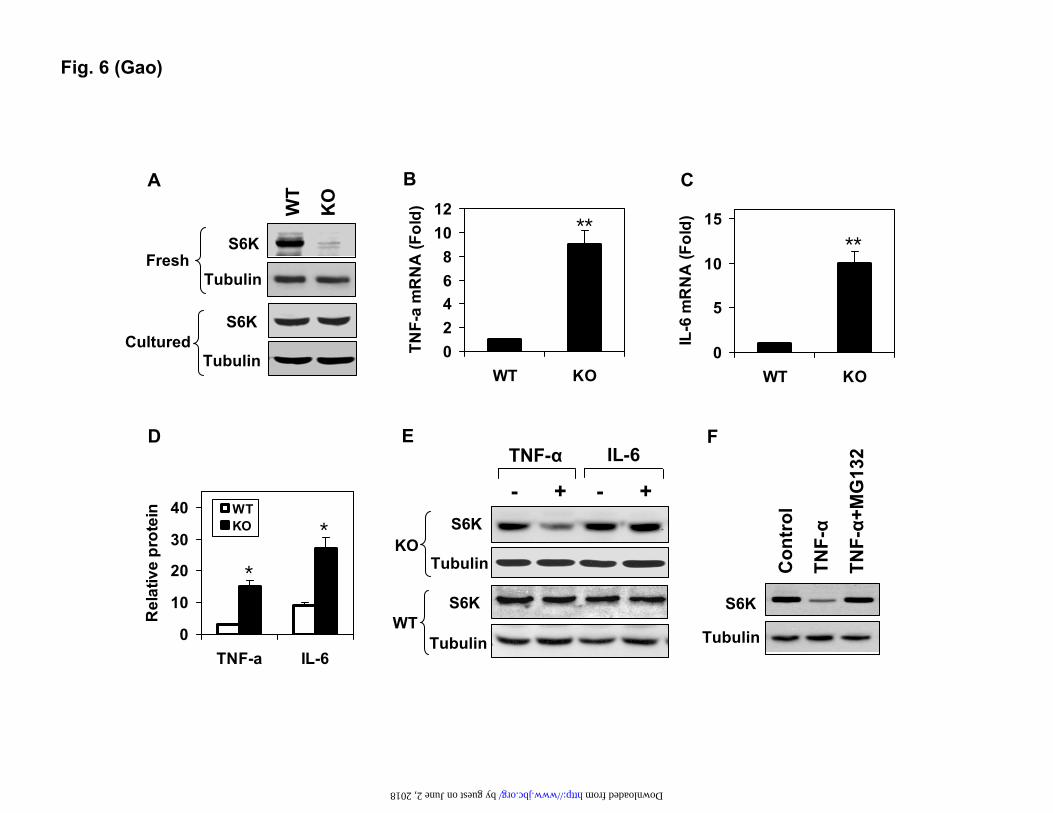
Fig. 6 (Gao)
02468
1012
WT KO
TNF-
a m
RN
A (F
old)
0
10
20
30
40
TNF-a IL-6
Rel
ativ
e pr
otei
n WTKO
0
5
10
15
WT KO
IL-6
mR
NA
(Fol
d)
B C
D
S6K
- + - +TNF-α IL-6
A
KO
S6KWT
S6K
WT
KO
E F
Tubulin
Tubulin
Tubulin Tubulin
S6K
Con
trol
TNF-α
TNF-α+
MG
132
****
*
*
S6K
TubulinFresh
Cultured
by guest on June 2, 2018 http://www.jbc.org/ Downloaded from
TNF-α (h) 0 0.5 1 2 4 6
IKK2 KO S6K
ActinS6K
Actin
TNF-α - + +
S6K
ActinWT
MG132 - - +
Fig. 7 (Gao)
D E
Actin
IKK1
p50
WT
P50-
KO
IKK2
IkBα
A
*
B
IkBα
mR
NA
0
50
100
150
200
250
WT p50-KO
- + - +
WT
Actin
TNF-α
C
IkBα
P50-KO
F
pS6K T389
Actin
S6K
TNF-α
Treatment - - Rap 15d
IKKγ
pIRS-1 S636
by guest on June 2, 2018 http://www.jbc.org/ Downloaded from
Zhanguo Gao, Jun Yin, Jin Zhang, Qing He, Owen P. McGuiness and Jianping Yepost-translational inhibition of P70S6K
Inactivation of NF-kappaB P50 leads to insulin sensitization in liver through
published online May 11, 2009J. Biol. Chem.
10.1074/jbc.M109.007260Access the most updated version of this article at doi:
Alerts:
When a correction for this article is posted•
When this article is cited•
to choose from all of JBC's e-mail alertsClick here
by guest on June 2, 2018http://w
ww
.jbc.org/D
ownloaded from
![Structure of the specificity domain of the Dorsal ... · NF-κB p50 [22,23], p52 [24] and p65 [25] have been reported. The crystal structure of the mouse p50/p65 het-erodimer bound](https://static.fdocument.org/doc/165x107/5e312dda7e32fa57ce774aa6/structure-of-the-specificity-domain-of-the-dorsal-nf-b-p50-2223-p52-24.jpg)