Improving Effectiveness in Method Development by … · Quick and accurate identification of sample...
9
1 WATERS SOLUTIONS ACQUITY UPLC ® H-Class System ACQUITY UPLC Columns ACQUITY QDa Detector ACQUITY UPLC PDA Detector Empower ® 3 Software Waters Quality Control Reference Material (QCRM) benchmarking standards KEY WORDS UPLC, method development, ApexTrack™ integration, Auto•Blend Plus™, metoclopramide HCl, sub-2-μm column particles, mass spectrometry APPLICATION BENEFITS ■ ■ Robust UPLC ® method development ■ ■ Quick and accurate identification of sample components using mass detection with the ACQUITY ® QDa™ Detector ■ ■ Minimize the need for running individual injections of sample components to confirm the identity of peaks INTRODUCTION Method development involves screening a range of chromatographic parameters to generate sufficient resolution and robust separations. While there are many approaches to method development, such as one factor at a time, systematic, and quality by design (QbD), the goals and factors used for optimizing separations are the same. The parameters that are adjusted include column chemistry, organic solvent, pH, gradient slope, flow rate, temperature, among other factors. The impact of modifying these parameters are then systematically evaluated during development. Methods from each round of optimization are assessed using specific criteria such as the greatest number of peaks of interest with appropriate retention, resolution, and tailing values. The best method(s) from each step are then selected for further investigation until a suitable method is obtained. Throughout this development process, it is essential to ensure selection of the best conditions at each step and have demonstrable reasons for selection. Regardless of the optimization strategy selected, it is important to identify and track critical sample components across the conditions investigated. Because peak elution order can change and UV spectra of related substances can be indistinguishable, standards (if available) are sequentially injected under the same conditions to simplify analysis. While ultimately effective, this is a time-consuming process. Using mass detection in addition to optical detection enables unambiguous identification. It also enables analysts to monitor sample components, and to rapidly identify and track coelutions and elution order changes. In this application, we present the development of a UPLC method for metoclopramide HCl and related substances. We combine UV (PDA) and mass detection, with the user-friendly ACQUITY QDa Detector. A systematic protocol is employed that includes scouting, screening, and optimization steps. Results for each step are analyzed and ranked using custom calculations and reported within Empower 3 Chromatography Data Software to minimize analyst bias in decision making and ensure the overall goals are achieved. Improving Effectiveness in Method Development by Using a Systematic Screening Protocol Margaret Maziarz, Sean M. McCarthy, and Mark Wrona Waters Corporation, Milford, MA, USA
Transcript of Improving Effectiveness in Method Development by … · Quick and accurate identification of sample...
1
WAT E R S SO LU T IO NS
ACQUITY UPLC® H-Class System
ACQUITY UPLC Columns
ACQUITY QDa Detector
ACQUITY UPLC PDA Detector
Empower® 3 Software
Waters Quality Control Reference
Material (QCRM) benchmarking standards
K E Y W O R D S
UPLC, method development, ApexTrack™
integration, Auto•Blend Plus™,
metoclopramide HCl, sub-2-μm column
particles, mass spectrometry
A P P L I C AT IO N B E N E F I T S■■ Robust UPLC® method development
■■ Quick and accurate identification of sample
components using mass detection with the
ACQUITY® QDa™ Detector
■■ Minimize the need for running individual
injections of sample components to confirm
the identity of peaks
IN T RO DU C T IO N
Method development involves screening a range of chromatographic parameters
to generate sufficient resolution and robust separations. While there are many
approaches to method development, such as one factor at a time, systematic, and
quality by design (QbD), the goals and factors used for optimizing separations
are the same. The parameters that are adjusted include column chemistry, organic
solvent, pH, gradient slope, flow rate, temperature, among other factors.
The impact of modifying these parameters are then systematically evaluated
during development. Methods from each round of optimization are assessed using
specific criteria such as the greatest number of peaks of interest with appropriate
retention, resolution, and tailing values. The best method(s) from each step
are then selected for further investigation until a suitable method is obtained.
Throughout this development process, it is essential to ensure selection of the
best conditions at each step and have demonstrable reasons for selection.
Regardless of the optimization strategy selected, it is important to identify and
track critical sample components across the conditions investigated. Because
peak elution order can change and UV spectra of related substances can be
indistinguishable, standards (if available) are sequentially injected under the
same conditions to simplify analysis. While ultimately effective, this is a
time-consuming process. Using mass detection in addition to optical detection
enables unambiguous identification. It also enables analysts to monitor sample
components, and to rapidly identify and track coelutions and elution order changes.
In this application, we present the development of a UPLC method for
metoclopramide HCl and related substances. We combine UV (PDA) and mass
detection, with the user-friendly ACQUITY QDa Detector. A systematic protocol
is employed that includes scouting, screening, and optimization steps. Results
for each step are analyzed and ranked using custom calculations and reported
within Empower 3 Chromatography Data Software to minimize analyst bias in
decision making and ensure the overall goals are achieved.
Improving Effectiveness in Method Development by Using a Systematic Screening ProtocolMargaret Maziarz, Sean M. McCarthy, and Mark WronaWaters Corporation, Milford, MA, USA
2Improving Effectiveness in Method Development by Using a Systematic Screening Protocol
Waters reference standard
Packaged in a vial: LCMS Quality Control
Reference Material
(QCRM, p/n 186006963)
Method development conditions
LC system: ACQUITY UPLC H-Class
with Column Manager and
Solvent Select Valve (SSV)
Columns: All columns with dimension
of 2.1 x 50 mm:
ACQUITY UPLC CSH™ C18,
1.7 μm (p/n 186005296)
ACQUITY UPLC CORTECS
C18+, 1.6 μm
(p/n 186007114)
ACQUITY UPLC CSH Phenyl
Hexyl, 1.7 μm
(p/n 186005406)
ACQUITY UPLC HSS
Pentafluorophenyl (PFP),
1.8 μm (p/n 186005965)
Column temp.: 40, 45, and 50 °C
Injection volume: 1.0 µL
Flow rate: 0.6 mL/min
Mobile phase A: 125 mM Formic acid
in water
Mobile phase B: 125 mM Ammonium
hydroxide in water
Mobile phase C: Water
Mobile phase D1: Acetonitrile
Mobile phase D2: Methanol
System control, data acquisition, and analysis:
Empower 3 FR2 CDS Software
E X P E R IM E N TA L
Separation: Standard gradient with
5-90% organic solvent
over 5 minutes
Wash solvents: Purge/Sample Wash: 50:50
water/methanol
Seal wash: 90:10 water/acetonitrile
PDA detector: ACQUITY UPLC PDA
PDA settings: 210-400 nm
(derived at 270 nm)
MS detector: ACQUITY QDa
(Extended Performance)
Scan mode: 100-400 m/z
Ionization mode: ESI+, ESI-
Probe temp.: 600 °C
Sampling rate: 10 pts/sec
Capilllary voltage: 0.8 kV (pos/neg)
Cone voltage: 15 V
Data: Centroid
3Improving Effectiveness in Method Development by Using a Systematic Screening Protocol
In this application, we demonstrate how using both UV and mass data allows accurate tracking of all
components during development and ensures peak purity in the final method. Overall, following a systematic
protocol and utilizing mass detection enables faster and more effective development of a chromatographic
method that conforms to the USP standard methodology for robustness and performance verification.1
Preparation of Solutions
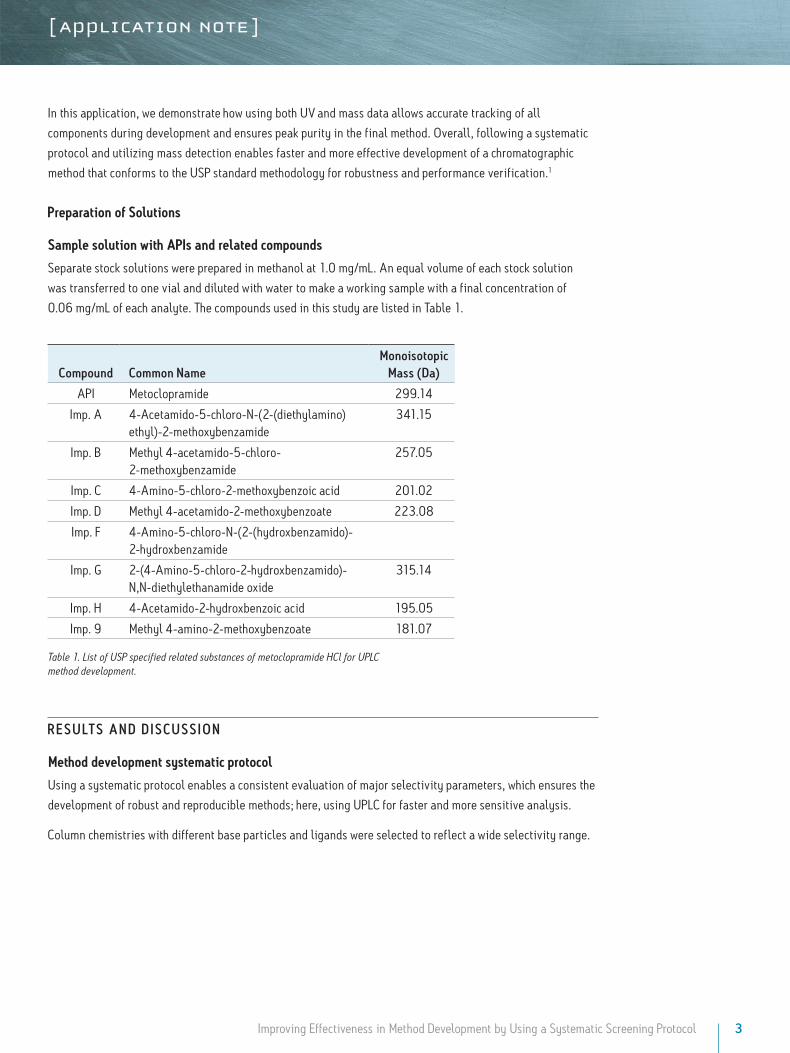
Sample solution with APIs and related compounds
Separate stock solutions were prepared in methanol at 1.0 mg/mL. An equal volume of each stock solution
was transferred to one vial and diluted with water to make a working sample with a final concentration of
0.06 mg/mL of each analyte. The compounds used in this study are listed in Table 1.
Compound
Common Name
Monoisotopic Mass (Da)
API Metoclopramide 299.14
Imp. A 4-Acetamido-5-chloro-N-(2-(diethylamino)ethyl)-2-methoxybenzamide
341.15
Imp. B Methyl 4-acetamido-5-chloro- 2-methoxybenzamide
257.05
Imp. C 4-Amino-5-chloro-2-methoxybenzoic acid 201.02
Imp. D Methyl 4-acetamido-2-methoxybenzoate 223.08
Imp. F 4-Amino-5-chloro-N-(2-(hydroxbenzamido)-2-hydroxbenzamide
Imp. G 2-(4-Amino-5-chloro-2-hydroxbenzamido)-N,N-diethylethanamide oxide
315.14
Imp. H 4-Acetamido-2-hydroxbenzoic acid 195.05
Imp. 9 Methyl 4-amino-2-methoxybenzoate 181.07
Table 1. List of USP specified related substances of metoclopramide HCl for UPLC method development.
R E SU LT S A N D D IS C U S S IO N
Method development systematic protocol
Using a systematic protocol enables a consistent evaluation of major selectivity parameters, which ensures the
development of robust and reproducible methods; here, using UPLC for faster and more sensitive analysis.
Column chemistries with different base particles and ligands were selected to reflect a wide selectivity range.
4Improving Effectiveness in Method Development by Using a Systematic Screening Protocol
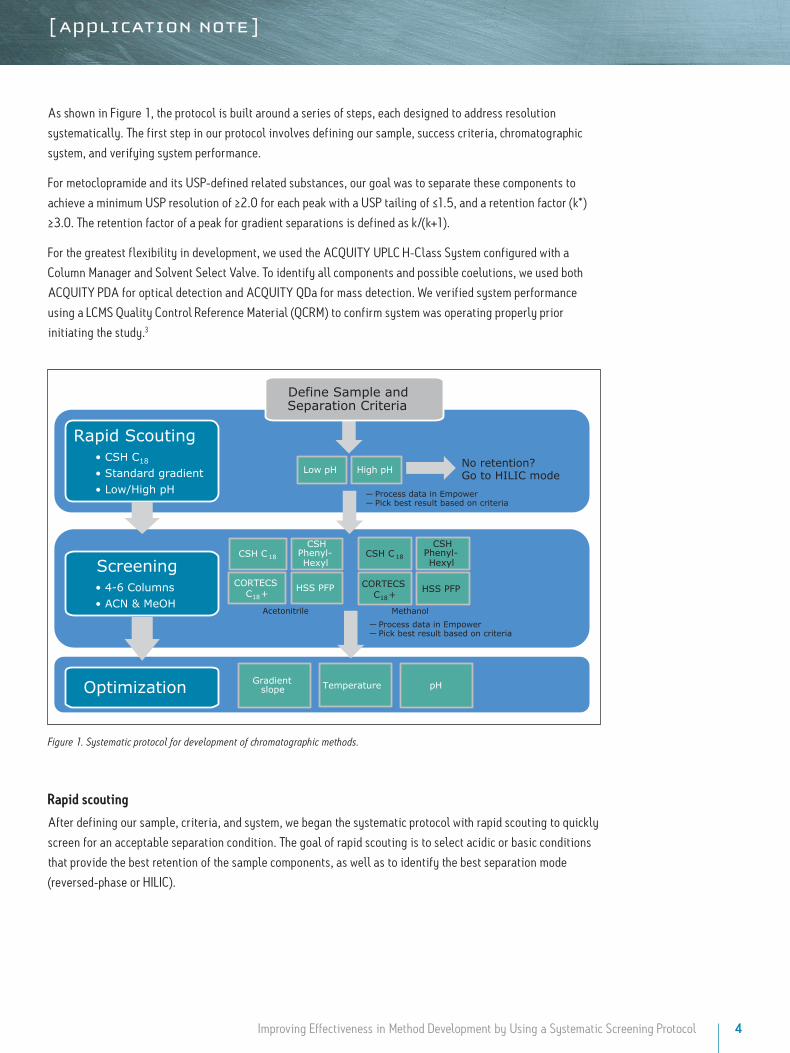
As shown in Figure 1, the protocol is built around a series of steps, each designed to address resolution
systematically. The first step in our protocol involves defining our sample, success criteria, chromatographic
system, and verifying system performance.
For metoclopramide and its USP-defined related substances, our goal was to separate these components to
achieve a minimum USP resolution of ≥2.0 for each peak with a USP tailing of ≤1.5, and a retention factor (k*)
≥3.0. The retention factor of a peak for gradient separations is defined as k/(k+1).
For the greatest flexibility in development, we used the ACQUITY UPLC H-Class System configured with a
Column Manager and Solvent Select Valve. To identify all components and possible coelutions, we used both
ACQUITY PDA for optical detection and ACQUITY QDa for mass detection. We verified system performance
using a LCMS Quality Control Reference Material (QCRM) to confirm system was operating properly prior
initiating the study.3
Low pH High pH
Gradient slope Temperature pH
CSH C 18
CSH Phenyl-Hexyl
CORTECS C18+ HSS PFP
CSH C 18
CSH Phenyl-Hexyl
CORTECS C18+ HSS PFP
Process data in Empower Pick best result based on criteria
Acetonitrile Methanol
Process data in Empower Pick best result based on criteria
Define Sample and Separation Criteria
No retention? Go to HILIC mode
Rapid Scouting • CSH C18 • Standard gradient • Low/High pH
Optimization
Screening • 4-6 Columns • ACN & MeOH
Figure 1. Systematic protocol for development of chromatographic methods.
Rapid scouting
After defining our sample, criteria, and system, we began the systematic protocol with rapid scouting to quickly
screen for an acceptable separation condition. The goal of rapid scouting is to select acidic or basic conditions
that provide the best retention of the sample components, as well as to identify the best separation mode
(reversed-phase or HILIC).
5Improving Effectiveness in Method Development by Using a Systematic Screening Protocol
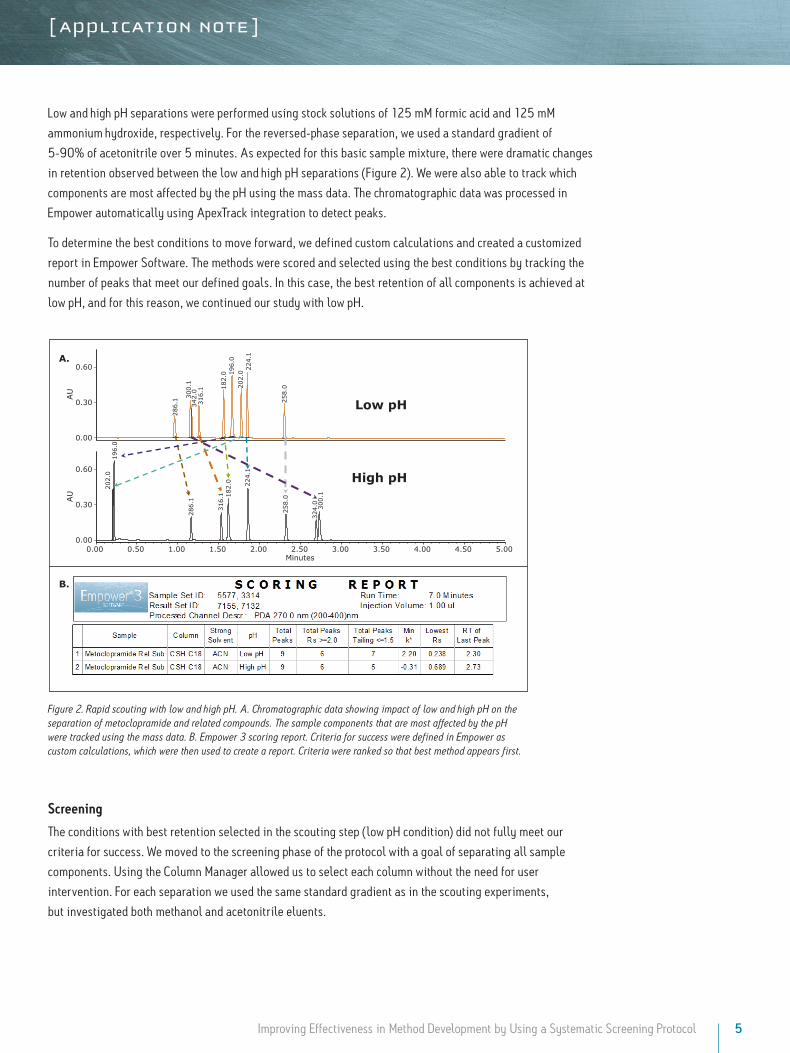
Low and high pH separations were performed using stock solutions of 125 mM formic acid and 125 mM
ammonium hydroxide, respectively. For the reversed-phase separation, we used a standard gradient of
5-90% of acetonitrile over 5 minutes. As expected for this basic sample mixture, there were dramatic changes
in retention observed between the low and high pH separations (Figure 2). We were also able to track which
components are most affected by the pH using the mass data. The chromatographic data was processed in
Empower automatically using ApexTrack integration to detect peaks.
To determine the best conditions to move forward, we defined custom calculations and created a customized
report in Empower Software. The methods were scored and selected using the best conditions by tracking the
number of peaks that meet our defined goals. In this case, the best retention of all components is achieved at
low pH, and for this reason, we continued our study with low pH.
AU
0.00
0.30
0.60
AU
0.00
0.30
0.60
Minutes0.00 0.50 1.00 1.50 2.00 2.50 3.00 3.50 4.00 4.50 5.00
286.
1
324.
0
316.
1 182.
0
196.
0 20
2.0
224.
1
258.
0
300.
1
Low pH
High pH
286.
1 300.
1
316.
1 182.
0 196.
0 20
2.0 22
4.1
258.
0
342.
0
A.
B.
Figure 2. Rapid scouting with low and high pH. A. Chromatographic data showing impact of low and high pH on the separation of metoclopramide and related compounds. The sample components that are most affected by the pH were tracked using the mass data. B. Empower 3 scoring report. Criteria for success were defined in Empower as custom calculations, which were then used to create a report. Criteria were ranked so that best method appears first.
Screening
The conditions with best retention selected in the scouting step (low pH condition) did not fully meet our
criteria for success. We moved to the screening phase of the protocol with a goal of separating all sample
components. Using the Column Manager allowed us to select each column without the need for user
intervention. For each separation we used the same standard gradient as in the scouting experiments,
but investigated both methanol and acetonitrile eluents.
6Improving Effectiveness in Method Development by Using a Systematic Screening Protocol
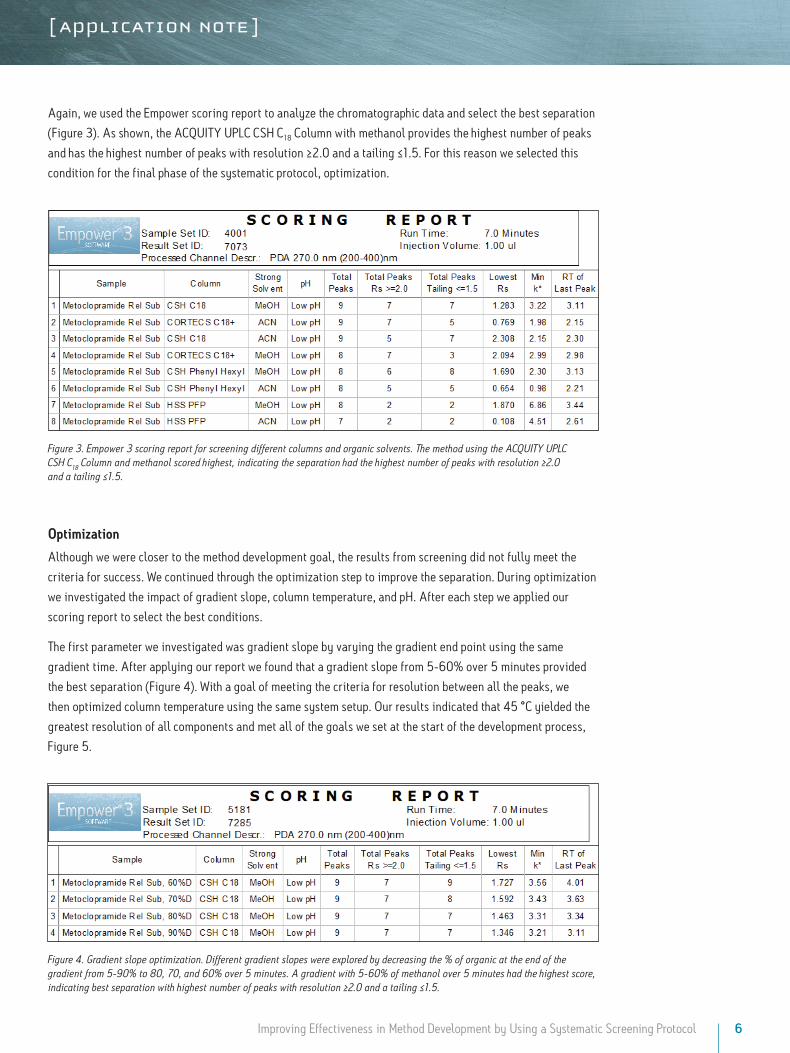
Again, we used the Empower scoring report to analyze the chromatographic data and select the best separation
(Figure 3). As shown, the ACQUITY UPLC CSH C18 Column with methanol provides the highest number of peaks
and has the highest number of peaks with resolution ≥2.0 and a tailing ≤1.5. For this reason we selected this
condition for the final phase of the systematic protocol, optimization.
Figure 3. Empower 3 scoring report for screening different columns and organic solvents. The method using the ACQUITY UPLC CSH C18 Column and methanol scored highest, indicating the separation had the highest number of peaks with resolution ≥2.0 and a tailing ≤1.5.
Figure 4. Gradient slope optimization. Different gradient slopes were explored by decreasing the % of organic at the end of the gradient from 5-90% to 80, 70, and 60% over 5 minutes. A gradient with 5-60% of methanol over 5 minutes had the highest score, indicating best separation with highest number of peaks with resolution ≥2.0 and a tailing ≤1.5.
Optimization
Although we were closer to the method development goal, the results from screening did not fully meet the
criteria for success. We continued through the optimization step to improve the separation. During optimization
we investigated the impact of gradient slope, column temperature, and pH. After each step we applied our
scoring report to select the best conditions.
The first parameter we investigated was gradient slope by varying the gradient end point using the same
gradient time. After applying our report we found that a gradient slope from 5-60% over 5 minutes provided
the best separation (Figure 4). With a goal of meeting the criteria for resolution between all the peaks, we
then optimized column temperature using the same system setup. Our results indicated that 45 °C yielded the
greatest resolution of all components and met all of the goals we set at the start of the development process,
Figure 5.
7Improving Effectiveness in Method Development by Using a Systematic Screening Protocol
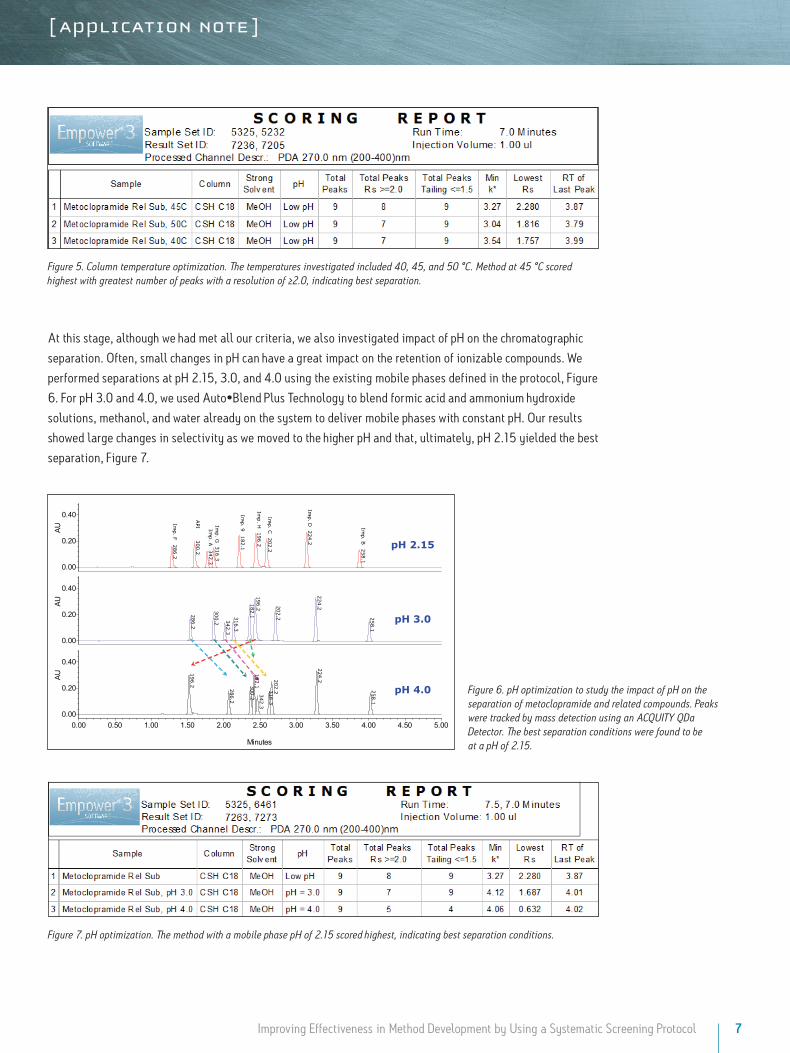
Figure 5. Column temperature optimization. The temperatures investigated included 40, 45, and 50 °C. Method at 45 °C scored highest with greatest number of peaks with a resolution of ≥2.0, indicating best separation.
Figure 6. pH optimization to study the impact of pH on the separation of metoclopramide and related compounds. Peaks were tracked by mass detection using an ACQUITY QDa Detector. The best separation conditions were found to be at a pH of 2.15.
Figure 7. pH optimization. The method with a mobile phase pH of 2.15 scored highest, indicating best separation conditions.
At this stage, although we had met all our criteria, we also investigated impact of pH on the chromatographic
separation. Often, small changes in pH can have a great impact on the retention of ionizable compounds. We
performed separations at pH 2.15, 3.0, and 4.0 using the existing mobile phases defined in the protocol, Figure
6. For pH 3.0 and 4.0, we used Auto•Blend Plus Technology to blend formic acid and ammonium hydroxide
solutions, methanol, and water already on the system to deliver mobile phases with constant pH. Our results
showed large changes in selectivity as we moved to the higher pH and that, ultimately, pH 2.15 yielded the best
separation, Figure 7.
AU
0.00
0.20
0.40
AU
0.00
0.20
0.40
AU
0.00
0.20
0.40
Minutes
0.00 0.50 1.00 1.50 2.00 2.50 3.00 3.50 4.00 4.50 5.00
286.2 –
Imp. F 300.2
-API
342.3 –
Imp. A
316.3 –
Imp. G 182.1
–Im
p. 9
196.2 –
Imp. H
202.2 –
Imp. C 224.2
–Im
p. D
258.1 –
Imp. B
286.2
300.2 342.3316.3
182.1196.2 202.2
224.2
258.1
286.2
342.3
316.3
196.2
202.2
224.2
258.1
300.2
pH 3.0
pH 2.15
pH 4.0
182.1
8
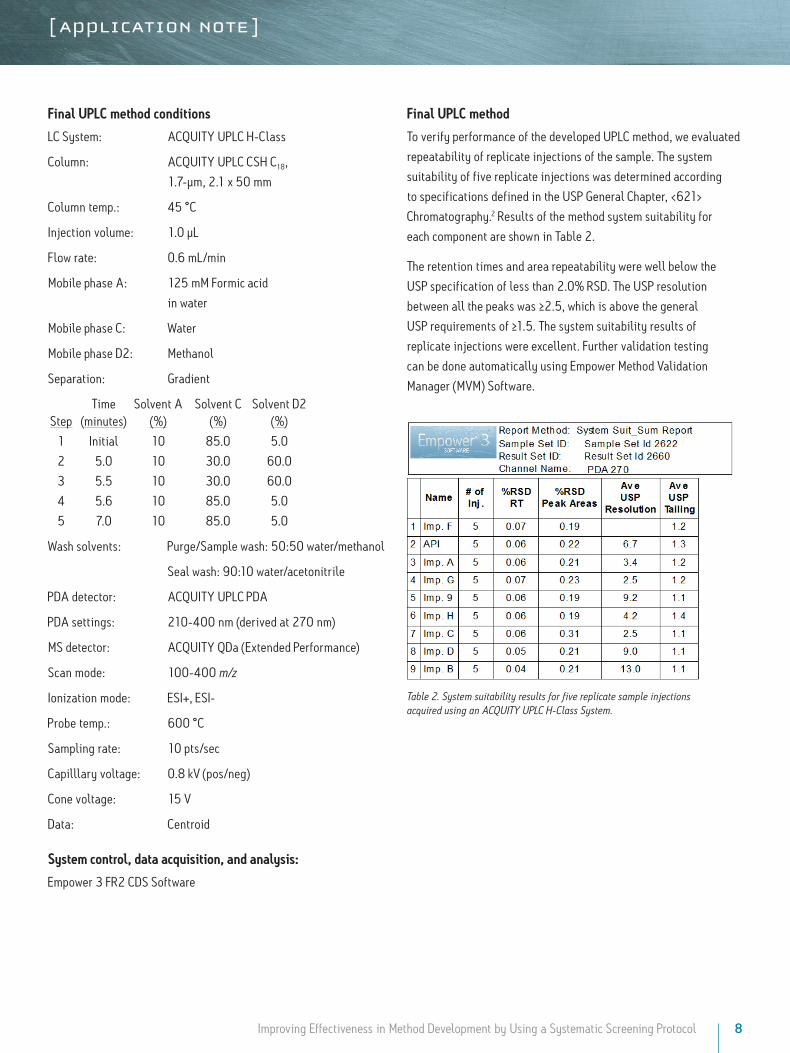
Table 2. System suitability results for five replicate sample injections acquired using an ACQUITY UPLC H-Class System.
Improving Effectiveness in Method Development by Using a Systematic Screening Protocol
Final UPLC method conditions
LC System: ACQUITY UPLC H-Class
Column: ACQUITY UPLC CSH C18,
1.7-µm, 2.1 x 50 mm
Column temp.: 45 °C
Injection volume: 1.0 µL
Flow rate: 0.6 mL/min
Mobile phase A: 125 mM Formic acid
in water
Mobile phase C: Water
Mobile phase D2: Methanol
Separation: Gradient
Time Solvent A Solvent C Solvent D2 Step (minutes) (%) (%) (%)
1 Initial 10 85.0 5.0
2 5.0 10 30.0 60.0
3 5.5 10 30.0 60.0
4 5.6 10 85.0 5.0
5 7.0 10 85.0 5.0
Wash solvents: Purge/Sample wash: 50:50 water/methanol
Seal wash: 90:10 water/acetonitrile
PDA detector: ACQUITY UPLC PDA
PDA settings: 210-400 nm (derived at 270 nm)
MS detector: ACQUITY QDa (Extended Performance)
Scan mode: 100-400 m/z
Ionization mode: ESI+, ESI-
Probe temp.: 600 °C
Sampling rate: 10 pts/sec
Capilllary voltage: 0.8 kV (pos/neg)
Cone voltage: 15 V
Data: Centroid
System control, data acquisition, and analysis:
Empower 3 FR2 CDS Software
Final UPLC method
To verify performance of the developed UPLC method, we evaluated
repeatability of replicate injections of the sample. The system
suitability of five replicate injections was determined according
to specifications defined in the USP General Chapter, <621>
Chromatography.2 Results of the method system suitability for
each component are shown in Table 2.
The retention times and area repeatability were well below the
USP specification of less than 2.0% RSD. The USP resolution
between all the peaks was ≥2.5, which is above the general
USP requirements of ≥1.5. The system suitability results of
replicate injections were excellent. Further validation testing
can be done automatically using Empower Method Validation
Manager (MVM) Software.
Waters Corporation 34 Maple Street Milford, MA 01757 U.S.A. T: 1 508 478 2000 F: 1 508 872 1990 www.waters.com
Waters, The Science of What’s Possible, ACQUITY, ACQUITY UPLC, UPLC, and Empower are registered trademarks of Waters Corporation. QDa, ApexTrack, Auto•Blend Plus, and CSH are trademarks of Waters Corporation. All other trademarks are the property of their respective owners.
©2014 Waters Corporation. Produced in the U.S.A. April 2014 720005026EN AG-PDF
CO N C LU S IO NS
Following a systematic protocol, we have successfully developed
a UPLC method for the separation of metoclopramide and related
compounds. The criteria for success with a goal of separating all
nine components, achieving a resolution of ≥2.0, tailing of ≤1.5,
and retention factor (k*) ≥3.0, were met.
Using the ACQUITY QDa Detector in conjunction with UV
detection and the ACQUITY UPLC H-Class System streamlined
the method development process by removing the need for
multiple chromatographic runs to confirm the identity of peaks
by retention times.
Using a single injection, instead of nine individual sample
injections, we were able to quickly identify components and track
elution order of peaks during the method development study.
Finally, the use of ApexTrack in Empower Software enabled
consistent evaluation of chromatograms for fair comparison across
the development process. Empower custom calculations and
reporting allowed us to generate a scoring report to easily identify
the best conditions at each step in our protocol.
Overall, using a defined systematic protocol with the UPLC
system, detectors, and its column chemistries enables analytical
laboratories to quickly and efficiently develop chromatographic
methods. Methods developed in this manner are typically more
reproducible, which allows laboratories to have a higher validation
success rate.
References
1. General Chapter, <1226>, Verification of Compedial Method, USP36-NF31, The United States Pharmacopeia Convention, official December 1, 2013.
2. USP General Chapter, <621>, Chromatography, USP36-NF31, The United States Pharmacopeia Convention, official December 1, 2013.
3. Berthelette KD, Summers M, Fountain KJ. Ensuring Data Quality by Benchmarking System Performance Using Waters Neutrals Quality Control Reference Material. Waters Corp. 2013; 720004622en.