Illicit Financial Flows From Developing Countries- 2002-2006
38
ExecutiveReport
-
Upload
sivasubramanian-muthusamy -
Category
Documents
-
view
657 -
download
1
description
Global Financial Integrity ( http://www.gfip.org/ ) by a Ford Foundation grant compiled this research paper
Transcript of Illicit Financial Flows From Developing Countries- 2002-2006
��
������������
�� ������
���������� � ��
�������� �������������
������������ � ������ �����
���� ��� !����� �������"�#$���"�
Executive�Report�

Global Financial IntegrityWishes To Thank
The Ford FoundationFor Supporting This Project
FFOORRDD FFOOUUNNDDAATTIIOONN �
�
Strengthen democratic values, reduce poverty and injustice, promote international cooperation and advance human achievement
�
�
�
�
�
Global Financial Integrity A Program of the Center for International Policy
1319 18th Street, NW - Suite 200 - Washington, DC 20036 - 202.293.0740 www.gfip.org

Global Financial Integrity Illicit Financial Flows from Developing Countries: 2002-2006
GLOBAL FINANCIAL INTEGRITY
Director Raymond W. Baker Managing Director Tom Cardamone Advisory Board Charles Davidson - Chair Jack Blum Lord Daniel Brennan Francis Fukuyama John Heimann Kenneth Jensen Eva Joly David Landes Moisés Naím Ngozi Okonjo-Iweala Thomas Pogge John Whitehead
Illicit Financial Flows: A Note on Concepts The literature on “flight capital” is rich and varied but far from thorough or complete. The term flight capital is most commonly applied in reference to money that shifts out of developing countries, usually into western economies. Motivations for such shifts are usually regarded as portfolio diversification or fears of political or economic instability or fears of taxation or inflation or confiscation. All of these are valid explanations for the phenomenon, yet the most common motivation appears to be, instead, a desire for the hidden accumulation of wealth. Flight capital takes two forms—legal and illegal. Legal flight capital is calculated in the Hot Money Method of analysis as portfolio investment and other short-term investments, but not including longer-term foreign direct investment. Legal flight capital is recorded on the books of the entity or individual making the transfer, and earnings from interest, dividends, and realized capital gains normally return to the country of origin. Illegal flight capital is intended to disappear from any record in the country of origin, and earnings on the stock of illegal flight capital outside of a country do not normally return to the country of origin. Illegal flight capital can be generated through a number of means that are not revealed in national accounts or balance of payments figures, including trade mispricing, bulk cash movements, hawala transactions, smuggling, and more. While there is a clear conceptual difference between legal and illegal flight capital, the statistical distinction between the two can be difficult. Furthermore, available data are often incomplete or erroneously entered in developing country accounts. This report relies on available data without making a judgment as to its accuracy. We utilize several methodologies and data bases to estimate both the legal and illegal components of flight capital, namely the Hot Money, Dooley, and World Bank Residual Methods, IMF Direction of Trade Statistics, and the International Price Profiling System. To the data that emerge from these methodologies we apply a series of filters and exclusions as we strive to present robust yet conservative estimates. Some researchers are comfortable using the terms “recorded” and “unrecorded” but uncomfortable using the terms “legal” and “illegal” or “licit” and “illicit.” We argue that by far the greater part of unrecorded flows are indeed illicit, violating the national criminal and civil codes, tax laws, customs regulations, VAT assessments, exchange control requirements and banking regulations of the countries out of which unrecorded/illicit flows occur. To make the following analysis straightforward, we treat recorded flight capital as legal and unrecorded flight capital as illegal, recognizing that there is some interplay between the two.
Global Financial Integrity Illicit Capital Flight from Developing Countries: 2002-2006
We particularly want to address the transition from the term illegal flight capital to the term “illicit financial flows.” Illicit money is money that is illegally earned, transferred, or utilized. If it breaks laws in its origin, movement, or use it merits the label. Flight capital is an expression that places virtually the whole of the problem upon the developing countries out of which the money comes. It suggests, without quite saying so, that it is almost entirely their responsibility to address and resolve the concern. The expression illicit financial flows does a better job of clarifying that this phenomenon is a two-way street. The industrialized countries have for decades solicited, facilitated, transferred, and managed both licit and illicit financial flows out of poorer countries. This reality is becoming increasingly understood, and the growing global use of the term illicit financial flows contributes toward this end. Our best estimate is that illicit financial flows out of developing countries are some $850 billion to $1 trillion a year. We believe this estimate is conservative. It does not include, for example, major forms of value drainages out of poorer countries not represented by money, namely:
1) Trade mispricing that is handled by collusion between importers and exporters within the same invoice, not picked up in mispricing models based on IMF Direction of Trade Statistics, a technique utilized extensively by multinational corporations, 2) The proceeds of criminal and commercial smuggling such as drugs, minerals, and contraband goods, and 3) Mispriced asset swaps, where ownership of commodities, shares, and properties are traded without a cash flow.
We hope to include more of these omissions in future studies. We welcome comment on methodologies, filters, exclusions, and other aspects of this analysis, and in particular we welcome additional studies of the reality of illicit money shifting out of developing countries. We believe that any responsible analysis will produce estimates of staggering magnitude, underlining the task ahead in curtailing this critical global problem. Global Financial Integrity thanks Dev Kar and Devon Cartwright-Smith for their considerable contributions to this report. Raymond W. Baker Director, Global Financial Integrity December 2008
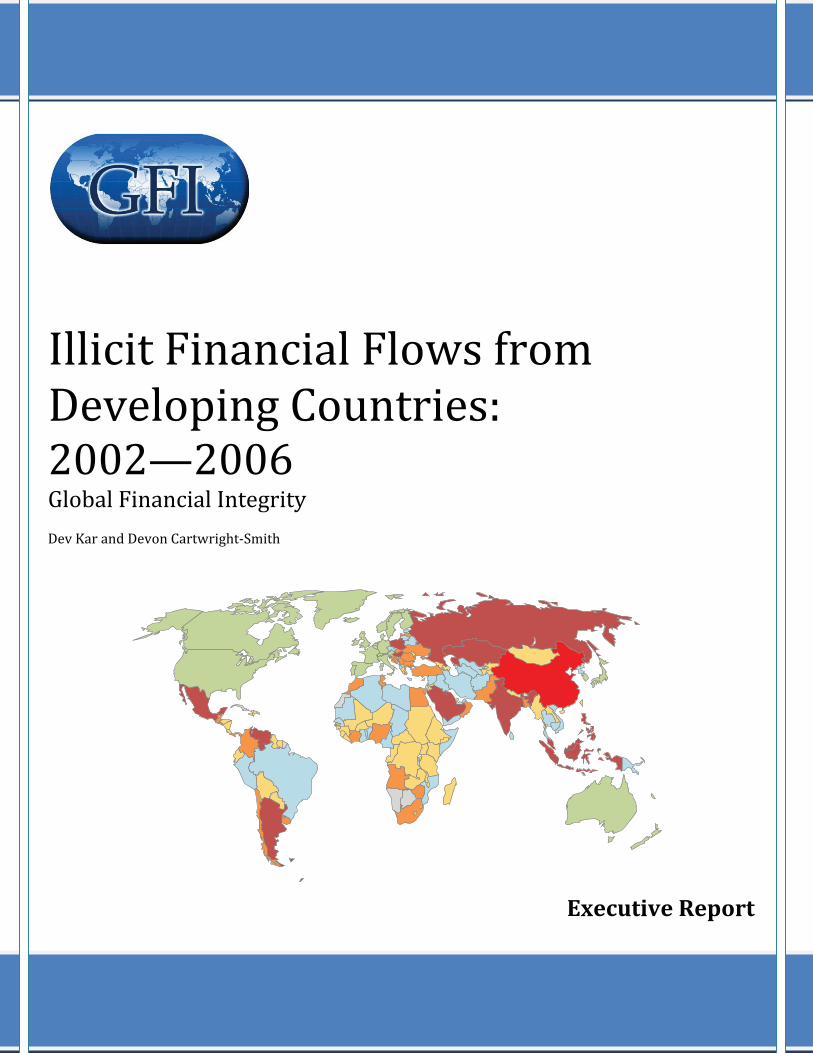
Global Financial Integrity Illicit Financial Flows from Developing Countries: 2002-2006
I. Introduction
1. Illicit financial flows generally involve the transfer of money earned through illegal activities such as corruption, transactions involving contraband goods, criminal activities, and efforts to shelter wealth from a country’s tax authorities. However, such flows may also comprise funds that were earned through legitimate means. Thus defined, illicit flows involve funds that are illegally earned, transferred, or utilized and cover all unrecorded private financial outflows that drive the accumulation of foreign assets by residents in contravention of applicable laws and regulatory frameworks. In other words, if capital flows are unrecorded or if they skirt capital controls in place, such outflows are considered to be illicit for the purposes of this study. A uniform measure of illicit financial flows was adopted given that we are primarily interested in estimating the overall volume of such flows from developing countries and comparing them across various regions and countries. No attempt is made to differentiate the underlying activities that generate illicit financial flows.
2. This report is one of very few recent studies on the total volume and pattern of illicit financial flows out of all
developing countries. Notably, the study by Raymond Baker used a survey-based approach to estimate illicit financial flows. His findings were later published in Capitalism’s Achilles Heel (see Appendix II for full citation). Another comprehensive study, which is now somewhat dated, was carried out at the World Bank in 1994.
3. This study utilizes multiple economic models and filters to weed out spurious data in order to yield the most
reliable estimates possible. However, it is important to note that all currently existing economic models have a limited capacity to reflect the actual volume of illicit financial flows, as these flows are primarily generated through transactions that completely bypass statistical recording. Because of this inability of official statistics to capture all of the monetary particulars of illegal commerce, which is the driving force behind these illicit outflows, the economic models used in this paper are likely to understate the true measure of illicit financial outflows from developing countries.
4. The list of 160 developing countries is based on the IMF’s International Financial Statistics system of country
classification, except for minor deviations that are noted. (See Appendix I for list and classification.)
II. Estimation Methods and Limitations
5. According to the models used in this paper, illicit financial outflows occur through two channels—the clandestine use of the international banking system to send money out of a country, captured by the Hot Money (Narrow) and World Bank Residual models, and trade misinvoicing, which generates illicit funds that are shifted abroad. Each of the three models used in this study—the Hot Money (Narrow), World Bank Residual, and Trade Misinvoicing—are widely used by economists. The data sources for this analysis are the large‐scale macroeconomic databases maintained by the IMF and the World Bank. This study uses a “normalization” technique to weed out countries with low or spurious cases of illicit financial flows. The three models of illicit flows are briefly described below to illustrate how such flows are captured through the use of official data. In this paper, estimates of illicit financial flows from all developing countries are broken down into five regions of the world: Africa, Asia, Europe, Middle East and North Africa (MENA), and the Western Hemisphere.
Global Financial Integrity Illicit Financial Flows from Developing Countries: 2002-2006
6. The Hot Money (Narrow) Model: Estimates illicit financial flows by focusing strictly on the net errors and
omissions line-item in a country’s external accounts. The net errors and omissions figure balances credits and debits in a country’s external accounts and reflects unrecorded capital flows and statistical errors in measurement. A persistently large and negative net errors and omissions figure is interpreted as an indication of illicit financial outflows.
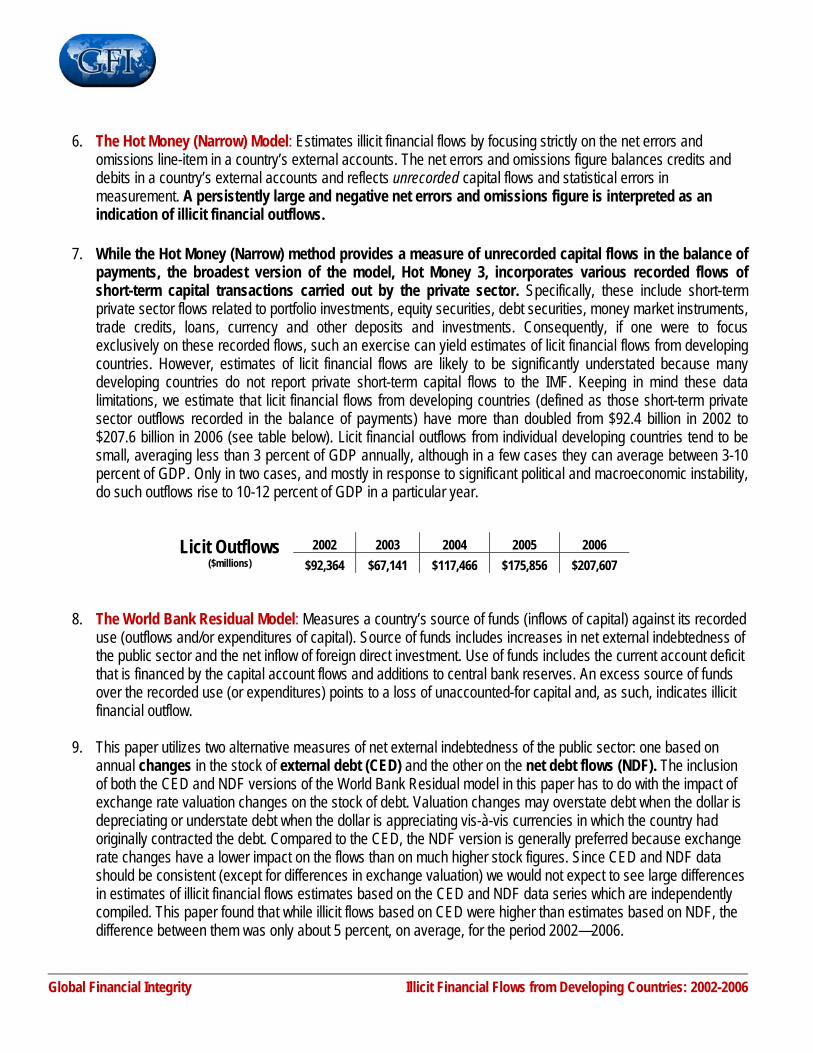
7. While the Hot Money (Narrow) method provides a measure of unrecorded capital flows in the balance of payments, the broadest version of the model, Hot Money 3, incorporates various recorded flows of short-term capital transactions carried out by the private sector. Specifically, these include short-term private sector flows related to portfolio investments, equity securities, debt securities, money market instruments, trade credits, loans, currency and other deposits and investments. Consequently, if one were to focus exclusively on these recorded flows, such an exercise can yield estimates of licit financial flows from developing countries. However, estimates of licit financial flows are likely to be significantly understated because many developing countries do not report private short-term capital flows to the IMF. Keeping in mind these data limitations, we estimate that licit financial flows from developing countries (defined as those short-term private sector outflows recorded in the balance of payments) have more than doubled from $92.4 billion in 2002 to $207.6 billion in 2006 (see table below). Licit financial outflows from individual developing countries tend to be small, averaging less than 3 percent of GDP annually, although in a few cases they can average between 3-10 percent of GDP. Only in two cases, and mostly in response to significant political and macroeconomic instability, do such outflows rise to 10-12 percent of GDP in a particular year.
Licit Outflows ($millions)
2002 2003 2004 2005 2006 $92,364 $67,141 $117,466 $175,856 $207,607
8. The World Bank Residual Model: Measures a country’s source of funds (inflows of capital) against its recorded use (outflows and/or expenditures of capital). Source of funds includes increases in net external indebtedness of the public sector and the net inflow of foreign direct investment. Use of funds includes the current account deficit that is financed by the capital account flows and additions to central bank reserves. An excess source of funds over the recorded use (or expenditures) points to a loss of unaccounted-for capital and, as such, indicates illicit financial outflow.
9. This paper utilizes two alternative measures of net external indebtedness of the public sector: one based on annual changes in the stock of external debt (CED) and the other on the net debt flows (NDF). The inclusion of both the CED and NDF versions of the World Bank Residual model in this paper has to do with the impact of exchange rate valuation changes on the stock of debt. Valuation changes may overstate debt when the dollar is depreciating or understate debt when the dollar is appreciating vis-à-vis currencies in which the country had originally contracted the debt. Compared to the CED, the NDF version is generally preferred because exchange rate changes have a lower impact on the flows than on much higher stock figures. Since CED and NDF data should be consistent (except for differences in exchange valuation) we would not expect to see large differences in estimates of illicit financial flows estimates based on the CED and NDF data series which are independently compiled. This paper found that while illicit flows based on CED were higher than estimates based on NDF, the difference between them was only about 5 percent, on average, for the period 2002—2006.
Global Financial Integrity Illicit Financial Flows from Developing Countries: 2002-2006
10. The Trade Misinvoicing Model: Trade misinvoicing has long been recognized as a major conduit for illicit financial flows, the underlying motivation being that residents can illicitly acquire foreign assets by over-invoicing imports and under-invoicing exports. To estimate this kind of misinvoicing, a developing country’s exports to the world are compared to what the world reports as having imported from that country, after adjusting for the cost of transportation and insurance. Additionally, a country’s imports from the world are compared to what the world reports as having exported to that country. Discrepancies in partner-country trade data, after adjusting for the cost of freight and insurance, which imply over-invoicing of imports and/or under-invoicing of exports, indicates illicit flows. It should be noted however that the trade misinvoicing model can also yield a negative sign result, implying inward illicit flows (i.e. unrecorded capital flowing into a country) through export over-invoicing and import under-invoicing.
11. This paper presents estimates of illicit financial flows based on two interpretations of the Trade
Misinvoicing Model involving a netting method (Net) and a gross excluding reversals (GER) method. In the Net method, gross capital outflows are reduced by gross capital inflows to derive a net position and only net positions with the correct (positive) sign are taken to represent illicit flows. In contrast, under the GER method, only estimates of export under-invoicing and import over-invoicing are included in the illicit flows analysis, while inward illicit flows (i.e., export over-invoicing and import under-invoicing) are ignored as they are deemed to result from spurious data. According to the GER method, the reduction of illicit financial outflows by inward illicit flows in the Net method is not realistic in countries with a history of poor governance and lack of prudent economic policies. As structural characteristics that drive illicit financial flows are unlikely to swing back and forth (particularly during a relatively short five-year period), the GER method limits inward illicit flows to clear cases where flight capital returns following genuine and sustained economic reform. Since it is hard to imagine legitimate traders using the trade misinvoicing mechanism to bring money into the country, the GER method is preferred in this paper.
12. It is worth bearing in mind that there are significant limitations to all three models for estimating illicit financial flows, not only because they cannot capture the many illegal channels for transferring money out of a country but also because the official data these models use are subject to errors in measurement. The following paragraphs (13-21) discuss some of these limitations.
13. The primary drawback of the Hot Money (Narrow) model is that the NEO not only reflects unrecorded capital flows but also statistical errors in recording a country’s external transactions. In fact, in the case of many developing countries with weak balance of payments statistics, a significant part of the NEO may be due to statistical issues in recording the external accounts rather than a reflection of illicit financial flows. The other limitation of the Hot Money (Narrow) method arises from the fact that data on the NEO are missing for 31 countries (see Table 3) driving down the already low estimates of illicit flows. Of these countries, there are strong prima facie reasons to believe that illicit flows from Afghanistan, Algeria, Congo (DRC), Iran, Iraq, Somalia, and Uzbekistan could be significant due to economic and/or political instability. For these reasons, the Hot Money (Narrow) method provides significantly lower estimates of overall illicit flows from developing countries and is therefore not used to compare such flows between countries or analyze regional patterns and distributions.
14. Even if statistical problems in recording official data were nonexistent and we had full data coverage for all countries, none of the models economists use to estimate illicit financial flows can capture the effects of smuggling, as these types of transactions entirely bypass the customs authorities and their recording systems. Smuggling tends to be rampant when there are significant differences in cross-border prices in certain goods between countries that share a long and porous frontier. The profits from smuggling often end up as part of
Global Financial Integrity Illicit Financial Flows from Developing Countries: 2002-2006
outgoing illicit flows as smugglers seek to shield their ill-gotten gains from the scrutiny of officials, even as smuggling distorts the quality of bilateral trade. As a result, trade data distortions due to smuggling may indicate that there are inward illicit flows into a country when in fact the reverse is true.
15. The World Bank Residual model is subject to technical errors in accurately recording a country’s external indebtedness, net foreign direct investments, and trade transactions (mainly related to goods and services). Also, the Bank seems to have more comprehensive data on the stock of external debt than on the net flows of new debt. In any case, the most reliable data series in the model would be the change in reserves, which is a figure typically compiled by the central bank and closely monitored in most developing countries.
16. Regarding limitations in the trade misinvoicing models, some economists have argued that misinvoicing should be excluded from estimates of illicit financial flows on the grounds that export under-invoicing and import over-invoicing behave quite differently from other conduits of illicit financial flows. For instance, misinvoicing often takes place in response to high trade taxes and thus may be unrelated to illicit financial flows captured by other models. However, other economists have advanced equally cogent arguments for including trade misinvoicing on the grounds that international trade often provides an excellent conduit for illicit financial flows. In their view, the exclusion of trade misinvoicing will seriously understate overall illicit flows. It is therefore not surprising that a number of recent studies sponsored by international organizations, such as the United Nations Conference on Trade and Development (UNCTAD), have explicitly included fake invoicing as a factor driving illicit financial flows. The UNCTAD study suggested that illicit financial outflows from Sub-Saharan Africa are fast approaching half a trillion dollars, more than twice the size of its aggregate external liabilities. Other country case studies on illicit financial flows such as Frank Gunter’s (2003) on China or Prakash Loungani and Paolo Mauro’s (IMF, April 2000) research on Russia explicitly include trade misinvoicing as a conduit for illicit flows. Schneider (2003) considered it startling to see the increase in capital lost through this channel in East Asia since the mid-1980s.
17. A further shortcoming in the comparison of partner-country trade statistics is that not all mispriced trade results in a difference between export and import values. When the misinvoicing occurs within the same invoice as a matter of agreement between buyer and seller there is no recorded difference between export and import values. This is the case in much of the abusive transfer pricing by multinational corporations, who vary invoices as needed to shift profits and capital across borders. In fact, transactions that are completely faked, without any underlying reality, have become common and are especially difficult to estimate. Asset swaps, yet another conduit for illicit flows, which are also difficult to estimate with confidence, have become common with Russian entrepreneurs, Latin American businesspeople, and Chinese state-owned enterprises. In fact, such swaps are increasingly used to shift assets out of developing countries and into Western economies.
18. As discussed above, there may be a complicated relationship between trade misinvoicing and illicit financial flows because misinvoicing may be driven by other motives to circumvent trade restrictions or to take advantage of government subsidies. For instance, if there are trade restrictions such as high import duties, imports may be under-invoiced to lower the burden of customs duties. A further complication may arise if one were to consider the rate of income taxation in relation to customs duties. If income taxes are higher than duties, an importer may still come out ahead by paying high customs duties (by over-invoicing imports) so long as the loss in income or profit results in lower income taxes that more than offset the higher customs duties.
19. The relationship between trade misinvoicing and illicit financial flows can also become very complicated if there are active black markets in foreign exchange operating within a country. For instance, if black market exchange rates are attractive, an importer may over-invoice imports to reduce taxable income and then reap the additional
Global Financial Integrity Illicit Financial Flows from Developing Countries: 2002-2006
profit from exchanging it in the black market. These illicit profits can then be transferred abroad through one or more of the conduits of illicit flows with which the importer is familiar. On the export side, illicit financial flows are common when the black market premium is higher than the export subsidy. It will then be attractive to raise the necessary foreign exchange on the black market.
20. Compounding the issues in tracking illicit financial flows listed above, there are statistical issues as well that detract from the accuracy of reported trade data. Differences in recording systems and the proper identification of the origin and destination of goods—particularly in an increasingly globalized world where component parts to a final product might originate from a number of countries—can complicate the identification and recording of an accurate country of origin for goods. Moreover, floating exchange rates can introduce exchange conversion-related discrepancies (because such conversion procedures are not uniform across all countries), given the long transit times involved in the exports and imports of certain heavy machinery or bulk container goods across the globe. It would be nearly impossible to distinguish discrepancies due to statistical issues in recording from those that arise as a result of deliberate misinvoicing. For this reason—in what represents a new and unique methodology and a departure from existing literature and studies— this study employs a normalization (see Charts 1 and 2) technique to filter out smaller discrepancies in partner-country trade data (amounting to less than 10 percent of exports) which could arise due to statistical issues and may not indicate illicit financial flows.
21. It must be noted that the World Bank Residual model considers the totality of financial, not value, flows. For example, if a country exports a good invoiced below the world market price, that transaction will reflect a financial, not a value, flow. The value flow will correspond to the difference in between the actual and the market value at local market prices. Illicit flows in terms of value will be streaming out of that country even if monetary funds are not. Hence, the World Bank Residual estimates, or those obtained through the Hot Money (Narrow) model, should be added to Trade Misinvoicing estimates in order to more accurately capture illicit flows.
III. Selection of Methods
22. Six combinations of economic models were tested in this study to select one that provides the most comprehensive and unbiased estimate. The six model combinations tested were:
Hot Money (Narrow) + Trade Misinvoicing (Net) Hot Money (Narrow) + Trade Misinvoicing (GER )
World Bank Residual Model (CED) + Trade Misinvoicing (Net) World Bank Residual Model (CED) + Trade Misinvoicing (GER) World Bank Residual Model (NDF) + Trade Misinvoicing (Net) World Bank Residual Model (NDF) + Trade Misinvoicing (GER)
23. A review of the methods used to estimate illicit financial flows shows that data limitations can seriously
understate the volume of illicit financial flows from developing countries. In view of data limitations affecting the Hot Money (Narrow) model, this paper focuses on alternative versions of the World Bank Residual and the Trade Misinvoicing models to estimate the overall volume of illicit financial flows from developing countries.
24. As noted before, the World Bank Residual Model can be estimated using either the change in external debt (CED) or net flow of debt (NDF) as a source of financial resources for a country. However, while NDF data tend
Global Financial Integrity Illicit Financial Flows from Developing Countries: 2002-2006
to be less affected by valuation changes than the change in debt stocks, they are more likely to have gaps and be less-up-to-date compared to the CED data. These data issues may explain in general the somewhat lower illicit financial flows estimates based on NDF compared to those based on CED. The main limitation of the Net version of the Trade Misinvoicing model was that it gave undue credit to many developing countries for return of flight capital (that is an inflow of illicit capital) when in fact these countries did not implement a program of sustained economic reform that would be necessary to bring back such outflows. Hence, while all of the models have been utilized in our analysis of illicit financial flows, the CED-GER combination of models was selected as the most reliable for studying the pattern of illicit flows from developing countries.
IV. Process of Normalization
25. The previous discussion of the models used in this paper to estimate illicit financial flows has shown that some may significantly understate these flows. However, in arriving at a reliable estimate of illicit capital outflows, we must exercise care that such outflows are not overestimated either. The normalization process subjects the entire list of developing countries, for which data are available, to two filters: (i) estimates must have the right sign (indicating outflow, rather than inflow) in at least three out of the five years, and (ii) exceed the threshold (10 percent) with respect to exports valued at free-on-board (or f.o.b.) basis. Countries that pass through both filters are included in our estimates of illicit financial flows from the various regions of the developing world. The average and cumulative illicit flows for countries and regions exclude years when no such outflows are indicated. In contrast, the non-normalized method of deriving average and cumulative illicit flows for a country over the five-year period includes all cases where estimates had the right sign even for one year. In setting up this filter, the illicit financial flows-to-exports f.o.b. threshold ratio is set at 10 percent.
26. Under this normalization method, if model estimates indicate illicit financial flows out of a country in just two out of the five years (2002-2006), that country’s estimates are rejected and we consider that there was no illicit financial flows from that country for the entire five-year period. Of the group of countries that have passed this filter, those with levels of illicit financial flows below the threshold stated above are rejected as reflecting data discrepancies due to statistical issues. This two-stage process of reducing the risk of including spurious cases of illicit financial flows is known as Normalization (see Charts 1 and 2).
27. Non-normalized and normalized estimates of illicit financial flows represent the upper and lower bounds respectively of the possible range of illicit financial flows from developing countries generated by the combination of models presented in this paper. Charts 1 and 2 show the filtration process for the GER and CED models.
28. Chart 1 (see next page) depicts the filtering process of GER data as a schematic diagram which illustrates how 43 countries were eliminated (117 remained) after the first filter and overall illicit financial flows dropped to an average of $399.1 billion per year. This group was then passed through the second filter, eliminating another 60 countries (i.e., only 57 countries made it through both filters) indicating that an average of $371.4 billion per year was shifted out of developing countries through trade misinvoicing during 2002—2006. Note that although the number of countries fell precipitously as they passed through the filters, the overall volume of illicit financial flows fell at a much lower rate. This is because the top 20 countries that account for the major share of illicit financial flows were caught by our illicit financial flows net, while the smaller exporters of capital fell through.
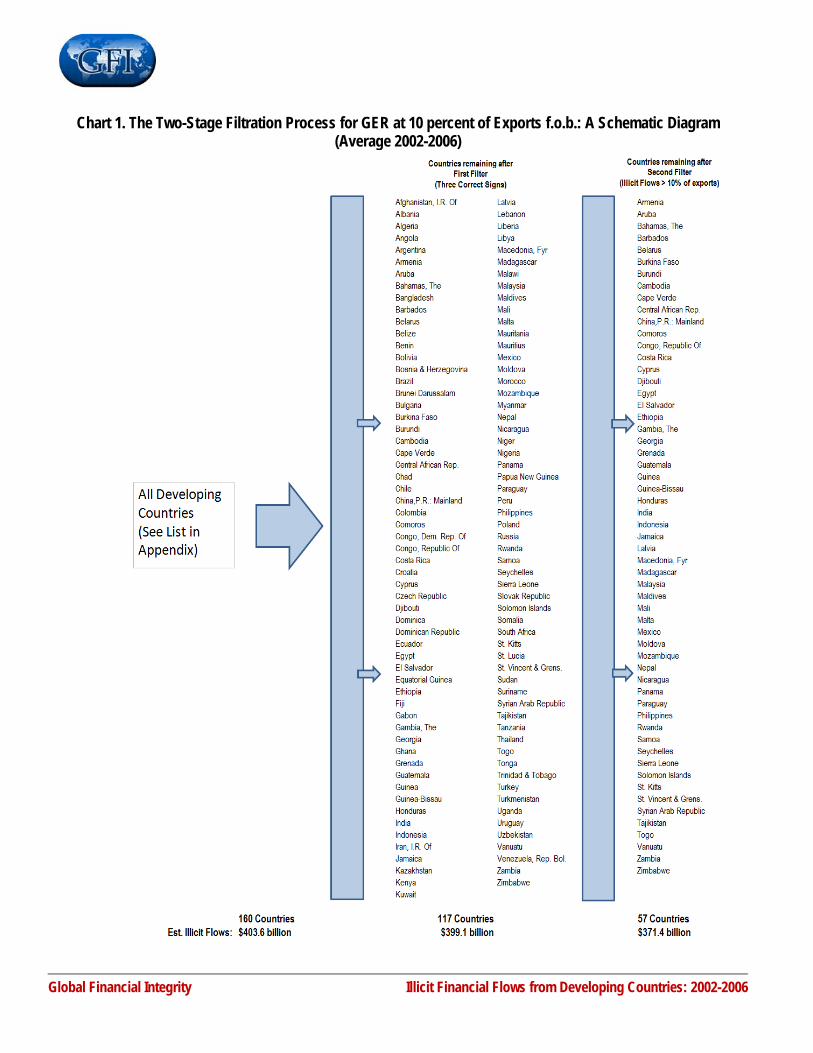
Chart 1. The Two-Stage Filtration Process for GER at 10 percent of Exports f.o.b.: A Schematic Diagram (Average 2002-2006)
Global Financial Integrity Illicit Financial Flows from Developing Countries: 2002-2006
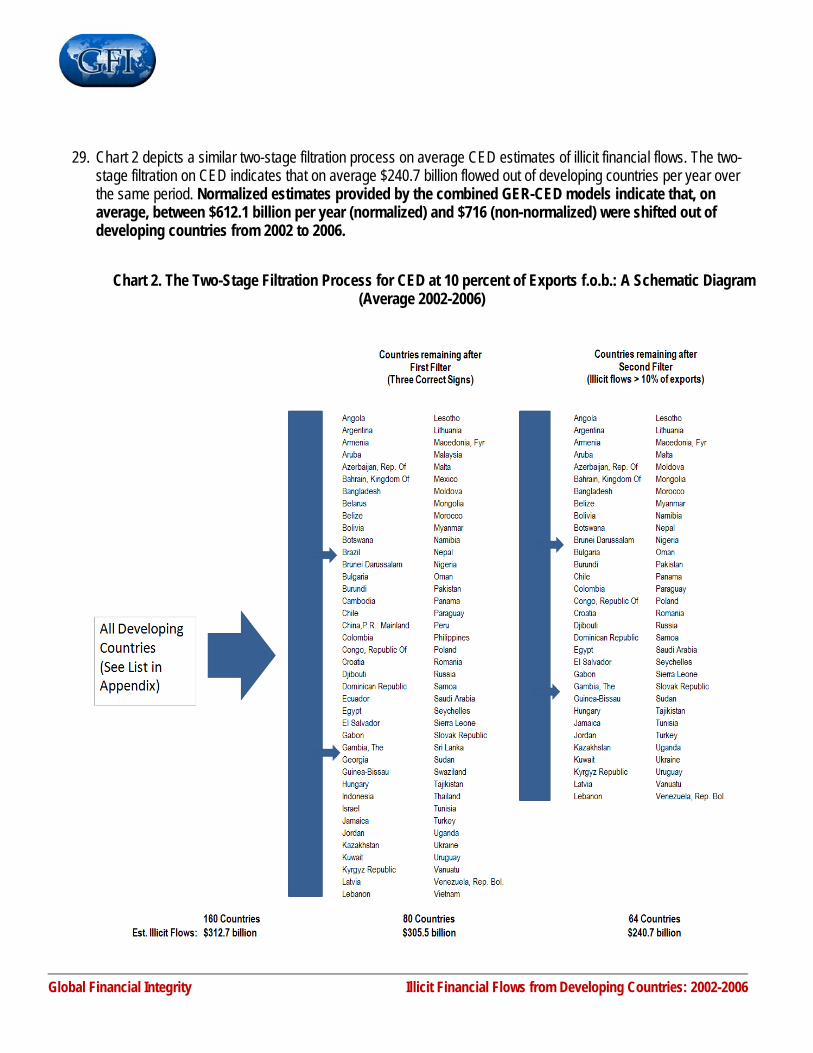
29. Chart 2 depicts a similar two-stage filtration process on average CED estimates of illicit financial flows. The two-stage filtration on CED indicates that on average $240.7 billion flowed out of developing countries per year over the same period. Normalized estimates provided by the combined GER-CED models indicate that, on average, between $612.1 billion per year (normalized) and $716 (non-normalized) were shifted out of developing countries from 2002 to 2006.
Chart 2. The Two-Stage Filtration Process for CED at 10 percent of Exports f.o.b.: A Schematic Diagram (Average 2002-2006)
Global Financial Integrity Illicit Financial Flows from Developing Countries: 2002-2006
V. Main Findings
Global Financial Integrity Illicit Financial Flows from Developing Countries: 2002-2006
$0
$200
$400
$600
$800
$1,000
$1,200
2002 2003 2004 2005 2006
Volume of Illicit Financial Flows From All Developing Countries 2002 - 2006
($billions)
Non‐Normalized
Normalized
Chart 3
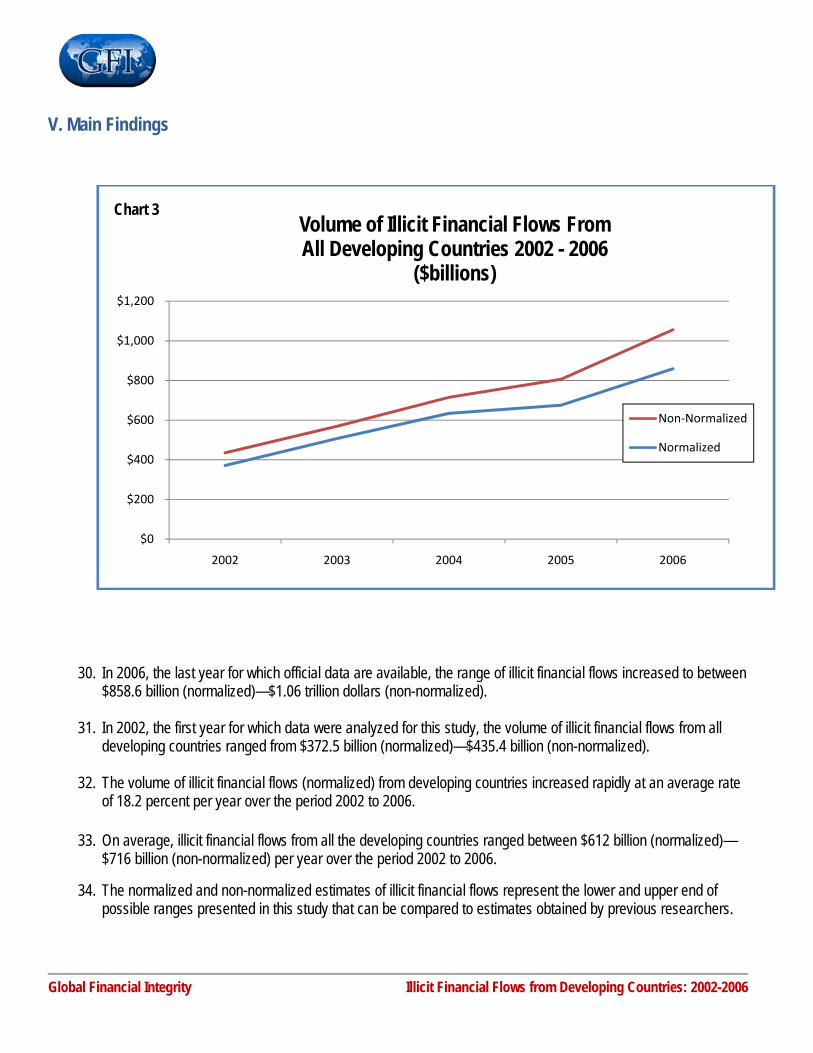
30. In 2006, the last year for which official data are available, the range of illicit financial flows increased to between $858.6 billion (normalized)—$1.06 trillion dollars (non-normalized).
31. In 2002, the first year for which data were analyzed for this study, the volume of illicit financial flows from all
developing countries ranged from $372.5 billion (normalized)—$435.4 billion (non-normalized).
32. The volume of illicit financial flows (normalized) from developing countries increased rapidly at an average rate of 18.2 percent per year over the period 2002 to 2006.
33. On average, illicit financial flows from all the developing countries ranged between $612 billion (normalized)—
$716 billion (non-normalized) per year over the period 2002 to 2006.
34. The normalized and non-normalized estimates of illicit financial flows represent the lower and upper end of possible ranges presented in this study that can be compared to estimates obtained by previous researchers.
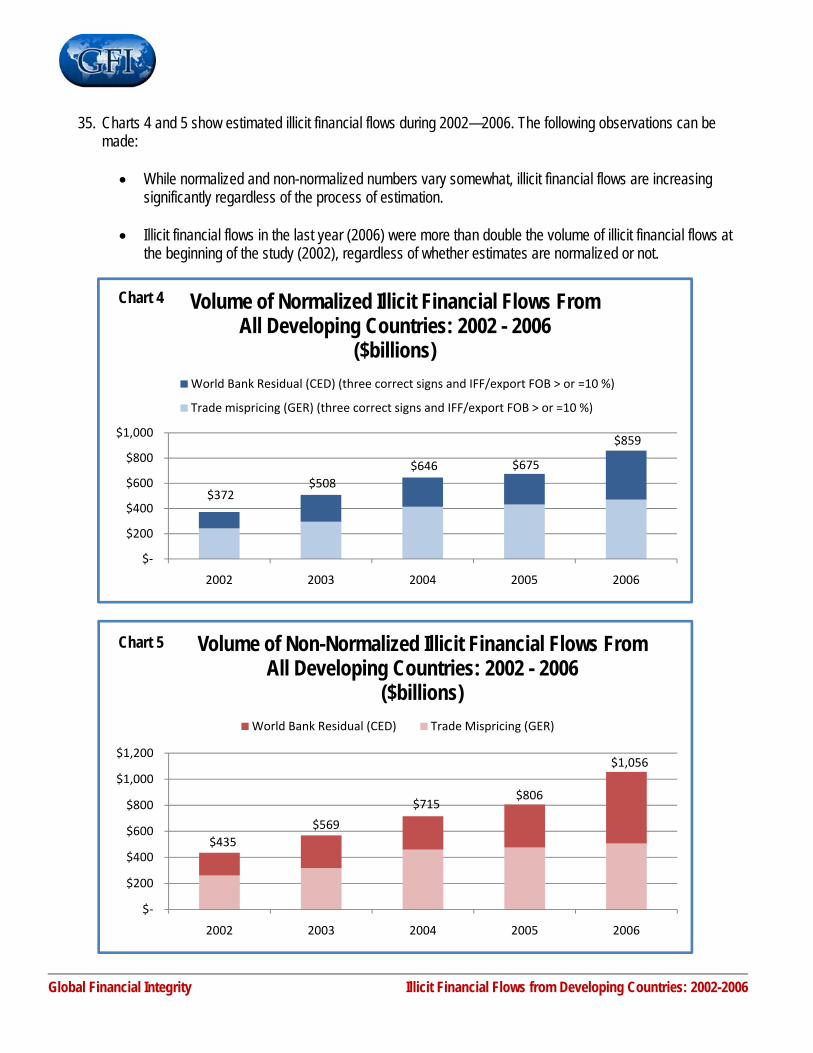
35. Charts 4 and 5 show estimated illicit financial flows during 2002—2006. The following observations can be made:
• While normalized and non-normalized numbers vary somewhat, illicit financial flows are increasing
significantly regardless of the process of estimation.
• Illicit financial flows in the last year (2006) were more than double the volume of illicit financial flows at the beginning of the study (2002), regardless of whether estimates are normalized or not.
$372 $508
$646 $675
$859
$‐
$200
$400
$600
$800
$1,000
2002 2003 2004 2005 2006
Volume of Normalized Illicit Financial Flows From All Developing Countries: 2002 - 2006
($billions)World Bank Residual (CED) (three correct signs and IFF/export FOB > or =10 %)
Trade mispricing (GER) (three correct signs and IFF/export FOB > or =10 %)
Chart 4
$435$569
$715$806
$1,056
$‐
$200
$400
$600
$800
$1,000
$1,200
2002 2003 2004 2005 2006
Volume of Non-Normalized Illicit Financial Flows From All Developing Countries: 2002 - 2006
($billions)World Bank Residual (CED) Trade Mispricing (GER)
Chart 5
Global Financial Integrity Illicit Financial Flows from Developing Countries: 2002-2006
Global Financial Integrity Illicit Financial Flows from Developing Countries: 2002-2006
Asia51%
MENA14%
Europe16%
Western Hemisphere
15%
Africa4%
Average (2002-2006) Illicit Financial Flows from Developing Country
Regions Based on CED-GER Models
Non-Normalized
Asia50%
MENA15%
Europe17%
Western Hemisphere
15%
Africa3%
Average (2002-2006) Illicit Financial Flows from Developing Country
Regions Based on CED-GER Models
owest
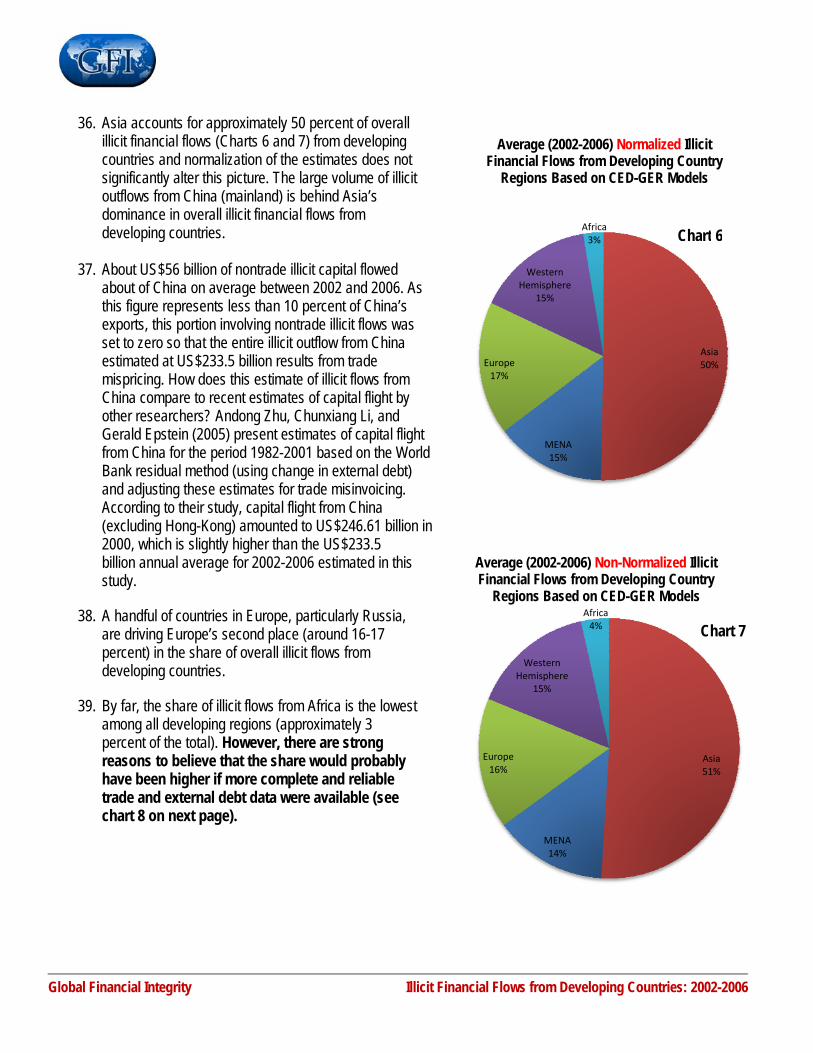
36. Asia accounts for approximately 50 percent of overall illicit financial flows (Charts 6 and 7) from developing countries and normalization of the estimates does not significantly alter this picture. The large volume of illicit outflows from China (mainland) is behind Asia’s dominance in overall illicit financial flows from developing countries.
Normalized
Chart 6
37. About US$56 billion of nontrade illicit capital flowed about of China on average between 2002 and 2006. As this figure represents less than 10 percent of China’s exports, this portion involving nontrade illicit flows was set to zero so that the entire illicit outflow from China estimated at US$233.5 billion results from trade mispricing. How does this estimate of illicit flows from China compare to recent estimates of capital flight by other researchers? Andong Zhu, Chunxiang Li, and Gerald Epstein (2005) present estimates of capital flight from China for the period 1982-2001 based on the World Bank residual method (using change in external debt) and adjusting these estimates for trade misinvoicing. According to their study, capital flight from China (excluding Hong-Kong) amounted to US$246.61 billion in 2000, which is slightly higher than the US$233.5 billion annual average for 2002-2006 estimated in this study.
38. A handful of countries in Europe, particularly Russia,
are driving Europe’s second place (around 16-17 percent) in the share of overall illicit flows from developing countries.
Chart 7
39. By far, the share of illicit flows from Africa is the lamong all developing regions (approximately 3 percent of the total). However, there are strong reasons to believe that the share would probably have been higher if more complete and reliable trade and external debt data were available (see chart 8 on next page).
Global Financial Integrity Illicit Financial Flows from Developing Countries: 2002-2006
36.8%
0.4%
34.9%
2.5%0.7%
05
10152025303540
Africa Asia MENA Europe Western Hemisphere
GDP for Countries with Missing Data,as a Percentage of Regional GDP
2002‐2006
Chart 8
40. Chart 8 shows that countries in Africa with missing data have a cumulative GDP accounting for nearly 37 percent of total African GDP. Missing data, representing MENA countries accounting for nearly 35 percent of regional GDP, also understates illicit flows from that region. The chart shows that data gaps do not seriously understate illicit flows from Asia, Europe, or the Western Hemisphere. This measure assumes that the understatement of illicit flows varies directly with the size of the economy relative to the region. For example, missing data on Congo, Democratic Republic is likely to understate illicit flows from Africa to a much larger extent than missing data on Lesotho (i.e., the larger the economy the larger the potential illicit flows, other things being equal).
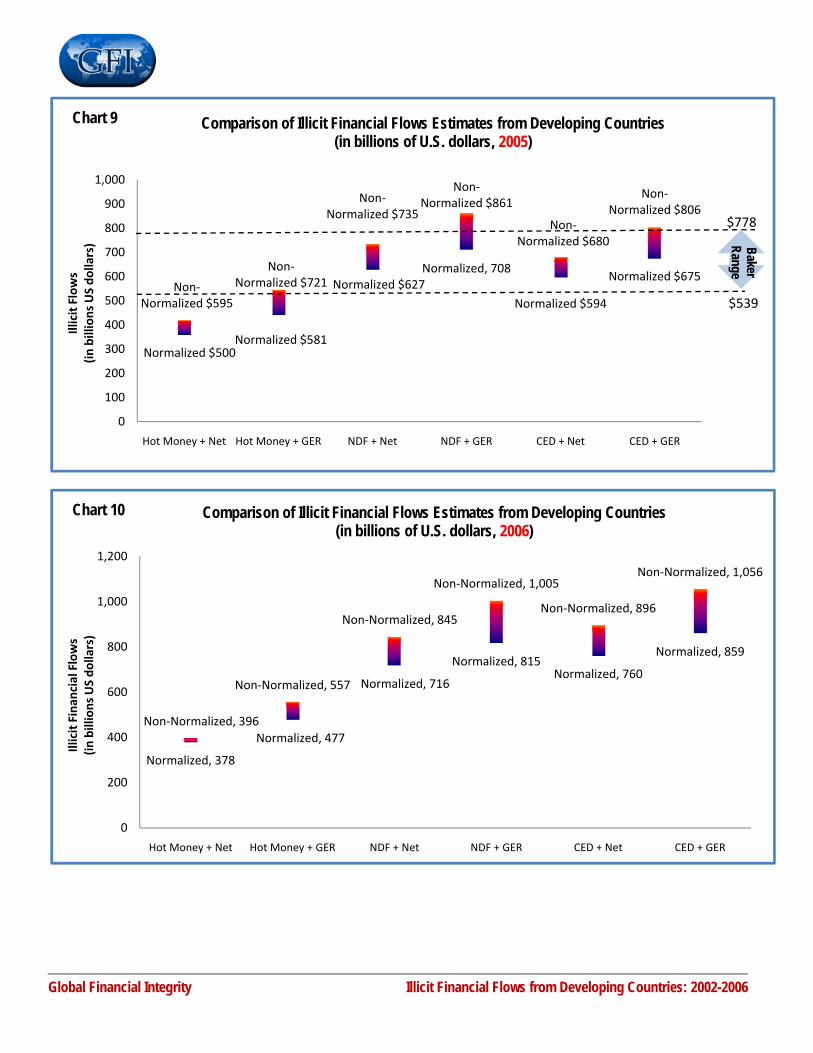
41. Given significant changes in the world economy such as the collapse of the Soviet Union, new states in Europe, and the rise of China, India and other emerging economies, the estimates obtained in this study can only be compared to the range obtained by Baker (2005) rather than those obtained in the dated World Bank (1994) study. This is the main reason why the normalized (low) and non-normalized (high) estimates obtained in this study are compared to range obtained by Baker in Chart 9.
42. Based on the survey method, Baker estimated that illicit financial flows from developing countries ranged from
$539 to $778 billion in 2005 (referred to as the “Baker Range”). All models used in the present study were subjected to a process of Normalization; the CED-GER models yield a slightly higher range ($675 to $806 billion) of illicit financial flows in 2005. In the following year, model estimates indicate that illicit financial flows from developing countries increased to at least $858 billion and up to $1 trillion.
43. Chart 10 depicts the estimates of illicit financial flows obtained by this study for 2006, the most recent year for
which data are available.
Normalized $500Normalized $581
Normalized $627Normalized, 708
Normalized $594
Normalized $675Non‐
Normalized $595
Non‐Normalized $721
Non‐Normalized $735
Non‐Normalized $861
Non‐Normalized $680
Non‐Normalized $806
0
100
200
300
400
500
600
700
800
900
1,000
Hot Money + Net Hot Money + GER NDF + Net NDF + GER CED + Net CED + GER
Illicit Flows
(in billions US do
llars)
Comparison of Illicit Financial Flows Estimates from Developing Countries(in billions of U.S. dollars, 2005)
BakerRange
Chart 9
$778
$539
Global Financial Integrity Illicit Financial Flows from Developing Countries: 2002-2006
Normalized, 378
Normalized, 477
Normalized, 716
Normalized, 815Normalized, 760
Normalized, 859
Non‐Normalized, 396
Non‐Normalized, 557
Non‐Normalized, 845
Non‐Normalized, 1,005
Non‐Normalized, 896
Non‐Normalized, 1,056
0
200
400
600
800
1,000
1,200
Hot Money + Net Hot Money + GER NDF + Net NDF + GER CED + Net CED + GER
Illicit Finan
cial Flows
(in billions US do
llars)
Comparison of Illicit Financial Flows Estimates from Developing Countries(in billions of U.S. dollars,
2006)Chart 10
Global Financial Integrity Illicit Financial Flows from Developing Countries: 2002-2006
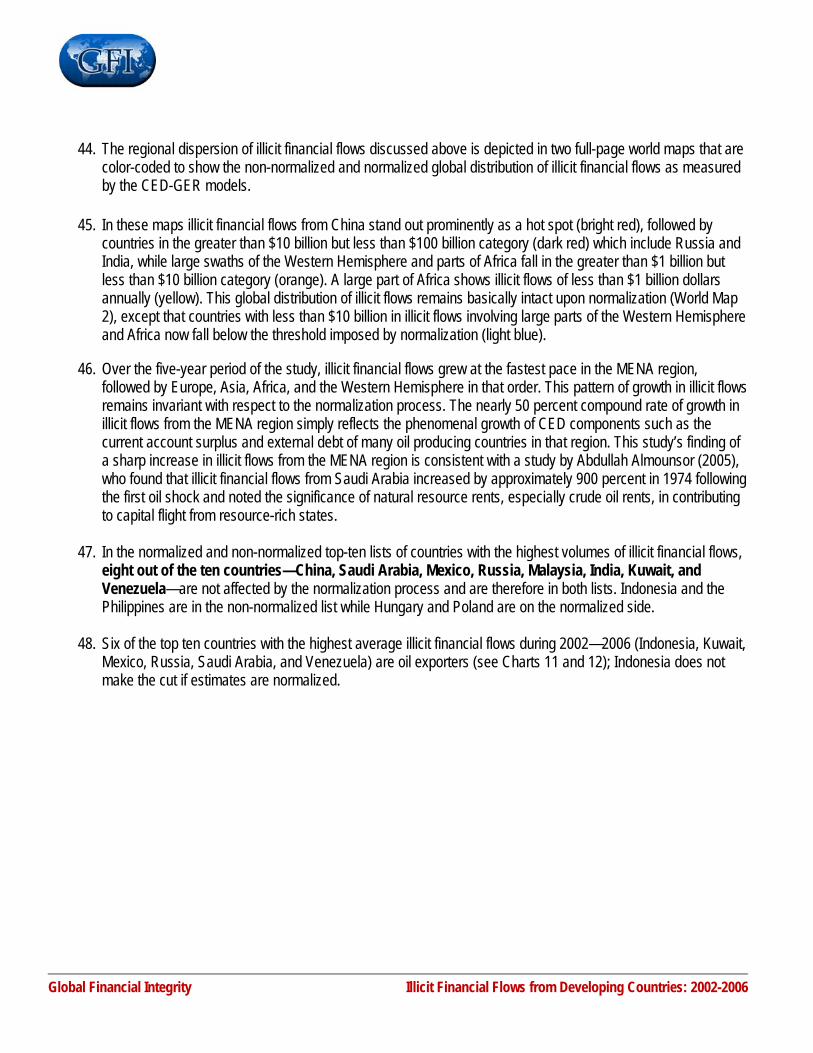
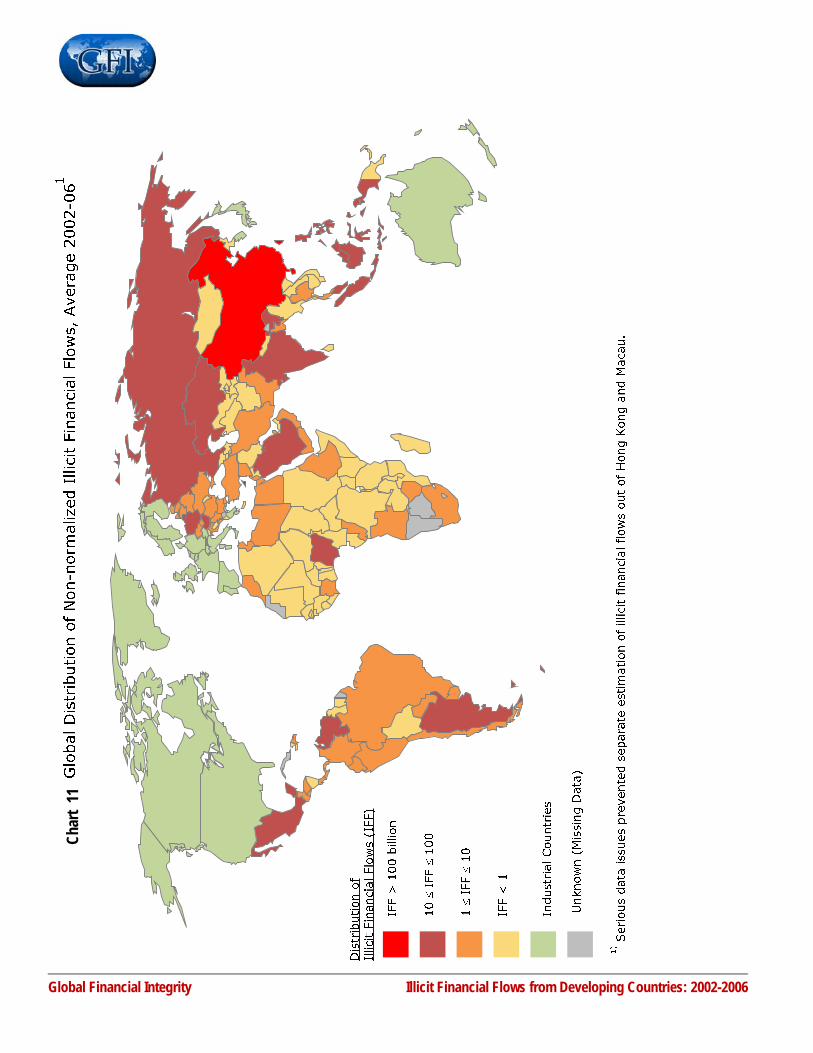
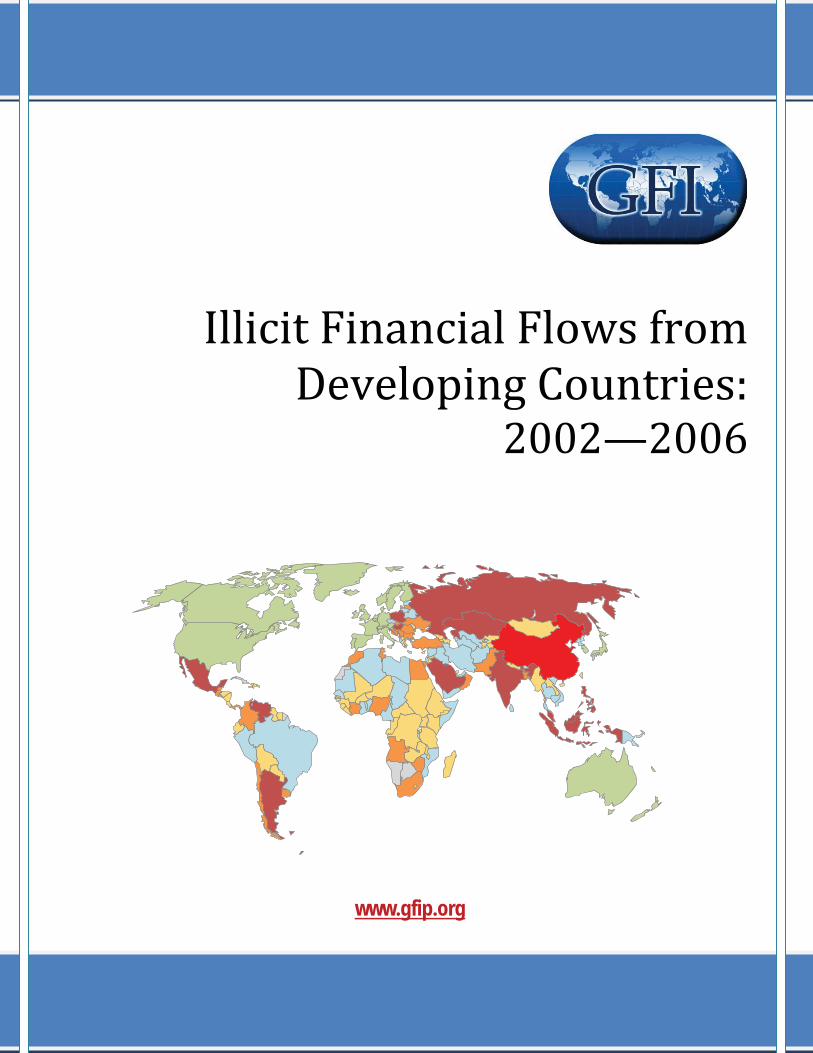
44. The regional dispersion of illicit financial flows discussed above is depicted in two full-page world maps that are color-coded to show the non-normalized and normalized global distribution of illicit financial flows as measured by the CED-GER models.
45. In these maps illicit financial flows from China stand out prominently as a hot spot (bright red), followed by
countries in the greater than $10 billion but less than $100 billion category (dark red) which include Russia and India, while large swaths of the Western Hemisphere and parts of Africa fall in the greater than $1 billion but less than $10 billion category (orange). A large part of Africa shows illicit flows of less than $1 billion dollars annually (yellow). This global distribution of illicit flows remains basically intact upon normalization (World Map 2), except that countries with less than $10 billion in illicit flows involving large parts of the Western Hemisphere and Africa now fall below the threshold imposed by normalization (light blue).
46. Over the five-year period of the study, illicit financial flows grew at the fastest pace in the MENA region,
followed by Europe, Asia, Africa, and the Western Hemisphere in that order. This pattern of growth in illicit flows remains invariant with respect to the normalization process. The nearly 50 percent compound rate of growth in illicit flows from the MENA region simply reflects the phenomenal growth of CED components such as the current account surplus and external debt of many oil producing countries in that region. This study’s finding of a sharp increase in illicit flows from the MENA region is consistent with a study by Abdullah Almounsor (2005), who found that illicit financial flows from Saudi Arabia increased by approximately 900 percent in 1974 following the first oil shock and noted the significance of natural resource rents, especially crude oil rents, in contributing to capital flight from resource-rich states.
47. In the normalized and non-normalized top-ten lists of countries with the highest volumes of illicit financial flows,
eight out of the ten countries—China, Saudi Arabia, Mexico, Russia, Malaysia, India, Kuwait, and Venezuela—are not affected by the normalization process and are therefore in both lists. Indonesia and the Philippines are in the non-normalized list while Hungary and Poland are on the normalized side.
48. Six of the top ten countries with the highest average illicit financial flows during 2002—2006 (Indonesia, Kuwait,
Mexico, Russia, Saudi Arabia, and Venezuela) are oil exporters (see Charts 11 and 12); Indonesia does not make the cut if estimates are normalized.
Global Financial Integrity Illicit Financial Flows from Developing Countries: 2002-2006
Char
t 11
Global Financial Integrity Illicit Financial Flows from Developing Countries: 2002-2006
Char
t 12
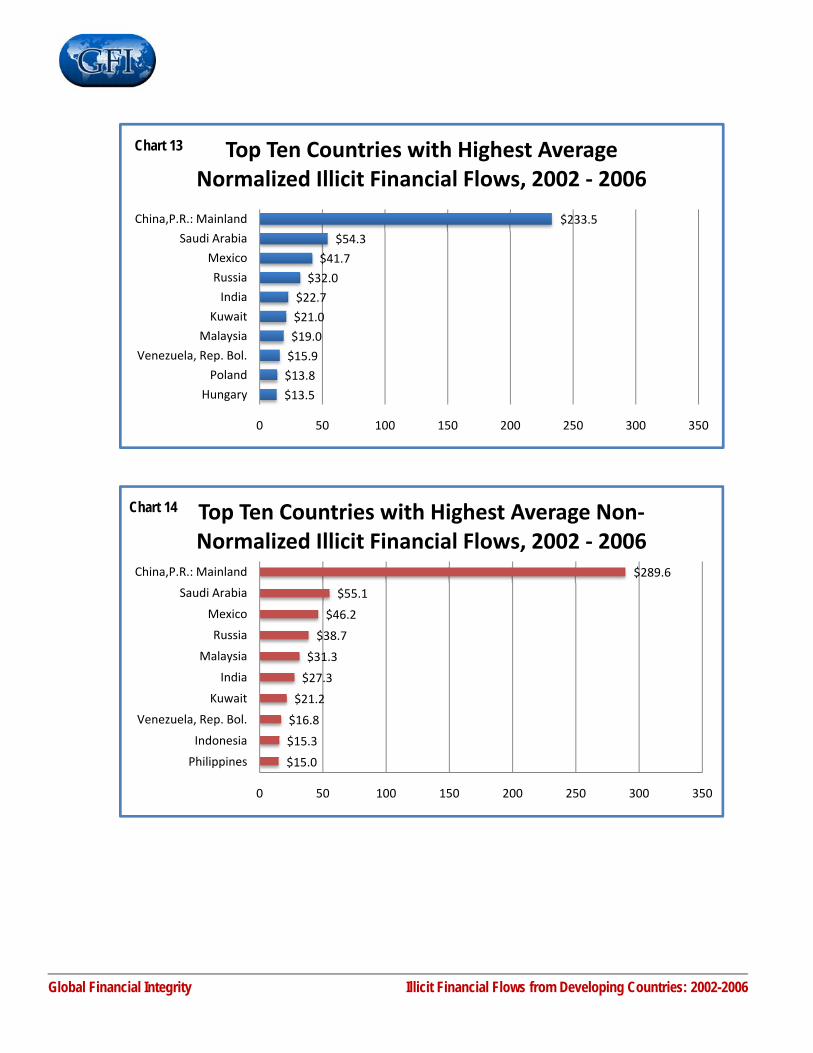
$13.5
$13.8
$15.9
$19.0
$21.0
$22.7
$32.0
$41.7
$54.3
$233.5
0 50 100 150 200 250 300 350
Hungary
Poland
Venezuela, Rep. Bol.
Malaysia
Kuwait
India
Russia
Mexico
Saudi Arabia
China,P.R.: Mainland
Top Ten Countries with Highest Average Normalized Illicit Financial Flows, 2002 ‐ 2006
Chart 13
$15.0
$15.3
$16.8
$21.2
$27.3
$31.3
$38.7
$46.2
$55.1
$289.6
0 50 100 150 200 250 300 350
Philippines
Indonesia
Venezuela, Rep. Bol.
Kuwait
India
Malaysia
Russia
Mexico
Saudi Arabia
China,P.R.: Mainland
Top Ten Countries with Highest Average Non‐Normalized Illicit Financial Flows, 2002 ‐ 2006
Chart 14
Global Financial Integrity Illicit Financial Flows from Developing Countries: 2002-2006
Global Financial Integrity Illicit Financial Flows from Developing Countries: 2002-2006
VI. Summary of Findings and Conclusions 49. Out of the models for estimating illicit financial flows reviewed in this study, the World Bank Residual model
combined with the Trade Mispricing model provided the most unbiased and robust estimates of illicit financial flows (as data limitations were minimal).
50. Illicit financial flows driven by illicit activities are growing at a rapid and steady pace, draining poor countries of
billions of dollars every year. 51. In a regional breakdown, this study found that developing Asia accounts for around half of the overall illicit flows
from developing countries. The disproportionate volume of illicit flows from mainland China led Asia to dominate in overall illicit flows from developing countries and makes a strong case for future research to carry out an in-depth analysis of the factors driving such outflow from mainland China.
52. A handful of countries in Europe, including Russia, put Europe in second place (around 16-17 percent) in the
share of overall illicit flows from developing countries. Again, a separate study is warranted given the paucity of in-depth research on illicit flows from Russia following the recent dramatic surge in crude oil prices. Average normalized illicit flows from Western Hemisphere (at 15.2 percent of the average for all developing countries) are slightly more than the average illicit capital outflows from the MENA region (at 14.8 percent). By far, the share of illicit flows from Africa is the lowest among all developing regions (approximately 3 percent of the total). However, there are strong reasons to believe that the share of Africa in total illicit flows would probably be higher if more complete and reliable external debt data were available.
53. Over the period 2002-2006, illicit financial flows grew at the fastest pace in the MENA region, followed by
Europe, Asia, Africa, and the Western Hemisphere, in that order. This pattern of growth in illicit flows remains invariant with respect to the normalization process. The nearly 50 percent compound rate of growth in illicit flows from the MENA region reflects the exponential growth of CED components such as the current account surplus and external debt of many oil producing countries in that region. At the same time, GER registers a low figure because as noted earlier, oil trade presents somewhat constrained opportunities for trade mispricing. Europe registers a compound annual rate of growth in illicit flows of nearly 25 percent (whether estimates are normalized or not) mainly reflecting the huge and growing outflows from Russia.
54. Due to the fact that official statistics cannot fully capture the volume of illicit financial flows from developing
countries, estimates of these flows based on existing economic models are likely to understate the actual problem. Hence, normalized estimates of illicit flows from developing countries and regions are likely to be extremely conservative.
A longer version of this report, also authored by Lead Economist Dev Kar and Research Associate Devon Cartwright-Smith, includes technical subject matter, additional details about the models utilized and a full statistical appendix. This version is likely to be of interest to economists.
The Statistical Appendix in the longer version of the report includes 20 tables. The first three show the nature and extent of capital controls in developing countries, the system of classifying developing countries, and the extent of data deficiencies affecting the Hot Money (Narrow) model. The remaining tables provide alternative estimates of illicit financial flows through trade misinvoicing and the summary estimates of non-normalized and normalized illicit financial flows provided by the various models and the regional breakdown of these estimates. Two tables show the non-normalized and normalized estimates of illicit outflows for individual countries obtained by applying the CED-GER models. The final table lists the 28 countries and the volume of illicit flows which were eliminated through the normalization procedures. Both versions of this report are available for download at www.gfip.org.
Global Financial Integrity (GFI) promotes national and multilateral policies, safeguards, and agreements aimed at curtailing the cross-border flow of illegal money. In putting forward solutions, facilitating strategic partnerships, and conducting groundbreaking research, GFI is leading the way in efforts to curtail illicit financial flows and enhance global development and security.
Global Financial Integrity Illicit Financial Flows from Developing Countries: 2002-2006

Global Financial Integrity Illicit Financial Flows from Developing Countries: 2002-2006
Appendices
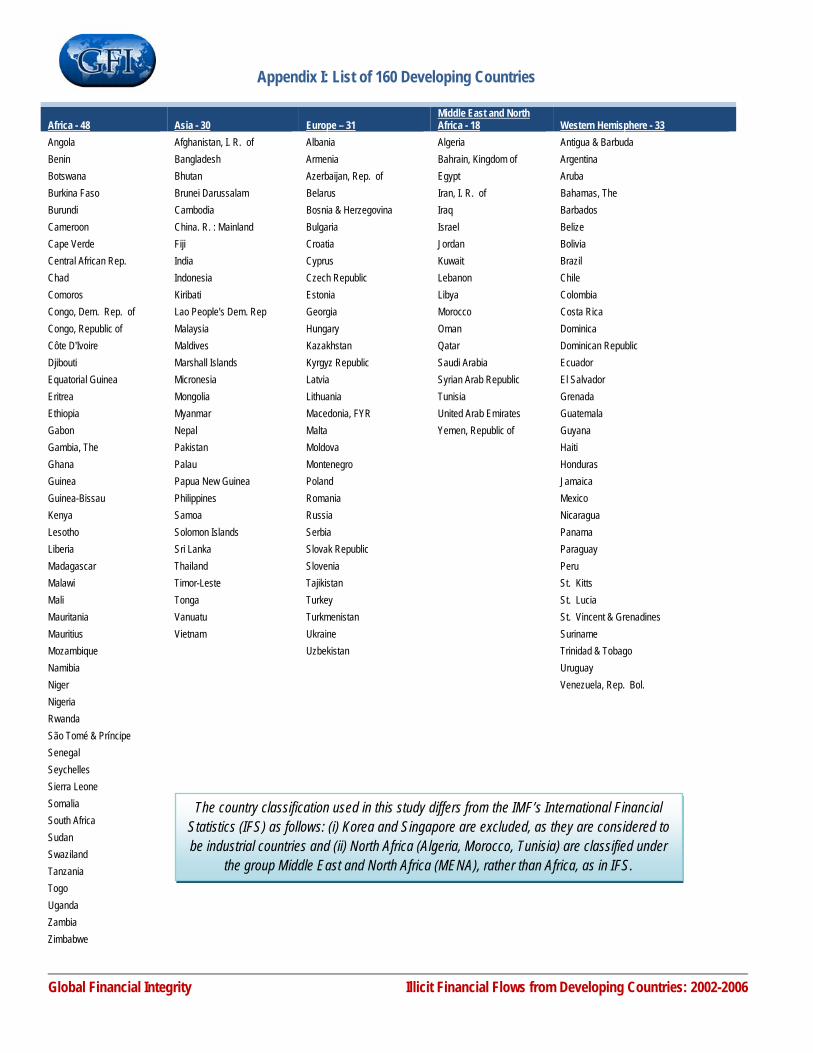
Appendix I: List of 160 Developing Countries
Global Financial Integrity Illicit Financial Flows from Developing Countries: 2002-2006
Africa - 48 Asia - 30
Middle East and North Africa - 18Europe – 31 Western Hemisphere - 33
Angola Afghanistan, I. R. of Albania Algeria Antigua & Barbuda Benin Bangladesh Armenia Bahrain, Kingdom of Argentina Botswana Bhutan Azerbaijan, Rep. of Egypt Aruba Burkina Faso Brunei Darussalam Belarus Iran, I. R. of Bahamas, The Burundi Cambodia Bosnia & Herzegovina Iraq Barbados Cameroon China. R. : Mainland Bulgaria Israel Belize Cape Verde Fiji Croatia Jordan Bolivia Central African Rep. India Cyprus Kuwait Brazil Chad Indonesia Czech Republic Lebanon Chile Comoros Kiribati Estonia Libya Colombia Congo, Dem. Rep. of Lao People's Dem. Rep Georgia Morocco Costa Rica Congo, Republic of Malaysia Hungary Oman Dominica Côte D'Ivoire Maldives Kazakhstan Qatar Dominican Republic Djibouti Marshall Islands Kyrgyz Republic Saudi Arabia Ecuador Equatorial Guinea Micronesia Latvia Syrian Arab Republic El Salvador Eritrea Mongolia Lithuania Tunisia Grenada Ethiopia Myanmar Macedonia, FYR United Arab Emirates Guatemala Gabon Nepal Malta Yemen, Republic of Guyana Gambia, The Pakistan Moldova Haiti Ghana Palau Montenegro Honduras Guinea Papua New Guinea Poland Jamaica Guinea-Bissau Philippines Romania Mexico Kenya Samoa Russia Nicaragua Lesotho Solomon Islands Serbia Panama Liberia Sri Lanka Slovak Republic Paraguay Madagascar Thailand Slovenia Peru Malawi Timor-Leste Tajikistan St. Kitts Mali Tonga Turkey St. Lucia Mauritania Vanuatu Turkmenistan St. Vincent & Grenadines Mauritius Vietnam Ukraine Suriname Mozambique Uzbekistan Trinidad & Tobago Namibia Uruguay Niger Venezuela, Rep. Bol. Nigeria Rwanda São Tomé & Príncipe Senegal Seychelles Sierra Leone Somalia South Africa Sudan Swaziland Tanzania Togo Uganda Zambia Zimbabwe
The country classification used in this study differs from the IMF’s International Financial Statistics (IFS) as follows: (i) Korea and Singapore are excluded, as they are considered to be industrial countries and (ii) North Africa (Algeria, Morocco, Tunisia) are classified under
the group Middle East and North Africa (MENA), rather than Africa, as in IFS.
Global Financial Integrity Illicit Financial Flows from Developing Countries: 2002-2006
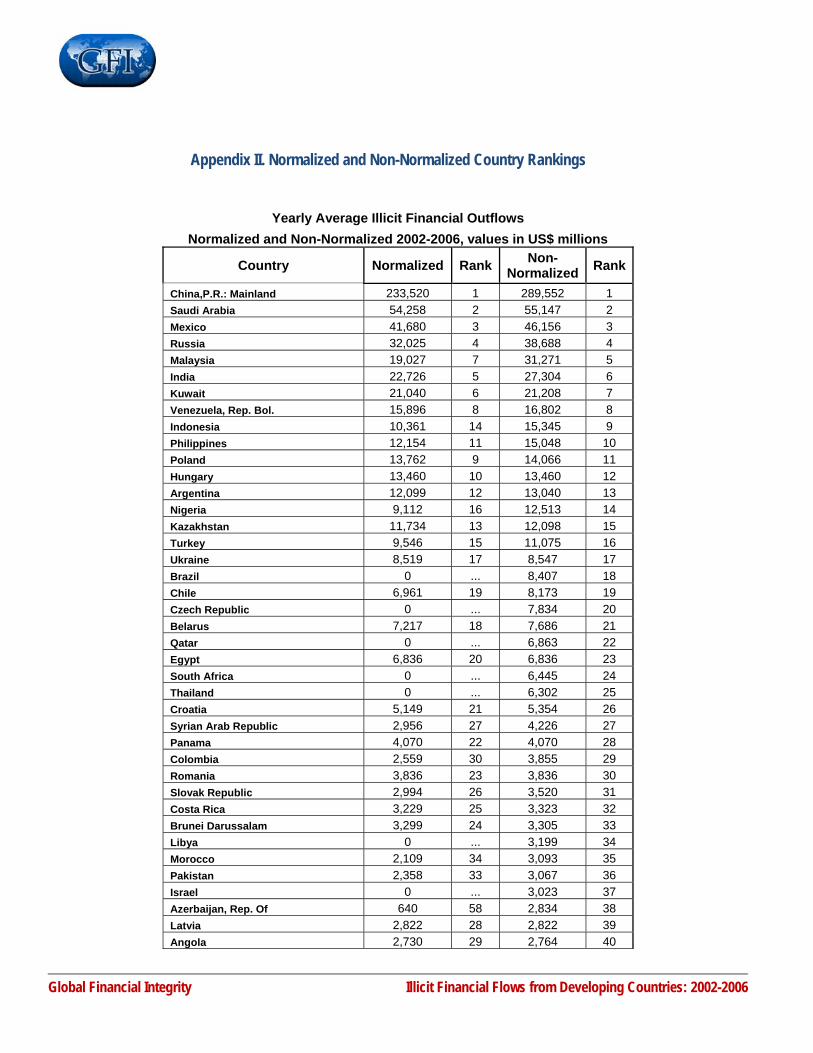
Appendix II. Normalized and Non-Normalized Country Rankings
Yearly Average Illicit Financial Outflows
Normalized and Non-Normalized 2002-2006, values in US$ millions
Country Normalized Rank Non-Normalized Rank
China,P.R.: Mainland 233,520 1 289,552 1 Saudi Arabia 54,258 2 55,147 2 Mexico 41,680 3 46,156 3 Russia 32,025 4 38,688 4 Malaysia 19,027 7 31,271 5 India 22,726 5 27,304 6 Kuwait 21,040 6 21,208 7 Venezuela, Rep. Bol. 15,896 8 16,802 8 Indonesia 10,361 14 15,345 9 Philippines 12,154 11 15,048 10 Poland 13,762 9 14,066 11 Hungary 13,460 10 13,460 12 Argentina 12,099 12 13,040 13 Nigeria 9,112 16 12,513 14 Kazakhstan 11,734 13 12,098 15 Turkey 9,546 15 11,075 16 Ukraine 8,519 17 8,547 17 Brazil 0 ... 8,407 18 Chile 6,961 19 8,173 19 Czech Republic 0 ... 7,834 20 Belarus 7,217 18 7,686 21 Qatar 0 ... 6,863 22 Egypt 6,836 20 6,836 23 South Africa 0 ... 6,445 24 Thailand 0 ... 6,302 25 Croatia 5,149 21 5,354 26 Syrian Arab Republic 2,956 27 4,226 27 Panama 4,070 22 4,070 28 Colombia 2,559 30 3,855 29 Romania 3,836 23 3,836 30 Slovak Republic 2,994 26 3,520 31 Costa Rica 3,229 25 3,323 32 Brunei Darussalam 3,299 24 3,305 33 Libya 0 ... 3,199 34 Morocco 2,109 34 3,093 35 Pakistan 2,358 33 3,067 36 Israel 0 ... 3,023 37 Azerbaijan, Rep. Of 640 58 2,834 38 Latvia 2,822 28 2,822 39 Angola 2,730 29 2,764 40
Global Financial Integrity Illicit Financial Flows from Developing Countries: 2002-2006
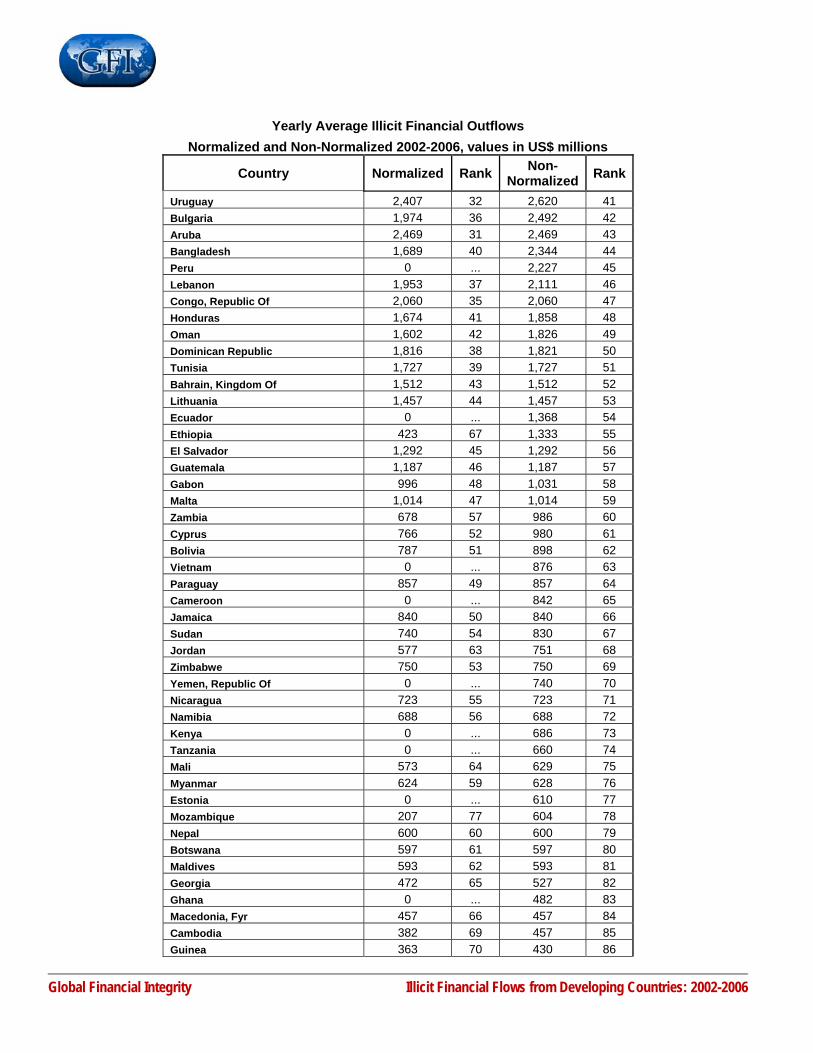
Yearly Average Illicit Financial Outflows Normalized and Non-Normalized 2002-2006, values in US$ millions
Country Normalized Rank Non-Normalized Rank
Uruguay 2,407 32 2,620 41 Bulgaria 1,974 36 2,492 42 Aruba 2,469 31 2,469 43 Bangladesh 1,689 40 2,344 44 Peru 0 ... 2,227 45 Lebanon 1,953 37 2,111 46 Congo, Republic Of 2,060 35 2,060 47 Honduras 1,674 41 1,858 48 Oman 1,602 42 1,826 49 Dominican Republic 1,816 38 1,821 50 Tunisia 1,727 39 1,727 51 Bahrain, Kingdom Of 1,512 43 1,512 52 Lithuania 1,457 44 1,457 53 Ecuador 0 ... 1,368 54 Ethiopia 423 67 1,333 55 El Salvador 1,292 45 1,292 56 Guatemala 1,187 46 1,187 57 Gabon 996 48 1,031 58 Malta 1,014 47 1,014 59 Zambia 678 57 986 60 Cyprus 766 52 980 61 Bolivia 787 51 898 62 Vietnam 0 ... 876 63 Paraguay 857 49 857 64 Cameroon 0 ... 842 65 Jamaica 840 50 840 66 Sudan 740 54 830 67 Jordan 577 63 751 68 Zimbabwe 750 53 750 69 Yemen, Republic Of 0 ... 740 70 Nicaragua 723 55 723 71 Namibia 688 56 688 72 Kenya 0 ... 686 73 Tanzania 0 ... 660 74 Mali 573 64 629 75 Myanmar 624 59 628 76 Estonia 0 ... 610 77 Mozambique 207 77 604 78 Nepal 600 60 600 79 Botswana 597 61 597 80 Maldives 593 62 593 81 Georgia 472 65 527 82 Ghana 0 ... 482 83 Macedonia, Fyr 457 66 457 84 Cambodia 382 69 457 85 Guinea 363 70 430 86
Global Financial Integrity Illicit Financial Flows from Developing Countries: 2002-2006
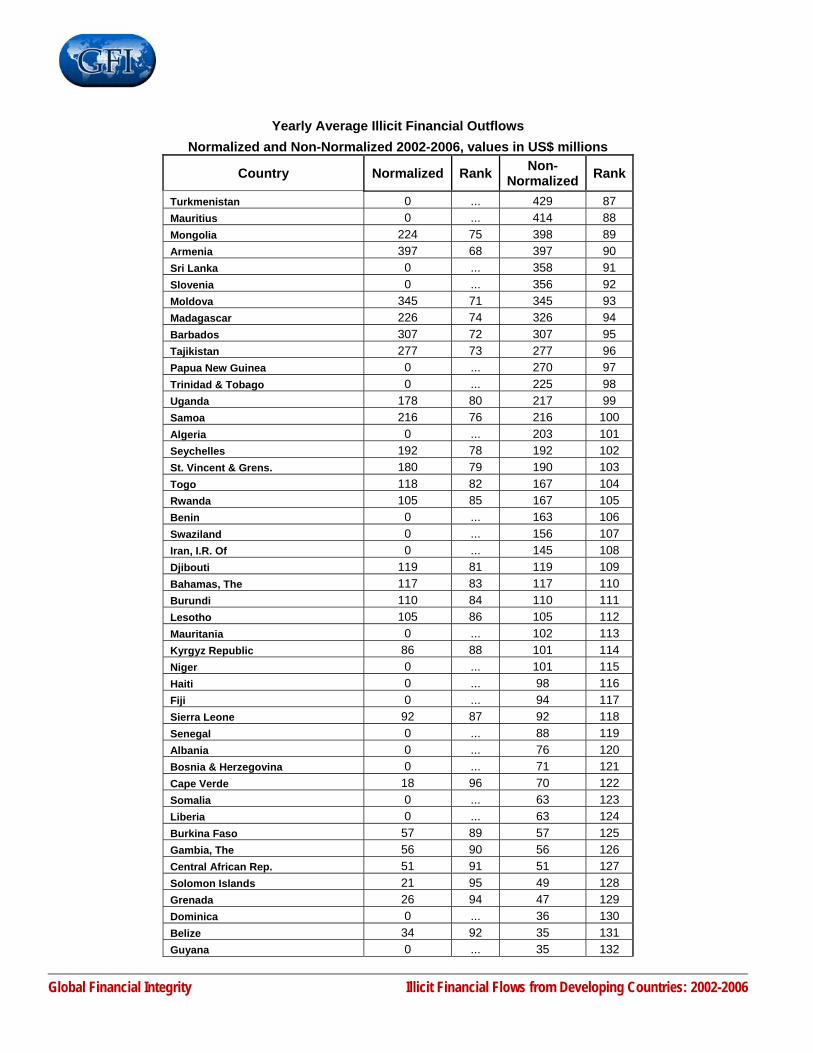
Yearly Average Illicit Financial Outflows Normalized and Non-Normalized 2002-2006, values in US$ millions
Country Normalized Rank Non-Normalized Rank
Turkmenistan 0 ... 429 87 Mauritius 0 ... 414 88 Mongolia 224 75 398 89 Armenia 397 68 397 90 Sri Lanka 0 ... 358 91 Slovenia 0 ... 356 92 Moldova 345 71 345 93 Madagascar 226 74 326 94 Barbados 307 72 307 95 Tajikistan 277 73 277 96 Papua New Guinea 0 ... 270 97 Trinidad & Tobago 0 ... 225 98 Uganda 178 80 217 99 Samoa 216 76 216 100 Algeria 0 ... 203 101 Seychelles 192 78 192 102 St. Vincent & Grens. 180 79 190 103 Togo 118 82 167 104 Rwanda 105 85 167 105 Benin 0 ... 163 106 Swaziland 0 ... 156 107 Iran, I.R. Of 0 ... 145 108 Djibouti 119 81 119 109 Bahamas, The 117 83 117 110 Burundi 110 84 110 111 Lesotho 105 86 105 112 Mauritania 0 ... 102 113 Kyrgyz Republic 86 88 101 114 Niger 0 ... 101 115 Haiti 0 ... 98 116 Fiji 0 ... 94 117 Sierra Leone 92 87 92 118 Senegal 0 ... 88 119 Albania 0 ... 76 120 Bosnia & Herzegovina 0 ... 71 121 Cape Verde 18 96 70 122 Somalia 0 ... 63 123 Liberia 0 ... 63 124 Burkina Faso 57 89 57 125 Gambia, The 56 90 56 126 Central African Rep. 51 91 51 127 Solomon Islands 21 95 49 128 Grenada 26 94 47 129 Dominica 0 ... 36 130 Belize 34 92 35 131 Guyana 0 ... 35 132
Global Financial Integrity Illicit Financial Flows from Developing Countries: 2002-2006
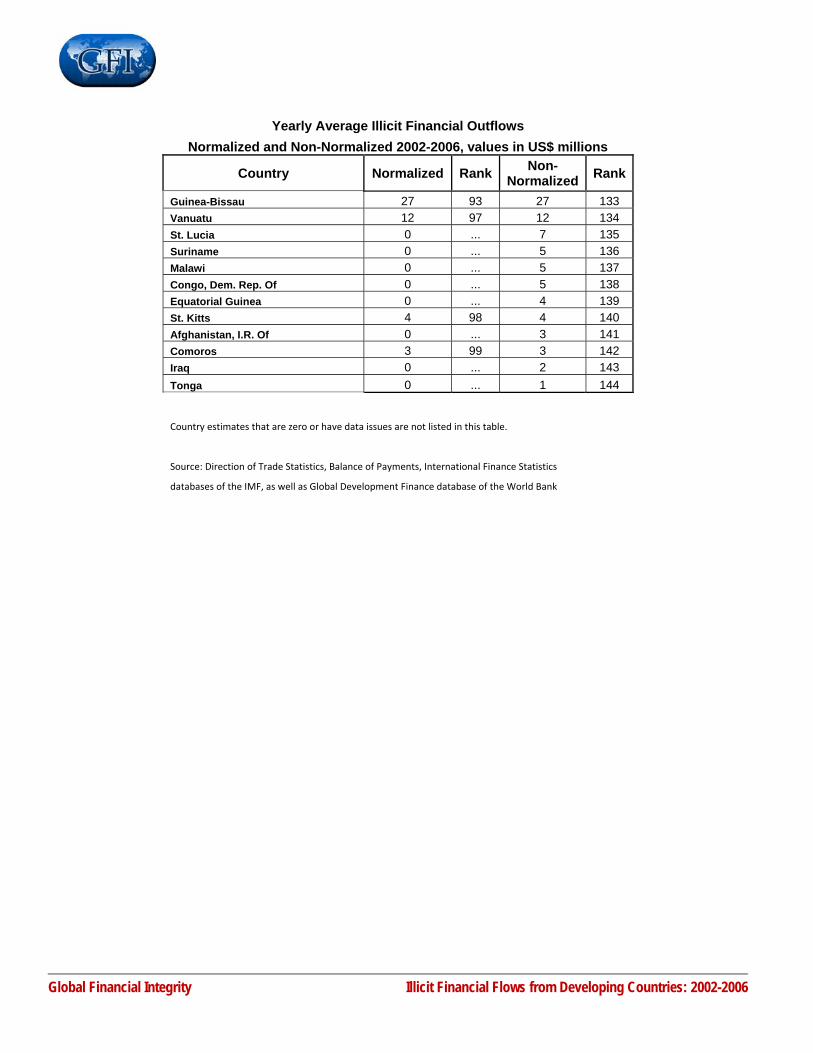
Yearly Average Illicit Financial Outflows Normalized and Non-Normalized 2002-2006, values in US$ millions
Country Normalized Rank Non-Normalized Rank
Guinea-Bissau 27 93 27 133 Vanuatu 12 97 12 134 St. Lucia 0 ... 7 135 Suriname 0 ... 5 136 Malawi 0 ... 5 137 Congo, Dem. Rep. Of 0 ... 5 138 Equatorial Guinea 0 ... 4 139 St. Kitts 4 98 4 140 Afghanistan, I.R. Of 0 ... 3 141 Comoros 3 99 3 142 Iraq 0 ... 2 143 Tonga 0 ... 1 144
Country estimates that are zero or have data issues are not listed in this table.
Source: Direction of Trade Statistics, Balance of Payments, International Finance Statistics
databases of the IMF, as well as Global Development Finance database of the World Bank
Global Financial Integrity Illicit Financial Flows from Developing Countries: 2002-2006
Appendix III. References
Abalkin, A and J. Whalley, 1999, The Problem of Capital Flight from Russia, The World Economy, May, Vol. 22, No. 3, 412-444.
Almounsor, Abdullah 2005, A Development Comparative Approach to Capital Flight: the Case of the Middle East and North Africa, 1970-2002 in Capital Flight and Capital Controls in Developing Countries, Edited by Gerald A. Epstein, pp. 234-261, Edward Elgar, Cheltenham, United Kingdom.
Baker, Raymond W., 2005, Capitalism’s Achilles Heel: Dirty Money and How to Renew the Free-Market System, John Wiley & Sons, Inc., Hoboken, New Jersey, United States.
Bhagwati, Jagdish N., 1967, Fiscal Policies, the Faking of Foreign Trade Declarations and the Balance of Payments, Bulletin of the Oxford University Institute of Statistics, February.
Bhagwati, Jagdish N, 1964, On the Under-Invoicing of Imports, Bulletin of the Oxford University, Institute of Economics and Statistics, 26, pp. 389-97.
Bhagwati, Jagdish, Krueger, Anne, and Wibulswasdi, C., 1974, Capital Flight from LDCs: A Statistical Analysis, Illegal Transactions in International Trade (Ed.) J.N. Bhagwati, North Holland, and Amsterdam.
Cerra, Valerie, Rishi, Meenakshi , and Saxena, Sweta C. 2005, Robbing the Riches: Capital Flight, Institutions, and Instability, IMF Working Paper (WP/05/199, October, 2005).
Chang, P.H. Kevin, and Robert E. Cumby, 1991, Capital Flight in Sub-Saharan African Countries, in Ishrat Husain and John Underwood, eds. African External Finance in the 1990s, World Bank, pp. 162-184, Washington, DC.
Chipalkatti, Niranjan, and Meenakshi Rishi, 2001, External Debt and Capital Flight in the Indian Economy, Oxford Development Studies, Vol. 29, No. 1, pp. 31–44.
Cuddington, J., 1986, Capital Flight: Estimates, Issues, and Explanations, Princeton Studies in International Finance, No. 58.
Dooley, Michael, P., 1986, Country Specific Risk Premiums, Capital Flight and Net Investment Income Payments in Selected Developing Countries, International Monetary Fund, Departmental Memorandum, Washington DC.
Dooley, Michael, Helkie, W., Tyron, R. and Underwood, J., 1986, An Analysis of External Debt Positions in Eight Developing Countries through 1990, Journal of Developing Economics, pp. 283-318.
Dooley, Michael P., and Kenneth M. Kletzer, 1994, Capital Flight, External Debt and Domestic Policies, NBER Working Paper 4793 (Cambridge, Massachusetts: National Bureau of Economic Research).
Dornbusch, Rudiger, 1990, Capital Flight: Theory, Measurement and Policy Issues, Occasional Paper No. 2 (Washington: Inter-American Development Bank).
Global Financial Integrity Illicit Financial Flows from Developing Countries: 2002-2006
Fischer, Stanley, Ernesto Hernández-Catá, and Mohsin S. Khan, 1998, Africa: This Is a Turning Point? Paper presented at the American Economic Association meeting, Chicago, January 3–5.
Fischer, Stanley and Ratna Sahay, 1999, The Transition Economies after Ten Years, Draft, International Monetary Fund (October).
Gulati, Ravi, A Note on Trade Misinvoicing, in Capital Flight and Third World Debt, Lessard, Donald and John Williamson (eds.), Institute for International Economics, Washington DC.
Gunter, Frank R., 2004, Capital Flight from China, China Economic Review, Vol. 15, pp. 63-85.
Henry, Lester, 1996, Capital Flight from Beautiful Places: The Case of Three Caribbean Countries, International Review of Applied Economics, Vol. 10, No. 2, pp. 263–72.
Hermes, Niels, and Robert Lensink, 1992. The Magnitude and Determinants of Capital Flight: The Case for Six Sub-Saharan African Countries, De Economist, Vol. 140, No. 4, pp. 515–30.
Hermes, Niels, and Robert Lensink, 2001, Capital Flight and the Uncertainty of Government Policies, Economics Letters, Vol. 71, No. 3, pp. 377–81.
International Monetary Fund, 2006, Annual Report on Exchange Arrangements and Exchange Restrictions, 2006, Washington DC.
Kant, Chander, 1996, Foreign Direct Investment and Capital Flight, Princeton Studies in International Finance, No. 80, April.
Khan, Mohsin S., and Nadeem Ul Haque, 1985, Foreign Borrowing and Capital Flight: A Formal Analysis, Staff Papers, International Monetary Fund, Vol. 32 (December).
Khan, Moshin and N. Ul Haque, 1987, Capital Flight from Developing Countries, Finance and Development, March, pp. 2-5.
Le, Quan V., and Meenakshi Rishi, 2006, Corruption and Capital Flight: An Empirical Assessment, International Economic Journal, Vol. 20, No. 4, pp. 523-540, December.
Lessard, Donald and John Williamson eds., 1984, Capital Flight and Third World Debt, Washington DC, Institute for International Economics.
Loungani, Prakash and Paolo Mauro 2000, Capital Flight from Russia, Conference on Post-Election Strategy, Moscow, April 2000.
Moghadam, Mashaallah Rahnama, Hedayeh Samavati, and David A. Dilts, 2003, An Examination of Capital Flight from East Asian Emerging Economies: Paradise Lost, Journal of Asia-Pacific Business, Vol. 5, No. 1, pp. 33–49.
Morgan Guaranty Trust Company, 1986, LDC Capital Flight, World Financial Markets, March, pp. 13-15.
Global Financial Integrity Illicit Financial Flows from Developing Countries: 2002-2006
Motala, John, 1997, Statistical Discrepancies in the World Current Account, Finance and Development, International Monetary Fund, March 1997, Vol. 34, No. 1.
Nayak, Dinkar N., 1999, Capital Flight from India (1975-1995), Foreign Trade Review: Quarterly Journal of the Indian Institute of Foreign Trade (India); 34, No. 2, pp. 57-73.
Ndikumana, Léonce and James K. Boyce, 2008, New Estimates of Capital Flight from Sub-Saharan African Countries: Linkages with External Borrowing and Policy Options, University of Massachusetts, Amherst, April.
Ndung’u, Njuguna, 2007, Keynote Address by Governor, Central Bank of Kenya at the Senior Policy Seminar on Implications of Capital Flight for Macroeconomic Management and Growth in Sub-Saharan Africa, South African Reserve Bank, October.
NGO Documents for the Earth Summit, 1992, Treaty 15: Capital Flight and Corruption Treaty, Non-Governmental Organization Alternative Treaties at the 1992 Global Forum.
Schineller, Lisa, 1997, An Econometric Model of Capital Flight from Developing Countries, Federal Reserve Board, International Finance Discussion Paper No. 579.
Schneider, Benu, 2003, Measuring Capital Flight: Estimates and Interpretations, Working Paper No. 194, Overseas Development Institute, London, United Kingdom, March.
Sheets, Nathan, 1996, Capital Flight from the Countries in Transition: Some Empirical Evidence, Journal of Policy Reform, Vol. 1, pp. 259-277.
Sicular, Terry, 1998, Capital Flight and Foreign Investment: Two Tales from China and Russia, The World Economy, July, Vol. 21, No. 5, pp. 589-602.
Tikhomirov, Vladimir, 1997, Capital Flight from Post-Soviet Russia, Europe-Asia Studies, Vol. 49, No. 4, pp. 591-616.
Varman-Schneider, B., 1991, Capital Flight from Developing Countries, Westview Press, Boulder, Colorado, USA.
Walter, Ingo, 1987, The Mechanisms of Capital Flight, in Lessard, Donald R. and Williamson, J., Capital Flight and Third World Debt, Institute for International Economics.
World Bank, 1985, World Development Report, Washington DC, Oxford University Press for the World Bank.
Zhu, Andong, Chunxiang Li, and Gerald Epstein, 2005, Capital Flight from China, 1982-2001, in Capital Flight and Capital Controls in Developing Countries, Edited by Gerald A. Epstein, pp. 234-261, Edward Elgar, Cheltenham, United Kingdom.
Global Financial Integrity Illicit Financial Flows from Developing Countries: 2002-2006
Appendix IV: Biographies DR. DEV KAR Lead Economist, Study Author
Dev Kar is a Lead Economist at the Global Financial Integrity Program, Center for International Policy. Prior to joining CIP, Dr. Kar was a Senior Economist at the International Monetary Fund (IMF), Washington DC. During a career spanning nearly 32 years at the IMF, he worked on a wide variety of macroeconomic and statistical issues, both at IMF headquarters and on different types of IMF missions to member countries (technical assistance, Article IV Consultations with member countries, and Use of IMF Resources).
Dr. Kar’s assignments at the IMF included: (i) research studies on the functions and role of central banks which formed the basis for the design, development, and implementation of a large-scale database on laws, regulations, and data on various aspects of central banking operations, (ii) technical papers on the operational budget of the IMF, (iii) carrying out complex IMF operational transactions with member countries, (iv) review of IMF lending programs involving the use of its financial resources in order to assess sovereign and liquidity risks, (v) the monitoring of economic and political developments in Heavily Indebted Poor Countries (HIPC) and in Poverty Reduction and Growth Facility (PRGF)-eligible countries, (vi) preparation of research papers and discussion notes on the role of the SDR in the international monetary system and the use of the SDR as a unit of account by multilateral institutions, (vii) critiquing technical assistance papers based on expert technical knowledge of international methodological guidelines on national accounts, price statistics, and merchandise trade, (viii) providing technical assistance to member countries in the area of national accounts, prices, and external trade in order to build members' statistical capacities, (ix) preparing papers for discussion by the IMF Executive Board on recent cases of overdue financial obligations of certain members and assessing the likelihood of payments by these countries, (x) preparing short papers on the external debt situation of heavily indebted countries and providing technical assistance to IMF economists in forecasting external debt profiles, (xi) conducting extensive research on early warning models that seek to predict an external debt crisis for heavily indebted countries, and (xii) developing statistical measures and indicators on quantitative and non-quantitative trade restrictions, dumping, and other trade policy issues, comparing them across countries and within countries over time. Dr. Kar has a Ph.D. in Economics from the George Washington University (Major: Monetary Economics), an M. Phil (Economics), also from the same university (Major: International Economics) and a M.S. (Computer Science) from Howard University (Major: Database Management Systems). He obtained an undergraduate degree in Physics from St. Xavier’s College, University of Calcutta, India. Dev has published a number of articles on macroeconomic and statistical issues both inside and outside the IMF.
DEVON CARTWRIGHT-SMITH Senior Research Associate, Study Co-Author
Devon Cartwright-Smith is the Senior Research Associate at Global Financial Integrity. He is also currently in the Doctoral Program in Economics at Georgetown University. Prior to joining GFI, Mr. Cartwright-Smith was the Operations Analyst at Baker & Taylor, the largest U.S. distributor of books, music and movies for libraries and retailers, with six branches nationwide. While there, he reengineered the previous approach to data collection and processing into vastly more efficient methods. He moved the company from a manual reporting framework to a fully automated Excel-driven reporting system. He was regularly sought out by several other departments, company-wide, to develop creative solutions to problems and operational inefficiencies.
Global Financial Integrity Illicit Financial Flows from Developing Countries: 2002-2006
Mr. Cartwright-Smith graduated from Bates College in 2003 with a degree in Economics. For his senior thesis, he acquired data from over 1100 completed eBay auctions using original scripts written in Excel, defined new market spaces for item types, and created and parameterized a pair of models, one for each market space, that determined, in a linear regression analysis, the final price in an auction and, alternatively, the number of bidders in an auction. In 2001 he won a competitive fellowship, where he was retained as a consultant to advise the city of Lewiston, Maine on strategies for implementing a mixed-income housing initiative.
RAYMOND W. BAKER Director, Global Financial Integrity
Raymond Baker is an internationally respected authority on corruption, money laundering, growth and foreign policy issues in developing and transitional economies and the impact of these problems on western economic and foreign interests. He has written and spoken extensively, testified before U.S. Senate and House committees and U.K. Parliamentary committees, been quoted worldwide, and has commented frequently on television and radio in the United States, Europe and Asia on legislative matters and policy questions, including appearances on Nightline, CNN, BBC, NPR, ABC, Four Corners in Australia and Fifth Estate in Canada, among others. He is the author of Capitalism’s Achilles Heel: Dirty Money and How to Renew the Free-Market System (John Wiley & Sons), recognized by the Financial Times as one of the best business books of 2005
Mr. Baker is a Guest Scholar at the Brookings Institution and a Senior Fellow at the Center for International Policy where he directs the Global Financial Integrity (GFI) program.
Global Financial Integrity Advisory Board
Charles Davidson - ChairPublisher & CEO, The American Interest
Jack BlumAttorney
Lord Daniel BrennanMember, House of Lords
Francis FukuyamaDirector, International Development Program, Johns Hopkins University
John G. HeimannFormer Comptroller of the Currency
Kenneth M. JensenExecutive Director, American Committees on Foreign Relations
Eva Joly Advisor to the Norwegian Agency for Development Cooperation
David LandesProfessor Emeritus, Harvard University
Moisés NaímEditor, Foreign Policy
Ngozi Okonjo-IwealaManaging Director, World Bank
Thomas PoggeProfessor of Philosophy and International Affairs, Yale University
John C. WhiteheadFormer Co-Chairman, Goldman, Sachs & Co
�
Global Financial Integrity A Program of the Center for International Policy
1319 18th Street, NW - Suite 200 - Washington, DC 20036 - 202.293.0740 www.gfip.org
�
�
��
�
�������������
�� �����
������������
����������������������
�
�
�Global�Financial�Integrity� ��������Illicit�Financial�Flows�from�Developing�Countries:�2002�2006���
�
�
�
�
�
�
�
�
�
www.gfip.org


![MolecularBasesof β-ThalassemiaintheEastern … · 2019. 8. 1. · all mutations [12]. β-thalassemia is endemic in the Arab countries including the countries of the Gulf region [8].](https://static.fdocument.org/doc/165x107/6118baffcd7aab41412ae422/molecularbasesof-thalassemiaintheeastern-2019-8-1-all-mutations-12-thalassemia.jpg)