IL NUOVO CIMENTO - arxiv.org fileIL NUOVO CIMENTO Galaxies as a cosmological test P. J. E. Peebles...
9
IL NUOVO CIMENTO Galaxies as a cosmological test P. J. E. Peebles Joseph Henry Laboratories, Princeton University, Princeton, NJ USA Summary. — The relativistic ΛCDM cosmological model has passed a demand- ing network of tests that convincingly demonstrate it is a useful approximation to what happened back to high redshift. But there are anomalies in its application to structure formation on the scales of galaxies that show we have much to learn about what this theory actually predicts and possibly something also of value to learn about the fundamental theoretical basis for observational cosmology. This is slightly revised and enlarged from a contribution to A Century of Cos- mology, Venice, August 2007. PACS 98.62.Ai – Origin and evolution of galaxies. PACS 98.80.-k – Cosmology. 1. – Introduction The completion of a tight network of tests of the ΛCDM cosmology is a remarkable and important advance. But does it signify completion of the fundamental physics that will be needed in the analysis of this and future generations of observational cosmology? Or might we only have arrived at the simplest approximation we can get away with at the present level of the evidence? The history of physical science offers precedents for the latter: advances tend to be followed in due course by deeper advances. The general acceptance of ΛCDM as the working standard is good strategy: if this cos- mology is not an adequate approximation to reality it will become manifest in anomalies. One may also to seek alternative physics [1] with deeper roots that may fit the present cosmological tests as well as or eventually better than ΛCDM. This too has a proud tradition: Einstein’s argument that a reasonable universe is homogeneous took no note of what astronomers may have told him about how the nearby stars are distributed. Yet another philosophy takes a proactive empirical line: seek anomalies, and search for them on the possibly more fertile ground of the galaxies, below the scales of the present successful cosmological tests. I discuss here two issues in galaxy phenomenology that seem to me to be particularly interesting challenges to standard ideas. c Societ` a Italiana di Fisica 1 arXiv:0712.2757v1 [astro-ph] 17 Dec 2007
Transcript of IL NUOVO CIMENTO - arxiv.org fileIL NUOVO CIMENTO Galaxies as a cosmological test P. J. E. Peebles...
IL NUOVO CIMENTO
Galaxies as a cosmological test
P. J. E. Peebles
Joseph Henry Laboratories, Princeton University, Princeton, NJ USA
Summary. — The relativistic ΛCDM cosmological model has passed a demand-ing network of tests that convincingly demonstrate it is a useful approximation towhat happened back to high redshift. But there are anomalies in its applicationto structure formation on the scales of galaxies that show we have much to learnabout what this theory actually predicts and possibly something also of value tolearn about the fundamental theoretical basis for observational cosmology.
This is slightly revised and enlarged from a contribution to A Century of Cos-mology, Venice, August 2007.
PACS 98.62.Ai – Origin and evolution of galaxies.PACS 98.80.-k – Cosmology.
1. – Introduction
The completion of a tight network of tests of the ΛCDM cosmology is a remarkableand important advance. But does it signify completion of the fundamental physics thatwill be needed in the analysis of this and future generations of observational cosmology?Or might we only have arrived at the simplest approximation we can get away with atthe present level of the evidence? The history of physical science offers precedents forthe latter: advances tend to be followed in due course by deeper advances.
The general acceptance of ΛCDM as the working standard is good strategy: if this cos-mology is not an adequate approximation to reality it will become manifest in anomalies.One may also to seek alternative physics [1] with deeper roots that may fit the presentcosmological tests as well as or eventually better than ΛCDM. This too has a proudtradition: Einstein’s argument that a reasonable universe is homogeneous took no noteof what astronomers may have told him about how the nearby stars are distributed.Yet another philosophy takes a proactive empirical line: seek anomalies, and search forthem on the possibly more fertile ground of the galaxies, below the scales of the presentsuccessful cosmological tests. I discuss here two issues in galaxy phenomenology thatseem to me to be particularly interesting challenges to standard ideas.
c© Societa Italiana di Fisica 1
arX
iv:0
712.
2757
v1 [
astr
o-ph
] 1
7 D
ec 2
007
2 P. J. E. PEEBLES
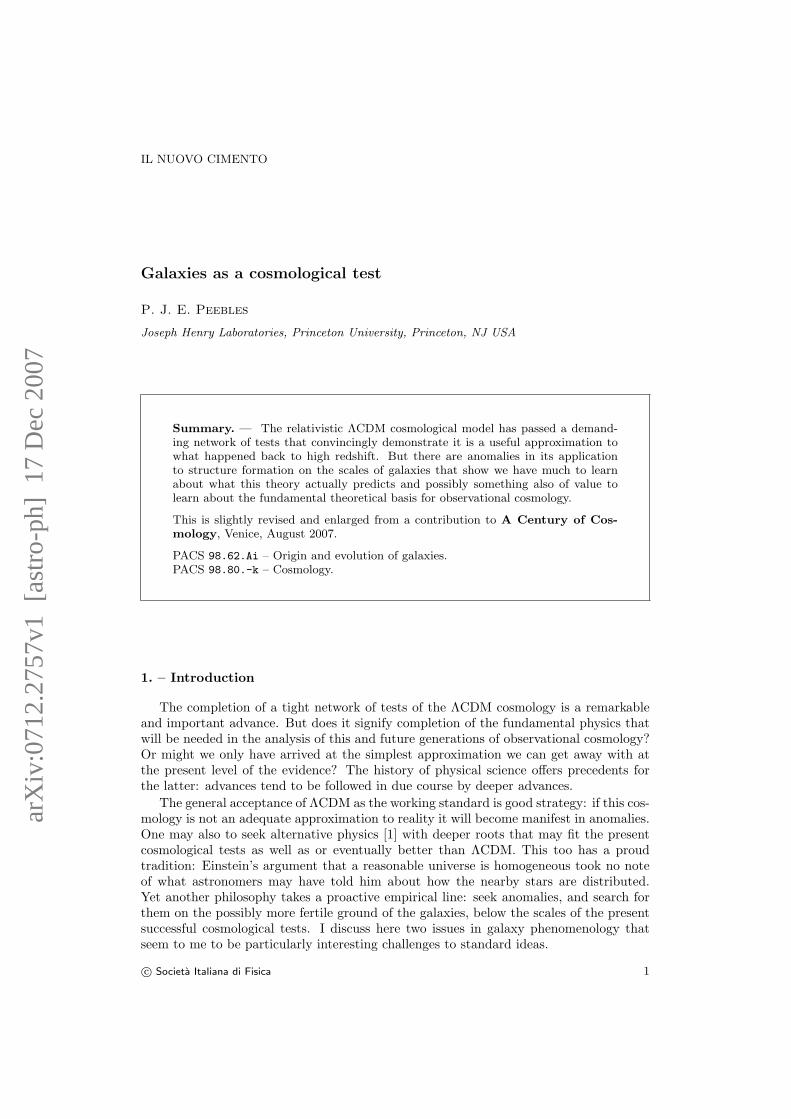
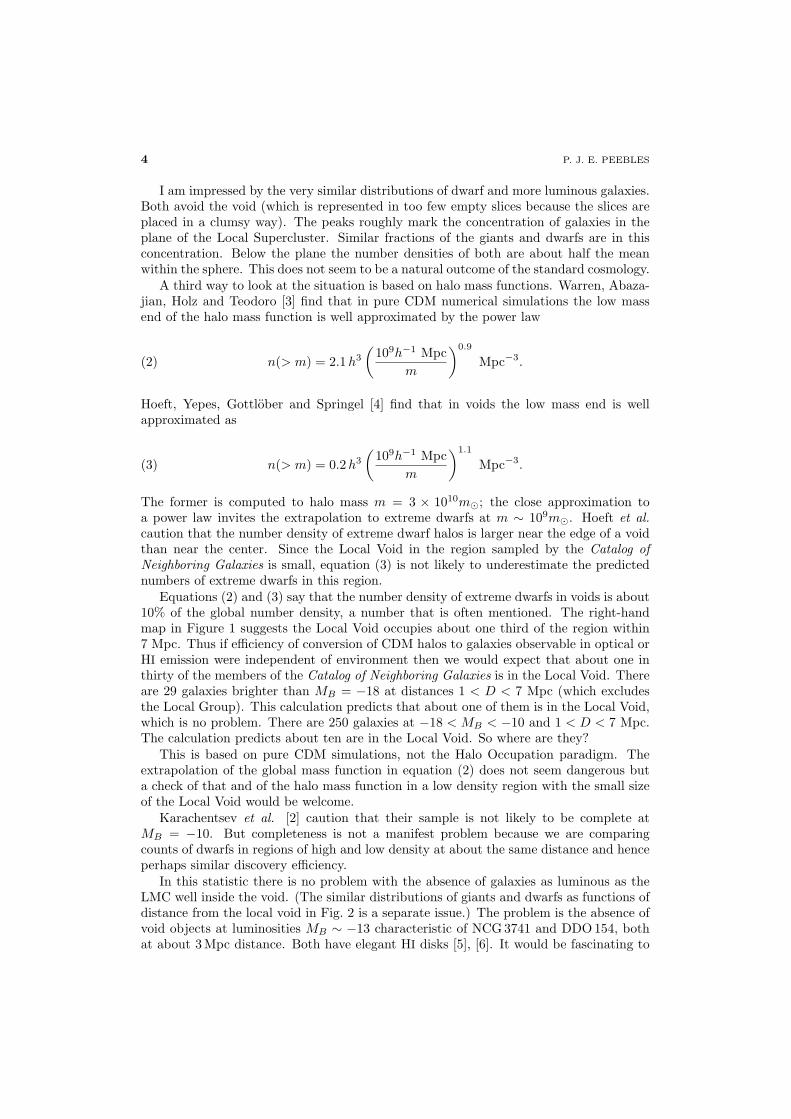
Fig. 1. – The Karachentsev et al. Catalog of Neighboring Galaxies [2]. Two of the largest in thissample, M 101 and NGC 6946, are on the edge of the Local Void, a curious situation.
2. – Void dwarfs
The Catalog of Neighboring Galaxies by Karachentsev, Karachentseva, Huchtmeierand Makarov [2] gives us a fascinating example of how the galaxies are distributed. Themap of these galaxies in Figure 1 is taken from their Figure 5. The two projections shownhere are normal to the plane of the de Vaucouleurs Local Supercluster, and one sees thestriking continuation of this planar concentration to our immediate neighborhood. I haveadded images of two of the largest galaxies in this sample, M 101 (HST Legacy Image)and NGC 6946 (Gemini Observatory/Travis Rector, U of Alaska), along with lines toindicate their positions. These two large spirals are in islands edging into Tully’s LocalVoid. We are at the center of the map, and still close to the void.
How does this situation compare to what might be expected in the ΛCDM cosmol-ogy? Pure cold dark matter numerical simulations show that the matter gathers intomass concentrations — halos — that seem to be suitable homes for galaxies. Thesehalos appear in concentrations outside of which the low density regions look like goodcandidates for the voids in the observed galaxy distribution. Trails of low mass halos runinto the candidate voids regions, while the more massive halos avoid the edges of voids:they prefer regions of high local density. This follows from the assumption of an initiallyscale-invariant Gaussian random mass distribution. It agrees with the observation thatthe most massive galaxies, with luminosities L ' 10L∗, prefer the densest regions.
GALAXIES AS A COSMOLOGICAL TEST 3
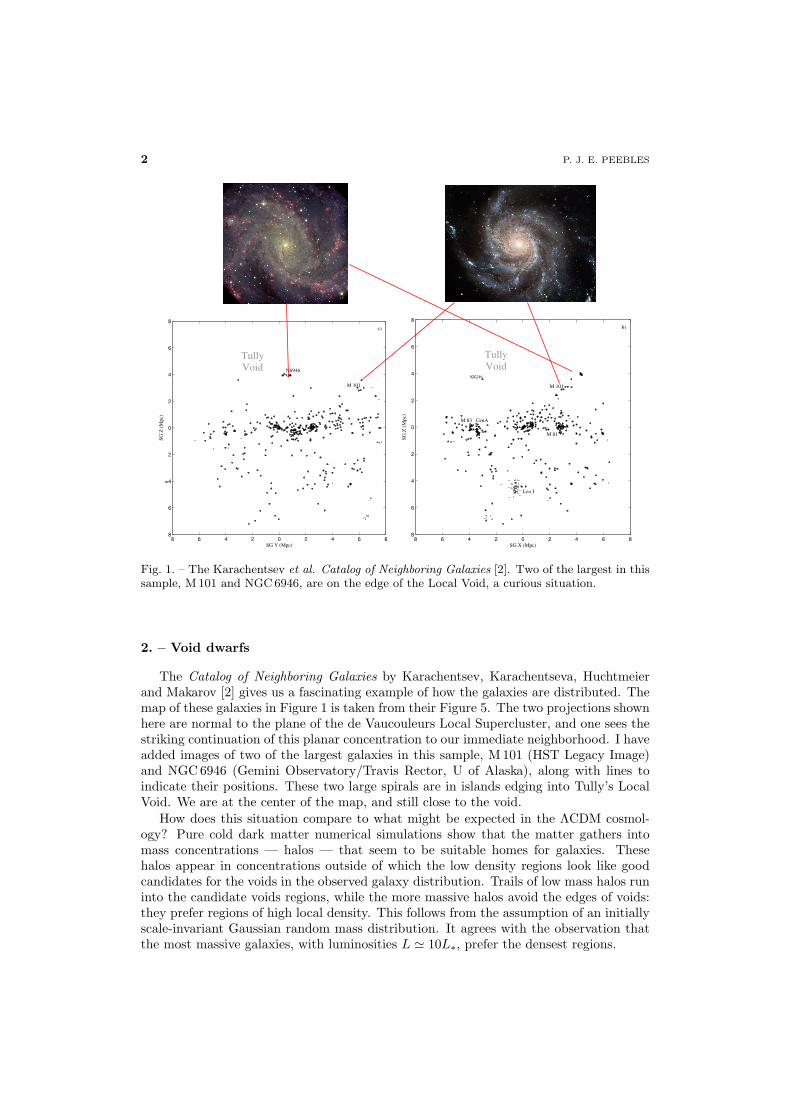
Fig. 2. – Number density of galaxies as a function of distance from a nominal center of theLocal Void in the 20 spherical slices of equal volume illustrated at the left. The black line showsthe run of number density of more luminous galaxies, MB < −17, relative to the mean in thesample, and the red line shows the run of density relative to the mean for dwarfs at MB > −17.
In the nearby universe of galaxies, where the greatest luminosities are closer to L∗, theΛCDM simulations do not offer such a reasonable-looking account of what is observed.Figure 1 shows that two of the largest galaxies in this sample are edging into the LocalVoid. Apart from the islands of dwarfs around these two spirals there are no knowngalaxies of any size in the void. (Karachentsevet al. [2] note that KK 246, which islabeled in the upper left side of the right-hand projection in Fig. 1, “is situated just atthe edge of the Tully void, but not inside it.”) These observations do not seem to be anatural outcome of galaxy formation in the standard cosmology.
Figure 2 shows the situation in a little more detail, in a crude illustration of therelative distributions of large and small galaxies as a function of distance from the LocalVoid. It is based on the sample of Karachentsev et al. [2] galaxies at distances < 7 Mpc.The space within the 7 Mpc sphere centered on us is sliced into 20 equal volumes bya nested set of spheres centered on the edge of the 7 Mpc sphere, at right ascensionα = 265◦ and declination δ = 15◦. (This is the angular position that maximizes thedistances to the nearest galaxies within the 7 Mpc sphere). The equal volume slices areillustrated on the left side of Figure 2 (and recall that this is a figure of revolution).
The galaxy count Ni in the ith slice is converted to the ratio of the mean numberdensity ni within this slice to the mean number density 〈n〉 in the whole 7 Mpc sphereby
ni/〈n〉 = 20Ni/N,(1)
where N is the total number of galaxies in the sphere. These number densities, computedseparately for the dwarfs at MB > −17 and for the more luminous galaxies at MB < −17,are plotted as the red and black lines respectively in Figure 2.
4 P. J. E. PEEBLES
I am impressed by the very similar distributions of dwarf and more luminous galaxies.Both avoid the void (which is represented in too few empty slices because the slices areplaced in a clumsy way). The peaks roughly mark the concentration of galaxies in theplane of the Local Supercluster. Similar fractions of the giants and dwarfs are in thisconcentration. Below the plane the number densities of both are about half the meanwithin the sphere. This does not seem to be a natural outcome of the standard cosmology.
A third way to look at the situation is based on halo mass functions. Warren, Abaza-jian, Holz and Teodoro [3] find that in pure CDM numerical simulations the low massend of the halo mass function is well approximated by the power law
n(> m) = 2.1h3
(109h−1 Mpc
m
)0.9
Mpc−3.(2)
Hoeft, Yepes, Gottlober and Springel [4] find that in voids the low mass end is wellapproximated as
n(> m) = 0.2h3
(109h−1 Mpc
m
)1.1
Mpc−3.(3)
The former is computed to halo mass m = 3 × 10¹⁰m�; the close approximation toa power law invites the extrapolation to extreme dwarfs at m ∼ 109m�. Hoeft et al.caution that the number density of extreme dwarf halos is larger near the edge of a voidthan near the center. Since the Local Void in the region sampled by the Catalog ofNeighboring Galaxies is small, equation (3) is not likely to underestimate the predictednumbers of extreme dwarfs in this region.
Equations (2) and (3) say that the number density of extreme dwarfs in voids is about10% of the global number density, a number that is often mentioned. The right-handmap in Figure 1 suggests the Local Void occupies about one third of the region within7 Mpc. Thus if efficiency of conversion of CDM halos to galaxies observable in optical orHI emission were independent of environment then we would expect that about one inthirty of the members of the Catalog of Neighboring Galaxies is in the Local Void. Thereare 29 galaxies brighter than MB = −18 at distances 1 < D < 7 Mpc (which excludesthe Local Group). This calculation predicts that about one of them is in the Local Void,which is no problem. There are 250 galaxies at −18 < MB < −10 and 1 < D < 7 Mpc.The calculation predicts about ten are in the Local Void. So where are they?
This is based on pure CDM simulations, not the Halo Occupation paradigm. Theextrapolation of the global mass function in equation (2) does not seem dangerous buta check of that and of the halo mass function in a low density region with the small sizeof the Local Void would be welcome.
Karachentsev et al. [2] caution that their sample is not likely to be complete atMB = −10. But completeness is not a manifest problem because we are comparingcounts of dwarfs in regions of high and low density at about the same distance and henceperhaps similar discovery efficiency.
In this statistic there is no problem with the absence of galaxies as luminous as theLMC well inside the void. (The similar distributions of giants and dwarfs as functions ofdistance from the local void in Fig. 2 is a separate issue.) The problem is the absence ofvoid objects at luminosities MB ∼ −13 characteristic of NCG 3741 and DDO 154, bothat about 3 Mpc distance. Both have elegant HI disks [5], [6]. It would be fascinating to
GALAXIES AS A COSMOLOGICAL TEST 5
(bowdlerized)
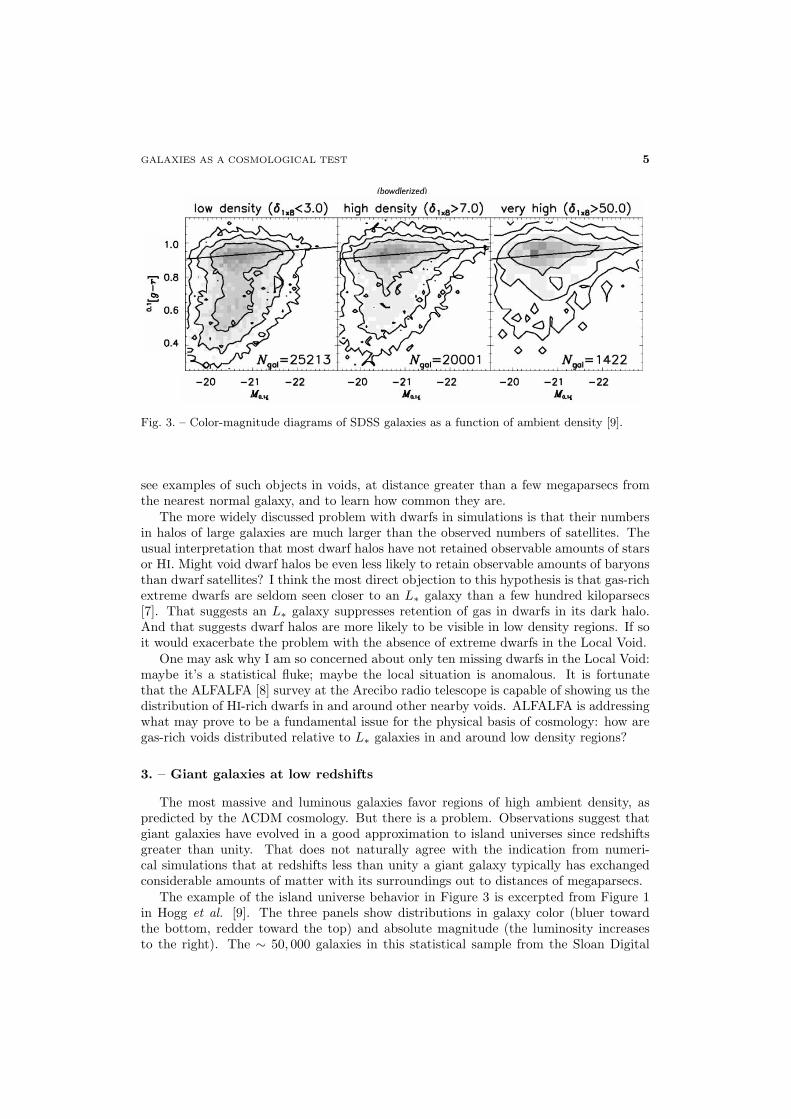
Fig. 3. – Color-magnitude diagrams of SDSS galaxies as a function of ambient density [9].
see examples of such objects in voids, at distance greater than a few megaparsecs fromthe nearest normal galaxy, and to learn how common they are.
The more widely discussed problem with dwarfs in simulations is that their numbersin halos of large galaxies are much larger than the observed numbers of satellites. Theusual interpretation that most dwarf halos have not retained observable amounts of starsor HI. Might void dwarf halos be even less likely to retain observable amounts of baryonsthan dwarf satellites? I think the most direct objection to this hypothesis is that gas-richextreme dwarfs are seldom seen closer to an L∗ galaxy than a few hundred kiloparsecs[7]. That suggests an L∗ galaxy suppresses retention of gas in dwarfs in its dark halo.And that suggests dwarf halos are more likely to be visible in low density regions. If soit would exacerbate the problem with the absence of extreme dwarfs in the Local Void.
One may ask why I am so concerned about only ten missing dwarfs in the Local Void:maybe it’s a statistical fluke; maybe the local situation is anomalous. It is fortunatethat the ALFALFA [8] survey at the Arecibo radio telescope is capable of showing us thedistribution of HI-rich dwarfs in and around other nearby voids. ALFALFA is addressingwhat may prove to be a fundamental issue for the physical basis of cosmology: how aregas-rich voids distributed relative to L∗ galaxies in and around low density regions?
3. – Giant galaxies at low redshifts
The most massive and luminous galaxies favor regions of high ambient density, aspredicted by the ΛCDM cosmology. But there is a problem. Observations suggest thatgiant galaxies have evolved in a good approximation to island universes since redshiftsgreater than unity. That does not naturally agree with the indication from numeri-cal simulations that at redshifts less than unity a giant galaxy typically has exchangedconsiderable amounts of matter with its surroundings out to distances of megaparsecs.
The example of the island universe behavior in Figure 3 is excerpted from Figure 1in Hogg et al. [9]. The three panels show distributions in galaxy color (bluer towardthe bottom, redder toward the top) and absolute magnitude (the luminosity increasesto the right). The ∼ 50, 000 galaxies in this statistical sample from the Sloan Digital
6 P. J. E. PEEBLES
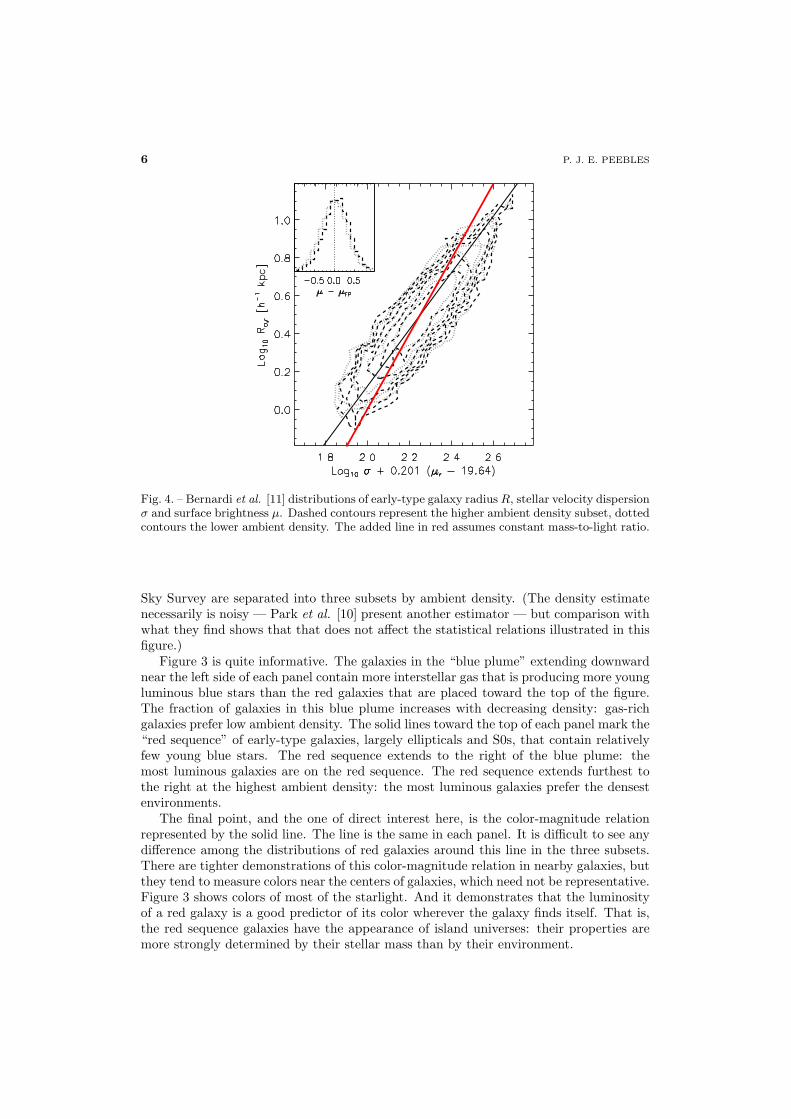
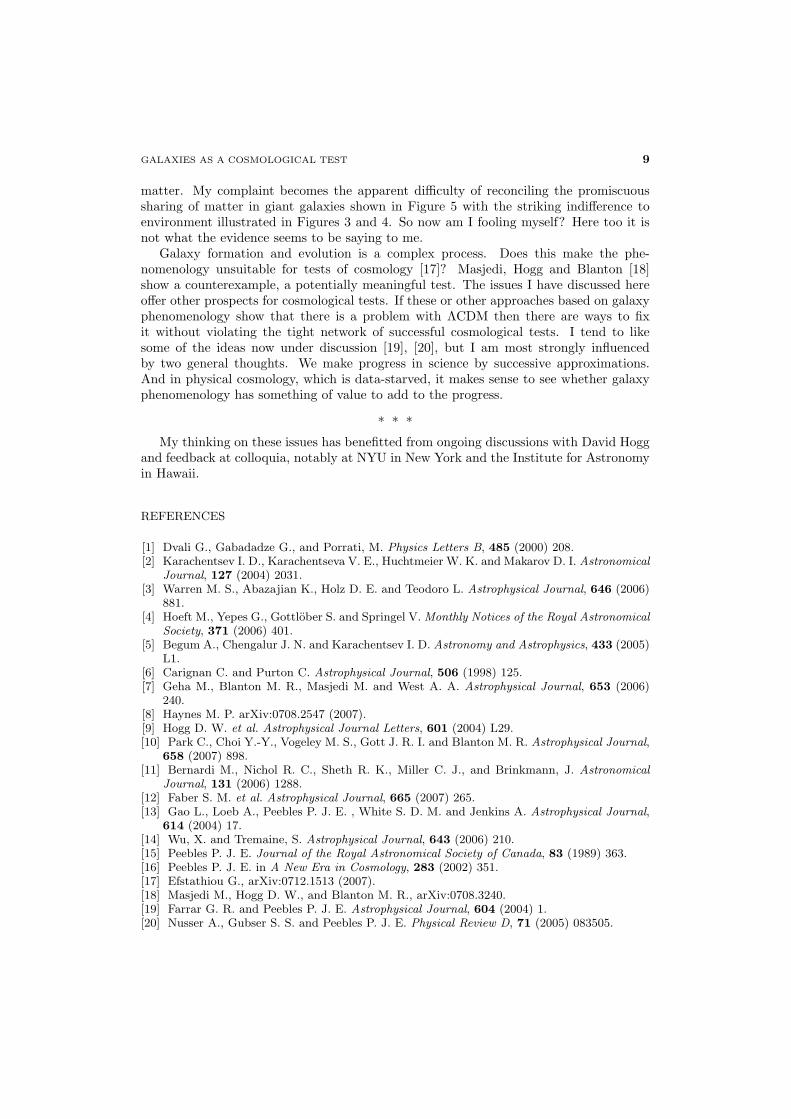
Fig. 4. – Bernardi et al. [11] distributions of early-type galaxy radiusR, stellar velocity dispersionσ and surface brightness µ. Dashed contours represent the higher ambient density subset, dottedcontours the lower ambient density. The added line in red assumes constant mass-to-light ratio.
Sky Survey are separated into three subsets by ambient density. (The density estimatenecessarily is noisy — Park et al. [10] present another estimator — but comparison withwhat they find shows that that does not affect the statistical relations illustrated in thisfigure.)
Figure 3 is quite informative. The galaxies in the “blue plume” extending downwardnear the left side of each panel contain more interstellar gas that is producing more youngluminous blue stars than the red galaxies that are placed toward the top of the figure.The fraction of galaxies in this blue plume increases with decreasing density: gas-richgalaxies prefer low ambient density. The solid lines toward the top of each panel mark the“red sequence” of early-type galaxies, largely ellipticals and S0s, that contain relativelyfew young blue stars. The red sequence extends to the right of the blue plume: themost luminous galaxies are on the red sequence. The red sequence extends furthest tothe right at the highest ambient density: the most luminous galaxies prefer the densestenvironments.
The final point, and the one of direct interest here, is the color-magnitude relationrepresented by the solid line. The line is the same in each panel. It is difficult to see anydifference among the distributions of red galaxies around this line in the three subsets.There are tighter demonstrations of this color-magnitude relation in nearby galaxies, butthey tend to measure colors near the centers of galaxies, which need not be representative.Figure 3 shows colors of most of the starlight. And it demonstrates that the luminosityof a red galaxy is a good predictor of its color wherever the galaxy finds itself. That is,the red sequence galaxies have the appearance of island universes: their properties aremore strongly determined by their stellar mass than by their environment.
GALAXIES AS A COSMOLOGICAL TEST 7
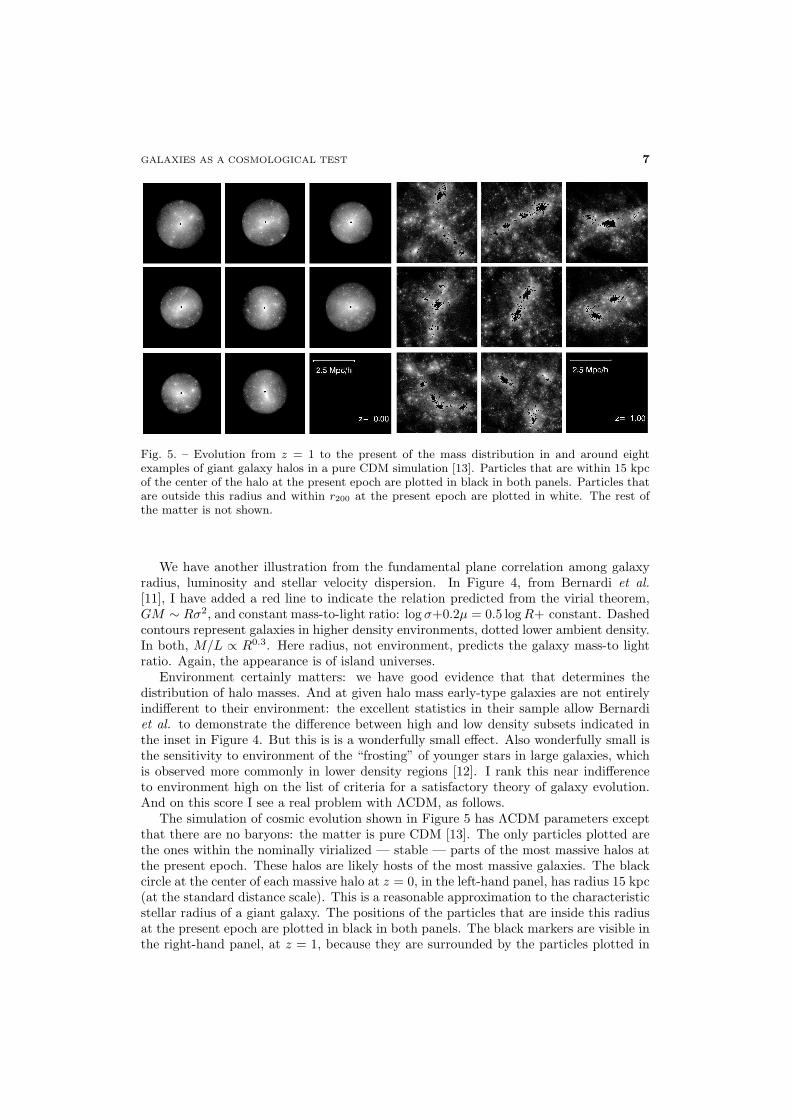
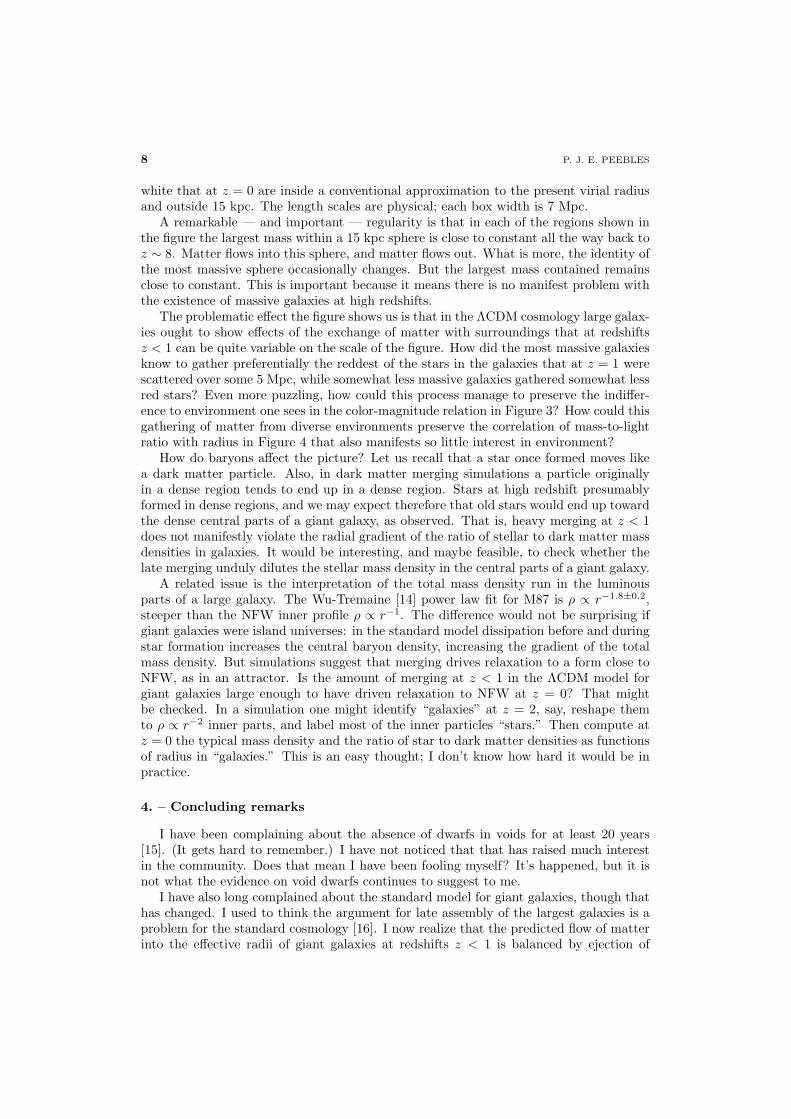
Fig. 5. – Evolution from z = 1 to the present of the mass distribution in and around eightexamples of giant galaxy halos in a pure CDM simulation [13]. Particles that are within 15 kpcof the center of the halo at the present epoch are plotted in black in both panels. Particles thatare outside this radius and within r200 at the present epoch are plotted in white. The rest ofthe matter is not shown.
We have another illustration from the fundamental plane correlation among galaxyradius, luminosity and stellar velocity dispersion. In Figure 4, from Bernardi et al.[11], I have added a red line to indicate the relation predicted from the virial theorem,GM ∼ Rσ2, and constant mass-to-light ratio: log σ+0.2µ = 0.5 logR+ constant. Dashedcontours represent galaxies in higher density environments, dotted lower ambient density.In both, M/L ∝ R0.3. Here radius, not environment, predicts the galaxy mass-to lightratio. Again, the appearance is of island universes.
Environment certainly matters: we have good evidence that that determines thedistribution of halo masses. And at given halo mass early-type galaxies are not entirelyindifferent to their environment: the excellent statistics in their sample allow Bernardiet al. to demonstrate the difference between high and low density subsets indicated inthe inset in Figure 4. But this is is a wonderfully small effect. Also wonderfully small isthe sensitivity to environment of the “frosting” of younger stars in large galaxies, whichis observed more commonly in lower density regions [12]. I rank this near indifferenceto environment high on the list of criteria for a satisfactory theory of galaxy evolution.And on this score I see a real problem with ΛCDM, as follows.
The simulation of cosmic evolution shown in Figure 5 has ΛCDM parameters exceptthat there are no baryons: the matter is pure CDM [13]. The only particles plotted arethe ones within the nominally virialized — stable — parts of the most massive halos atthe present epoch. These halos are likely hosts of the most massive galaxies. The blackcircle at the center of each massive halo at z = 0, in the left-hand panel, has radius 15 kpc(at the standard distance scale). This is a reasonable approximation to the characteristicstellar radius of a giant galaxy. The positions of the particles that are inside this radiusat the present epoch are plotted in black in both panels. The black markers are visible inthe right-hand panel, at z = 1, because they are surrounded by the particles plotted in
8 P. J. E. PEEBLES
white that at z = 0 are inside a conventional approximation to the present virial radiusand outside 15 kpc. The length scales are physical; each box width is 7 Mpc.
A remarkable — and important — regularity is that in each of the regions shown inthe figure the largest mass within a 15 kpc sphere is close to constant all the way back toz ∼ 8. Matter flows into this sphere, and matter flows out. What is more, the identity ofthe most massive sphere occasionally changes. But the largest mass contained remainsclose to constant. This is important because it means there is no manifest problem withthe existence of massive galaxies at high redshifts.
The problematic effect the figure shows us is that in the ΛCDM cosmology large galax-ies ought to show effects of the exchange of matter with surroundings that at redshiftsz < 1 can be quite variable on the scale of the figure. How did the most massive galaxiesknow to gather preferentially the reddest of the stars in the galaxies that at z = 1 werescattered over some 5 Mpc, while somewhat less massive galaxies gathered somewhat lessred stars? Even more puzzling, how could this process manage to preserve the indiffer-ence to environment one sees in the color-magnitude relation in Figure 3? How could thisgathering of matter from diverse environments preserve the correlation of mass-to-lightratio with radius in Figure 4 that also manifests so little interest in environment?
How do baryons affect the picture? Let us recall that a star once formed moves likea dark matter particle. Also, in dark matter merging simulations a particle originallyin a dense region tends to end up in a dense region. Stars at high redshift presumablyformed in dense regions, and we may expect therefore that old stars would end up towardthe dense central parts of a giant galaxy, as observed. That is, heavy merging at z < 1does not manifestly violate the radial gradient of the ratio of stellar to dark matter massdensities in galaxies. It would be interesting, and maybe feasible, to check whether thelate merging unduly dilutes the stellar mass density in the central parts of a giant galaxy.
A related issue is the interpretation of the total mass density run in the luminousparts of a large galaxy. The Wu-Tremaine [14] power law fit for M87 is ρ ∝ r−1.8±0.2,steeper than the NFW inner profile ρ ∝ r−1. The difference would not be surprising ifgiant galaxies were island universes: in the standard model dissipation before and duringstar formation increases the central baryon density, increasing the gradient of the totalmass density. But simulations suggest that merging drives relaxation to a form close toNFW, as in an attractor. Is the amount of merging at z < 1 in the ΛCDM model forgiant galaxies large enough to have driven relaxation to NFW at z = 0? That mightbe checked. In a simulation one might identify “galaxies” at z = 2, say, reshape themto ρ ∝ r−2 inner parts, and label most of the inner particles “stars.” Then compute atz = 0 the typical mass density and the ratio of star to dark matter densities as functionsof radius in “galaxies.” This is an easy thought; I don’t know how hard it would be inpractice.
4. – Concluding remarks
I have been complaining about the absence of dwarfs in voids for at least 20 years[15]. (It gets hard to remember.) I have not noticed that that has raised much interestin the community. Does that mean I have been fooling myself? It’s happened, but it isnot what the evidence on void dwarfs continues to suggest to me.
I have also long complained about the standard model for giant galaxies, though thathas changed. I used to think the argument for late assembly of the largest galaxies is aproblem for the standard cosmology [16]. I now realize that the predicted flow of matterinto the effective radii of giant galaxies at redshifts z < 1 is balanced by ejection of
GALAXIES AS A COSMOLOGICAL TEST 9
matter. My complaint becomes the apparent difficulty of reconciling the promiscuoussharing of matter in giant galaxies shown in Figure 5 with the striking indifference toenvironment illustrated in Figures 3 and 4. So now am I fooling myself? Here too it isnot what the evidence seems to be saying to me.
Galaxy formation and evolution is a complex process. Does this make the phe-nomenology unsuitable for tests of cosmology [17]? Masjedi, Hogg and Blanton [18]show a counterexample, a potentially meaningful test. The issues I have discussed hereoffer other prospects for cosmological tests. If these or other approaches based on galaxyphenomenology show that there is a problem with ΛCDM then there are ways to fixit without violating the tight network of successful cosmological tests. I tend to likesome of the ideas now under discussion [19], [20], but I am most strongly influencedby two general thoughts. We make progress in science by successive approximations.And in physical cosmology, which is data-starved, it makes sense to see whether galaxyphenomenology has something of value to add to the progress.
∗ ∗ ∗
My thinking on these issues has benefitted from ongoing discussions with David Hoggand feedback at colloquia, notably at NYU in New York and the Institute for Astronomyin Hawaii.
REFERENCES
[1] Dvali G., Gabadadze G., and Porrati, M. Physics Letters B, 485 (2000) 208.[2] Karachentsev I. D., Karachentseva V. E., Huchtmeier W. K. and Makarov D. I. Astronomical
Journal, 127 (2004) 2031.[3] Warren M. S., Abazajian K., Holz D. E. and Teodoro L. Astrophysical Journal, 646 (2006)
881.[4] Hoeft M., Yepes G., Gottlober S. and Springel V. Monthly Notices of the Royal Astronomical
Society, 371 (2006) 401.[5] Begum A., Chengalur J. N. and Karachentsev I. D. Astronomy and Astrophysics, 433 (2005)
L1.[6] Carignan C. and Purton C. Astrophysical Journal, 506 (1998) 125.[7] Geha M., Blanton M. R., Masjedi M. and West A. A. Astrophysical Journal, 653 (2006)
240.[8] Haynes M. P. arXiv:0708.2547 (2007).[9] Hogg D. W. et al. Astrophysical Journal Letters, 601 (2004) L29.[10] Park C., Choi Y.-Y., Vogeley M. S., Gott J. R. I. and Blanton M. R. Astrophysical Journal,
658 (2007) 898.[11] Bernardi M., Nichol R. C., Sheth R. K., Miller C. J., and Brinkmann, J. Astronomical
Journal, 131 (2006) 1288.[12] Faber S. M. et al. Astrophysical Journal, 665 (2007) 265.[13] Gao L., Loeb A., Peebles P. J. E. , White S. D. M. and Jenkins A. Astrophysical Journal,
614 (2004) 17.[14] Wu, X. and Tremaine, S. Astrophysical Journal, 643 (2006) 210.[15] Peebles P. J. E. Journal of the Royal Astronomical Society of Canada, 83 (1989) 363.[16] Peebles P. J. E. in A New Era in Cosmology, 283 (2002) 351.[17] Efstathiou G., arXiv:0712.1513 (2007).[18] Masjedi M., Hogg D. W., and Blanton M. R., arXiv:0708.3240.[19] Farrar G. R. and Peebles P. J. E. Astrophysical Journal, 604 (2004) 1.[20] Nusser A., Gubser S. S. and Peebles P. J. E. Physical Review D, 71 (2005) 083505.