Business Profiles and Personality Traits towards Social Network Team Building Processes
Monogram 29 April 1 - May 2015
Rothamsted Research
Identifying and exploiting traits for transpiration efficiency and drought tolerance in adapted and
ancestral wheat germplasm 1Y. Mahmood, 1I. King, 1J. King, 1P. Carvalho, 1J. De Silva, 1D. Wells, 1S. Mooney, 1M. Bennett, 1S. Keating, 1L. York, 2S. Griffiths, 2L. Wingen and 1J. Foulkes 1Plant and Crop Sciences, University of Nottingham, LE12 5RD, UK. 2Department of Crop Genetics, John Innes Centre, NR4 7UH, UK
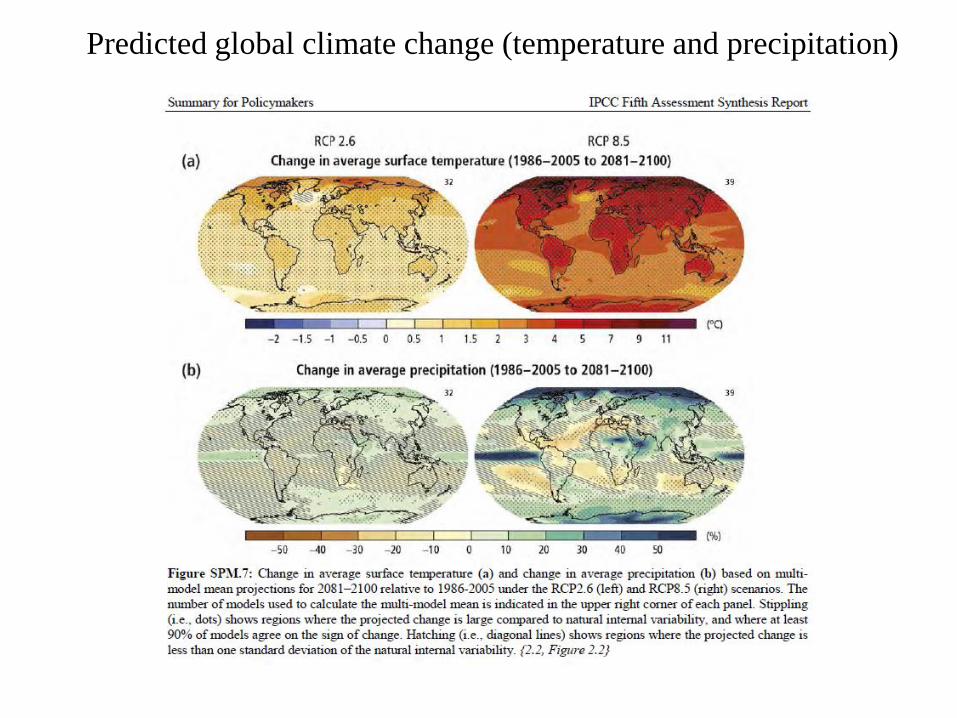
Predicted global climate change (temperature and precipitation)
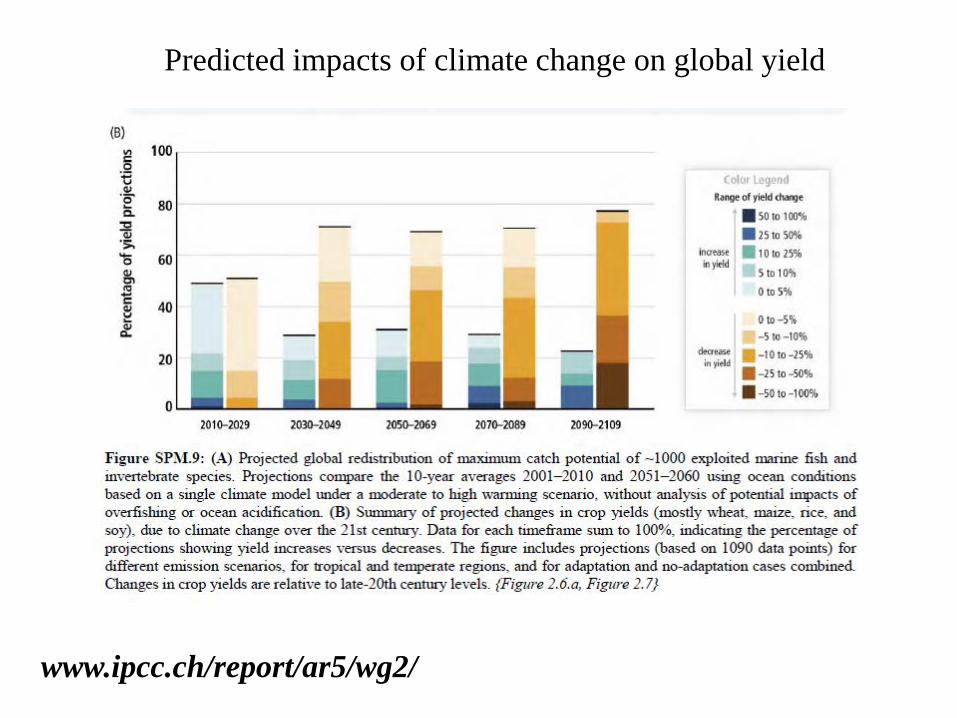
Predicted impacts of climate change on global yield
www.ipcc.ch/report/ar5/wg2/
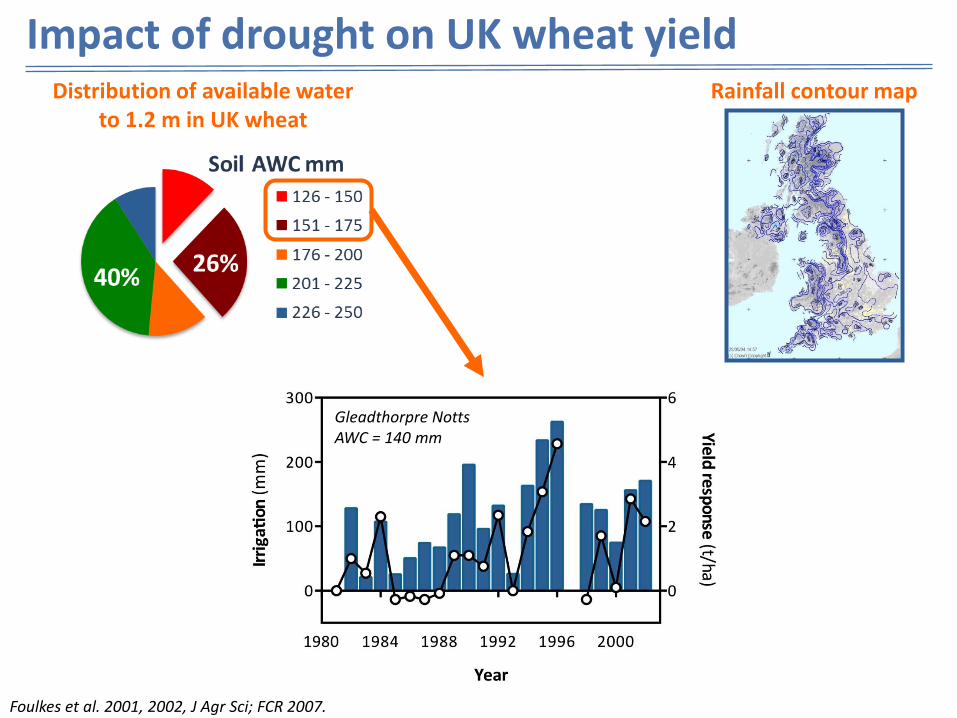
Impact of drought on UK wheat yield Distribution of available water
to 1.2 m in UK wheat Rainfall contour map
Foulkes et al. 2001, 2002, J Agr Sci; FCR 2007.
Gleadthorpre Notts AWC = 140 mm
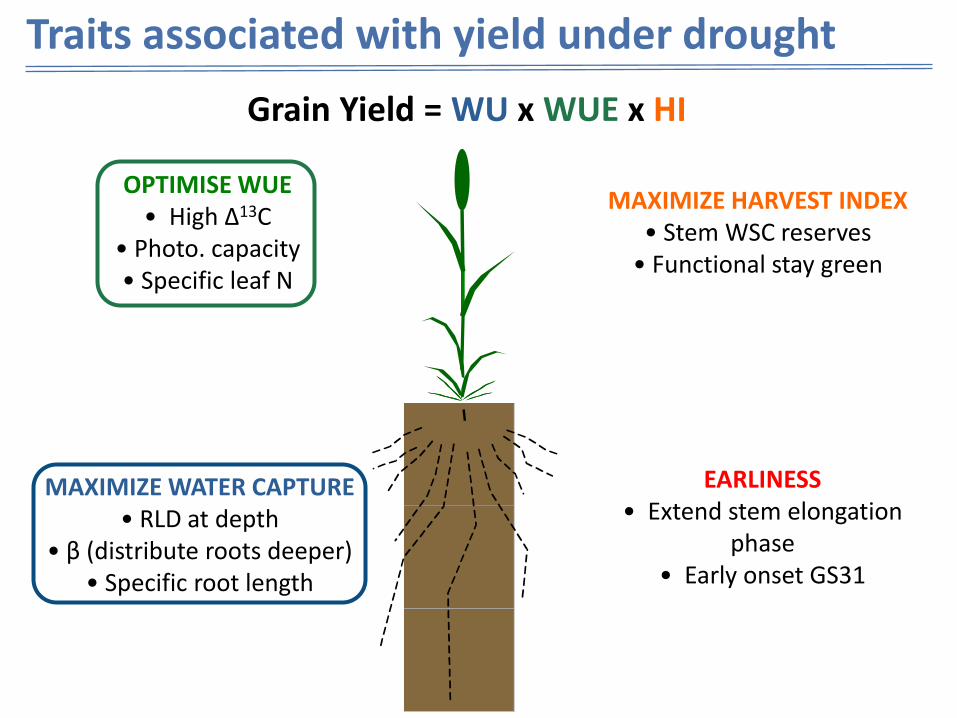
Grain Yield = WU x WUE x HI
OPTIMISE WUE • High Δ13C
• Photo. capacity • Specific leaf N
MAXIMIZE WATER CAPTURE • RLD at depth
• β (distribute roots deeper) • Specific root length
EARLINESS • Extend stem elongation
phase • Early onset GS31
MAXIMIZE HARVEST INDEX • Stem WSC reserves
• Functional stay green
Traits associated with yield under drought
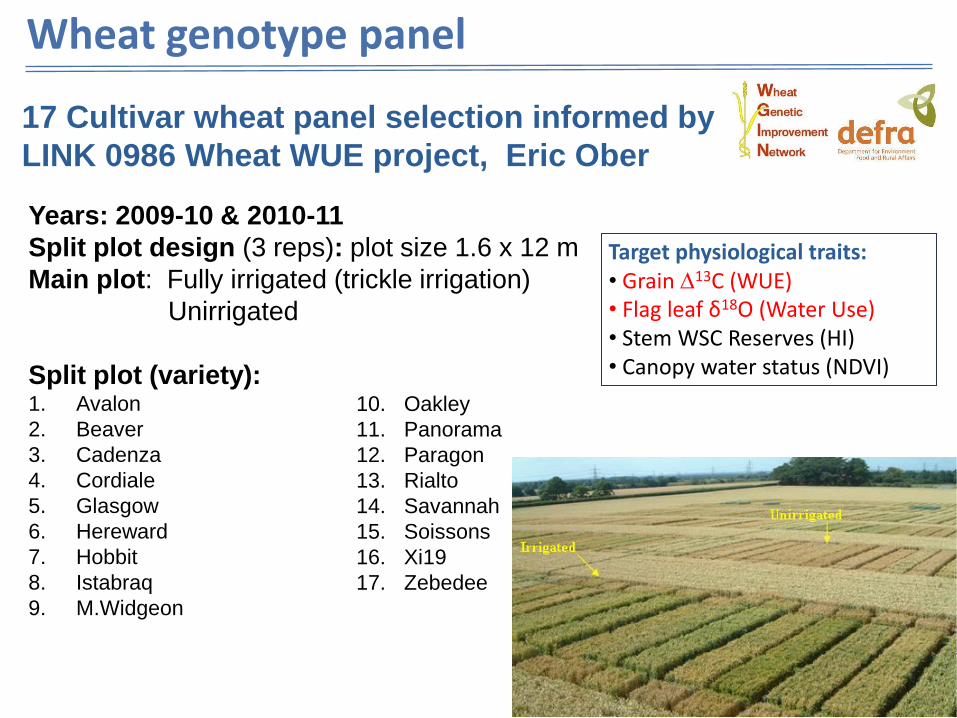
Years: 2009-10 & 2010-11
Split plot design (3 reps): plot size 1.6 x 12 m
Main plot: Fully irrigated (trickle irrigation)
Unirrigated
Split plot (variety): 1. Avalon
2. Beaver
3. Cadenza
4. Cordiale
5. Glasgow
6. Hereward
7. Hobbit
8. Istabraq
9. M.Widgeon
10. Oakley
11. Panorama
12. Paragon
13. Rialto
14. Savannah
15. Soissons
16. Xi19
17. Zebedee
17 Cultivar wheat panel selection informed by
LINK 0986 Wheat WUE project, Eric Ober
Wheat genotype panel
Target physiological traits: • Grain 13C (WUE) • Flag leaf δ18O (Water Use) • Stem WSC Reserves (HI) • Canopy water status (NDVI)
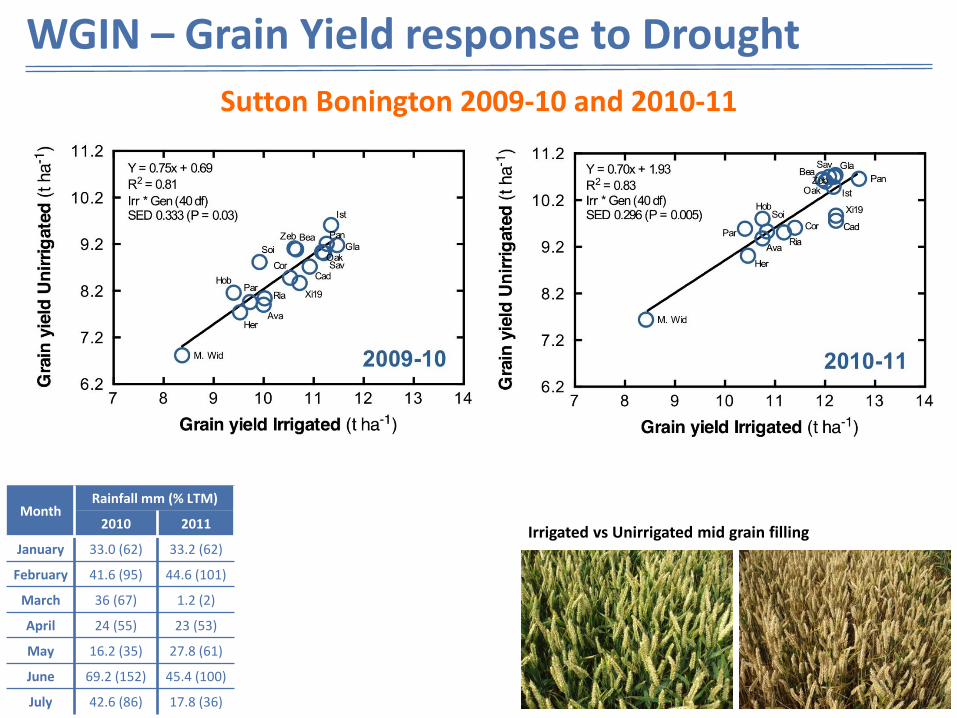
WGIN – Grain Yield response to Drought
Sutton Bonington 2009-10 and 2010-11
Month Rainfall mm (% LTM)
2010 2011
January 33.0 (62) 33.2 (62)
February 41.6 (95) 44.6 (101)
March 36 (67) 1.2 (2)
April 24 (55) 23 (53)
May 16.2 (35) 27.8 (61)
June 69.2 (152) 45.4 (100)
July 42.6 (86) 17.8 (36)
Irrigated vs Unirrigated mid grain filling
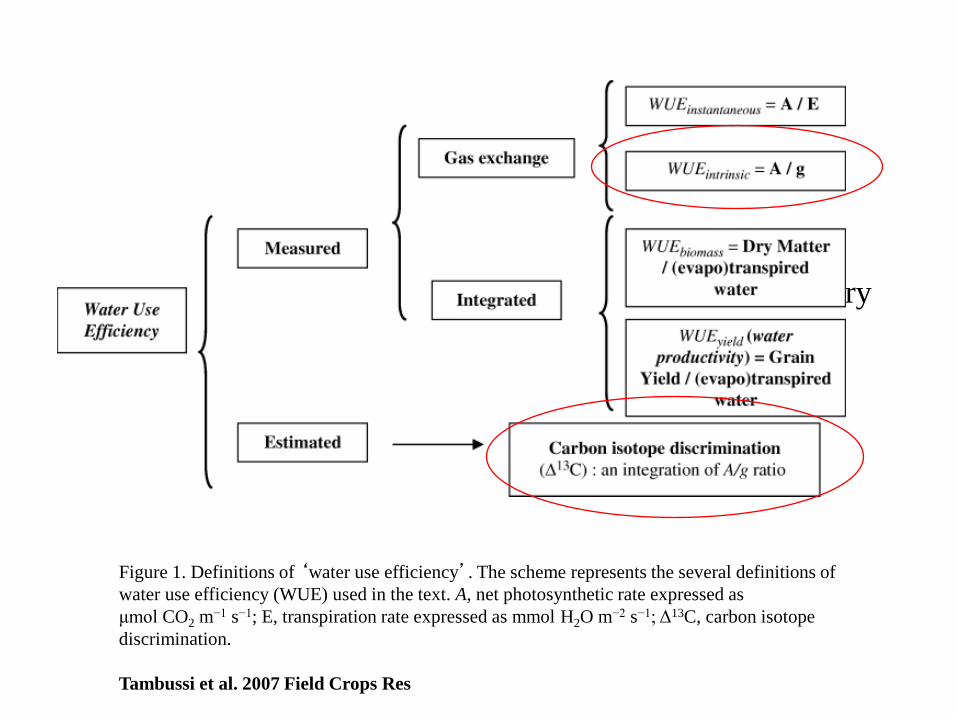
● Water-use efficiency (WUE) is the ratio of above-ground dry matter production to evapotranspiration.
Figure 1. Definitions of ‘water use efficiency’. The scheme represents the several definitions of
water use efficiency (WUE) used in the text. A, net photosynthetic rate expressed as
μmol CO2 m−1 s−1; E, transpiration rate expressed as mmol H2O m−2 s−1; Δ13C, carbon isotope
discrimination.
Tambussi et al. 2007 Field Crops Res
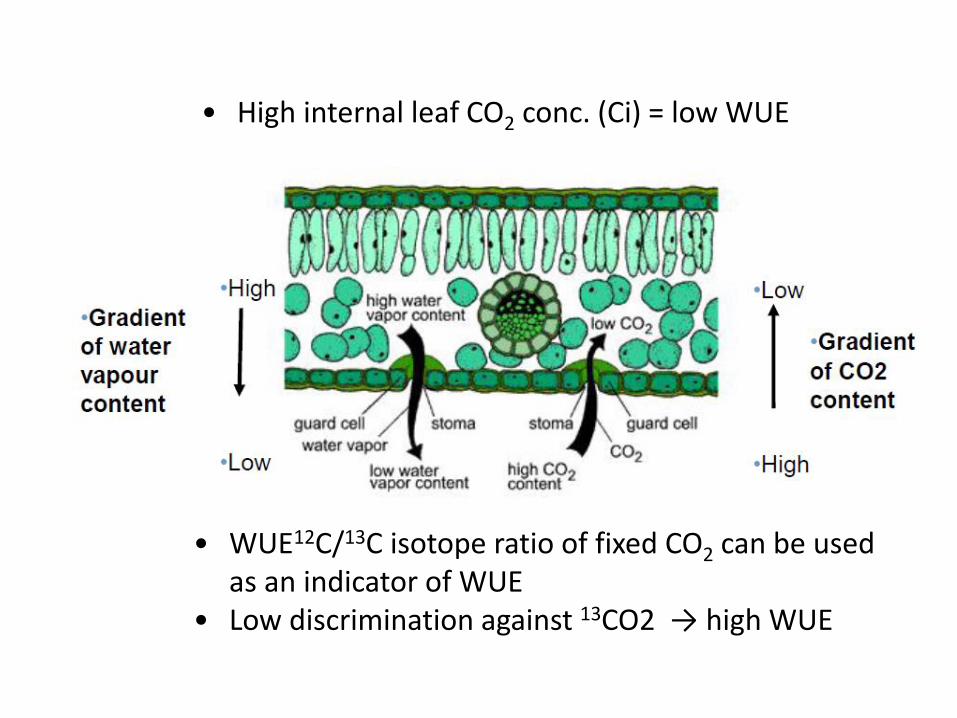
• High internal leaf CO2 conc. (Ci) = low WUE
• WUE12C/13C isotope ratio of fixed CO2 can be used as an indicator of WUE
• Low discrimination against 13CO2 → high WUE
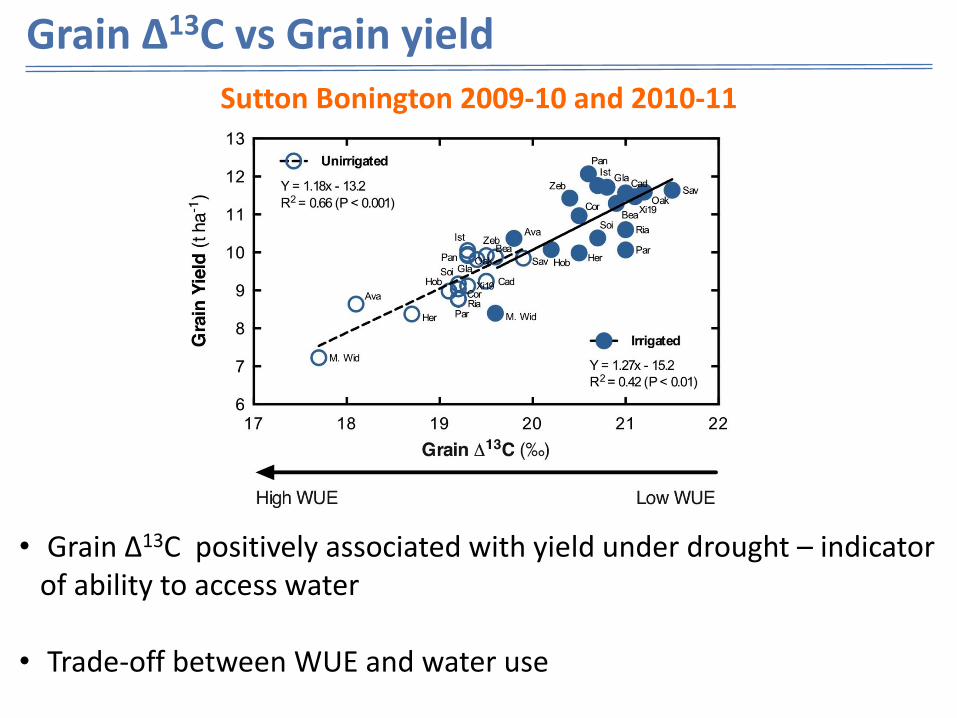
Grain Δ13C vs Grain yield
Sutton Bonington 2009-10 and 2010-11
• Grain Δ13C positively associated with yield under drought – indicator of ability to access water
• Trade-off between WUE and water use
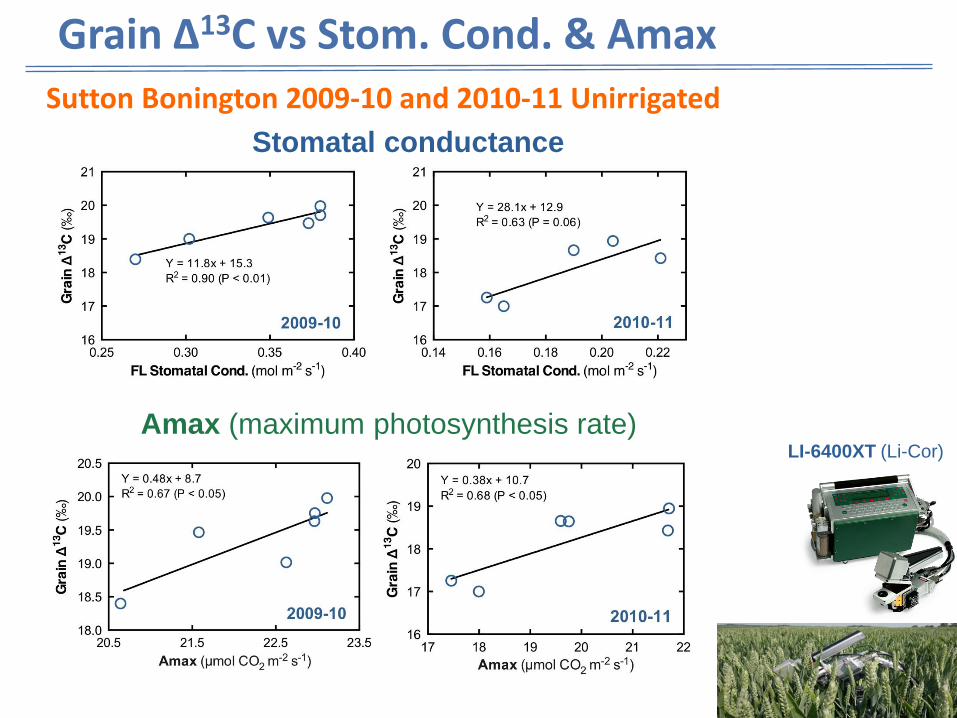
Grain Δ13C vs Stom. Cond. & Amax
Sutton Bonington 2009-10 and 2010-11 Unirrigated
LI-6400XT (Li-Cor)
Stomatal conductance
Amax (maximum photosynthesis rate)
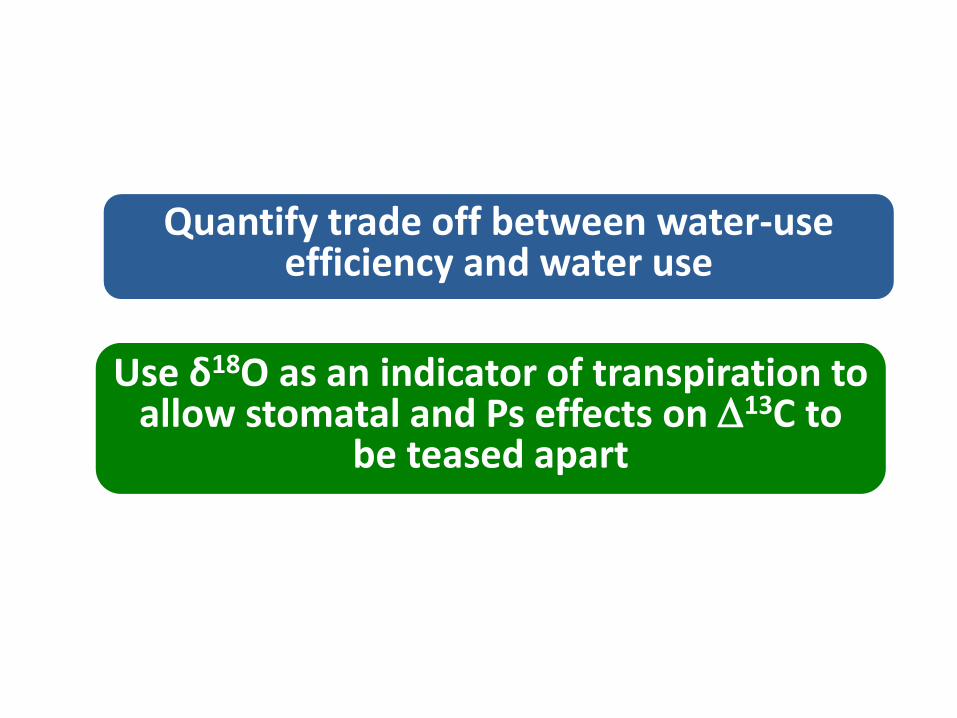
Quantify trade off between water-use efficiency and water use
Use δ18O as an indicator of transpiration to allow stomatal and Ps effects on 13C to
be teased apart
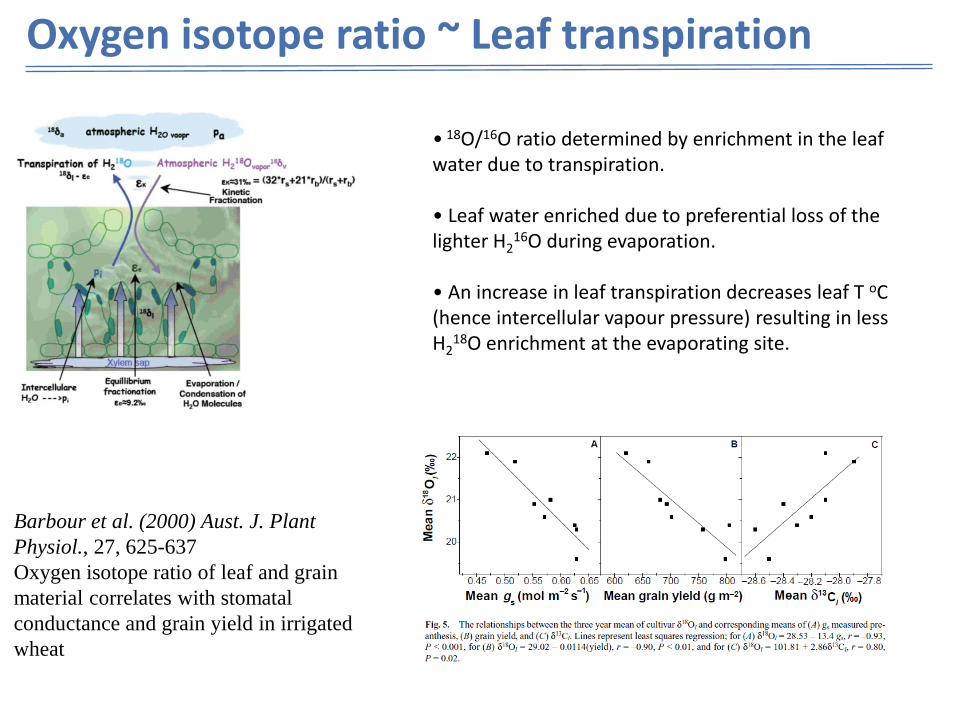
Barbour et al. (2000) Aust. J. Plant
Physiol., 27, 625-637
Oxygen isotope ratio of leaf and grain
material correlates with stomatal
conductance and grain yield in irrigated
wheat
δ18O of leaf tissues can be used as an indirect
measure of transpiration and water use
• 18O/16O ratio determined by enrichment in the leaf water due to transpiration. • Leaf water enriched due to preferential loss of the lighter H2
16O during evaporation. • An increase in leaf transpiration decreases leaf T oC (hence intercellular vapour pressure) resulting in less H2
18O enrichment at the evaporating site.
Oxygen isotope ratio ~ Leaf transpiration
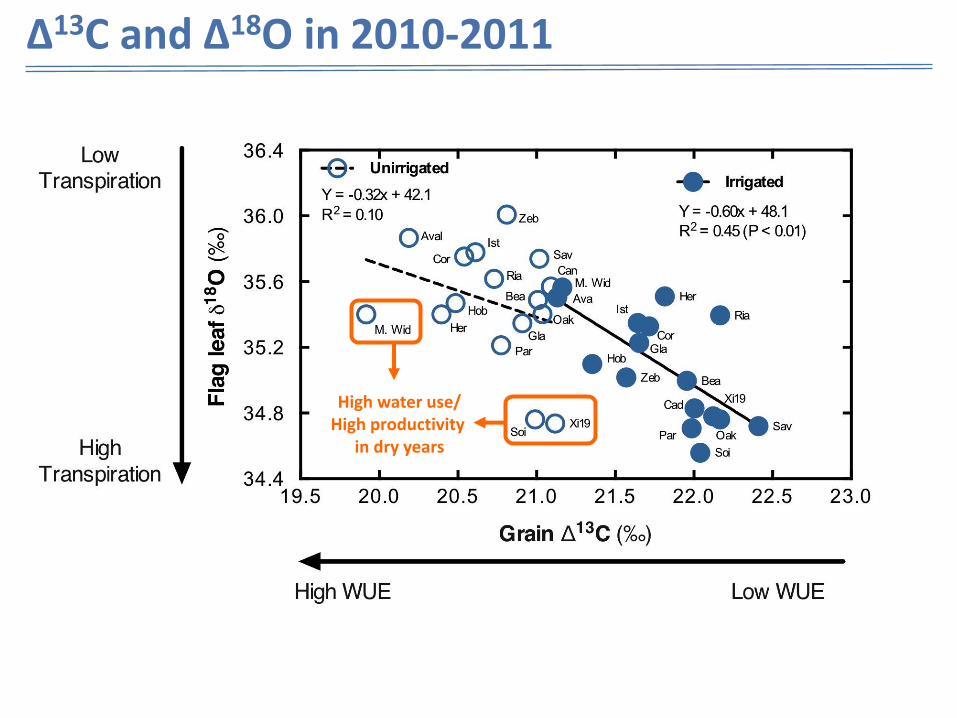
Δ13C and Δ18O in 2010-2011
High water use/ High productivity
in dry years
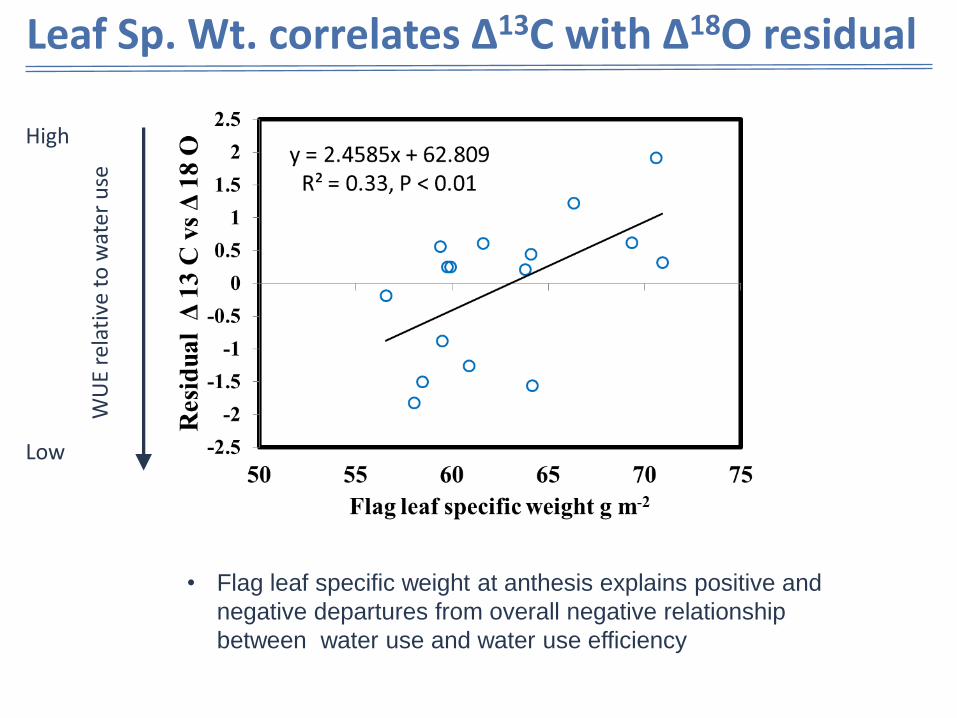
Leaf Sp. Wt. correlates Δ13C with Δ18O residual
WU
E re
lati
ve t
o w
ater
use
Low
High
• Flag leaf specific weight at anthesis explains positive and
negative departures from overall negative relationship
between water use and water use efficiency
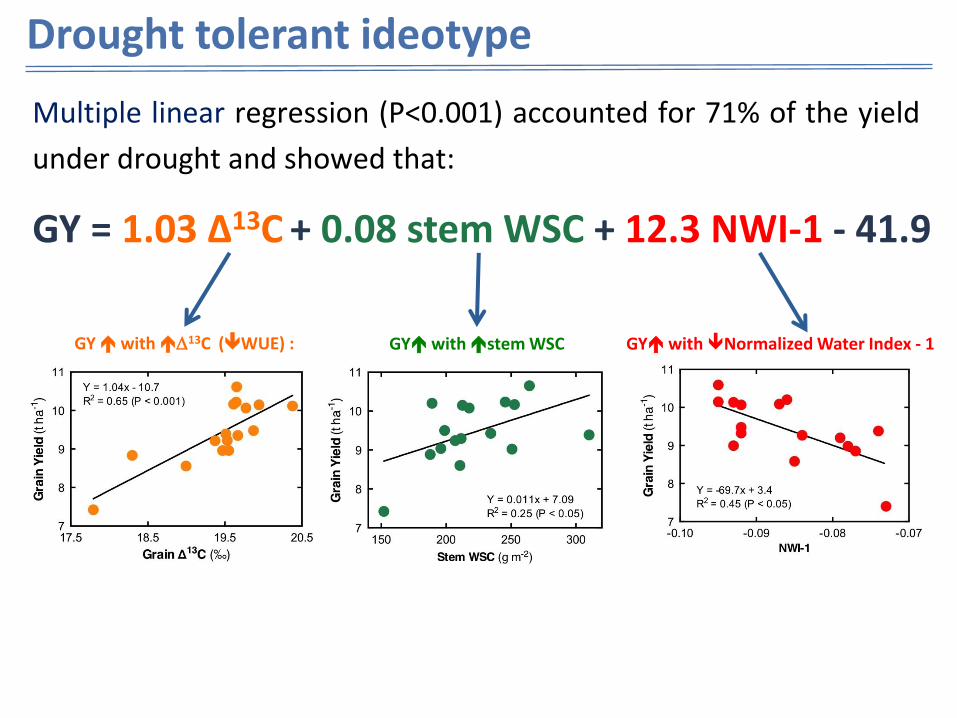
Multiple linear regression (P<0.001) accounted for 71% of the yield
under drought and showed that:
GY with 13C (WUE) : GY with stem WSC GY with Normalized Water Index - 1
GY = 1.03 Δ13C + 0.08 stem WSC + 12.3 NWI-1 - 41.9
Drought tolerant ideotype
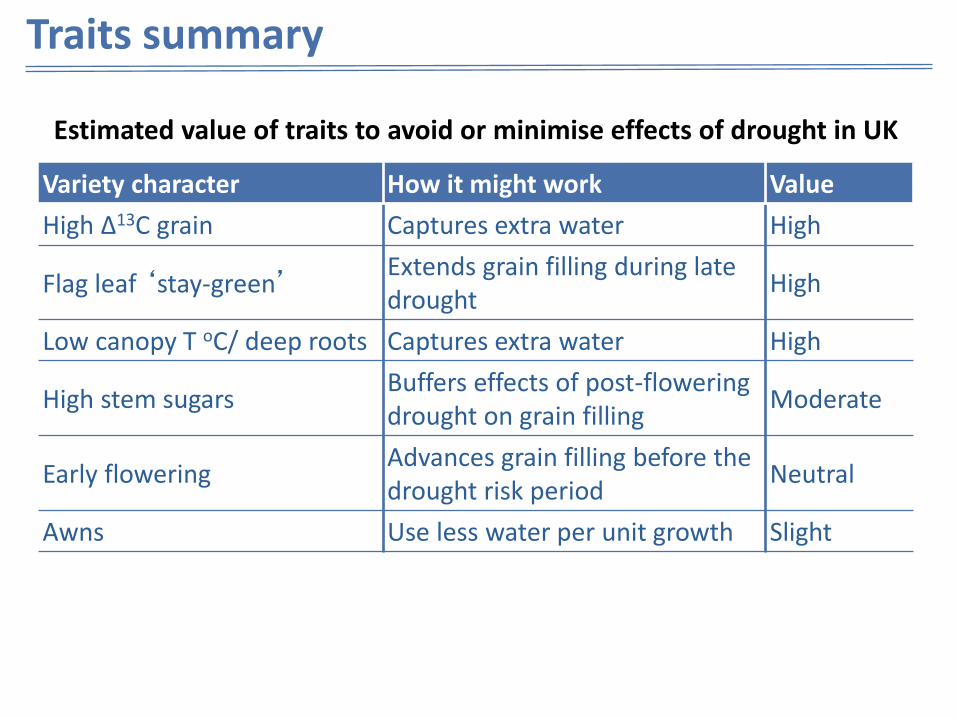
Estimated value of traits to avoid or minimise effects of drought in UK
Traits summary
Variety character How it might work Value
High Δ13C grain Captures extra water High
Flag leaf ‘stay-green’ Extends grain filling during late drought
High
Low canopy T oC/ deep roots Captures extra water High
High stem sugars Buffers effects of post-flowering drought on grain filling
Moderate
Early flowering Advances grain filling before the drought risk period
Neutral
Awns Use less water per unit growth Slight
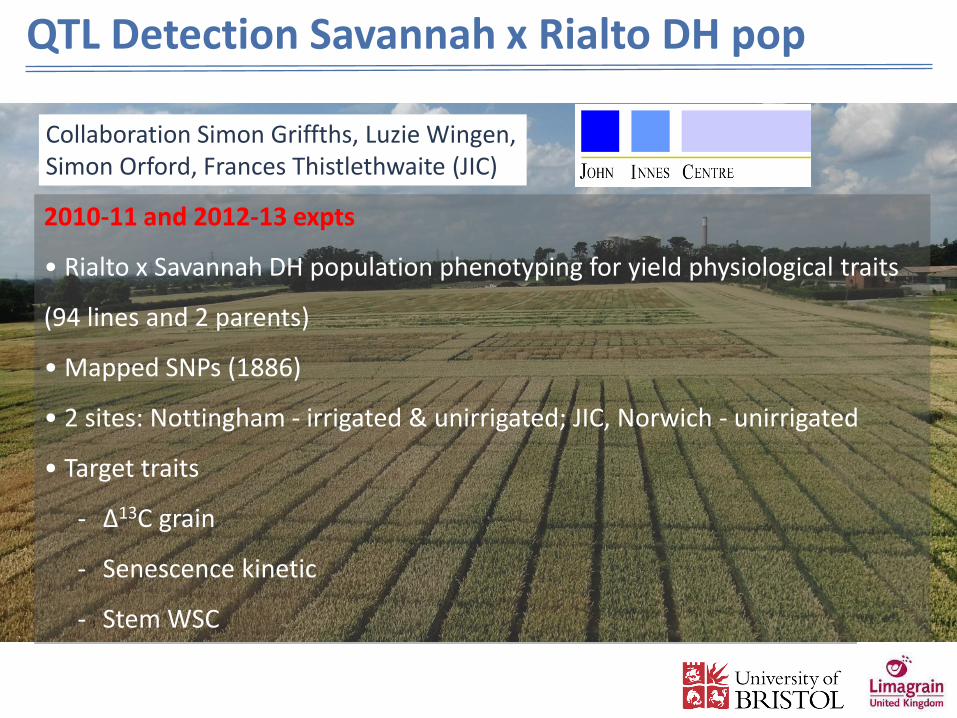
2010-11 and 2012-13 expts
• Rialto x Savannah DH population phenotyping for yield physiological traits
(94 lines and 2 parents)
• Mapped SNPs (1886)
• 2 sites: Nottingham - irrigated & unirrigated; JIC, Norwich - unirrigated
• Target traits
- Δ13C grain
- Senescence kinetic
- Stem WSC
QTL Detection Savannah x Rialto DH pop
Collaboration Simon Griffths, Luzie Wingen, Simon Orford, Frances Thistlethwaite (JIC)
Ria
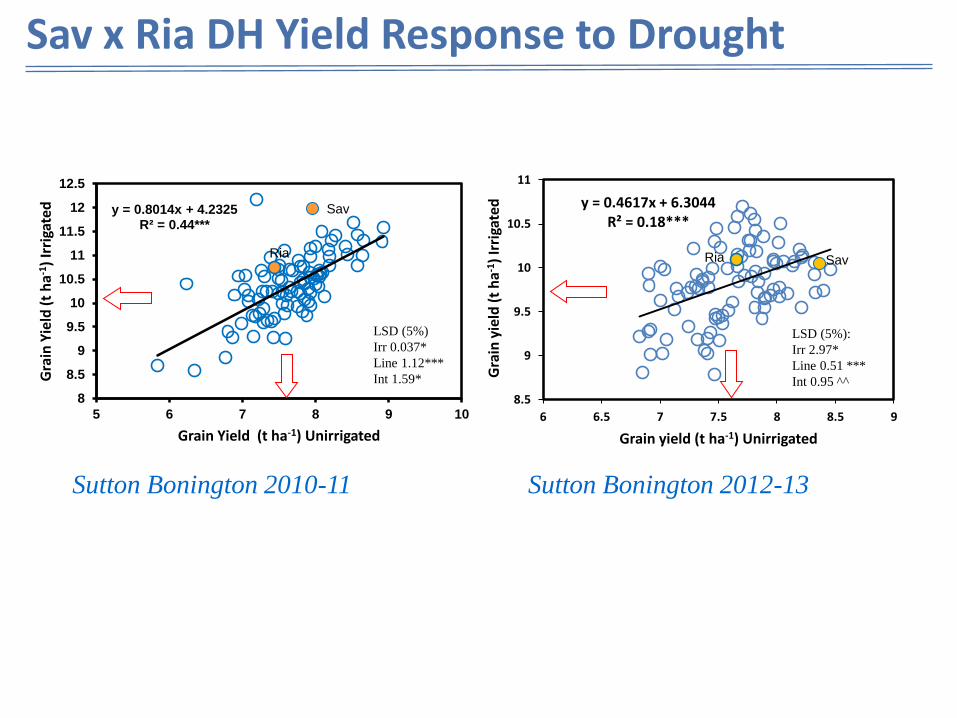
Sav y = 0.8014x + 4.2325 R² = 0.44***
8
8.5
9
9.5
10
10.5
11
11.5
12
12.5
5 6 7 8 9 10
Gra
in Y
ield
(t
ha-1
) Ir
riga
ted
Grain Yield (t ha-1) Unirrigated
L2 L39 L47
Sutton Bonington 2010-11
Ria Sav
y = 0.4617x + 6.3044 R² = 0.18***
8.5
9
9.5
10
10.5
11
6 6.5 7 7.5 8 8.5 9
Gra
in y
ield
(t
ha-1
) Ir
riga
ted
Grain yield (t ha-1) Unirrigated
LSD (5%):
Irr 2.97*
Line 0.51 ***
Int 0.95 ^^
LSD (5%)
Irr 0.037*
Line 1.12***
Int 1.59*
Sutton Bonington 2012-13
Sav x Ria DH Yield Response to Drought
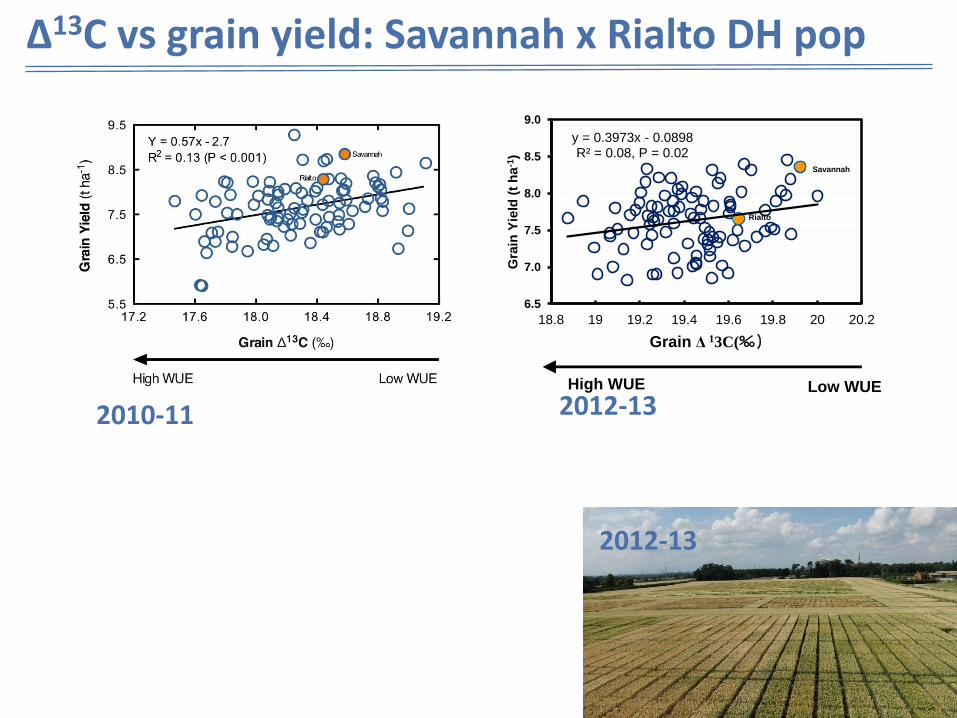
Δ13C vs grain yield: Savannah x Rialto DH pop
2010-11
y = 0.3973x - 0.0898 R² = 0.08, P = 0.02
6.5
7.0
7.5
8.0
8.5
9.0
18.8 19 19.2 19.4 19.6 19.8 20 20.2
Gra
in Y
ield
(t
ha
-1)
Grain Δ 13C(‰)
Savannah
Rialto
High WUE Low WUE
2012-13
2012-13
21
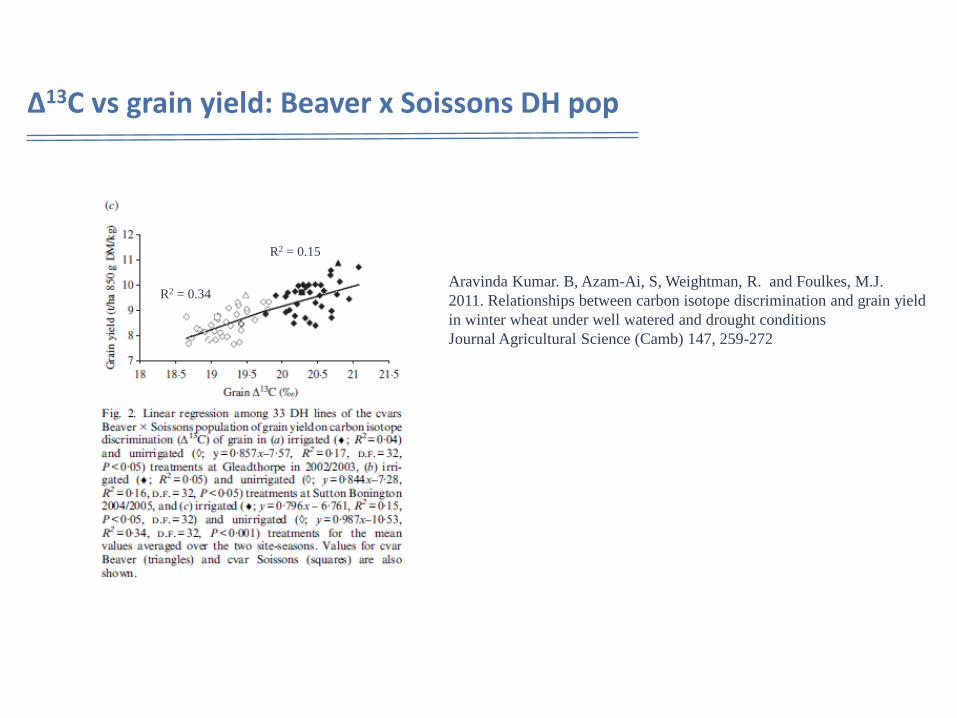
Aravinda Kumar. B, Azam-Ai, S, Weightman, R. and Foulkes, M.J.
2011. Relationships between carbon isotope discrimination and grain yield
in winter wheat under well watered and drought conditions
Journal Agricultural Science (Camb) 147, 259-272
Δ13C vs grain yield: Beaver x Soissons DH pop
R2 = 0.15
R2 = 0.34
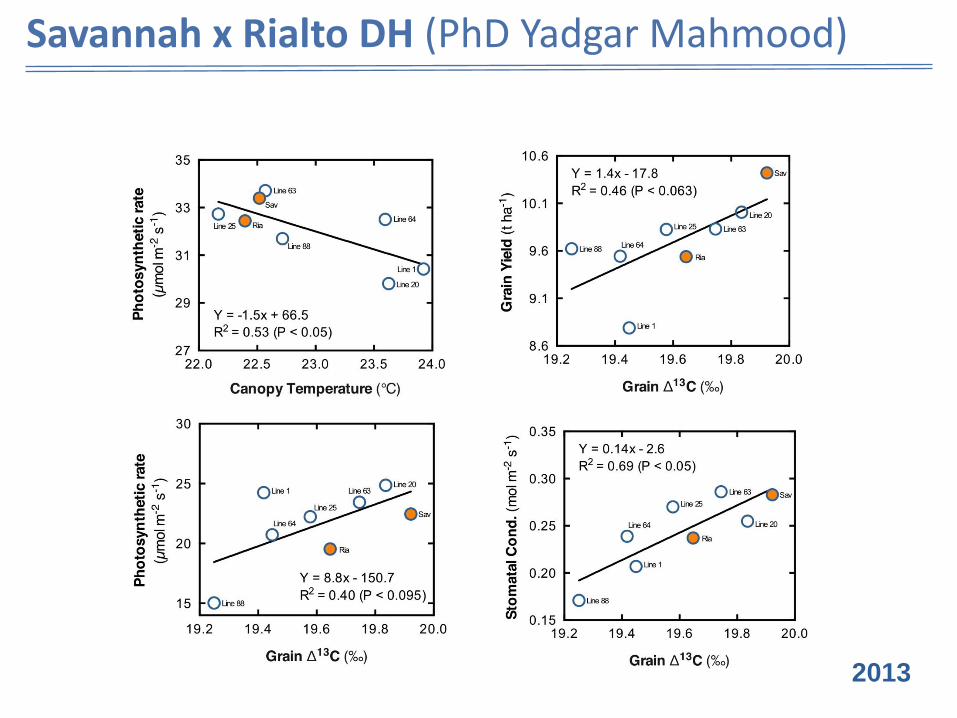
2013
Savannah x Rialto DH (PhD Yadgar Mahmood)
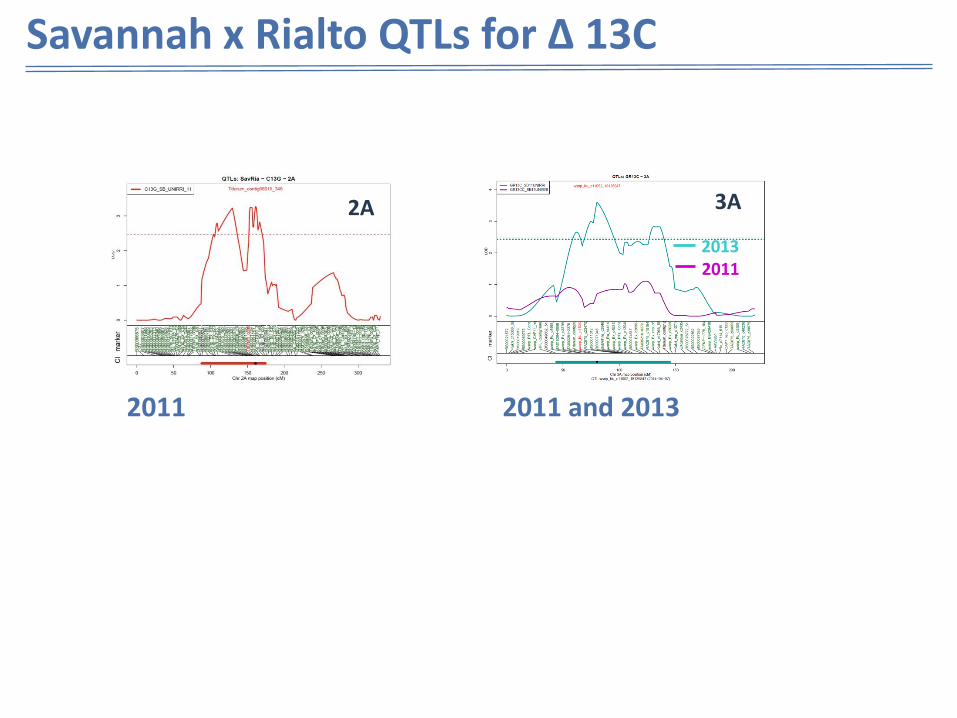
Savannah x Rialto QTLs for Δ 13C
2A
2011 and 2013
2013
2011
3A
2011
24
6A
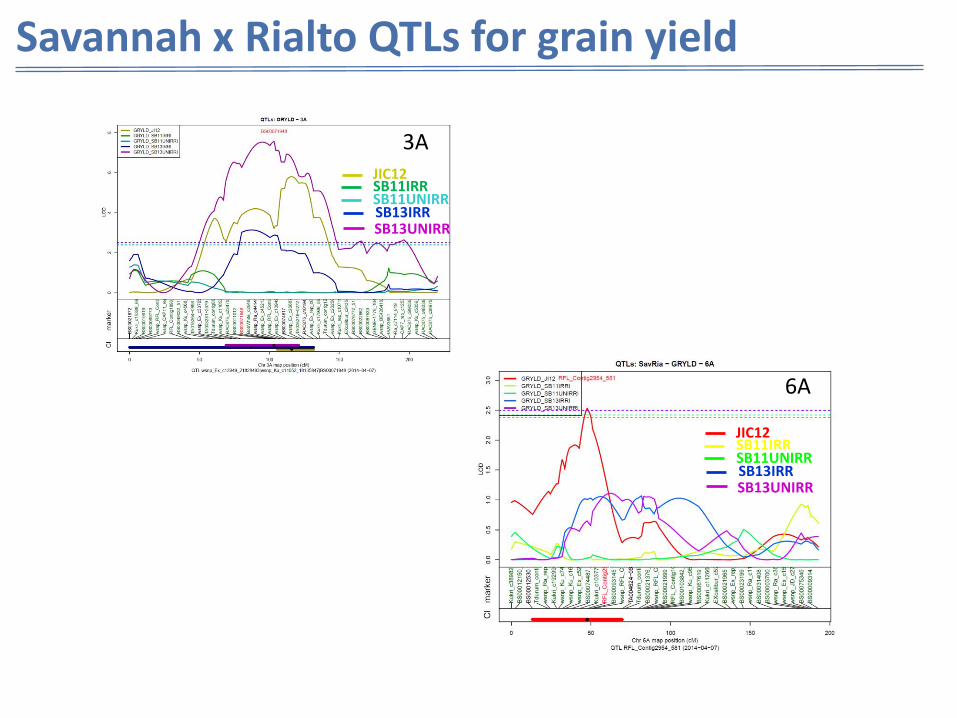
Savannah x Rialto QTLs for grain yield
3A
SB13UNIRR SB13IRR
SB11UNIRR SB11IRR JIC12
SB13UNIRR SB13IRR
SB11UNIRR SB11IRR JIC12
SB13UNIRR SB13IRR
SB11UNIRR SB11IRR JIC12
3A
25
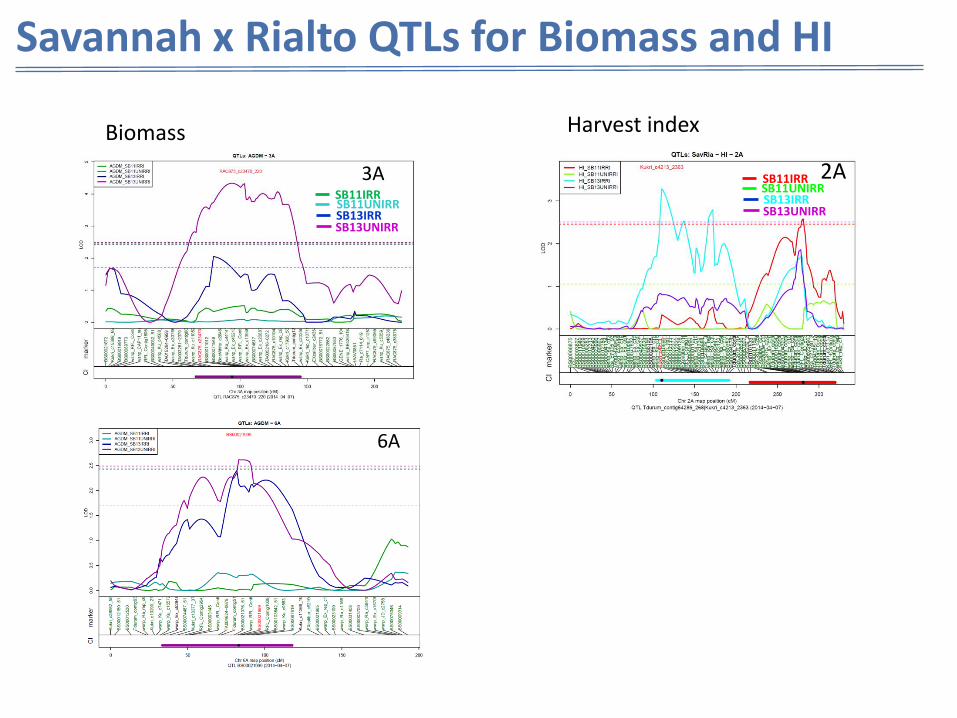
Biomass Harvest index
3A
6A
2A
SB13UNIRR SB13IRR
SB11IRR
Savannah x Rialto QTLs for Biomass and HI
SB11UNIRR SB13UNIRR SB13IRR
SB11IRR SB11UNIRR
26
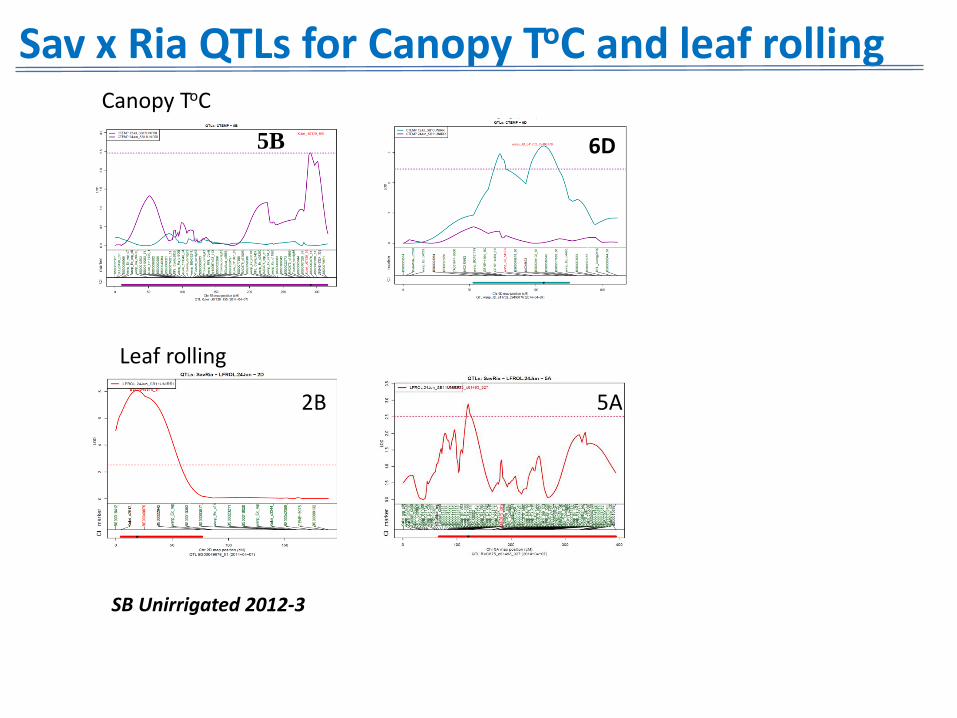
Canopy ToC
5B 6D
Leaf rolling
2B 5A
Sav x Ria QTLs for Canopy ToC and leaf rolling
SB Unirrigated 2012-3
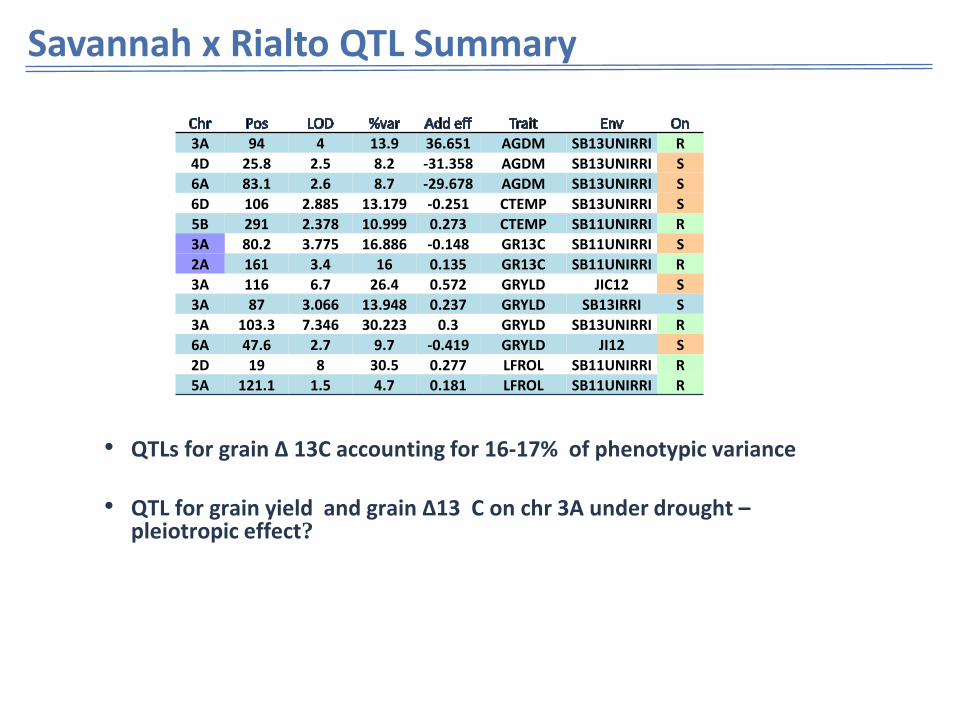
Savannah x Rialto QTL Summary
3A 94 4 13.9 36.651 AGDM SB13UNIRRI R
4D 25.8 2.5 8.2 -31.358 AGDM SB13UNIRRI S
6A 83.1 2.6 8.7 -29.678 AGDM SB13UNIRRI S
6D 106 2.885 13.179 -0.251 CTEMP SB13UNIRRI S
5B 291 2.378 10.999 0.273 CTEMP SB11UNIRRI R
3A 80.2 3.775 16.886 -0.148 GR13C SB11UNIRRI S
2A 161 3.4 16 0.135 GR13C SB11UNIRRI R
3A 116 6.7 26.4 0.572 GRYLD JIC12 S
3A 87 3.066 13.948 0.237 GRYLD SB13IRRI S
3A 103.3 7.346 30.223 0.3 GRYLD SB13UNIRRI R
6A 47.6 2.7 9.7 -0.419 GRYLD JI12 S
2D 19 8 30.5 0.277 LFROL SB11UNIRRI R
5A 121.1 1.5 4.7 0.181 LFROL SB11UNIRRI R
• QTLs for grain Δ 13C accounting for 16-17% of phenotypic variance
• QTL for grain yield and grain Δ13 C on chr 3A under drought – pleiotropic effect?
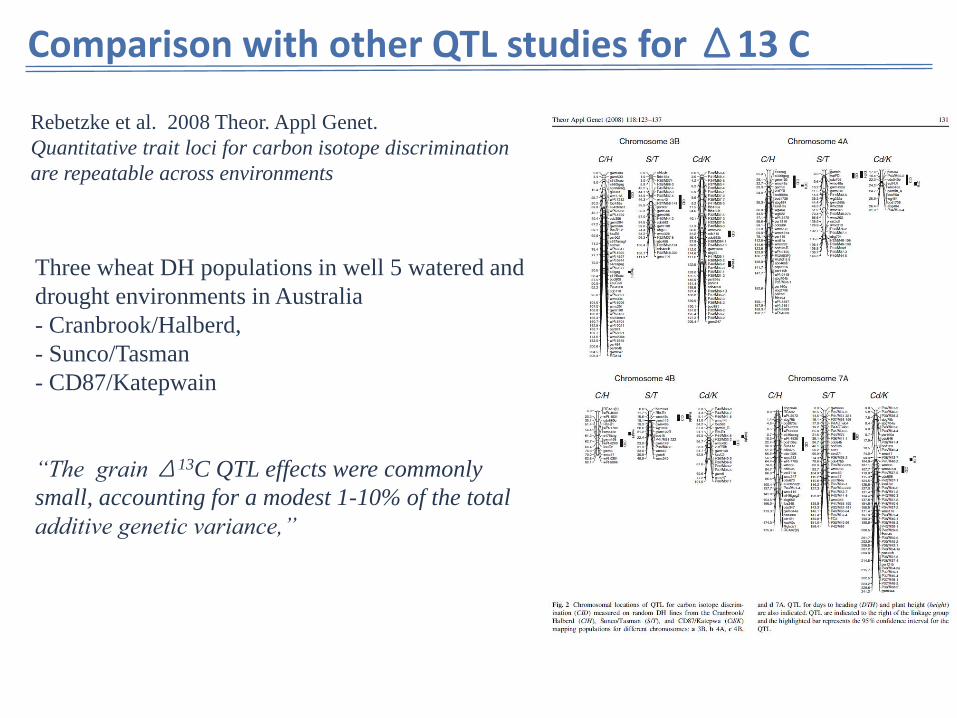
Three wheat DH populations in well 5 watered and
drought environments in Australia
- Cranbrook/Halberd,
- Sunco/Tasman
- CD87/Katepwain
“The grain Δ13C QTL effects were commonly
small, accounting for a modest 1-10% of the total
additive genetic variance,”
Rebetzke et al. 2008 Theor. Appl Genet.
Quantitative trait loci for carbon isotope discrimination
are repeatable across environments
Comparison with other QTL studies for Δ13 C
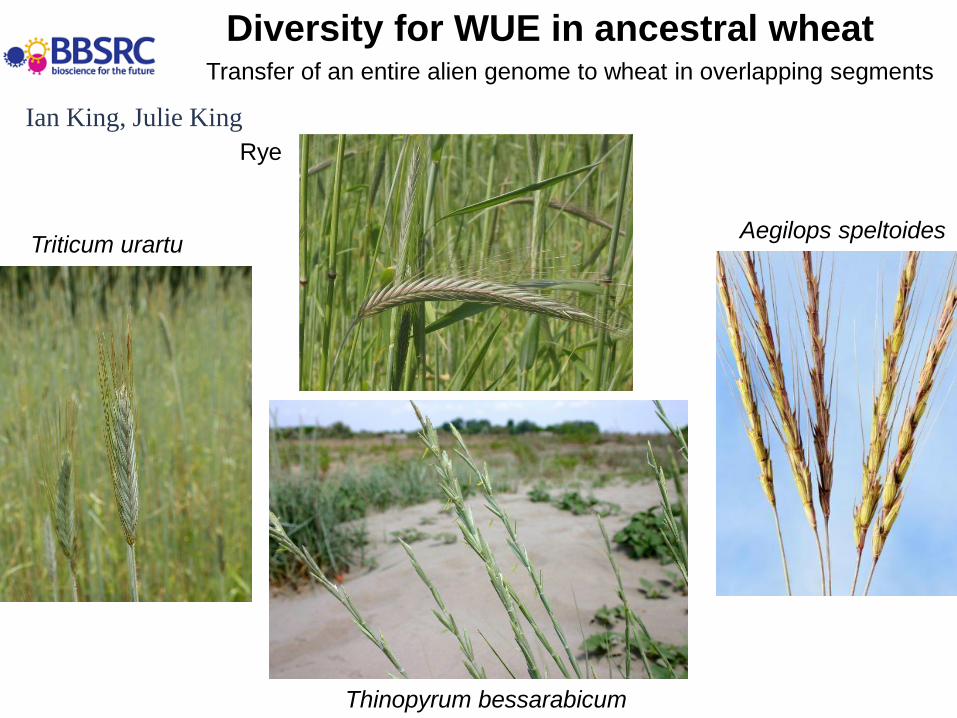
Transfer of an entire alien genome to wheat in overlapping segments
Diversity for WUE in ancestral wheat
Triticum urartu
Rye
Aegilops speltoides
Thinopyrum bessarabicum
Ian King, Julie King
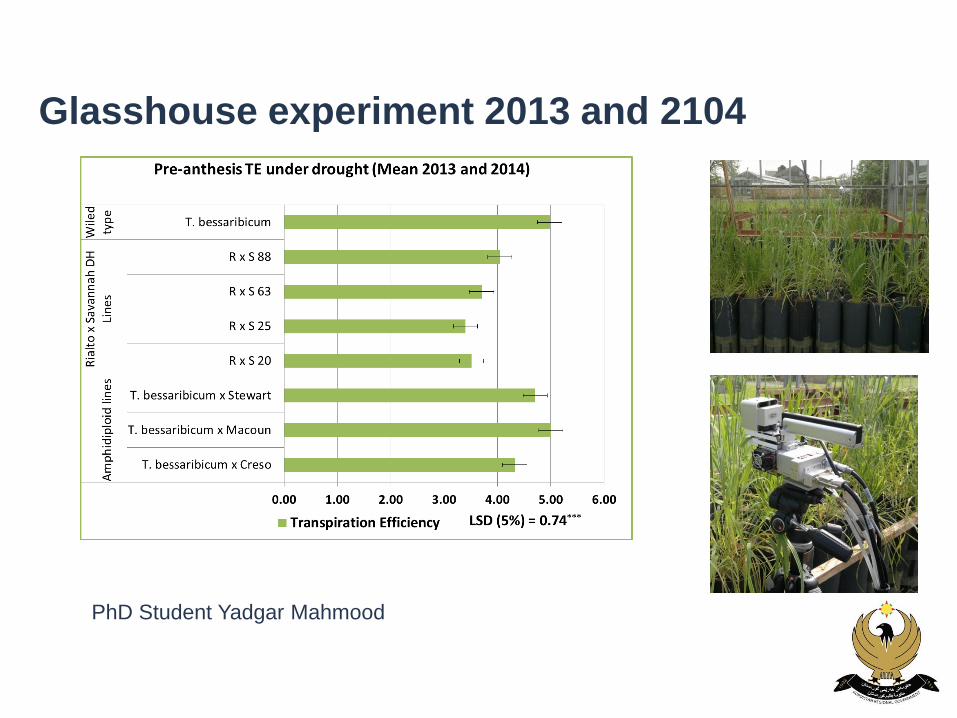
Glasshouse experiment 2013 and 2104
PhD Student Yadgar Mahmood
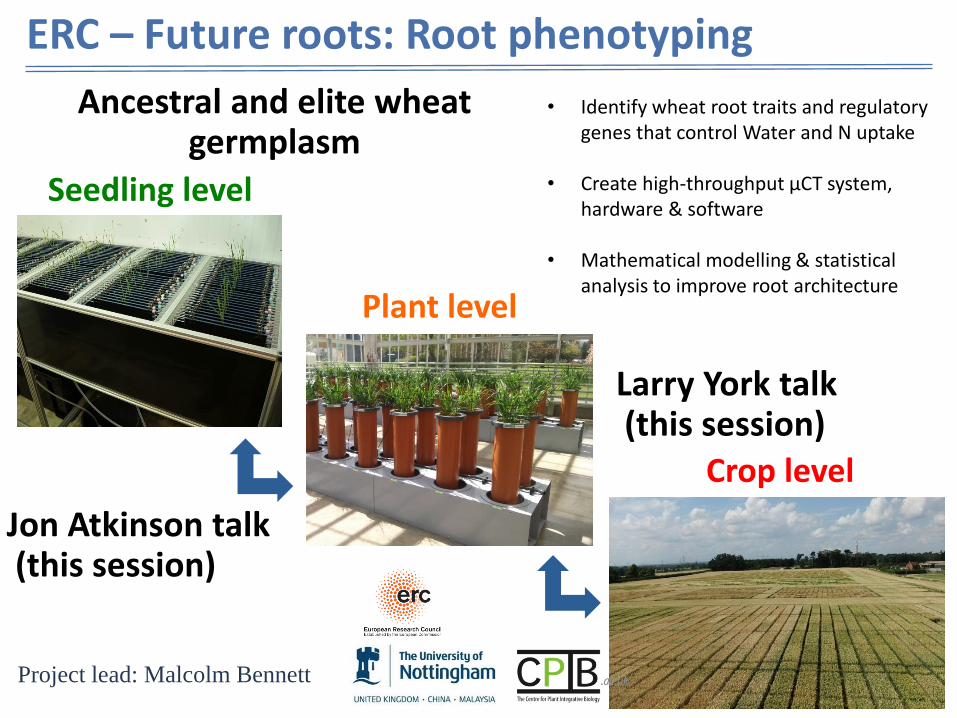
ERC – Future roots: Root phenotyping
Ancestral and elite wheat germplasm
Seedling level
Plant level
Crop level
Jon Atkinson talk (this session)
Larry York talk (this session)
Project lead: Malcolm Bennett
• Identify wheat root traits and regulatory
genes that control Water and N uptake
• Create high-throughput µCT system, hardware & software
• Mathematical modelling & statistical analysis to improve root architecture
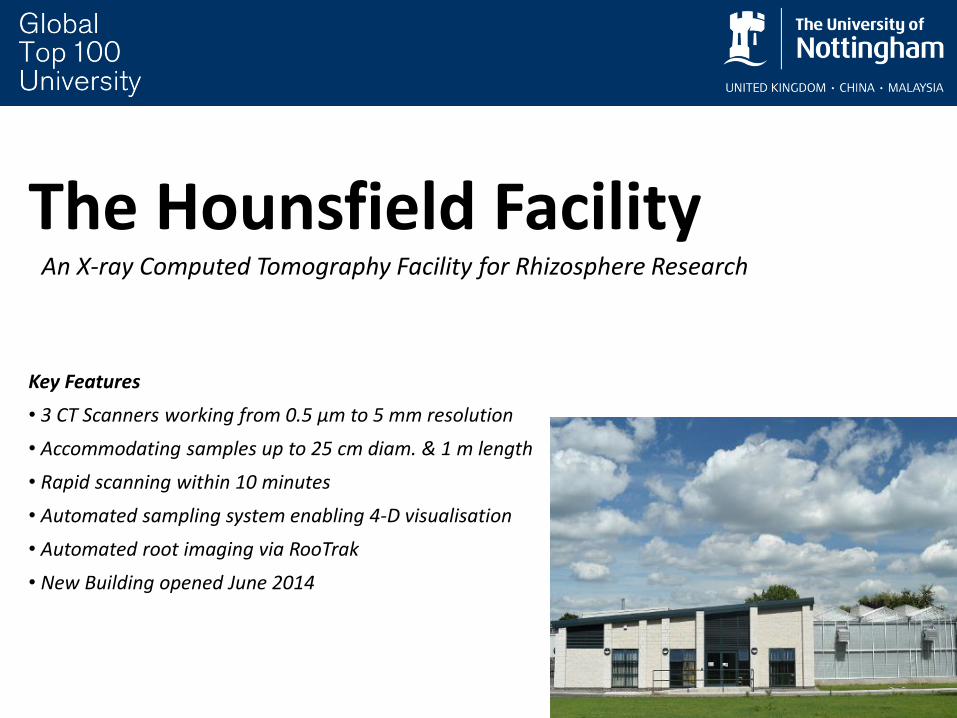
The Hounsfield Facility An X-ray Computed Tomography Facility for Rhizosphere Research
Key Features
• 3 CT Scanners working from 0.5 µm to 5 mm resolution
• Accommodating samples up to 25 cm diam. & 1 m length
• Rapid scanning within 10 minutes
• Automated sampling system enabling 4-D visualisation
• Automated root imaging via RooTrak
• New Building opened June 2014
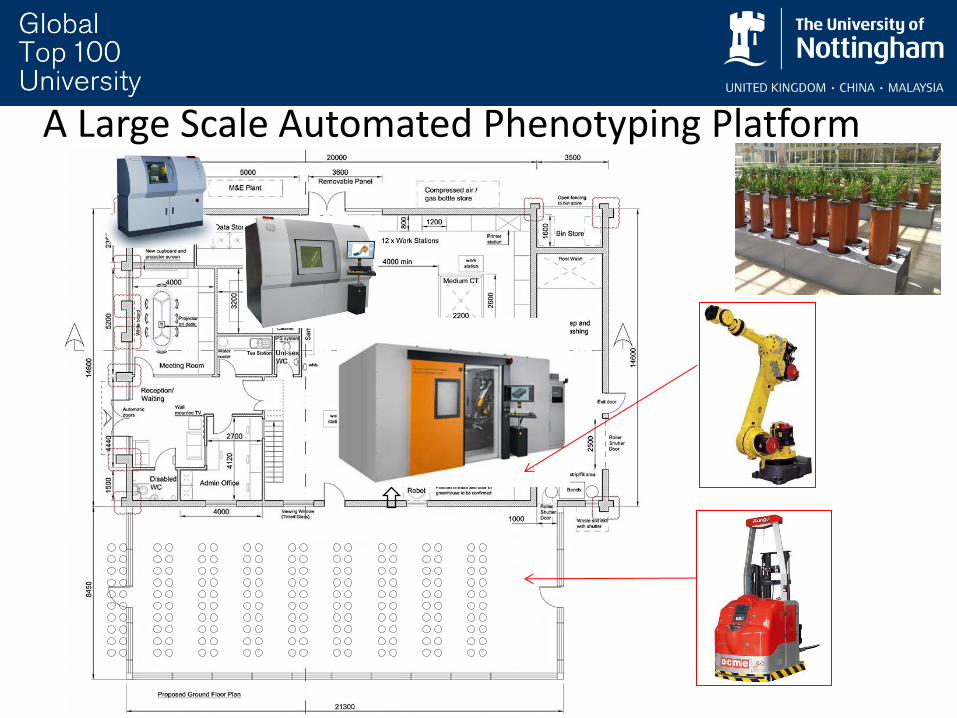
A Large Scale Automated Phenotyping Platform
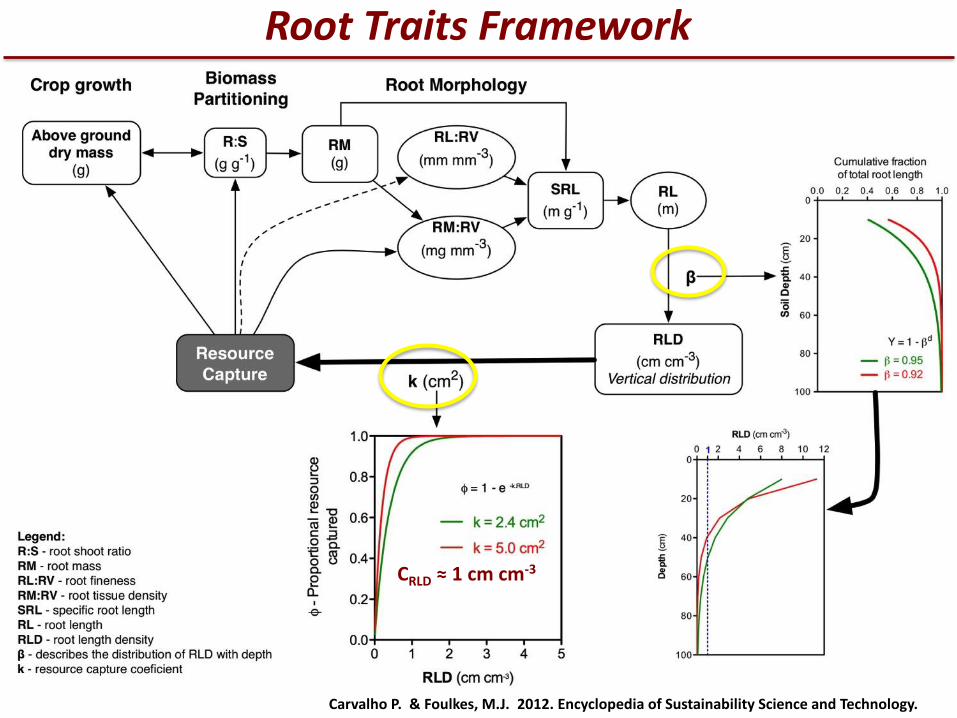
CRLD ≈ 1 cm cm-3
Root Traits Framework
Carvalho P. & Foulkes, M.J. 2012. Encyclopedia of Sustainability Science and Technology.
35
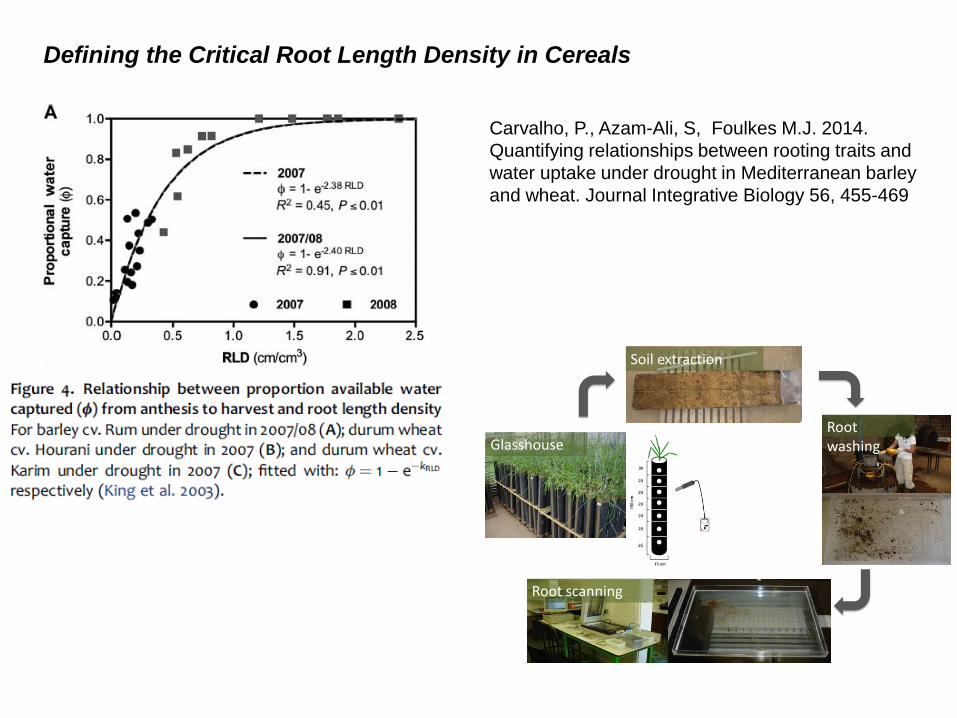
Glasshouse
Soil extraction
Root washing
Root scanning
Carvalho, P., Azam-Ali, S, Foulkes M.J. 2014.
Quantifying relationships between rooting traits and
water uptake under drought in Mediterranean barley
and wheat. Journal Integrative Biology 56, 455-469
Defining the Critical Root Length Density in Cereals
Summary • Ability to access water appears to be key to productivity under UK drought.
• Grain 13C Δ correlated with grain yield under drought. Physiological basis ~
increased stomatal conductance, deeper roots?
• QTLs for grain 13C Δ for 16-17% of phenotypic variance. QTL on Chr3A pleiotroic effects of QTL for yield?
• High throughput phenotyping platforms for screening rooting traits in development - at seedling, plant, crop scale
• Phenotyping for wider variation in stomatal aperture traits and rooting traits and identification of regulatory genes is ongoing
Acknowledgments
Ian King Jukie King
Jayalath De Silva Pedro Carvalho
Yadgar Mahmood Larry York
Shaunagh Keating Sacha mooney
Malcolm Bennet
Simon Griffiths Luzie Wingen Simon Orford Luzie Wingen
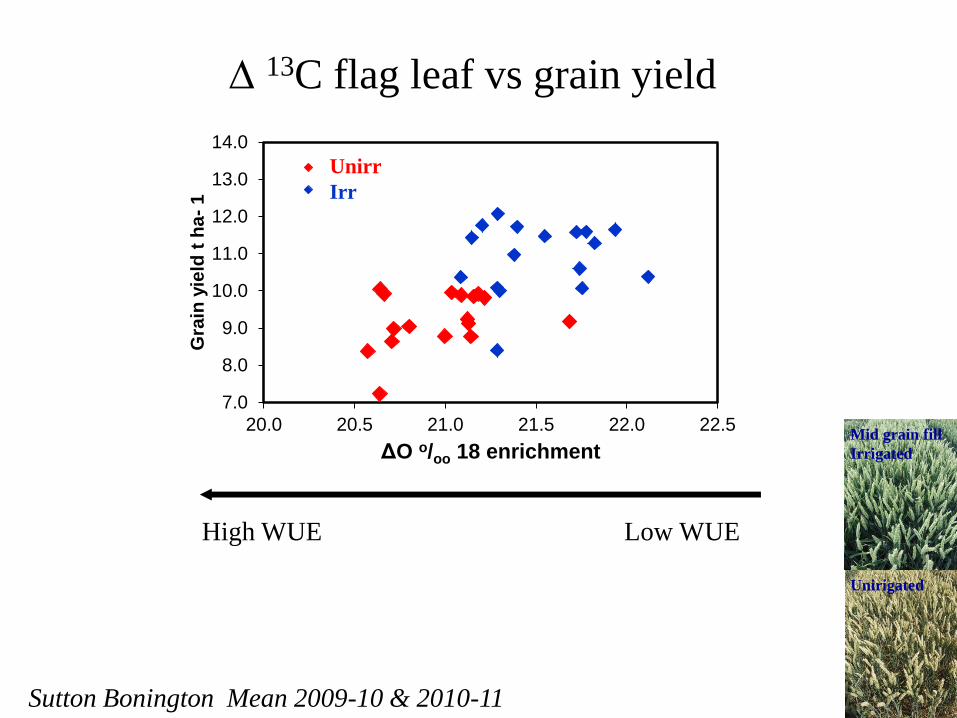
Low WUE High WUE
13C flag leaf vs grain yield
Sutton Bonington Mean 2009-10 & 2010-11
Mid grain fill
Irrigated
Unirigated
7.0
8.0
9.0
10.0
11.0
12.0
13.0
14.0
20.0 20.5 21.0 21.5 22.0 22.5
Gra
in y
ield
t h
a-
1
ΔO o/oo 18 enrichment
Series1
Series2
Unirr
Irr
39
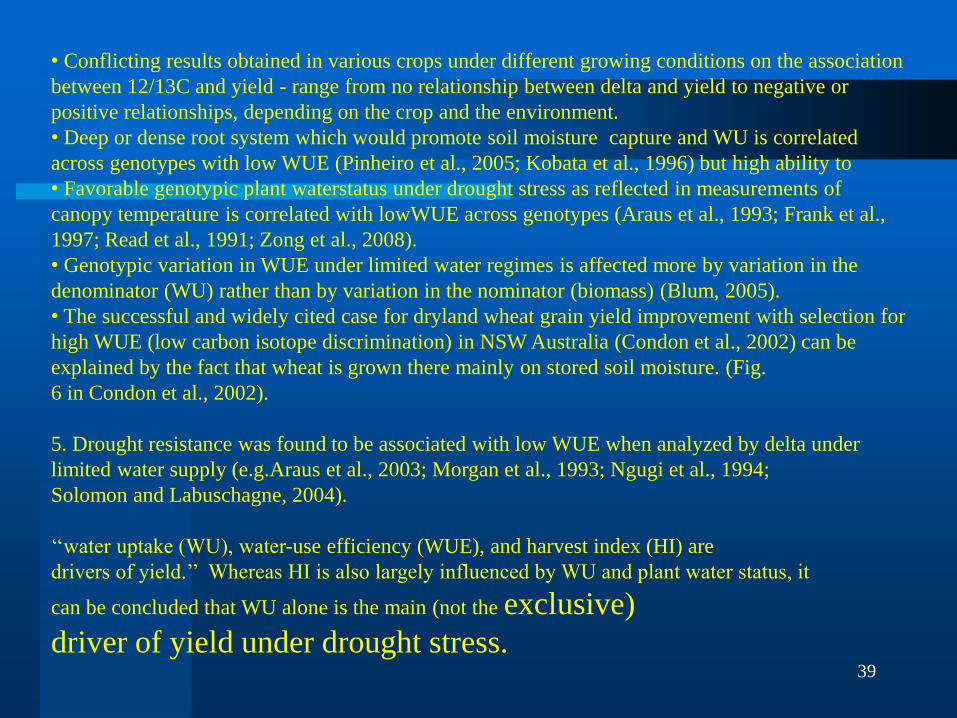
• Conflicting results obtained in various crops under different growing conditions on the association
between 12/13C and yield - range from no relationship between delta and yield to negative or
positive relationships, depending on the crop and the environment.
• Deep or dense root system which would promote soil moisture capture and WU is correlated
across genotypes with low WUE (Pinheiro et al., 2005; Kobata et al., 1996) but high ability to
• Favorable genotypic plant waterstatus under drought stress as reflected in measurements of
canopy temperature is correlated with lowWUE across genotypes (Araus et al., 1993; Frank et al.,
1997; Read et al., 1991; Zong et al., 2008).
• Genotypic variation in WUE under limited water regimes is affected more by variation in the
denominator (WU) rather than by variation in the nominator (biomass) (Blum, 2005).
• The successful and widely cited case for dryland wheat grain yield improvement with selection for
high WUE (low carbon isotope discrimination) in NSW Australia (Condon et al., 2002) can be
explained by the fact that wheat is grown there mainly on stored soil moisture. (Fig.
6 in Condon et al., 2002).
5. Drought resistance was found to be associated with low WUE when analyzed by delta under
limited water supply (e.g.Araus et al., 2003; Morgan et al., 1993; Ngugi et al., 1994;
Solomon and Labuschagne, 2004).
‘‘water uptake (WU), water-use efficiency (WUE), and harvest index (HI) are
drivers of yield.’’ Whereas HI is also largely influenced by WU and plant water status, it
can be concluded that WU alone is the main (not the exclusive)
driver of yield under drought stress.
40
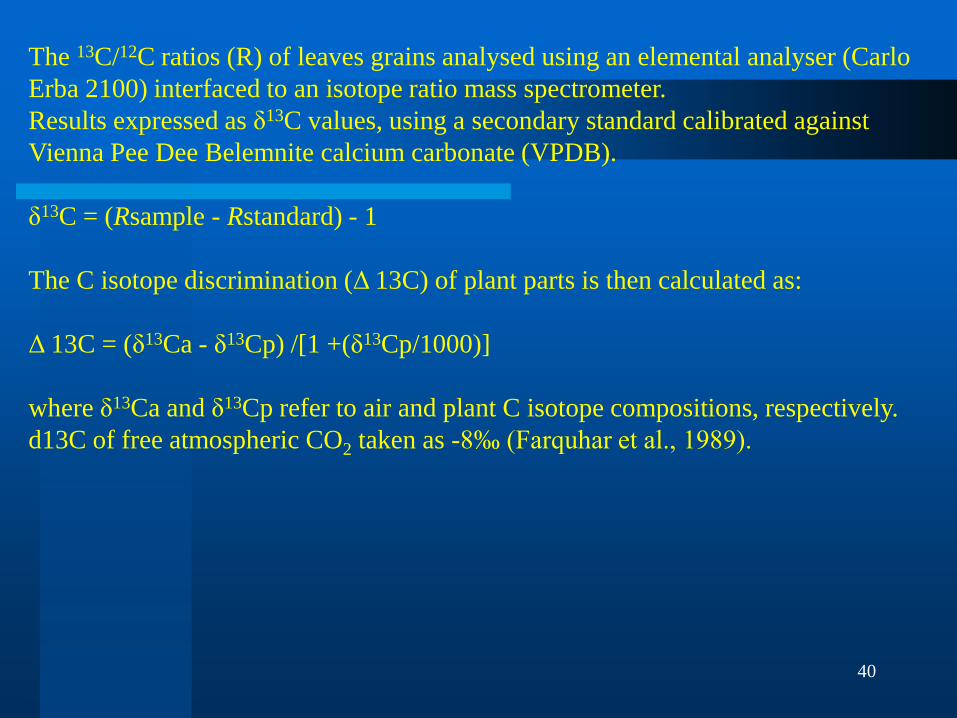
The 13C/12C ratios (R) of leaves grains analysed using an elemental analyser (Carlo
Erba 2100) interfaced to an isotope ratio mass spectrometer.
Results expressed as δ13C values, using a secondary standard calibrated against
Vienna Pee Dee Belemnite calcium carbonate (VPDB).
δ13C = (Rsample - Rstandard) - 1
The C isotope discrimination (Δ 13C) of plant parts is then calculated as:
Δ 13C = (δ13Ca - δ13Cp) /[1 +(δ13Cp/1000)]
where δ13Ca and δ13Cp refer to air and plant C isotope compositions, respectively.
d13C of free atmospheric CO2 taken as -8‰ (Farquhar et al., 1989).