
I n t e r p r e t e r C o r n e r — C o o r d I n at e d ...€¦ · Determination of lithology...
6
936 THE LEADING EDGE May 2015 I NTERPRETER ’ S C ORNER — C OORDINATED BY E ZEQUIEL G ONZALEZ Determination of lithology and brittleness of rocks with a new attribute Abstract e discrimination of fluid content and lithology in a reservoir is an important characterization that has a bearing on reservoir development and its management. For unconventional reservoirs such as shale-gas formations, it is vital that reservoir zones are brittle, besides other favorable considerations that are expected of them. Brittle zones fracture better, and fracturing of shale-gas reservoirs is required for their production. Among the different physical parameters that characterize the rocks, Young’s modu- lus (E) is a measure of brittleness. Attempts usually are made to determine this physical constant from well-log data, but such measurements are localized over a small area. For studying lateral variation of brittleness in an area, 3D seismic data need to be used. Computation of Young’s modulus from seismic data requires the availability of density (ρ). e computation of density in turn re- quires long-offset seismic data, which usually are not available. A new attribute (Eρ) is in the form of a product of Young’s modulus and density. For a brittle rock, both Young’s modulus and density are expected to be high, and so the Eρ attribute would exhibit a high value and serve as a brittleness indicator. is new attribute is useful for lithofluid detection, when it is used in conjunction with the product of bulk modulus and density. Introduction Very often in our projects, we are expected to carry out the discrimination of hydrocarbon-bearing sandstones from shales as well as that of gas sands from brine-saturated sandstones. is is because the determination of lithology and fluid-content distribu- tion in a reservoir is a desirable objective for its characterization and subsequent management. Physical properties such as porosity and permeability make it possible to evaluate a hydrocarbon reservoir. All subsurface rocks have undergone changes in dimensions or deformation called strain on being acted on by subsurface stresses. e magnitudes of the strain responses are related to the applied stresses by different elastic constants, which include bulk modulus, shear modulus, Young’s modulus, and Poisson’s ratio, among others. Bulk modulus ( ) is a measure of a material’s resistance to change in volume and is known as incompressibility. It is treated as a porosity indicator. Shear modulus (μ) is a measure of rigidity of a rock or resistance to deformation taken in a shear direction and is treated as a lithology indicator. Young’s modulus (E ), also known as stiffness modulus, is a measure of the stiffness of the material of the rock. Finally, Poisson’s ratio is a measure of the strength of the material of the rock (Chopra and Castagna, 2014). Historically, on the basis of these physical properties, geosci- entists have attempted to delineate the fluid and lithology content Ritesh Kumar Sharma 1 and Satinder Chopra 1 of a reservoir. An estimation of the physical properties described above can be done with P-impedance (I P ), S-impedance (I S ), and density. For computing these prerequisites, prestack or simulta- neous inversion of surface-seismic data usually is performed. Al- though extraction of density from seismic data needs far-offset information, it is also true that quality and amplitude fidelity de- teriorate significantly at large angles of incidence. erefore, the computation of density is considered an arduous task. In the absence of density, efforts have been made for charac- terization of a reservoir in terms of lithology and fluid content. For this purpose, I P and I S are used for lithofluid discrimina- tion because I P is sensitive to fluid, whereas I S is not, in practice. Goodway et al. (1997) propose the determination of rock-phys- ics parameters such as Lamé’s constants (λ and μ) from I P and I S and demonstrate that although λ (sensitive to pore fluid) and μ (sensitive to the rigidity of the rock matrix) might be difficult to isolate from seismic data, λρ and μρ, where ρ is density, can be determined easily from I P and I S . Besides, these attributes show better discrimination of lithology and fluids in the λρ-μρ crossplot space. Russell et al. (2003) propose the use of the more generalized fluid term (ρ ƒ ) instead of just the λρ attribute. Likewise, Ka- tahara (2001) investigates application of the ρ attribute using well data for enhancing the detection of fluid. Al-Dabagh and Alkhafaf (2011) show a comparison of ρ and λρ and show that ρ comes out as a superior attribute for fluid detection. e brittleness of a rock is an important property, especially for shale-resource reservoirs, where fracturing is used for stimu- lation. Brittle shales fracture much better than ductile ones and enhance the permeability of those zones. Young’s modulus, being a measure of stiffness of the rock, can characterize such brittle pockets in shales because we treat stiffness to be the same as brittleness. Accordingly, Santoso et al. (1995) and Banik et al. (2010) demonstrate the determination of Young’s modulus from seis- mic data by way of inversion. One limitation of the approach of Santoso et al. (1995) is the requirement of density which, as stated above, is difficult to derive from seismic data unless long- offset information is available. Banik et al. (2010) alleviate the requirement for density by using the correlation of I S or I P and Young’s modulus from log data and using that relationship for computation of Young’s modulus. Considering the importance of a lithology indicator as well as an attribute that could yield information on the brittleness of a reservoir, Sharma and Chopra (2012) propose a new attribute, E ρ, which is the product of Young’s modulus and density. Although ρ intensifies fluid detection, E ρ accentuates lithology detection 1 Arcis Seismic Solutions, TGS. DOI information...
-
Upload
nguyentram -
Category
Documents
-
view
217 -
download
0
Transcript of I n t e r p r e t e r C o r n e r — C o o r d I n at e d ...€¦ · Determination of lithology...
936 T H E L E A D I N G E D G E May 2 015
I n t e r p r e t e r ’ s C o r n e r — C o o r d I n a t e d b y e z e q u I e l G o n z a l e z
Determination of lithology and brittleness of rocks with a new attribute
AbstractThe discrimination of fluid content and lithology in a reservoir
is an important characterization that has a bearing on reservoir development and its management. For unconventional reservoirs such as shale-gas formations, it is vital that reservoir zones are brittle, besides other favorable considerations that are expected of them. Brittle zones fracture better, and fracturing of shale-gas reservoirs is required for their production. Among the different physical parameters that characterize the rocks, Young’s modu-lus (E) is a measure of brittleness. Attempts usually are made to determine this physical constant from well-log data, but such measurements are localized over a small area. For studying lateral variation of brittleness in an area, 3D seismic data need to be used. Computation of Young’s modulus from seismic data requires the availability of density (ρ). The computation of density in turn re-quires long-offset seismic data, which usually are not available. A new attribute (Eρ) is in the form of a product of Young’s modulus and density. For a brittle rock, both Young’s modulus and density are expected to be high, and so the Eρ attribute would exhibit a high value and serve as a brittleness indicator. This new attribute is useful for lithofluid detection, when it is used in conjunction with the product of bulk modulus and density.
IntroductionVery often in our projects, we are expected to carry out the
discrimination of hydrocarbon-bearing sandstones from shales as well as that of gas sands from brine-saturated sandstones. This is because the determination of lithology and fluid-content distribu-tion in a reservoir is a desirable objective for its characterization and subsequent management. Physical properties such as porosity and permeability make it possible to evaluate a hydrocarbon reservoir.
All subsurface rocks have undergone changes in dimensions or deformation called strain on being acted on by subsurface stresses. The magnitudes of the strain responses are related to the applied stresses by different elastic constants, which include bulk modulus, shear modulus, Young’s modulus, and Poisson’s ratio, among others.
Bulk modulus () is a measure of a material’s resistance to change in volume and is known as incompressibility. It is treated as a porosity indicator. Shear modulus (μ) is a measure of rigidity of a rock or resistance to deformation taken in a shear direction and is treated as a lithology indicator. Young’s modulus (E ), also known as stiffness modulus, is a measure of the stiffness of the material of the rock. Finally, Poisson’s ratio is a measure of the strength of the material of the rock (Chopra and Castagna, 2014).
Historically, on the basis of these physical properties, geosci-entists have attempted to delineate the fluid and lithology content
Ritesh Kumar Sharma1 and Satinder Chopra1
of a reservoir. An estimation of the physical properties described above can be done with P-impedance (IP), S-impedance (IS), and density. For computing these prerequisites, prestack or simulta-neous inversion of surface-seismic data usually is performed. Al-though extraction of density from seismic data needs far-offset information, it is also true that quality and amplitude fidelity de-teriorate significantly at large angles of incidence. Therefore, the computation of density is considered an arduous task.
In the absence of density, efforts have been made for charac-terization of a reservoir in terms of lithology and fluid content. For this purpose, IP and IS are used for lithofluid discrimina-tion because IP is sensitive to fluid, whereas IS is not, in practice. Goodway et al. (1997) propose the determination of rock-phys-ics parameters such as Lamé’s constants (λ and μ) from IP and IS and demonstrate that although λ (sensitive to pore fluid) and μ (sensitive to the rigidity of the rock matrix) might be difficult to isolate from seismic data, λρ and μρ, where ρ is density, can be determined easily from IP and IS. Besides, these attributes show better discrimination of lithology and fluids in the λρ-μρ crossplot space.
Russell et al. (2003) propose the use of the more generalized fluid term (ρƒ) instead of just the λ ρ attribute. Likewise, Ka-tahara (2001) investigates application of the ρ attribute using well data for enhancing the detection of fluid. Al-Dabagh and Alkhafaf (2011) show a comparison of ρ and λρ and show that ρ comes out as a superior attribute for fluid detection.
The brittleness of a rock is an important property, especially for shale-resource reservoirs, where fracturing is used for stimu-lation. Brittle shales fracture much better than ductile ones and enhance the permeability of those zones. Young’s modulus, being a measure of stiffness of the rock, can characterize such brittle pockets in shales because we treat stiffness to be the same as brittleness.
Accordingly, Santoso et al. (1995) and Banik et al. (2010) demonstrate the determination of Young’s modulus from seis-mic data by way of inversion. One limitation of the approach of Santoso et al. (1995) is the requirement of density which, as stated above, is difficult to derive from seismic data unless long-offset information is available. Banik et al. (2010) alleviate the requirement for density by using the correlation of IS or IP and Young’s modulus from log data and using that relationship for computation of Young’s modulus.
Considering the importance of a lithology indicator as well as an attribute that could yield information on the brittleness of a reservoir, Sharma and Chopra (2012) propose a new attribute, Eρ, which is the product of Young’s modulus and density. Although ρ intensifies fluid detection, Eρ accentuates lithology detection
1 Arcis Seismic Solutions, TGS. DOI information...
May 2 01 5 T H E L E A D I N G E D G E 937
in terms of brittleness and facilitates a new domain, wherein fluid-lithology discrimination can be achieved in a significant way.
Ever since we first presented the application of this new at-tribute at the 2012 SEG Annual Meeting, we have noticed that other practitioners have made similar applications with convinc-ing results (Sun et al, 2013; Yu et al., 2014; Zhang, 2014). We are confident that the application of new attribute Eρ holds promise, especially in its application to unconventional-resource plays.
MethodologyYoung’s modulus (E ) is the measure of stiffness of a rock and
can be defined in terms of bulk modulus () as
E = 3 (1 – 2σ), (1)
where σ is Poisson’s ratio and can be written in terms of P-wave velocity and S-wave velocity as follows:
=2V �2V V � 2V ,P
2S
2
P2
S2σ (2)
and bulk modulus is related to P-velocity as V =P ρ
κ μ+ 43
√
, with μ = ρVS
2. (3) Substitution of equations 2 and 3 into equation 1 yields
E = V (3V � 4V )
S2ρ V �V P
2S
2P2
S2
. (4)
On multiplying both sides of the above equation by density and using the relationships IP = ρVP and IS = ρVS, the above equation can be written as
E = (3I � 4I )
ρ ρ I � I P2
S2
P2
S2
μ . (5)
Thus, once we compute IP and IS using seismic inversion, this attribute can be derived directly. Further, the above equation can be written as
Eρ = μρ * α , (6)
where = (3V � 4V )α V �V P2
S2
P2
S2
. If α turns out to be a positive number, it can be concluded that Eρ is a scaled version of μρ and would en-hance lithologic information. To this end, we consider the fol-lowing two cases.
Case 1: Brine sand. For brine sand, it is known that VV
P
S = 2,
i.e., VP = 2VS. Using this, it can be shown that
=E� ��83 . (7)
Case 2: Gas sand. For the gas-sand case, typically, VV
P
S = 1.5,
and so in this case, Eρ can be computed as
=E� ��115 . (8)
We thus conclude from these two cases that whether hydro-carbon is present in a formation or not, Eρ is a scaled version of μρ, which intensifies lithologic information. For a brittle rock, Young’s modulus would be high, and density might be high too. Therefore, the product of Young’s modulus and density would be high also and would accentuate the brittleness of the rock. Thus, for the determination of brittleness from seismic data, Eρ could serve as a useful attribute.
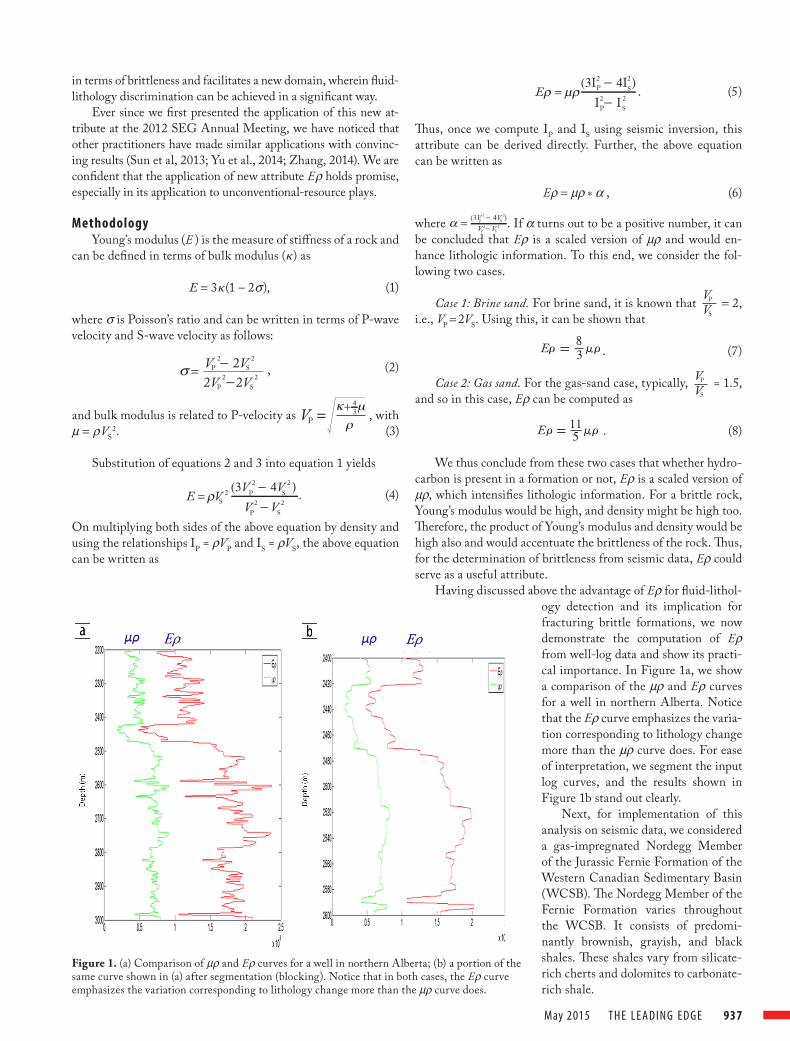
Having discussed above the advantage of Eρ for fluid-lithol-ogy detection and its implication for fracturing brittle formations, we now demonstrate the computation of Eρ from well-log data and show its practi-cal importance. In Figure 1a, we show a comparison of the μρ and Eρ curves for a well in northern Alberta. Notice that the Eρ curve emphasizes the varia-tion corresponding to lithology change more than the μρ curve does. For ease of interpretation, we segment the input log curves, and the results shown in Figure 1b stand out clearly.
Next, for implementation of this analysis on seismic data, we considered a gas-impregnated Nordegg Member of the Jurassic Fernie Formation of the Western Canadian Sedimentary Basin (WCSB). The Nordegg Member of the Fernie Formation varies throughout the WCSB. It consists of predomi-nantly brownish, grayish, and black shales. These shales vary from silicate-rich cherts and dolomites to carbonate-rich shale.
Figure 1. (a) Comparison of μρ and Eρ curves for a well in northern Alberta; (b) a portion of the same curve shown in (a) after segmentation (blocking). Notice that in both cases, the Eρ curve emphasizes the variation corresponding to lithology change more than the μρ curve does.
938 T H E L E A D I N G E D G E May 2 01 5
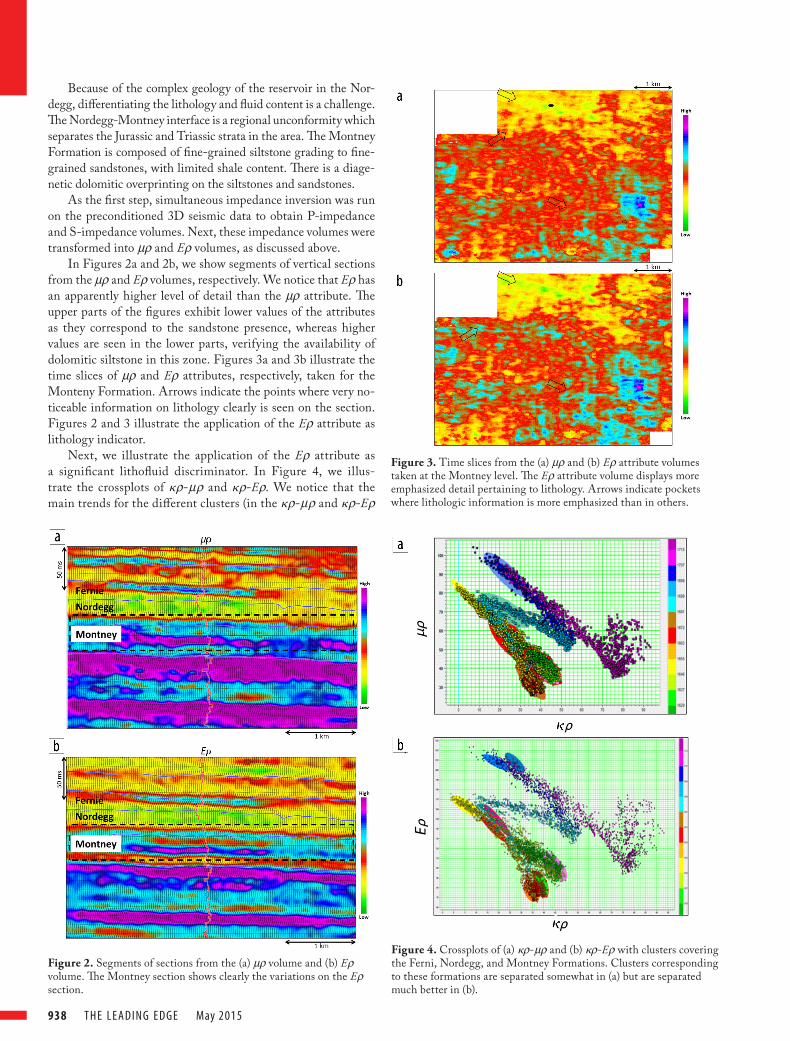
Because of the complex geology of the reservoir in the Nor-degg, differentiating the lithology and fluid content is a challenge. The Nordegg-Montney interface is a regional unconformity which separates the Jurassic and Triassic strata in the area. The Montney Formation is composed of fine-grained siltstone grading to fine-grained sandstones, with limited shale content. There is a diage-netic dolomitic overprinting on the siltstones and sandstones.
As the first step, simultaneous impedance inversion was run on the preconditioned 3D seismic data to obtain P-impedance and S-impedance volumes. Next, these impedance volumes were transformed into μρ and Eρ volumes, as discussed above.
In Figures 2a and 2b, we show segments of vertical sections from the μρ and Eρ volumes, respectively. We notice that Eρ has an apparently higher level of detail than the μρ attribute. The upper parts of the figures exhibit lower values of the attributes as they correspond to the sandstone presence, whereas higher values are seen in the lower parts, verifying the availability of dolomitic siltstone in this zone. Figures 3a and 3b illustrate the time slices of μρ and Eρ attributes, respectively, taken for the Monteny Formation. Arrows indicate the points where very no-ticeable information on lithology clearly is seen on the section. Figures 2 and 3 illustrate the application of the Eρ attribute as lithology indicator.
Next, we illustrate the application of the Eρ attribute as a significant lithofluid discriminator. In Figure 4, we illus-trate the crossplots of ρ-μρ and ρ-Eρ. We notice that the main trends for the different clusters (in the ρ-μρ and ρ-Eρ
Figure 2. Segments of sections from the (a) μρ volume and (b) Eρ volume. The Montney section shows clearly the variations on the Eρ section.
Figure 3. Time slices from the (a) μρ and (b) Eρ attribute volumes taken at the Montney level. The Eρ attribute volume displays more emphasized detail pertaining to lithology. Arrows indicate pockets where lithologic information is more emphasized than in others.
Figure 4. Crossplots of (a) ρ-μρ and (b) ρ-Eρ with clusters covering the Ferni, Nordegg, and Montney Formations. Clusters corresponding to these formations are separated somewhat in (a) but are separated much better in (b).
May 2 01 5 T H E L E A D I N G E D G E 939
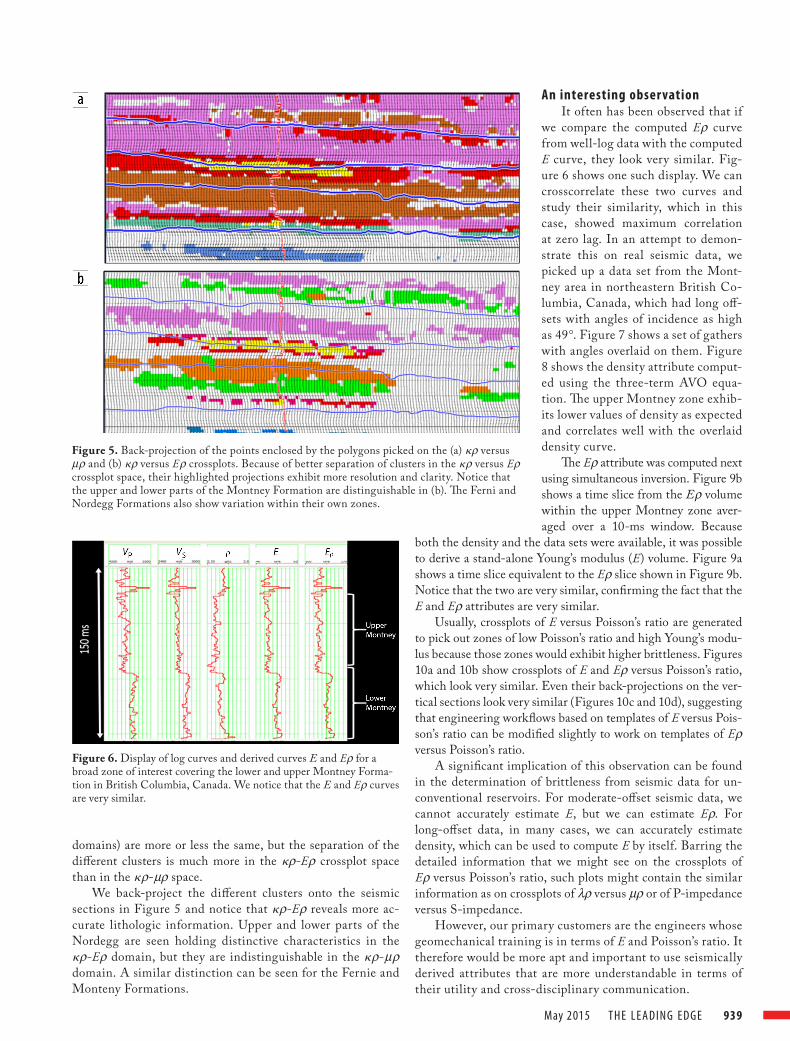
domains) are more or less the same, but the separation of the different clusters is much more in the ρ-Eρ crossplot space than in the ρ-μρ space.
We back-project the different clusters onto the seismic sections in Figure 5 and notice that ρ-Eρ reveals more ac-curate lithologic information. Upper and lower parts of the Nordegg are seen holding distinctive characteristics in the ρ-Eρ domain, but they are indistinguishable in the ρ-μρ domain. A similar distinction can be seen for the Fernie and Monteny Formations.
An interesting obser vationIt often has been observed that if
we compare the computed Eρ curve from well-log data with the computed E curve, they look very similar. Fig-ure 6 shows one such display. We can crosscorrelate these two curves and study their similarity, which in this case, showed maximum correlation at zero lag. In an attempt to demon-strate this on real seismic data, we picked up a data set from the Mont-ney area in northeastern British Co-lumbia, Canada, which had long off-sets with angles of incidence as high as 49°. Figure 7 shows a set of gathers with angles overlaid on them. Figure 8 shows the density attribute comput-ed using the three-term AVO equa-tion. The upper Montney zone exhib-its lower values of density as expected and correlates well with the overlaid density curve.
The Eρ attribute was computed next using simultaneous inversion. Figure 9b shows a time slice from the Eρ volume within the upper Montney zone aver-aged over a 10-ms window. Because
both the density and the data sets were available, it was possible to derive a stand-alone Young’s modulus (E) volume. Figure 9a shows a time slice equivalent to the Eρ slice shown in Figure 9b. Notice that the two are very similar, confirming the fact that the E and Eρ attributes are very similar.
Usually, crossplots of E versus Poisson’s ratio are generated to pick out zones of low Poisson’s ratio and high Young’s modu-lus because those zones would exhibit higher brittleness. Figures 10a and 10b show crossplots of E and Eρ versus Poisson’s ratio, which look very similar. Even their back-projections on the ver-tical sections look very similar (Figures 10c and 10d), suggesting that engineering workflows based on templates of E versus Pois-son’s ratio can be modified slightly to work on templates of Eρ versus Poisson’s ratio.
A significant implication of this observation can be found in the determination of brittleness from seismic data for un-conventional reservoirs. For moderate-offset seismic data, we cannot accurately estimate E, but we can estimate Eρ. For long-offset data, in many cases, we can accurately estimate density, which can be used to compute E by itself. Barring the detailed information that we might see on the crossplots of Eρ versus Poisson’s ratio, such plots might contain the similar information as on crossplots of λρ versus μρ or of P-impedance versus S-impedance.
However, our primary customers are the engineers whose geomechanical training is in terms of E and Poisson’s ratio. It therefore would be more apt and important to use seismically derived attributes that are more understandable in terms of their utility and cross-disciplinary communication.
Figure 5. Back-projection of the points enclosed by the polygons picked on the (a) ρ versus μρ and (b) ρ versus Eρ crossplots. Because of better separation of clusters in the ρ versus Eρ crossplot space, their highlighted projections exhibit more resolution and clarity. Notice that the upper and lower parts of the Montney Formation are distinguishable in (b). The Ferni and Nordegg Formations also show variation within their own zones.
Figure 6. Display of log curves and derived curves E and Eρ for a broad zone of interest covering the lower and upper Montney Forma-tion in British Columbia, Canada. We notice that the E and Eρ curves are very similar.
940 T H E L E A D I N G E D G E May 2 01 5
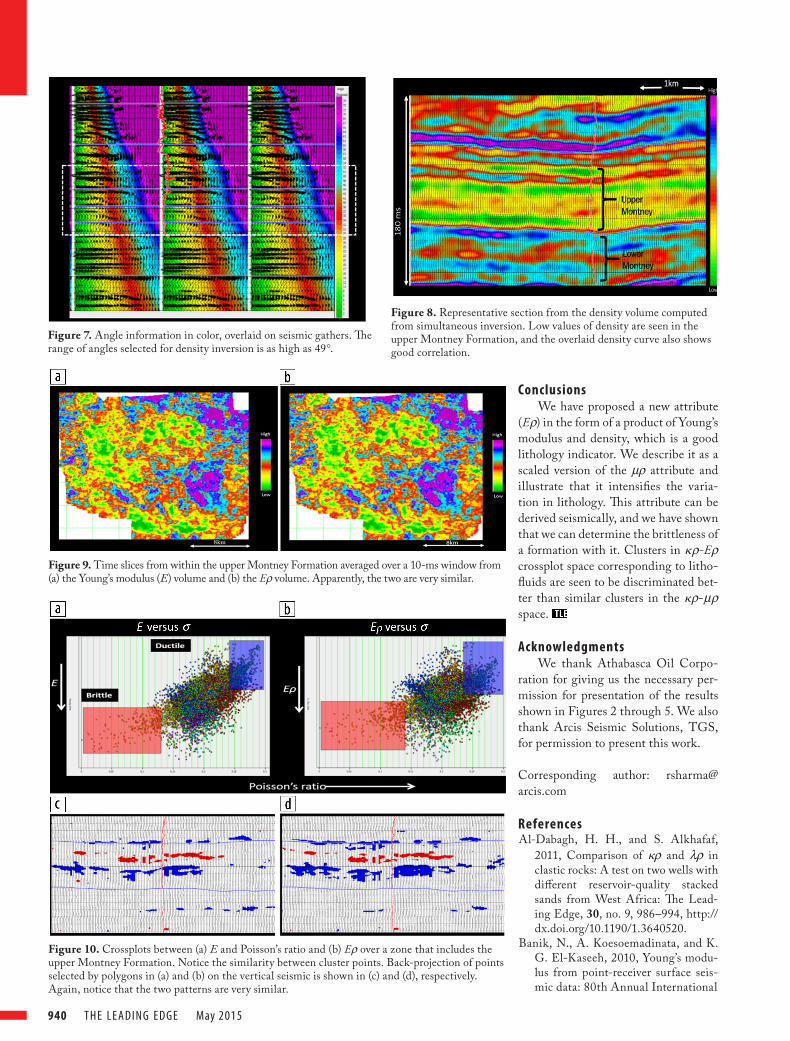
Figure 7. Angle information in color, overlaid on seismic gathers. The range of angles selected for density inversion is as high as 49°.
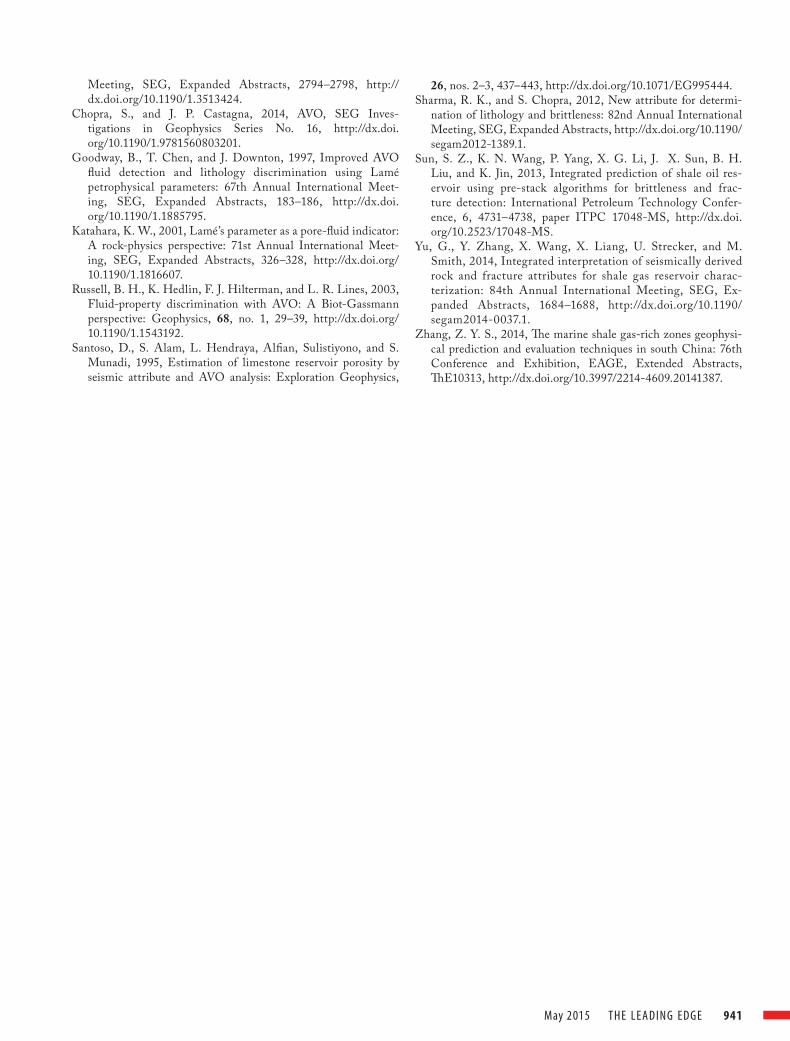
Figure 8. Representative section from the density volume computed from simultaneous inversion. Low values of density are seen in the upper Montney Formation, and the overlaid density curve also shows good correlation.
Figure 9. Time slices from within the upper Montney Formation averaged over a 10-ms window from (a) the Young’s modulus (E) volume and (b) the Eρ volume. Apparently, the two are very similar.
Figure 10. Crossplots between (a) E and Poisson’s ratio and (b) Eρ over a zone that includes the upper Montney Formation. Notice the similarity between cluster points. Back-projection of points selected by polygons in (a) and (b) on the vertical seismic is shown in (c) and (d), respectively. Again, notice that the two patterns are very similar.
ConclusionsWe have proposed a new attribute
(Eρ) in the form of a product of Young’s modulus and density, which is a good lithology indicator. We describe it as a scaled version of the μρ attribute and illustrate that it intensifies the varia-tion in lithology. This attribute can be derived seismically, and we have shown that we can determine the brittleness of a formation with it. Clusters in ρ-Eρ crossplot space corresponding to litho-fluids are seen to be discriminated bet-ter than similar clusters in the ρ-μρ space.
AcknowledgmentsWe thank Athabasca Oil Corpo-
ration for giving us the necessary per-mission for presentation of the results shown in Figures 2 through 5. We also thank Arcis Seismic Solutions, TGS, for permission to present this work.
Corresponding author: rsharma@ arcis.com
ReferencesAl-Dabagh, H. H., and S. Alkhafaf,
2011, Comparison of ρ and λρ in clastic rocks: A test on two wells with different reservoir-quality stacked sands from West Africa: The Lead-ing Edge, 30, no. 9, 986–994, http://dx.doi.org/10.1190/1.3640520.
Banik, N., A. Koesoemadinata, and K. G. El-Kaseeh, 2010, Young’s modu-lus from point-receiver surface seis-mic data: 80th Annual International
May 2 01 5 T H E L E A D I N G E D G E 941
Meeting, SEG, Expanded Abstracts, 2794–2798, http://dx.doi.org/10.1190/1.3513424.
Chopra, S., and J. P. Castagna, 2014, AVO, SEG Inves-tigations in Geophysics Series No. 16, http://dx.doi.org/10.1190/1.9781560803201.
Goodway, B., T. Chen, and J. Downton, 1997, Improved AVO fluid detection and lithology discrimination using Lamé petrophysical parameters: 67th Annual International Meet-ing, SEG, Expanded Abstracts, 183–186, http://dx.doi.org/10.1190/1.1885795.
Katahara, K. W., 2001, Lamé’s parameter as a pore-fluid indicator: A rock-physics perspective: 71st Annual International Meet-ing, SEG, Expanded Abstracts, 326–328, http://dx.doi.org/ 10.1190/1.1816607.
Russell, B. H., K. Hedlin, F. J. Hilterman, and L. R. Lines, 2003, Fluid-property discrimination with AVO: A Biot-Gassmann perspective: Geophysics, 68, no. 1, 29–39, http://dx.doi.org/ 10.1190/1.1543192.
Santoso, D., S. Alam, L. Hendraya, Alfian, Sulistiyono, and S. Munadi, 1995, Estimation of limestone reservoir porosity by seismic attribute and AVO analysis: Exploration Geophysics,
26, nos. 2–3, 437–443, http://dx.doi.org/10.1071/EG995444.Sharma, R. K., and S. Chopra, 2012, New attribute for determi-
nation of lithology and brittleness: 82nd Annual International Meeting, SEG, Expanded Abstracts, http://dx.doi.org/10.1190/segam2012-1389.1.
Sun, S. Z., K. N. Wang, P. Yang, X. G. Li, J. X. Sun, B. H. Liu, and K. Jin, 2013, Integrated prediction of shale oil res-ervoir using pre-stack algorithms for brittleness and frac-ture detection: International Petroleum Technology Confer-ence, 6, 4731–4738, paper ITPC 17048-MS, http://dx.doi.org/10.2523/17048-MS.
Yu, G., Y. Zhang, X. Wang, X. Liang, U. Strecker, and M. Smith, 2014, Integrated interpretation of seismically derived rock and fracture attributes for shale gas reservoir charac-terization: 84th Annual International Meeting, SEG, Ex-panded Abstracts, 1684–1688, http://dx.doi.org/10.1190/segam2014-0037.1.
Zhang, Z. Y. S., 2014, The marine shale gas-rich zones geophysi-cal prediction and evaluation techniques in south China: 76th Conference and Exhibition, EAGE, Extended Abstracts, ThE10313, http://dx.doi.org/10.3997/2214-4609.20141387.


![ô ª û à £ ® ä ß ò Ó ô Ë ä û ³ ª ߧلأس - Copy.pdf · 4 W a } n R s p R t U S j R ¾ n } R W S z R ] Q S Y R ¾ p | J M ¾ n R: W j R g e R X R g S](https://static.fdocument.org/doc/165x107/5e24339976f311410401008a/-copypdf-4-w-a.jpg)