Hypothesis Testing and Inferential Statisticswebs.wofford.edu/boppkl/courseFiles/Expmtl/PPTslides/Ch...
25
Hypothesis Testing and Inferential Statistics Chapter 7
Transcript of Hypothesis Testing and Inferential Statisticswebs.wofford.edu/boppkl/courseFiles/Expmtl/PPTslides/Ch...
Hypothesis Testing and
Inferential Statistics
Chapter 7
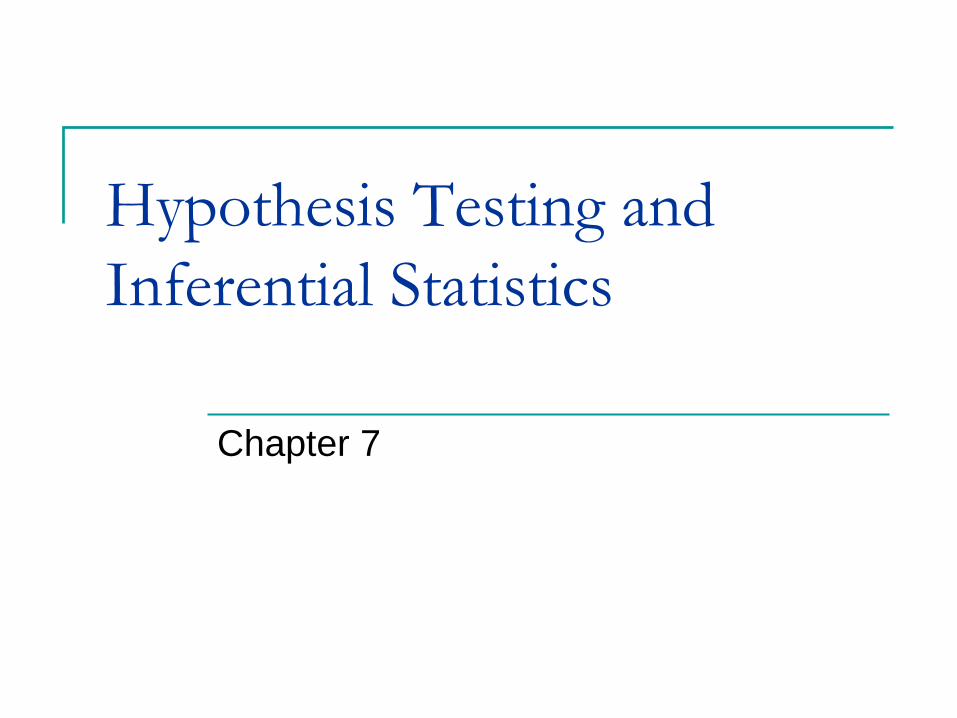
Ethnic differences in clinical dissociation
Dissociative Experiences Scale (DES)
Psychological defense mechanism for victims of traumatic events
Detach themselves from trauma so loose consciousness, memory, identity or perception
Overall population M = ~18.5
Douglas (2003)
Examine minorities’ scores on the DES
Hypothesis: minorities’ scores higher (more dissociations) compared to population scores
Hypothesis Testing
State hypothesis about a population
Predict characteristics of sample (mean, SE)
Obtain sample data
Compare sample data with prediction
Does “treatment” have an effect?
Make decision based on probability of getting
that result given a particular population
Write conclusion
Hypothesis Test
2 hypotheses
Null hypothesis = H0: µ0 = µ1
No difference between groups
No effect of IV
Alternative hypothesis = Ha or H1: µ0 ≠ µ1 Treatment or condition has effect
Direction of H1: increase, decrease or both
Criteria… is it “significant”? Set alpha level or probability
Usually = .05
Result not likely due to chance
Testing the Null Hypothesis
“Presumed innocent until proven guilty”
We do NOT test the research (alt) hypothesis directly; we test the null hypothesis
Stats better at showing something is not true; so try to falsify the null hypothesis
Assume that differences are due to normal variability expected in a population
The more variability in population the harder to reject null hyp
Use statistics to reject null hypothesis or not Is difference too great to happen by chance?
Since can’t test alternative hypothesis directly Can never PROVE that it is correct
Can only find support for it
Hypothesis testing
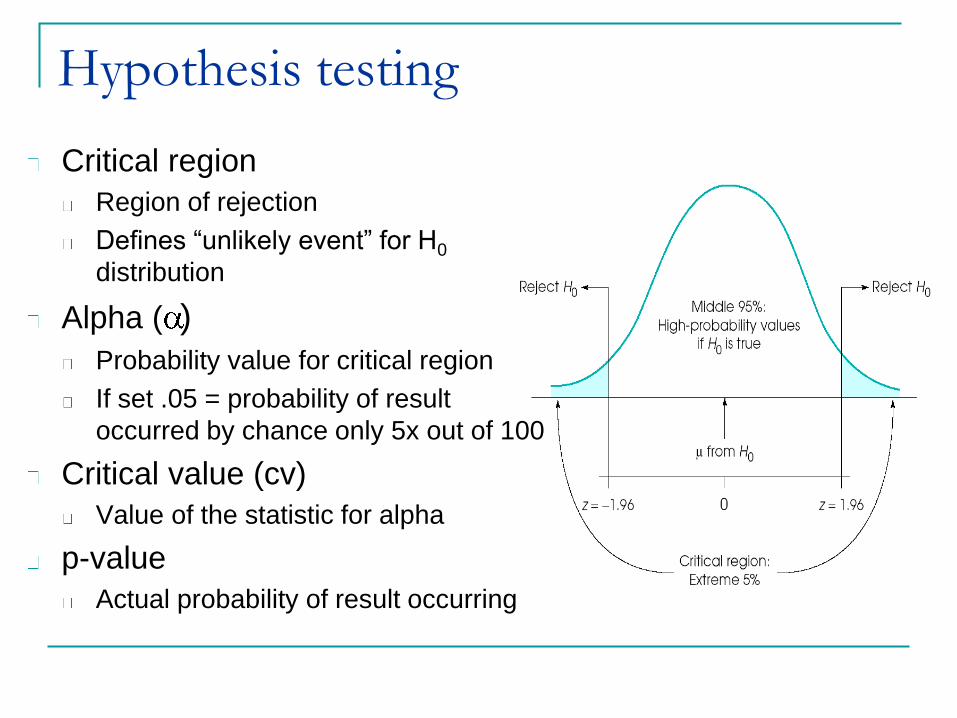
Critical region
Region of rejection
Defines “unlikely event” for H0
distribution
Alpha ( )
Probability value for critical region
If set .05 = probability of result
occurred by chance only 5x out of 100
Critical value (cv)
Value of the statistic for alpha
p-value
Actual probability of result occurring
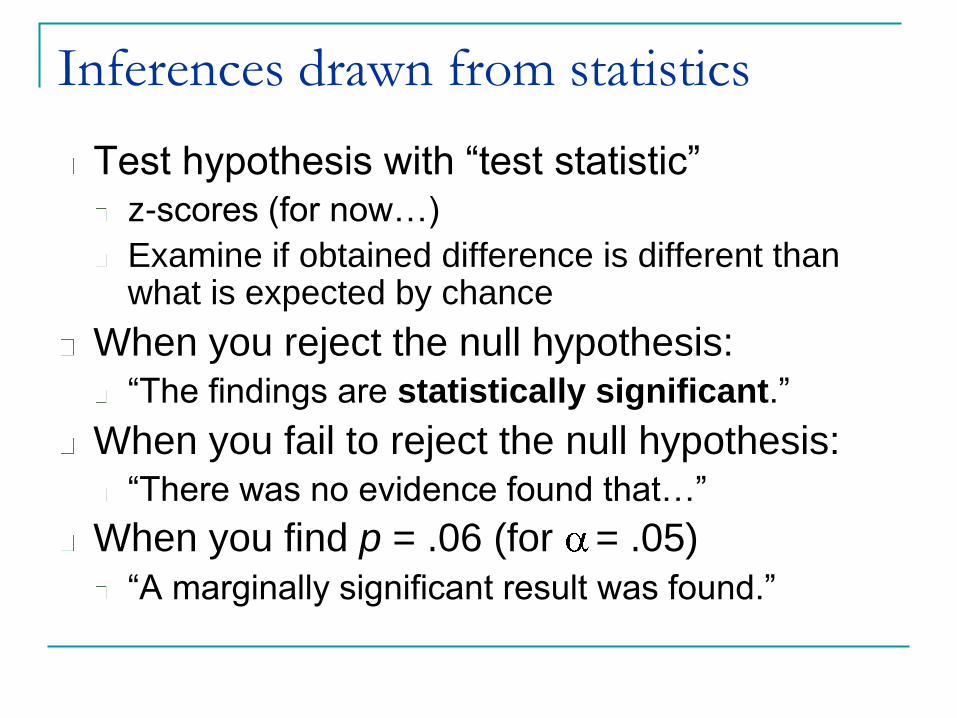
Inferences drawn from statistics
Test hypothesis with “test statistic”
z-scores (for now…)
Examine if obtained difference is different than what is expected by chance
When you reject the null hypothesis:
“The findings are statistically significant.”
When you fail to reject the null hypothesis:
“There was no evidence found that…”
When you find p = .06 (for = .05)
“A marginally significant result was found.”
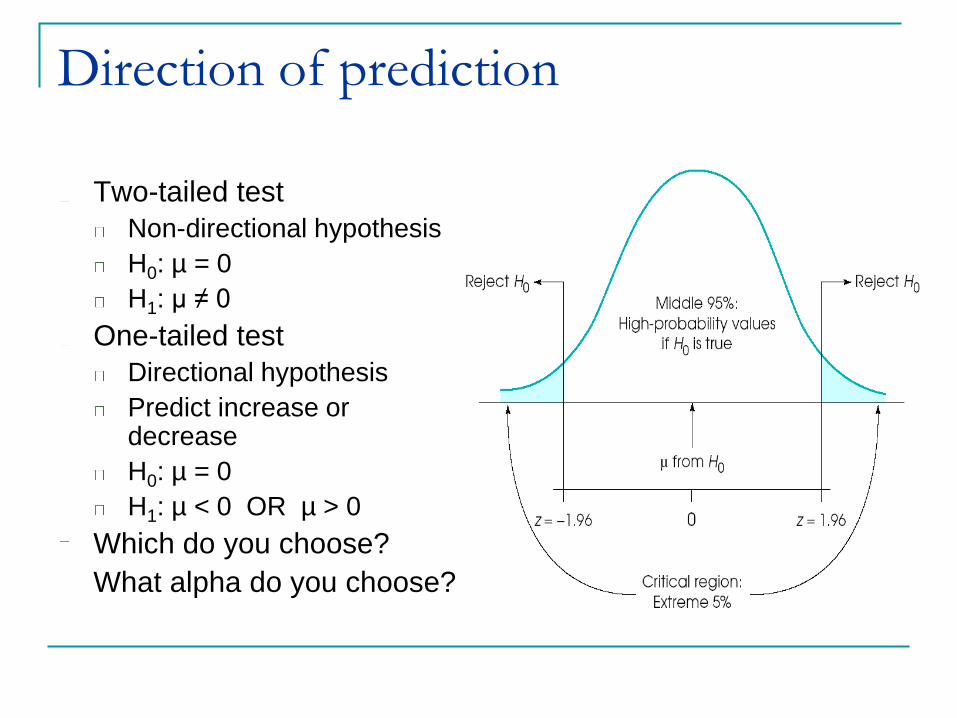
Direction of prediction
Two-tailed test
Non-directional hypothesis
H0: µ = 0
H1: µ ≠ 0
One-tailed test
Directional hypothesis
Predict increase or decrease
H0: µ = 0
H1: µ < 0 OR µ > 0
Which do you choose?
What alpha do you choose?
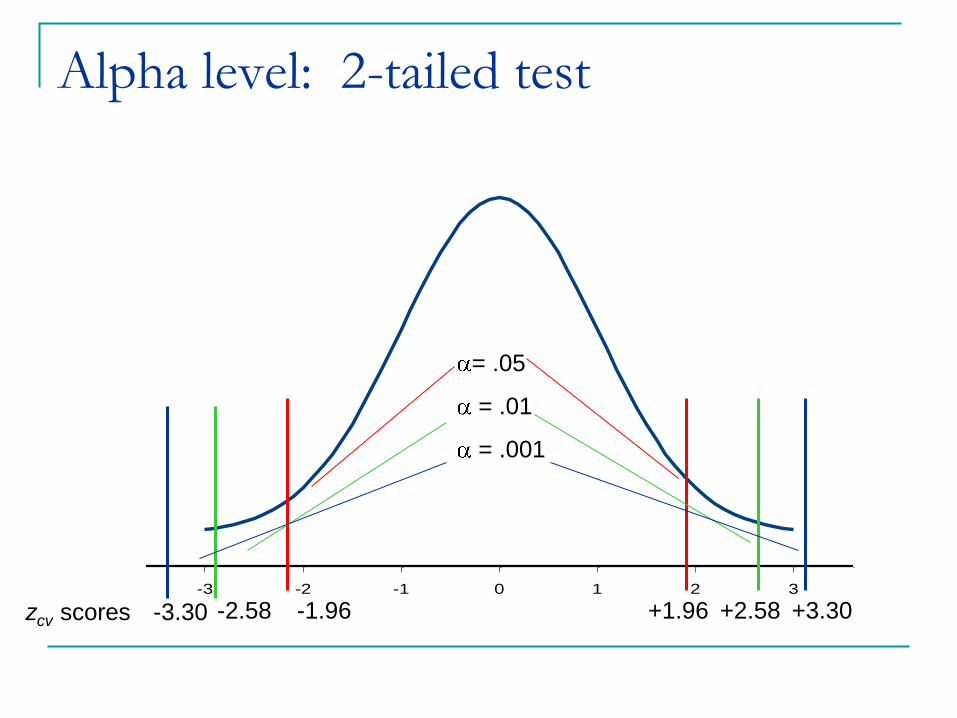
Alpha level: 2-tailed test
-3 -2 -1 0 1 2 3
-3.30 +3.30 +2.58 +1.96 -1.96 -2.58
= .05
= .01
= .001
zcv scores
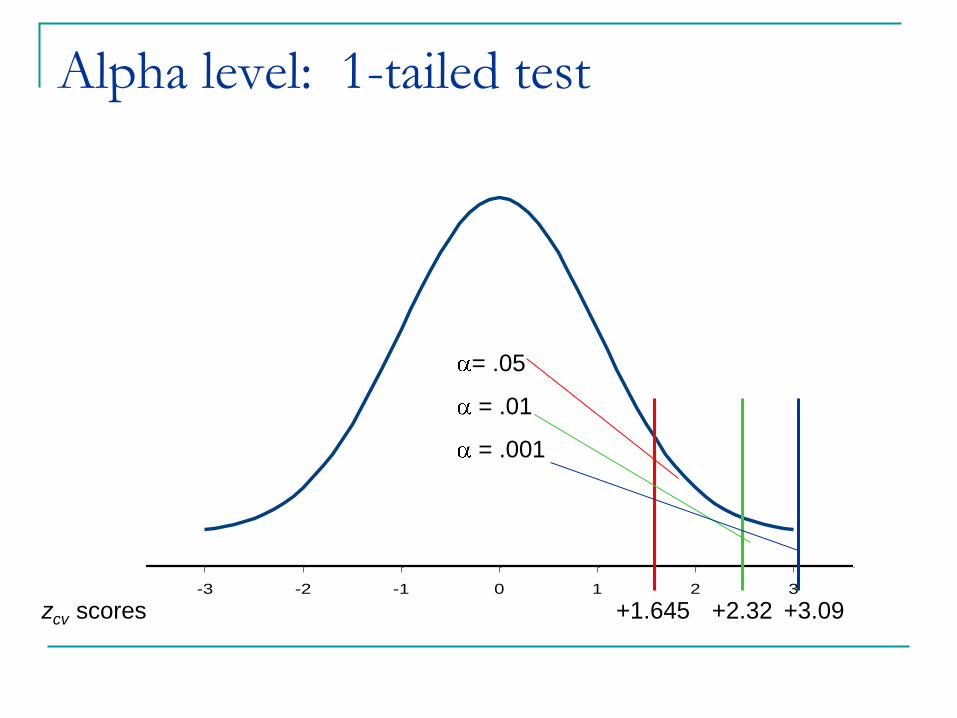
Alpha level: 1-tailed test
-3 -2 -1 0 1 2 3
+3.09 +2.32 +1.645
= .05
= .01
= .001
zcv scores
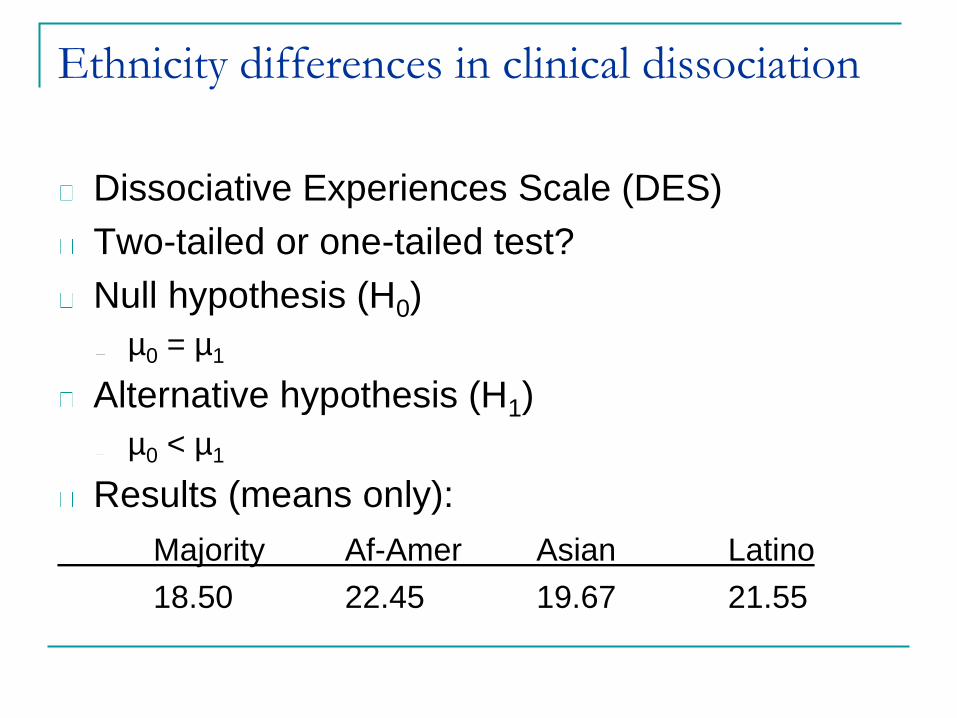
Ethnicity differences in clinical dissociation
Dissociative Experiences Scale (DES)
Two-tailed or one-tailed test?
Null hypothesis (H0)
µ0 = µ1
Alternative hypothesis (H1)
µ0 < µ1
Results (means only):
Majority Af-Amer Asian Latino
18.50 22.45 19.67 21.55
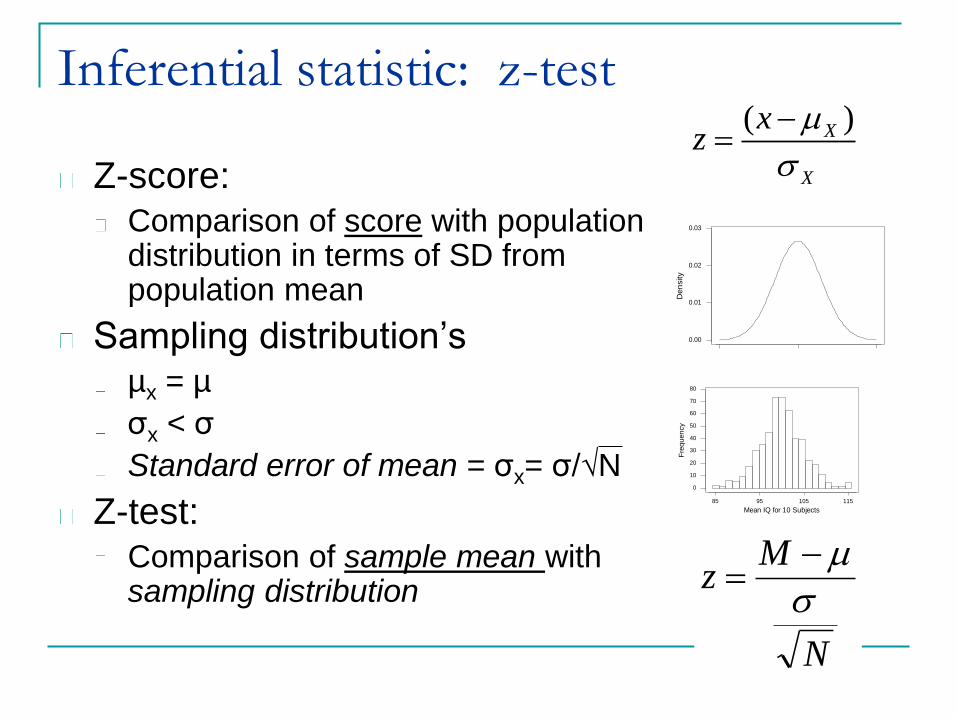
Inferential statistic: z-test
Z-score: Comparison of score with population distribution in terms of SD from population mean
Sampling distribution’s µx = µ
σx < σ
Standard error of mean = σx= σ/√N
Z-test: Comparison of sample mean with sampling distribution
( )X
X
xz
50 100 150
0.00
0.01
0.02
0.03
IQ
Den
sity
IQ for 1 Subject
1151059585
80
70
60
50
40
30
20
10
0
Mean IQ for 10 Subjects
Fre
qu
en
cy
N
Mz
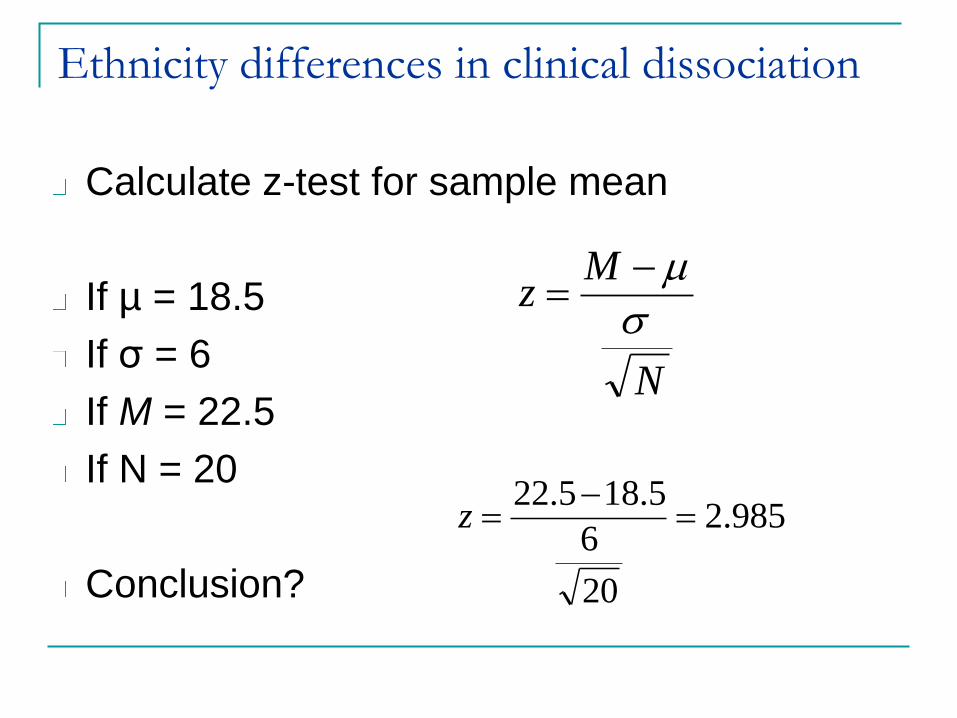
Ethnicity differences in clinical dissociation
Calculate z-test for sample mean
If µ = 18.5
If σ = 6
If M = 22.5
If N = 20
Conclusion?
N
Mz
985.2
20
6
5.185.22
z

Alpha level: 1-tailed test
-3 -2 -1 0 1 2 3
+3.09 +2.32 +1.645
= .05
= .01
= .001
zcv scores
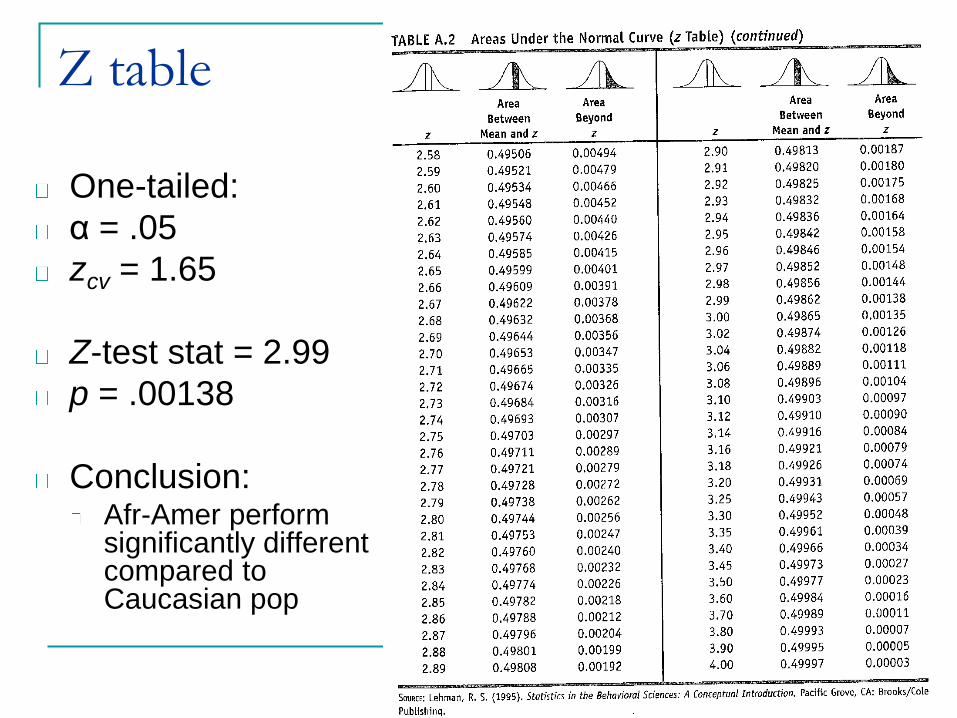
Z table
One-tailed:
α = .05
zcv = 1.65
Z-test stat = 2.99
p = .00138
Conclusion: Afr-Amer perform significantly different compared to Caucasian pop
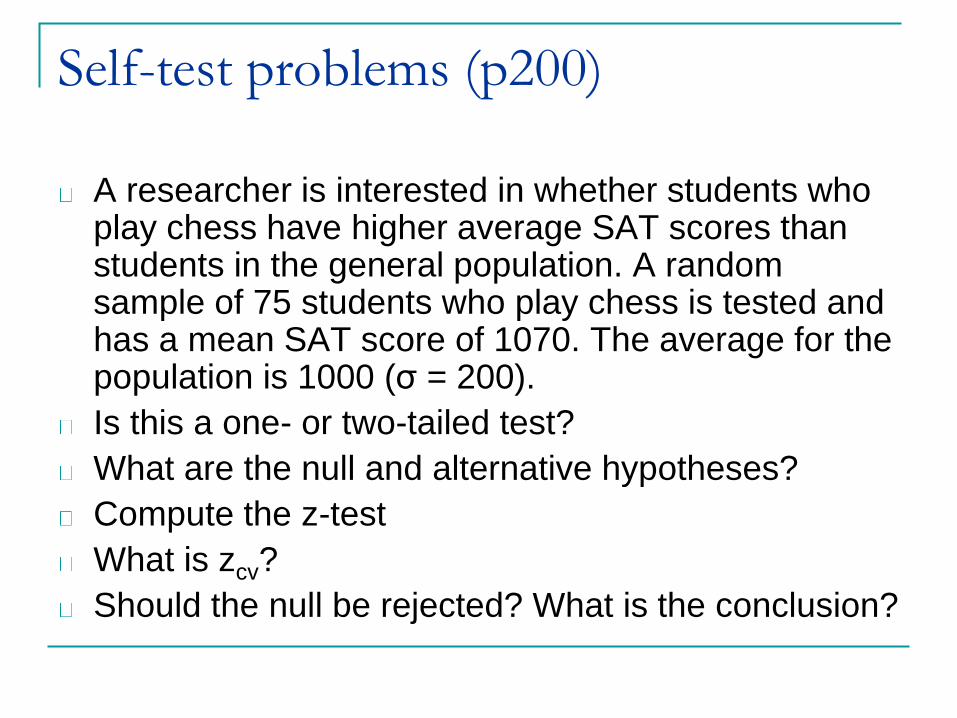
Self-test problems (p200)
A researcher is interested in whether students who play chess have higher average SAT scores than students in the general population. A random sample of 75 students who play chess is tested and has a mean SAT score of 1070. The average for the population is 1000 (σ = 200).
Is this a one- or two-tailed test?
What are the null and alternative hypotheses?
Compute the z-test
What is zcv?
Should the null be rejected? What is the conclusion?
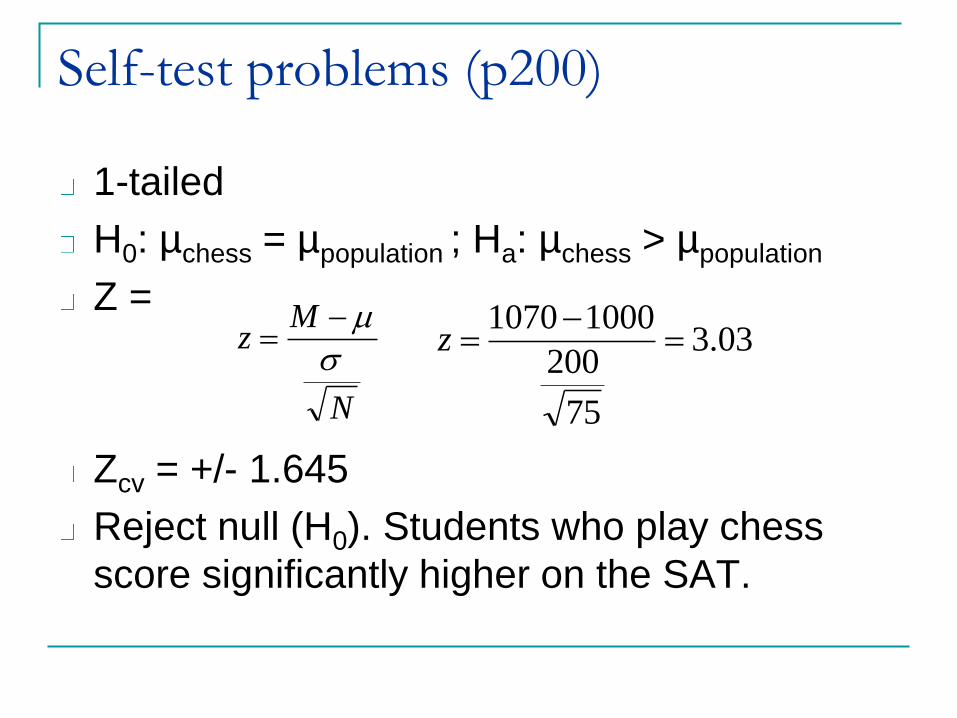
Self-test problems (p200)
1-tailed
H0: µchess = µpopulation ; Ha: µchess > µpopulation
Z =
Zcv = +/- 1.645
Reject null (H0). Students who play chess
score significantly higher on the SAT.
N
Mz
03.3
75
200
10001070
z
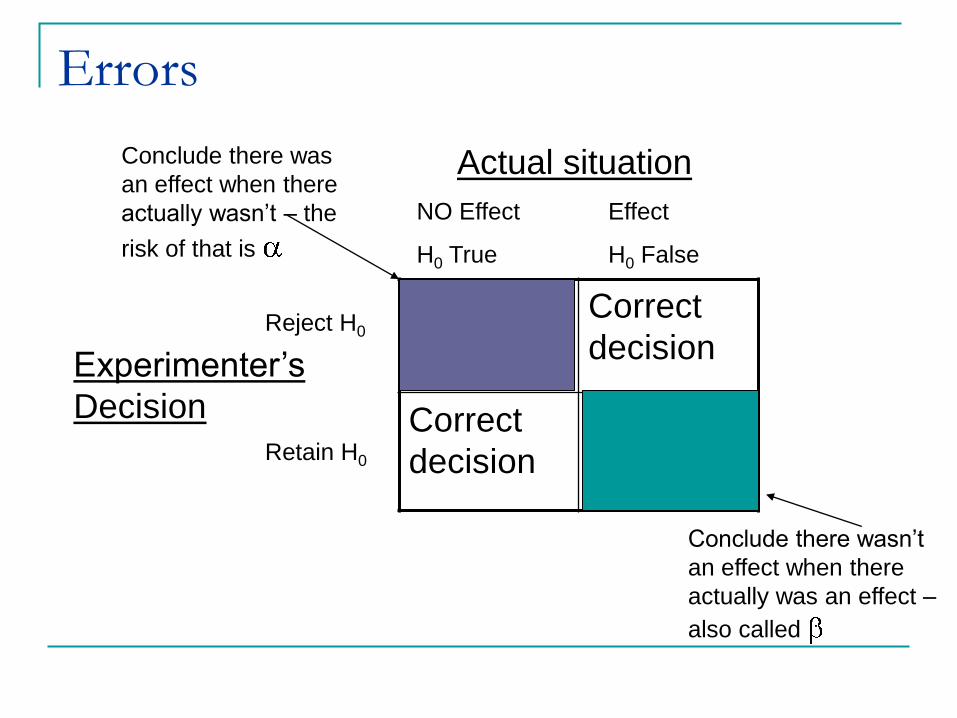
Errors
Type I
error
Correct
decision
Correct
decision
Type II
error
Actual situation
NO Effect Effect
H0 True H0 False
Reject H0
Retain H0
Experimenter’s
Decision
Conclude there was
an effect when there
actually wasn’t – the
risk of that is
Conclude there wasn’t
an effect when there
actually was an effect –
also called
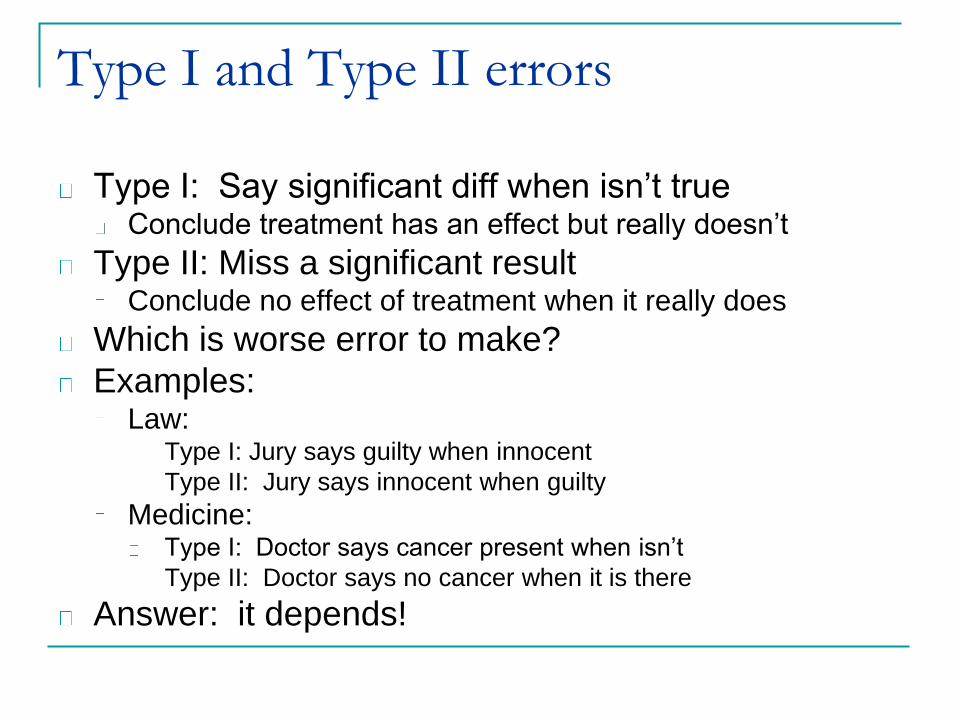
Type I and Type II errors
Type I: Say significant diff when isn’t true Conclude treatment has an effect but really doesn’t
Type II: Miss a significant result Conclude no effect of treatment when it really does
Which is worse error to make?
Examples: Law:
Type I: Jury says guilty when innocent
Type II: Jury says innocent when guilty
Medicine: Type I: Doctor says cancer present when isn’t
Type II: Doctor says no cancer when it is there
Answer: it depends!
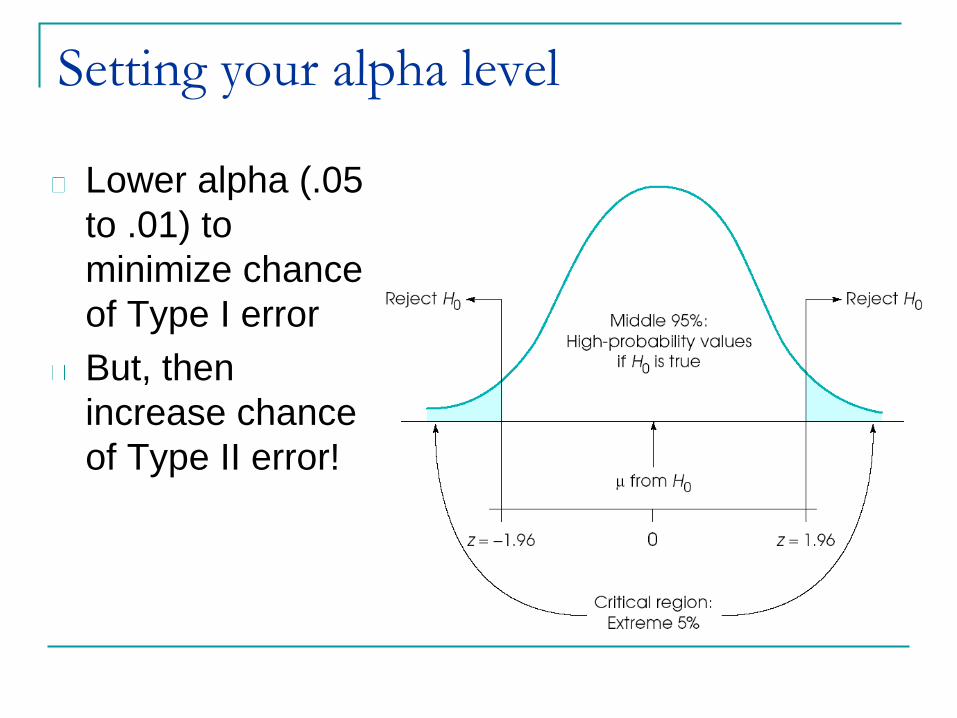
Setting your alpha level
Lower alpha (.05
to .01) to
minimize chance
of Type I error
But, then
increase chance
of Type II error!
Concerns with Alpha
All-or-none decision
Reject or accept null hypothesis
Alpha (criteria) is set arbitrarily
Null hypothesis logic is artificial
No such thing as “no effect”
Doesn’t give size of effect
p-value is chance of occurrence
Can not say “very significant”!
Sample size changes p-value
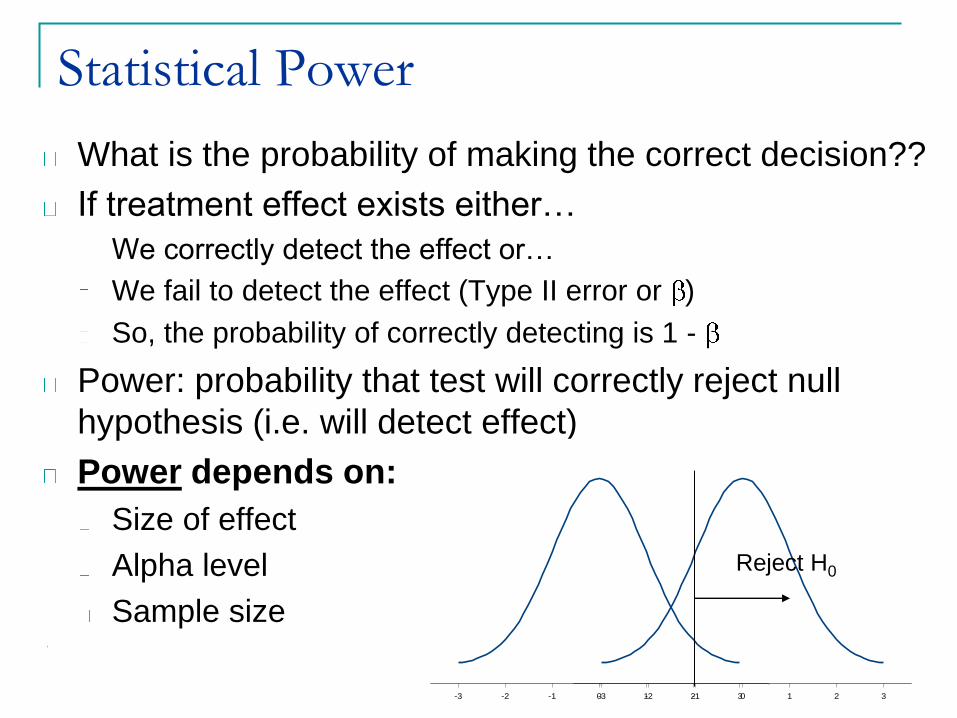
Statistical Power
What is the probability of making the correct decision??
If treatment effect exists either…
We correctly detect the effect or…
We fail to detect the effect (Type II error or )
So, the probability of correctly detecting is 1 -
Power: probability that test will correctly reject null
hypothesis (i.e. will detect effect)
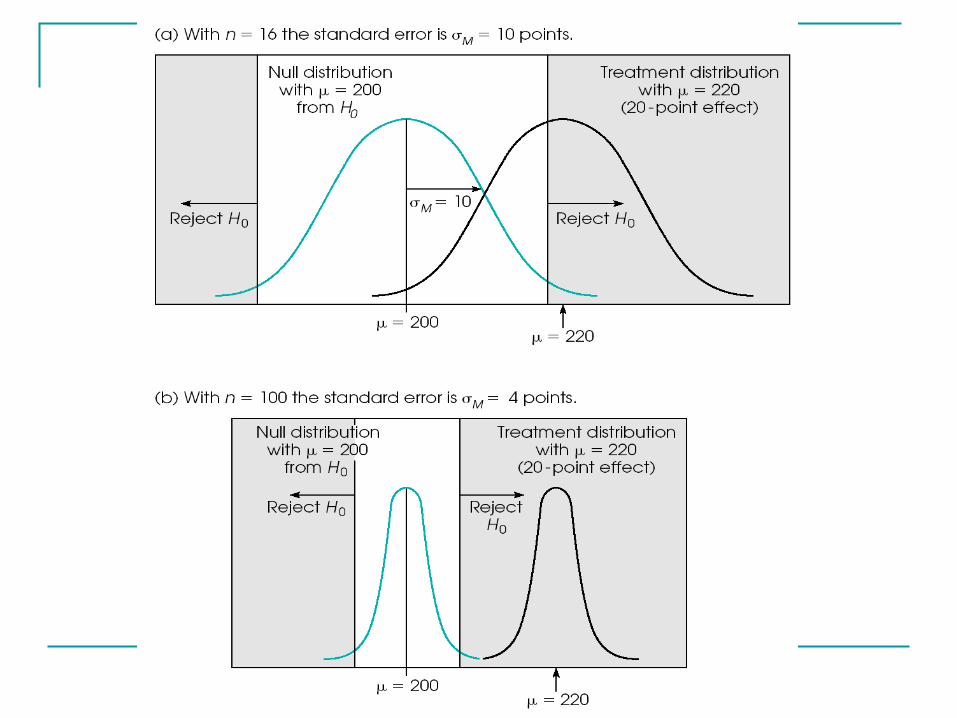
Power depends on:
Size of effect
Alpha level
Sample size
-3 -2 -1 0 1 2 3-3 -2 -1 0 1 2 3
Reject H0
Concerns with z-test
Make many assumptions!
Must know population mean and deviation
Must have a normal distribution
Must have a sample size where N < 30
If don’t know above info or can’t make
assumptions need to use other statistics!