
HyCal Physics Calibration – Non-Linearity · HyCal Physics Calibration – Non-Linearity θ (deg)...
18
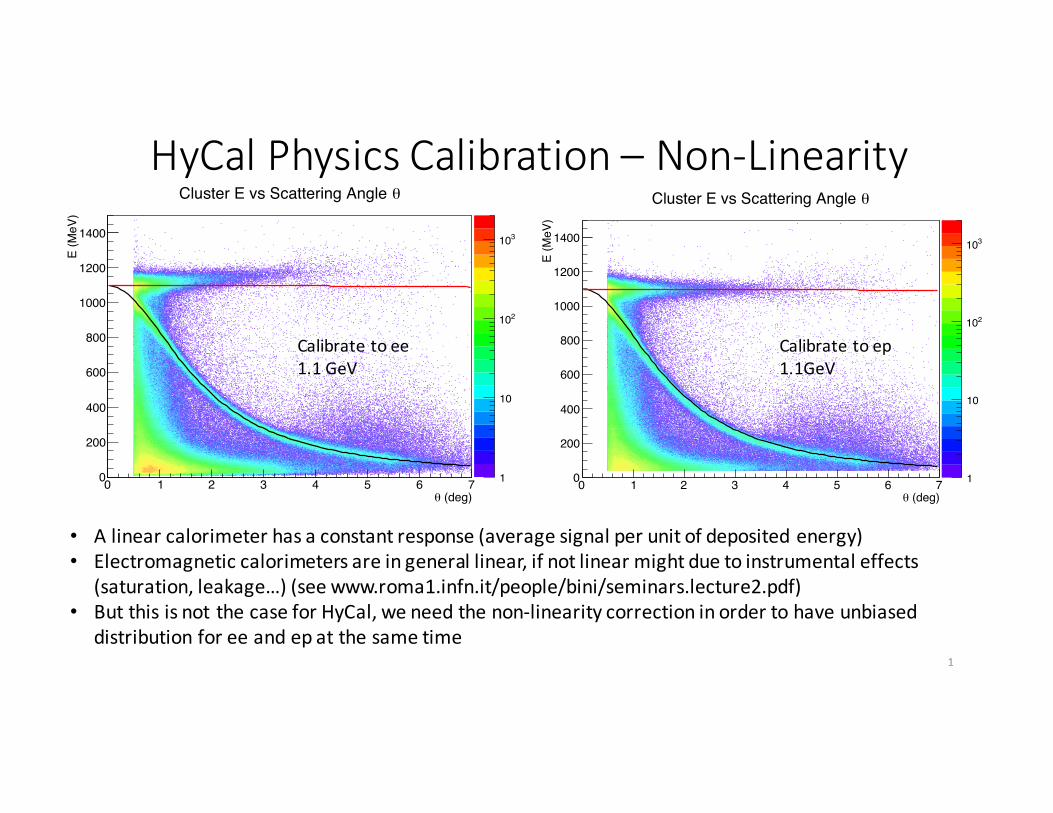
HyCal Physics Calibration – Non-Linearity (deg) θ 0 1 2 3 4 5 6 7 E (MeV) 0 200 400 600 800 1000 1200 1400 1 10 2 10 3 10 θ Cluster E vs Scattering Angle Calibrate to ee 1.1 GeV • A linear calorimeter has a constant response (average signal per unit of deposited energy) • Electromagnetic calorimeters are in general linear, if not linear might due to instrumental effects (saturation, leakage…) (see www.roma1.infn.it/people/bini/seminars.lecture2.pdf) • But this is not the case for HyCal, we need the non-linearity correction in order to have unbiased distribution for ee and ep at the same time 1 (deg) θ 0 1 2 3 4 5 6 7 E (MeV) 0 200 400 600 800 1000 1200 1400 1 10 2 10 3 10 θ Cluster E vs Scattering Angle Calibrate to ep 1.1GeV
Transcript of HyCal Physics Calibration – Non-Linearity · HyCal Physics Calibration – Non-Linearity θ (deg)...
HyCalPhysicsCalibration– Non-Linearity
(deg)θ0 1 2 3 4 5 6 7
E (M
eV)
0
200
400
600
800
1000
1200
1400
1
10
210
310
θCluster E vs Scattering Angle
Calibratetoee1.1GeV
• Alinearcalorimeterhasaconstantresponse(averagesignalperunitofdepositedenergy)• Electromagneticcalorimetersareingenerallinear,ifnotlinearmightduetoinstrumentaleffects
(saturation,leakage…)(seewww.roma1.infn.it/people/bini/seminars.lecture2.pdf)• ButthisisnotthecaseforHyCal,weneedthenon-linearitycorrectioninordertohaveunbiased
distributionforee andepatthesametime1
(deg)θ0 1 2 3 4 5 6 7
E (M
eV)
0
200
400
600
800
1000
1200
1400
1
10
210
310
θCluster E vs Scattering Angle
Calibratetoep1.1GeV
0 200 400 600 800 1000 1200 14000
50
100
150
200
250
300
350
400
310×theta_0.650000_0.750000
0 200 400 600 800 1000 1200 14000
50
100
150
200
250
300
310×theta_0.750000_0.850000
0 200 400 600 800 1000 1200 14000
20
40
60
80
100
120
140
160
180
310×theta_0.850000_0.950000
0 200 400 600 800 1000 1200 14000
20
40
60
80
100
120
140
310×theta_0.950000_1.050000
0 200 400 600 800 1000 1200 14000
20
40
60
80
100
310×theta_1.050000_1.150000
0 200 400 600 800 1000 1200 14000
10000
20000
30000
40000
50000
60000
70000
80000
theta_1.150000_1.250000
0 200 400 600 800 1000 1200 14000
10000
20000
30000
40000
50000
60000
theta_1.250000_1.350000
0 200 400 600 800 1000 1200 14000
10000
20000
30000
40000
50000
60000
theta_1.350000_1.450000
0 200 400 600 800 1000 1200 14000
10000
20000
30000
40000
50000
theta_1.450000_1.550000
0 200 400 600 800 1000 1200 14000
10000
20000
30000
40000
50000
theta_1.550000_1.650000
0 200 400 600 800 1000 1200 14000
5000
10000
15000
20000
25000
30000
35000
40000
45000
theta_1.650000_1.750000
0 200 400 600 800 1000 1200 14000
5000
10000
15000
20000
25000
30000
35000
40000
45000
theta_1.750000_1.850000
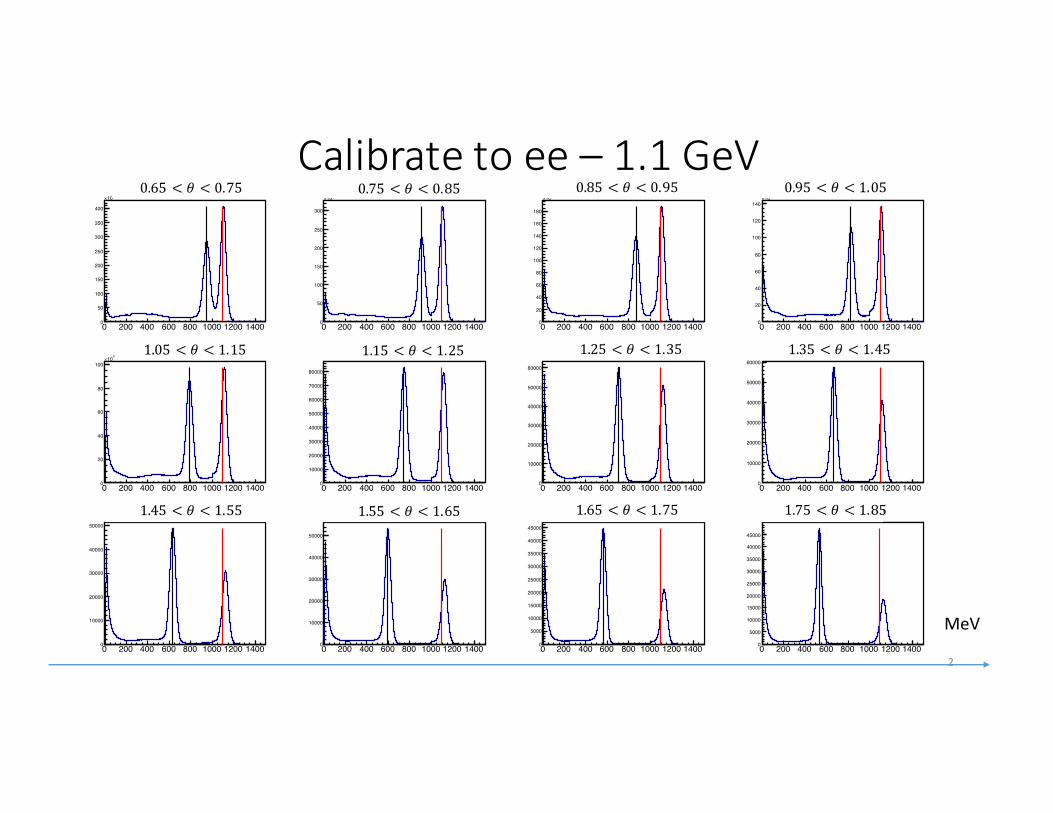
Calibratetoee – 1.1GeV0.65 < 𝜃 < 0.75 0.75 < 𝜃 < 0.85 0.85 < 𝜃 < 0.95 0.95 < 𝜃 < 1.05
1.05 < 𝜃 < 1.15 1.15 < 𝜃 < 1.25 1.25 < 𝜃 < 1.35 1.35 < 𝜃 < 1.45
1.45 < 𝜃 < 1.55 1.55 < 𝜃 < 1.65 1.65 < 𝜃 < 1.75 1.75 < 𝜃 < 1.85
MeV
2
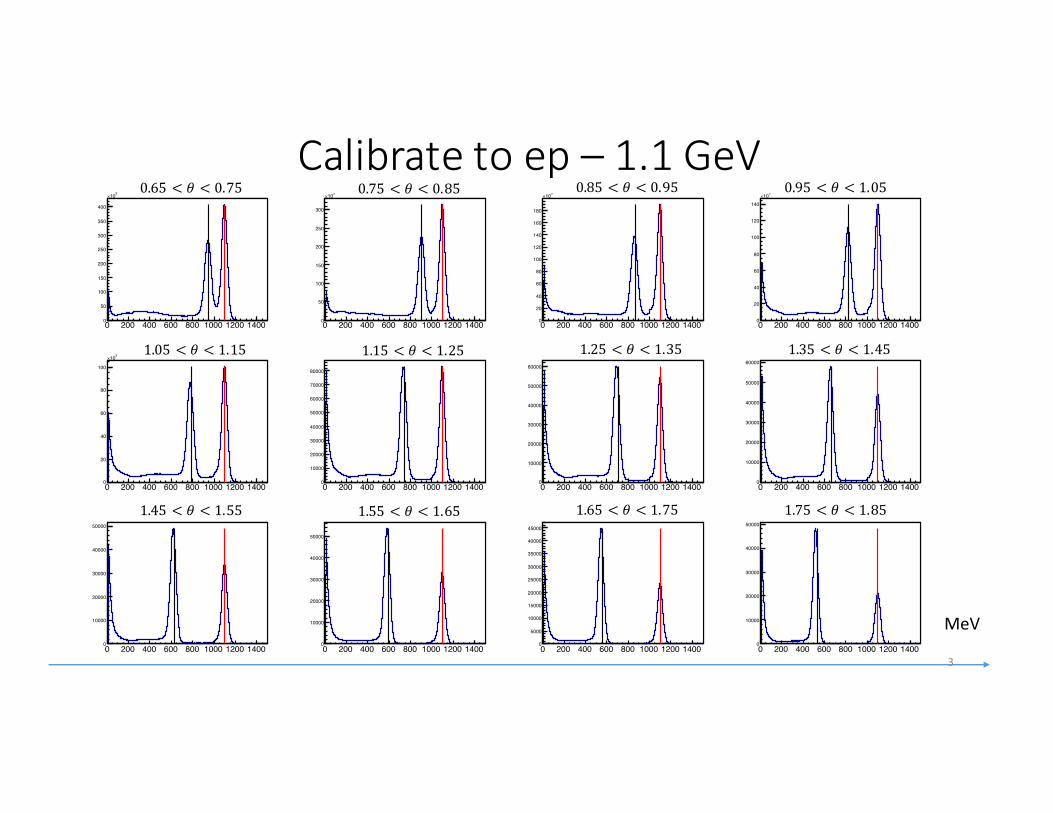
Calibratetoep– 1.1GeV
0 200 400 600 800 1000 1200 14000
50
100
150
200
250
300
350
400
310×
theta_0.650000_0.750000
0 200 400 600 800 1000 1200 14000
50
100
150
200
250
300
310×
theta_0.750000_0.850000
0 200 400 600 800 1000 1200 14000
20
40
60
80
100
120
140
160
180
310×
theta_0.850000_0.950000
0 200 400 600 800 1000 1200 14000
20
40
60
80
100
120
140
310×
theta_0.950000_1.050000
0 200 400 600 800 1000 1200 14000
20
40
60
80
100
310×
theta_1.050000_1.150000
0 200 400 600 800 1000 1200 14000
10000
20000
30000
40000
50000
60000
70000
80000
theta_1.150000_1.250000
0 200 400 600 800 1000 1200 14000
10000
20000
30000
40000
50000
60000
theta_1.250000_1.350000
0 200 400 600 800 1000 1200 14000
10000
20000
30000
40000
50000
60000
theta_1.350000_1.450000
0 200 400 600 800 1000 1200 14000
10000
20000
30000
40000
50000
theta_1.450000_1.550000
0 200 400 600 800 1000 1200 14000
10000
20000
30000
40000
50000
theta_1.550000_1.650000
0 200 400 600 800 1000 1200 14000
5000
10000
15000
20000
25000
30000
35000
40000
45000
theta_1.650000_1.750000
0 200 400 600 800 1000 1200 14000
10000
20000
30000
40000
50000
theta_1.750000_1.850000
0.65 < 𝜃 < 0.75 0.75 < 𝜃 < 0.85 0.85 < 𝜃 < 0.95 0.95 < 𝜃 < 1.05
1.05 < 𝜃 < 1.15 1.15 < 𝜃 < 1.25 1.25 < 𝜃 < 1.35 1.35 < 𝜃 < 1.45
1.45 < 𝜃 < 1.55 1.55 < 𝜃 < 1.65 1.65 < 𝜃 < 1.75 1.75 < 𝜃 < 1.85
MeV
3
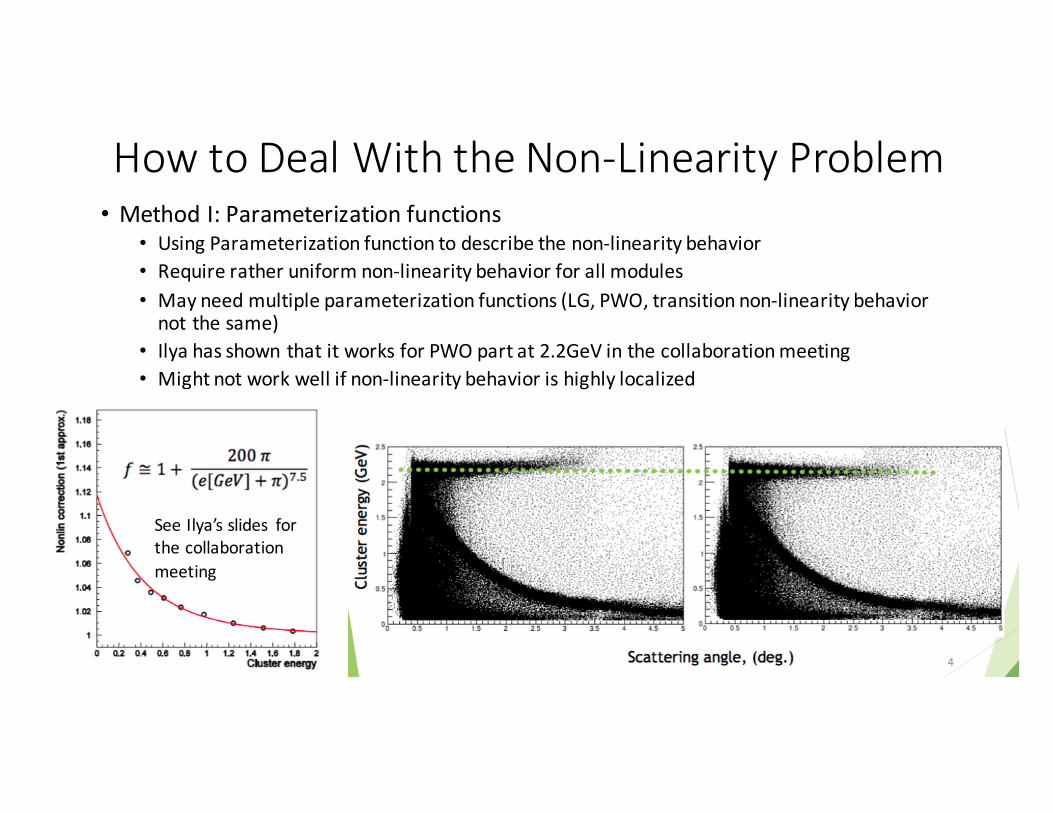
HowtoDealWiththeNon-LinearityProblem• MethodI:Parameterizationfunctions
• UsingParameterizationfunctiontodescribethenon-linearitybehavior• Requireratheruniformnon-linearitybehaviorforallmodules• Mayneedmultipleparameterizationfunctions(LG,PWO,transitionnon-linearitybehaviornotthesame)
• Ilya hasshownthatitworksforPWOpartat2.2GeVinthecollaborationmeeting• Mightnotworkwellifnon-linearitybehaviorishighlylocalized
4
SeeIlya’s slides forthecollaborationmeeting
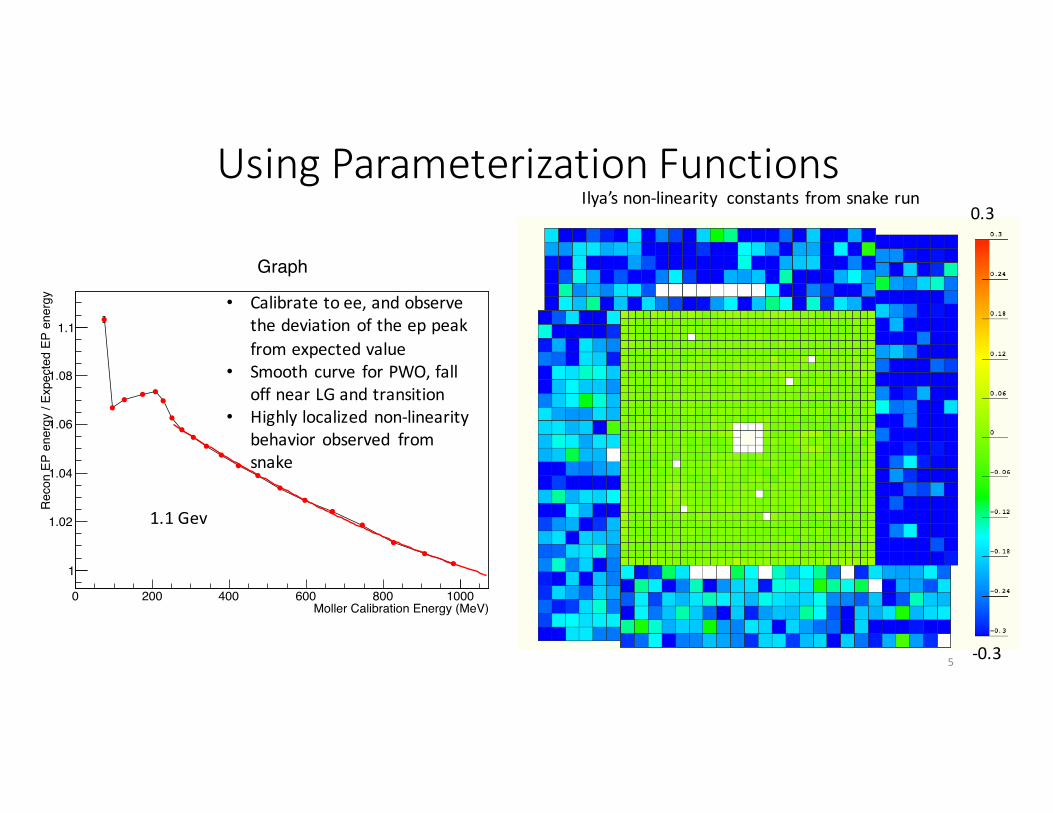
UsingParameterizationFunctions
5
Moller Calibration Energy (MeV)0 200 400 600 800 1000
Rec
on E
P en
ergy
/ Ex
pect
ed E
P en
ergy
1
1.02
1.04
1.06
1.08
1.1
Graph
0.3
-0.3
Ilya’s non-linearity constants fromsnakerun
• Calibratetoee,andobservethedeviationoftheeppeakfromexpectedvalue
• Smooth curve forPWO,falloffnearLGandtransition
• Highlylocalizednon-linearitybehavior observed fromsnake
1.1Gev
• MethodII:Obtainnon-linearityconstantmodulebymodule• Foreachmodule,obtaintwocalibrationconstants,onefromepandtheotherfromee• Similartowhatwedidwiththesnakerun,foreachmodule:
• Ecali isthecalibrationenergythatweusedtocalibratethemodule,Erecon isthereconstructedenergyonthismodule,alphaisthenon-linearityconstant
• Forphysicscalibration,weonlyhavetwopointsforeachmodule,onefromee andtheotherfromep
• Oneofthetwopointsneedtobeusedasthecalibrationenergy,sowearebasicallysolvingequation,notevenfitting
• Thisdoesn’tworkifthemoduleismissingoneofthetwopoints(happenquiteoftennearedgeandcorner)
• Currently,Ihavetwosetsofcalibrationconstantsforrun1288~1345,eachafter5iterations
HowtoDealWiththeNon-LinearityProblem
𝐸/011 =𝐸34506
1 + 𝛼(𝐸34506 − 𝐸/;<=)
6
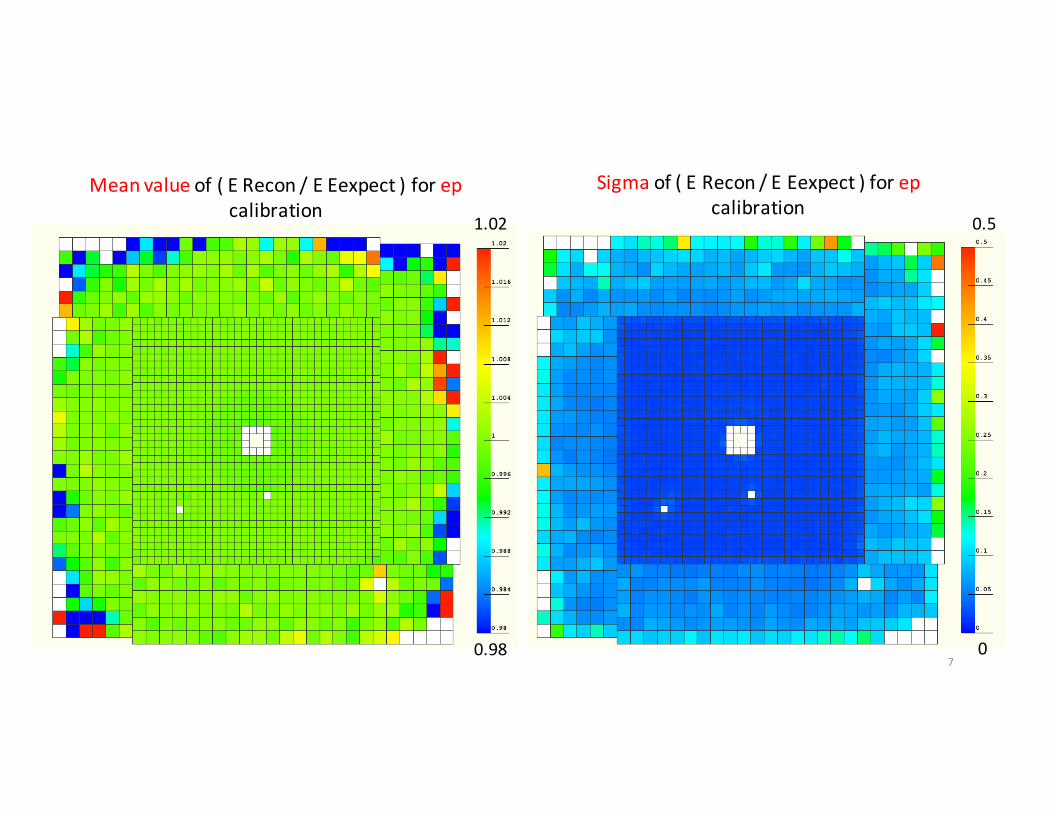
7
1.02
0.98
Meanvalueof(ERecon/EEexpect )forepcalibration
0
Sigmaof(ERecon/EEexpect )forepcalibration
0.5
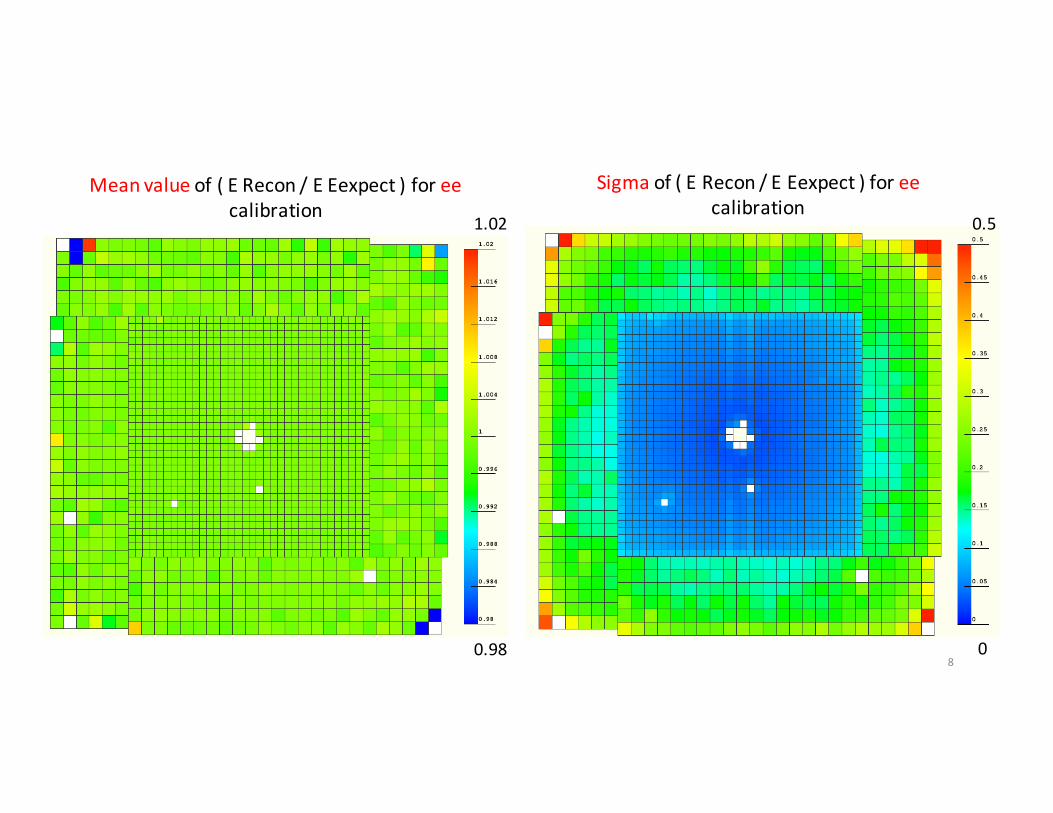
8
1.02
0.98
Meanvalueof(ERecon/EEexpect )foreecalibration
0
Sigmaof(ERecon/EEexpect )foreecalibration
0.5
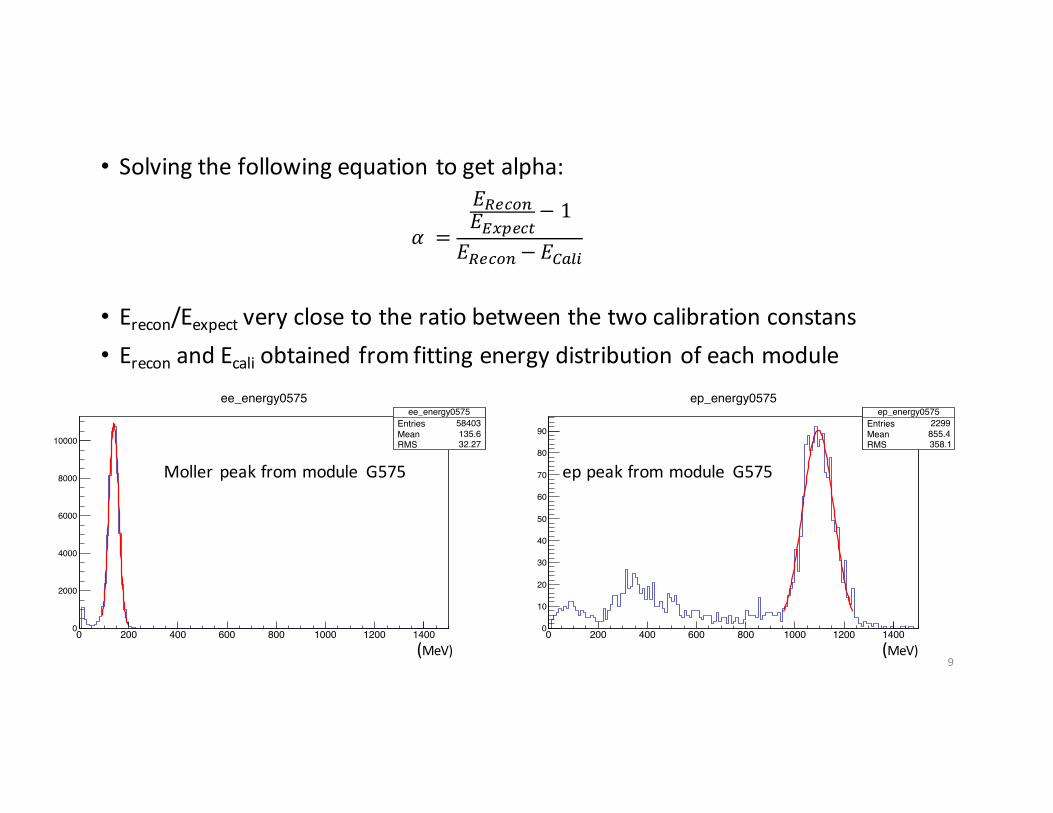
• Solvingthefollowingequationtogetalpha:
• Erecon/Eexpect veryclosetotheratiobetweenthetwocalibrationconstans• Erecon andEcali obtainedfromfittingenergydistributionofeachmodule
9
𝛼 =
𝐸34506𝐸@AB45C
− 1
𝐸34506 − 𝐸/;<=
ee_energy0575Entries 58403Mean 135.6RMS 32.27
0 200 400 600 800 1000 1200 14000
2000
4000
6000
8000
10000
ee_energy0575Entries 58403Mean 135.6RMS 32.27
ee_energy0575ep_energy0575
Entries 2299Mean 855.4RMS 358.1
0 200 400 600 800 1000 1200 14000
10
20
30
40
50
60
70
80
90
ep_energy0575Entries 2299Mean 855.4RMS 358.1
ep_energy0575
(MeV) (MeV)
Moller peakfrommodule G575 eppeakfrommodule G575
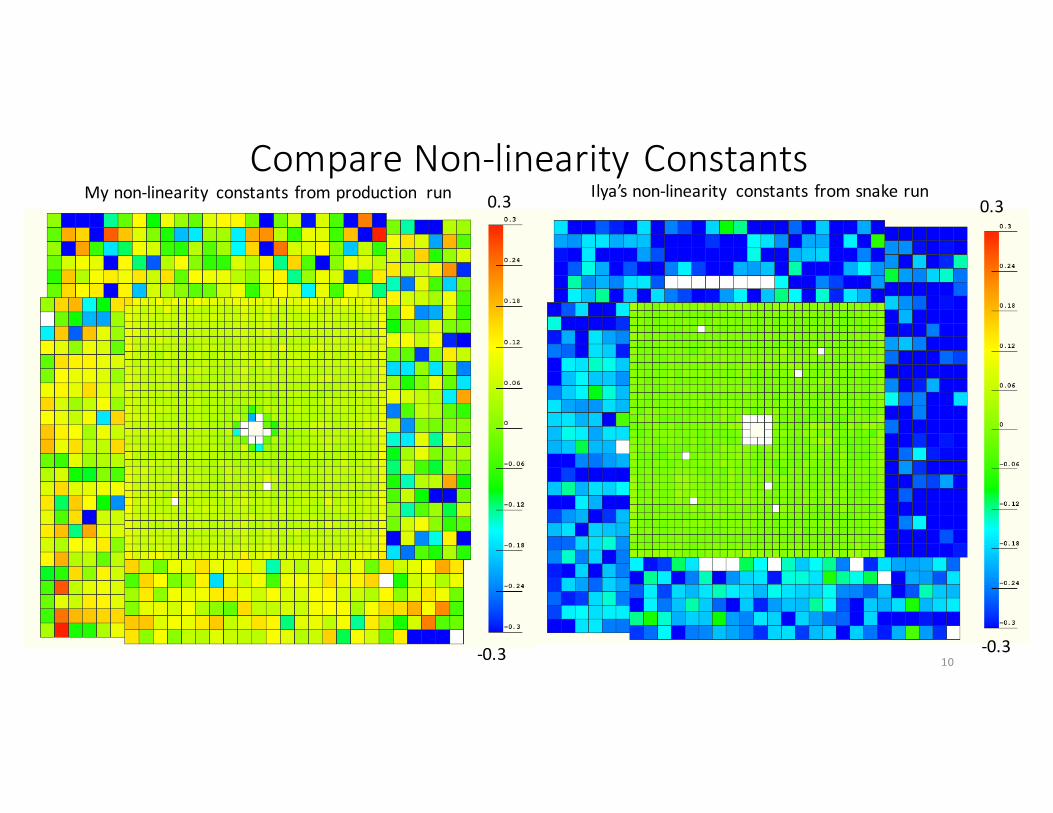
CompareNon-linearityConstants
10
0.3 0.3
-0.3-0.3
Mynon-linearity constants fromproduction run Ilya’s non-linearity constants fromsnakerun
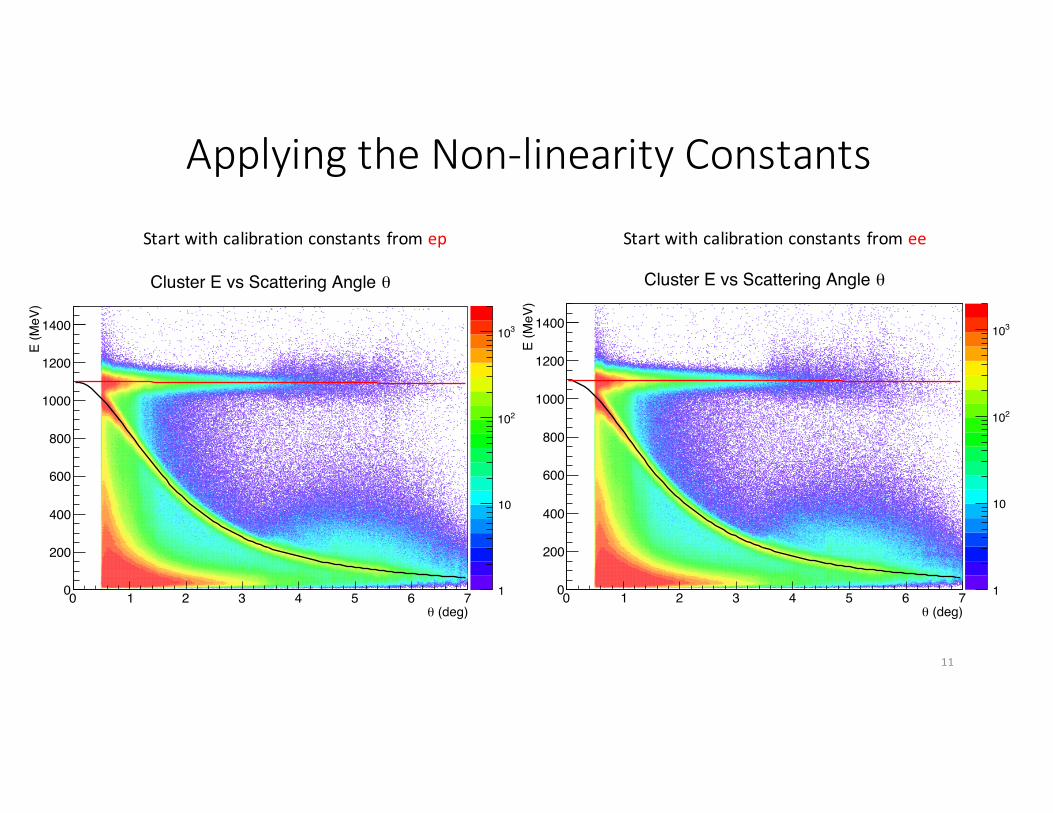
ApplyingtheNon-linearityConstants
11
(deg)θ0 1 2 3 4 5 6 7
E (M
eV)
0
200
400
600
800
1000
1200
1400
1
10
210
310
θCluster E vs Scattering Angle
Startwithcalibrationconstants fromep
(deg)θ0 1 2 3 4 5 6 7
E (M
eV)
0
200
400
600
800
1000
1200
1400
1
10
210
310
θCluster E vs Scattering Angle
Startwithcalibrationconstants fromee
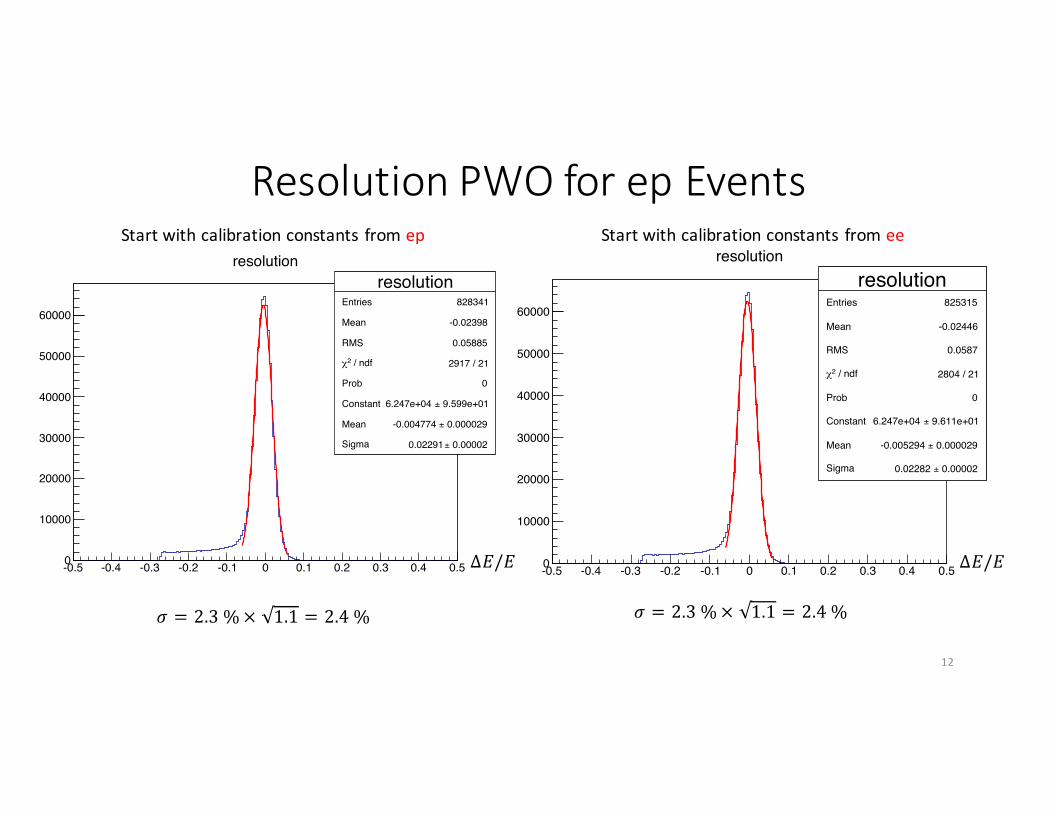
ResolutionPWOforepEvents
12
resolutionEntries 828341
Mean -0.02398
RMS 0.05885
/ ndf 2χ 2917 / 21
Prob 0
Constant 9.599e+01± 6.247e+04
Mean 0.000029± -0.004774
Sigma 0.00002± 0.02291
-0.5 -0.4 -0.3 -0.2 -0.1 0 0.1 0.2 0.3 0.4 0.50
10000
20000
30000
40000
50000
60000
resolutionEntries 828341
Mean -0.02398
RMS 0.05885
/ ndf 2χ 2917 / 21
Prob 0
Constant 9.599e+01± 6.247e+04
Mean 0.000029± -0.004774
Sigma 0.00002± 0.02291
resolutionresolution
Entries 825315
Mean -0.02446
RMS 0.0587
/ ndf 2χ 2804 / 21
Prob 0
Constant 9.611e+01± 6.247e+04
Mean 0.000029± -0.005294
Sigma 0.00002± 0.02282
-0.5 -0.4 -0.3 -0.2 -0.1 0 0.1 0.2 0.3 0.4 0.50
10000
20000
30000
40000
50000
60000
resolutionEntries 825315
Mean -0.02446
RMS 0.0587
/ ndf 2χ 2804 / 21
Prob 0
Constant 9.611e+01± 6.247e+04
Mean 0.000029± -0.005294
Sigma 0.00002± 0.02282
resolution
𝜎 = 2.3%× 1.1 = 2.4% 𝜎 = 2.3%× 1.1 = 2.4%
Startwithcalibrationconstants fromep Startwithcalibrationconstants fromee
∆𝐸/𝐸∆𝐸/𝐸
13
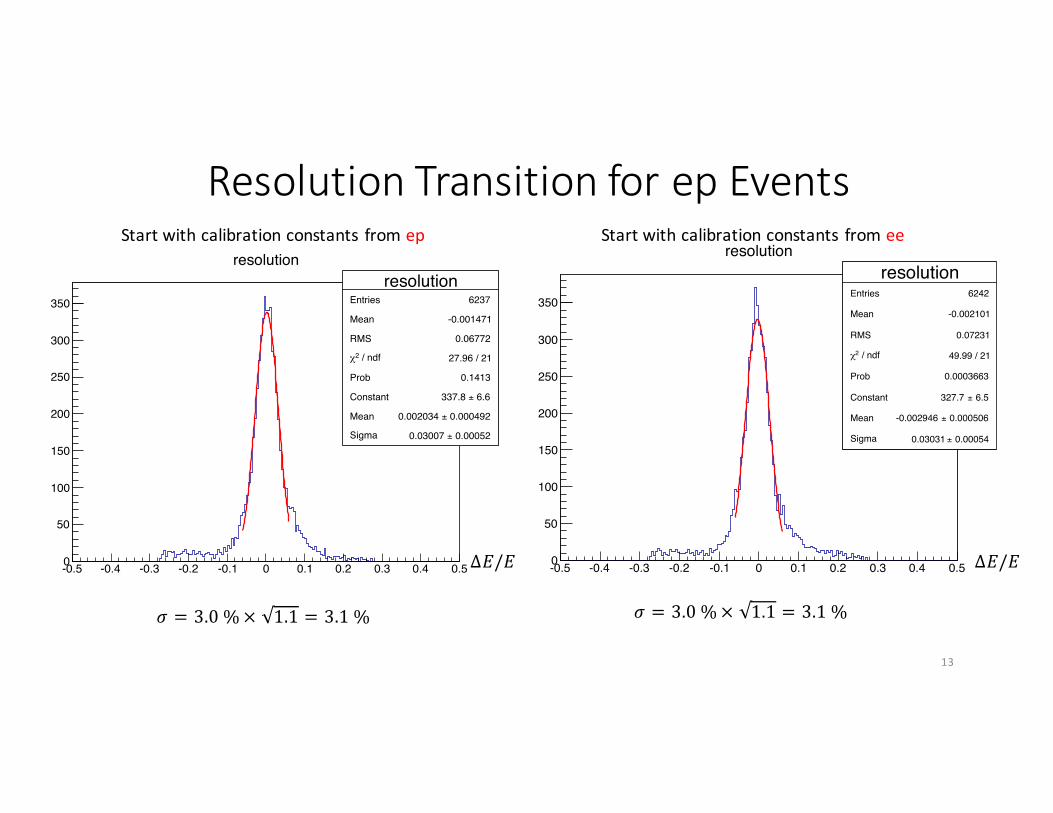
ResolutionTransitionforepEvents
resolutionEntries 6237
Mean -0.001471
RMS 0.06772
/ ndf 2χ 27.96 / 21
Prob 0.1413
Constant 6.6± 337.8
Mean 0.000492± 0.002034
Sigma 0.00052± 0.03007
-0.5 -0.4 -0.3 -0.2 -0.1 0 0.1 0.2 0.3 0.4 0.50
50
100
150
200
250
300
350resolution
Entries 6237
Mean -0.001471
RMS 0.06772
/ ndf 2χ 27.96 / 21
Prob 0.1413
Constant 6.6± 337.8
Mean 0.000492± 0.002034
Sigma 0.00052± 0.03007
resolutionresolution
Entries 6242
Mean -0.002101
RMS 0.07231
/ ndf 2χ 49.99 / 21
Prob 0.0003663
Constant 6.5± 327.7
Mean 0.000506± -0.002946
Sigma 0.00054± 0.03031
-0.5 -0.4 -0.3 -0.2 -0.1 0 0.1 0.2 0.3 0.4 0.50
50
100
150
200
250
300
350
resolutionEntries 6242
Mean -0.002101
RMS 0.07231
/ ndf 2χ 49.99 / 21
Prob 0.0003663
Constant 6.5± 327.7
Mean 0.000506± -0.002946
Sigma 0.00054± 0.03031
resolution
𝜎 = 3.0%× 1.1 = 3.1% 𝜎 = 3.0%× 1.1 = 3.1%
Startwithcalibrationconstants fromep Startwithcalibrationconstants fromee
∆𝐸/𝐸∆𝐸/𝐸
14
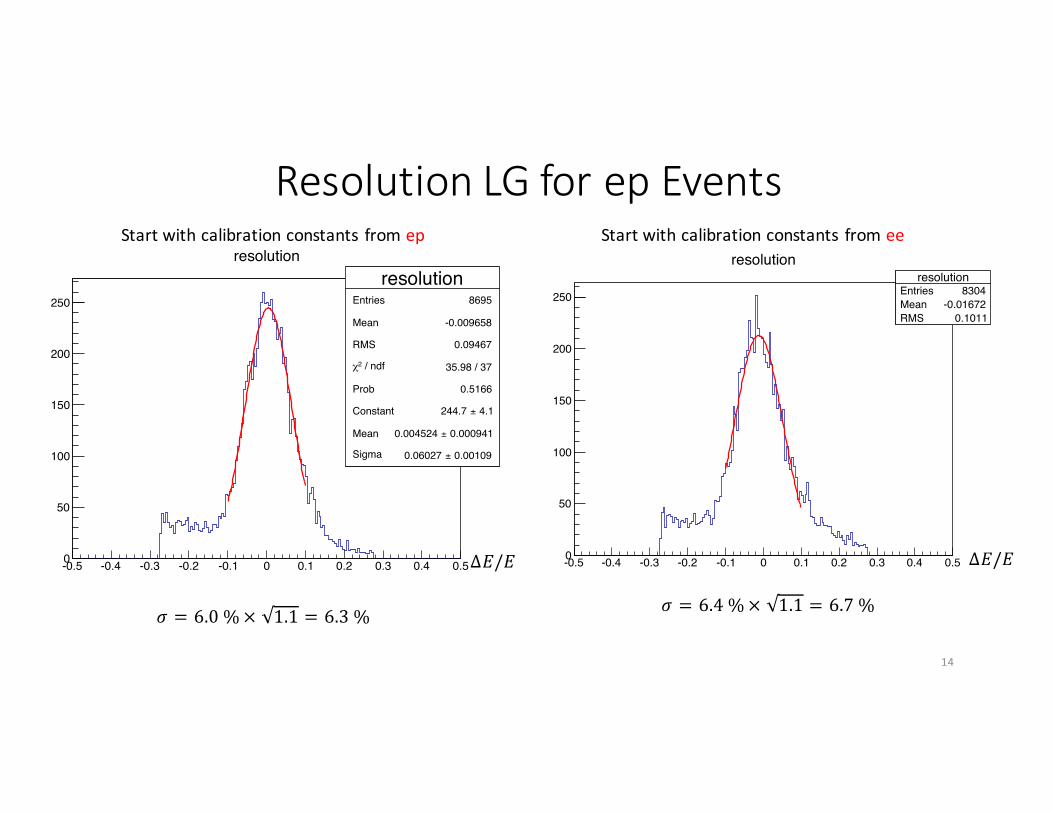
ResolutionLGforepEvents
resolutionEntries 8695
Mean -0.009658
RMS 0.09467
/ ndf 2χ 35.98 / 37
Prob 0.5166
Constant 4.1± 244.7
Mean 0.000941± 0.004524
Sigma 0.00109± 0.06027
-0.5 -0.4 -0.3 -0.2 -0.1 0 0.1 0.2 0.3 0.4 0.50
50
100
150
200
250
resolutionEntries 8695
Mean -0.009658
RMS 0.09467
/ ndf 2χ 35.98 / 37
Prob 0.5166
Constant 4.1± 244.7
Mean 0.000941± 0.004524
Sigma 0.00109± 0.06027
resolutionresolution
Entries 8304Mean -0.01672RMS 0.1011
-0.5 -0.4 -0.3 -0.2 -0.1 0 0.1 0.2 0.3 0.4 0.50
50
100
150
200
250resolution
Entries 8304Mean -0.01672RMS 0.1011
resolution
𝜎 = 6.0%× 1.1 = 6.3% 𝜎 = 6.4%× 1.1 = 6.7%
Startwithcalibrationconstants fromep Startwithcalibrationconstants fromee
∆𝐸/𝐸∆𝐸/𝐸
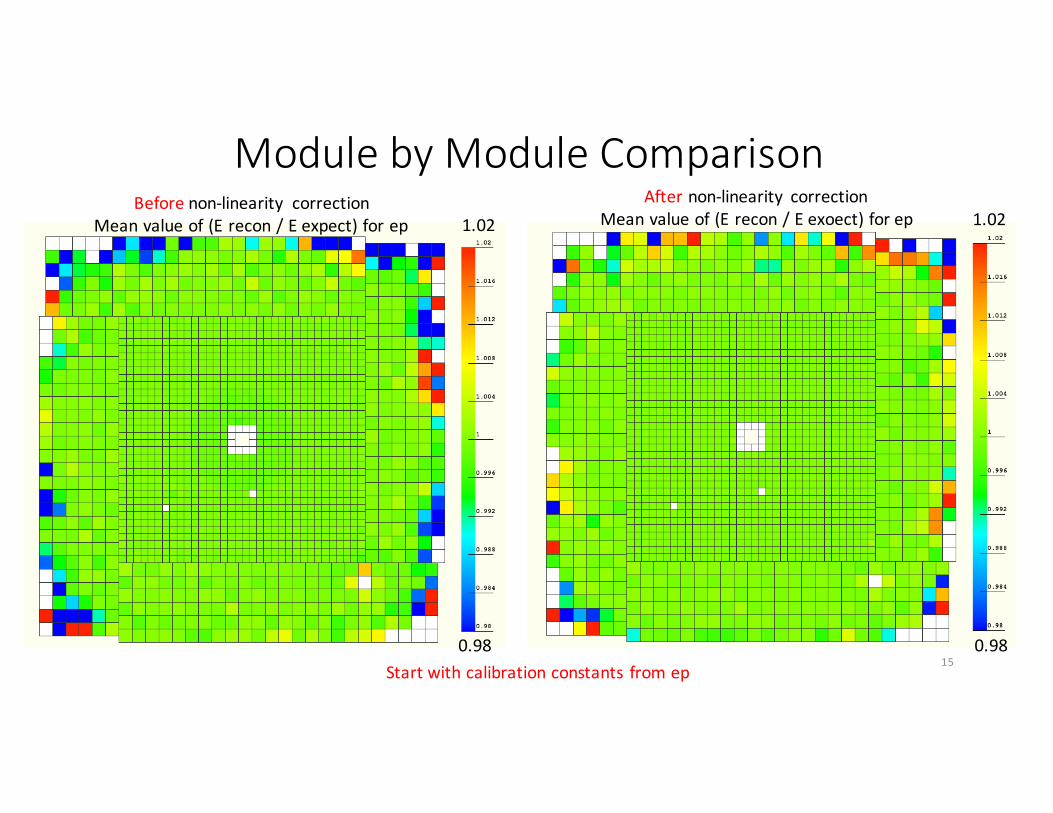
ModulebyModuleComparison
15Startwithcalibrationconstants fromep
Before non-linearity correctionMeanvalueof(Erecon/Eexpect)forep
After non-linearity correctionMeanvalueof(Erecon/Eexoect)forep1.02 1.02
0.980.98
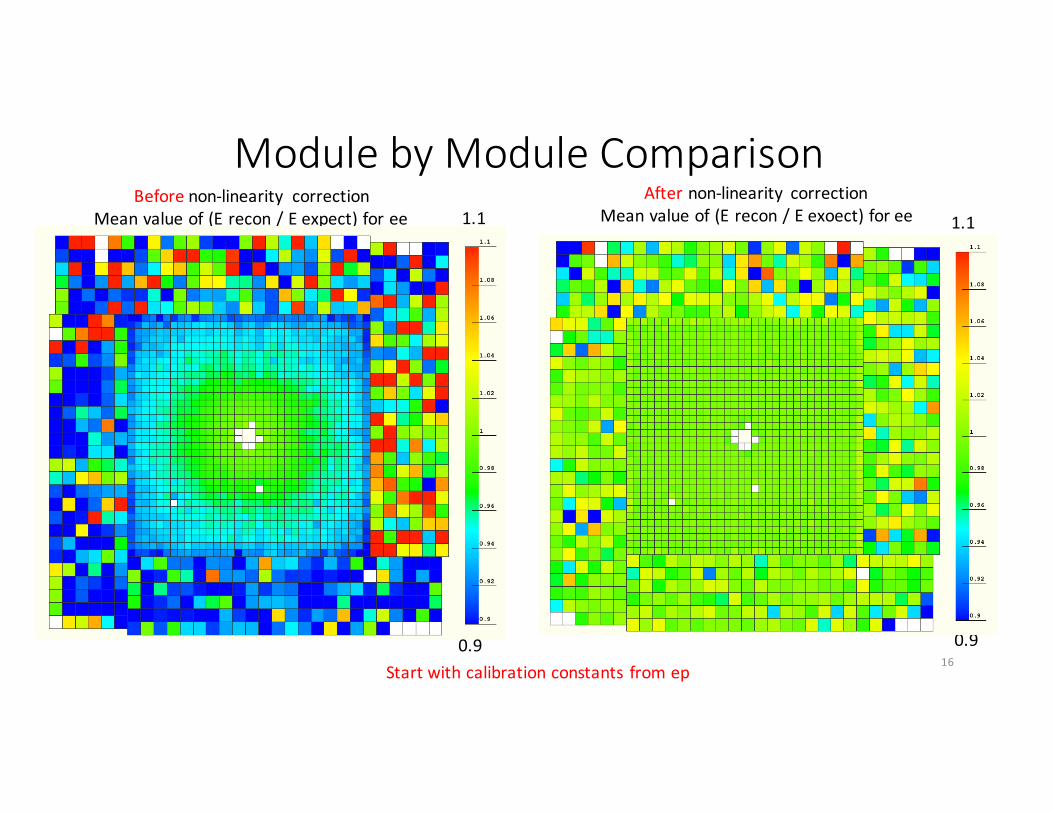
ModulebyModuleComparison
16Startwithcalibrationconstants fromep
Before non-linearity correctionMeanvalueof(Erecon/Eexpect)foree
After non-linearity correctionMeanvalueof(Erecon/Eexoect)foree1.1 1.1
0.90.9
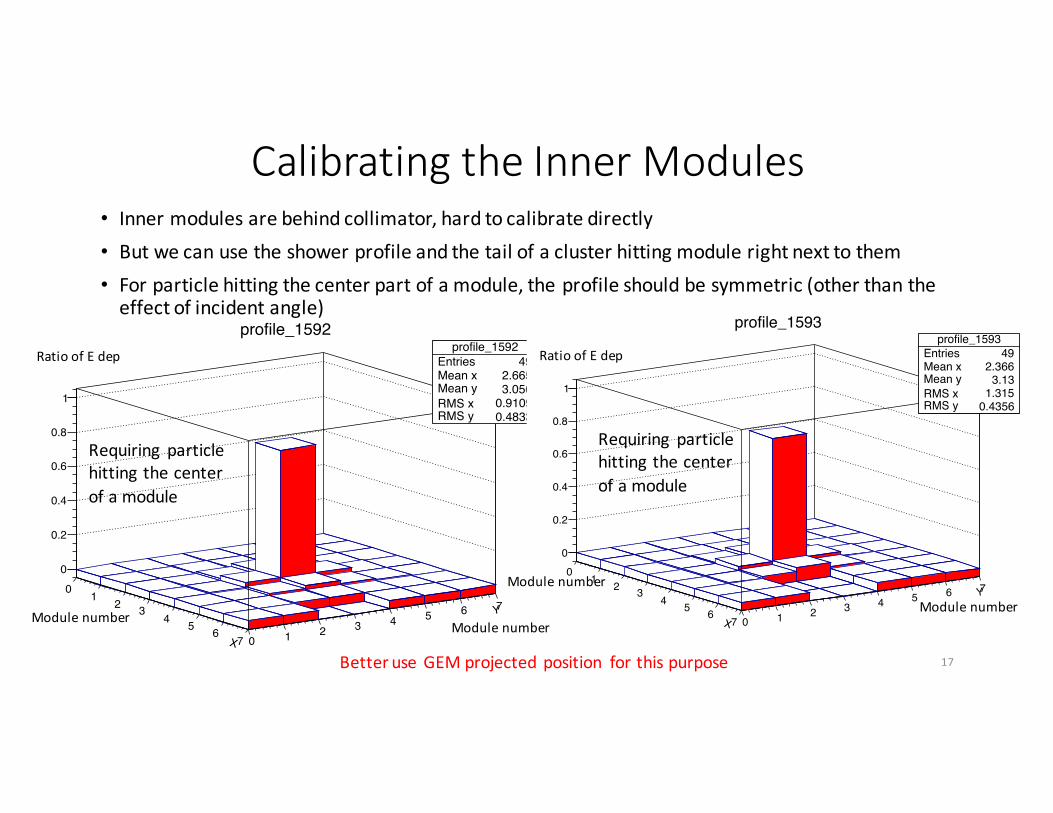
CalibratingtheInnerModules• Innermodulesarebehindcollimator,hardtocalibratedirectly• Butwecanusetheshowerprofileandthetailofaclusterhittingmodulerightnexttothem• Forparticlehittingthecenterpartofamodule,theprofileshouldbesymmetric(otherthantheeffectofincidentangle)
17
X
0 1 2 34 5 6
7
Y
0 1 2 3 4 5 6 7
0
0.2
0.4
0.6
0.8
1
profile_1592Entries 49Mean x 2.665Mean y 3.056RMS x 0.9109RMS y 0.4833
profile_1592Entries 49Mean x 2.665Mean y 3.056RMS x 0.9109RMS y 0.4833
profile_1592
X
0 1 2 34 5 6
7
Y
0 1 2 3 4 5 6 7
0
0.2
0.4
0.6
0.8
1
profile_1593Entries 49Mean x 2.366Mean y 3.13RMS x 1.315RMS y 0.4356
profile_1593Entries 49Mean x 2.366Mean y 3.13RMS x 1.315RMS y 0.4356
profile_1593
ModulenumberModulenumber
Modulenumber
Modulenumber
RatioofEdep RatioofEdep
Requiring particlehittingthecenterofamodule
Requiring particlehittingthecenterofamodule
BetteruseGEMprojectedposition forthispurpose
Todo• Non-linearitycorrectionshowsimprovementonthebiasofthedistribution,butcannotbefullycorrected• Betterapproachfortheproblem?• IsitreallyjusttheissuewithlinearityforLG,istheresomethingelse?
• Calibratingmodulesnearthecentralholeseemsdoable,wanttouseGEMprojectedposition inordertogetridofthedependencyonHyCalreconstructedposition
18