http:d.doi.org10.215770103-5053.20170066 0103 - 5053...
8
Article J. Braz. Chem. Soc., Vol. 28, No. 11, 2172-2179, 2017. Printed in Brazil - ©2017 Sociedade Brasileira de Química 0103 - 5053 $6.00+0.00 http://dx.doi.org/10.21577/0103-5053.20170066 *e-mail: [email protected], [email protected] Pre-Concentration and Separation of Perphenazine Using Picric Acid Loaded α-Fe 2 O 3 Nanoparticles: HPLC Syringe Filter as the Particles Support Zahra Ramezani,* ,a,b Marzieh Shekarriz, a,c Abdol Azim Behfar a,b and Somayeh Kiamarzi a a Nanotechnology Research Center and b Medicinal Chemistry Department, Faculty of Pharmacy, Ahvaz Jundishapur University of Medical Sciences, Ahvaz, Iran c Chemical, Polymeric and Petrochemical Technology Development Research Division, Research Institute of Petroleum Industry (RIPI), Tehran, Iran Suspension of picric acid (PA) loaded iron oxide nanoparticles (PA-IONPs) was injected on the top of a 0.2 µm HPLC (high-performance liquid chromatography) syringe filter. The immobilized nanoparticles were used as SPE (solid phase extraction) sorbent for perphenazine separation and pre-concentration. By passing perphenazine solution through the filter, a molecular complex between perphenazine and PA was formed. Perphenazine/PA complex was eluted from the filter using dichloromethane as solvent. The perphenazine contents were determined at 254 nm. Effects of the parameters such as pH, the amount of PA-IONPs, as well as flow rate, volume, and type of eluting solvents, on the separation efficiency and pre-concentration of perphenazine were investigated. The calibration curve was linear in the range of 0.5-5 ng mL -1 (Y = 0.047X + 0.018; R 2 = 0.9952) with limit of detection of 0.16 ng mL -1 . The pre-concentration and enrichment factors were 8.33 and 1.88, respectively. This method was successfully applied to the determination of perphenazine residue in tap water. Keywords: iron oxide nanoparticles, perphenazine, phenothiazine, solid phase extraction, picric acid Introduction Perphenazine (4-[3-(2-chlorophenothiazin-10-yl) propyl]-1-piperazineethanol) is a phenothiazine and tricyclic antidepressant combination used in the treatment of anxiety, depression, schizophrenia, as well as control of severe nausea and vomiting in adults. Therefore, its determination in environmental and clinical samples such as plasma, urine and pharmaceutical formulations are of vital importance. In order to determine perphenazine (PPZ) dosage in preparations and its concentration in diverse matrices such as plasma, urine, and environmental waste waters, different analytical methods including spectrophotometry, 1-4 electrochemical, 5-8 high-performance liquid chromatography (HPLC), 9-12 gas chromatography mass spectrometry (GC-MS), 13,14 and capillary electrophoresis 5,15,16 have been introduced. In most cases, separation and preconcentration of PPZ is required prior to analysis. To do this, different pre-concentration methods such as liquid liquid extraction (LLE) 4 and solid phase extraction (SPE) 11,12,14,17 have been introduced and developed. LLE is a classical method of extraction. It is a time consuming separation and preconcentration technique that requires high amounts of organic solvents. The organic solvents involved in LLE enter the environment and may threaten the aquatic and human life. However, SPE technique, which is faster, uses less organic solvents, and provides clean extract along with higher recovery is extensively used. Nowadays, nanomaterials have been extensively used in the pre-concentration and cleanup of many chemical compounds due to their advantages such as high surface area, fast separation of particles, economical costs, and lower amount of sorbents required. 18 Among nanoparticles, modified and unmodified magnetic iron oxide nanoparticles have attracted more attention because they have provided fast and easy way of particles separation from the solution by using a permanent magnet. As a result, on line analysis of a certain analyte becomes possible. In some cases, non-magnetic nanoparticles sorbents have good ability in preconcentration of specific compounds but, the main problem that limits their use is the particles separation from
Transcript of http:d.doi.org10.215770103-5053.20170066 0103 - 5053...
Article J. Braz. Chem. Soc., Vol. 28, No. 11, 2172-2179, 2017.Printed in Brazil - ©2017 Sociedade Brasileira de Química0103 - 5053 $6.00+0.00
http://dx.doi.org/10.21577/0103-5053.20170066
*e-mail: [email protected], [email protected]
Pre-Concentration and Separation of Perphenazine Using Picric Acid Loaded α-Fe2O3 Nanoparticles: HPLC Syringe Filter as the Particles Support
Zahra Ramezani,*,a,b Marzieh Shekarriz,a,c Abdol Azim Behfara,b and Somayeh Kiamarzia
aNanotechnology Research Center and bMedicinal Chemistry Department, Faculty of Pharmacy, Ahvaz Jundishapur University of Medical Sciences, Ahvaz, Iran
cChemical, Polymeric and Petrochemical Technology Development Research Division, Research Institute of Petroleum Industry (RIPI), Tehran, Iran
Suspension of picric acid (PA) loaded iron oxide nanoparticles (PA-IONPs) was injected on the top of a 0.2 µm HPLC (high-performance liquid chromatography) syringe filter. The immobilized nanoparticles were used as SPE (solid phase extraction) sorbent for perphenazine separation and pre-concentration. By passing perphenazine solution through the filter, a molecular complex between perphenazine and PA was formed. Perphenazine/PA complex was eluted from the filter using dichloromethane as solvent. The perphenazine contents were determined at 254 nm. Effects of the parameters such as pH, the amount of PA-IONPs, as well as flow rate, volume, and type of eluting solvents, on the separation efficiency and pre-concentration of perphenazine were investigated. The calibration curve was linear in the range of 0.5-5 ng mL-1 (Y = 0.047X + 0.018; R2 = 0.9952) with limit of detection of 0.16 ng mL-1. The pre-concentration and enrichment factors were 8.33 and 1.88, respectively. This method was successfully applied to the determination of perphenazine residue in tap water.
Keywords: iron oxide nanoparticles, perphenazine, phenothiazine, solid phase extraction, picric acid
Introduction
Perphenazine (4-[3-(2-chlorophenothiazin-10-yl) propyl]-1-piperazineethanol) is a phenothiazine and tricyclic antidepressant combination used in the treatment of anxiety, depression, schizophrenia, as well as control of severe nausea and vomiting in adults. Therefore, its determination in environmental and clinical samples such as plasma, urine and pharmaceutical formulations are of vital importance.
In order to determine perphenazine (PPZ) dosage in preparations and its concentration in diverse matrices such as plasma, urine, and environmental waste waters, different analytical methods including spectrophotometry,1-4 electrochemical,5-8 high-performance liquid chromatography (HPLC),9-12 gas chromatography mass spectrometry (GC-MS),13,14 and capillary electrophoresis5,15,16 have been introduced. In most cases, separation and preconcentration of PPZ is required prior to analysis. To do this, different pre-concentration methods such as liquid liquid extraction
(LLE)4 and solid phase extraction (SPE)11,12,14,17 have been introduced and developed. LLE is a classical method of extraction. It is a time consuming separation and preconcentration technique that requires high amounts of organic solvents. The organic solvents involved in LLE enter the environment and may threaten the aquatic and human life. However, SPE technique, which is faster, uses less organic solvents, and provides clean extract along with higher recovery is extensively used. Nowadays, nanomaterials have been extensively used in the pre-concentration and cleanup of many chemical compounds due to their advantages such as high surface area, fast separation of particles, economical costs, and lower amount of sorbents required.18 Among nanoparticles, modified and unmodified magnetic iron oxide nanoparticles have attracted more attention because they have provided fast and easy way of particles separation from the solution by using a permanent magnet. As a result, on line analysis of a certain analyte becomes possible. In some cases, non-magnetic nanoparticles sorbents have good ability in preconcentration of specific compounds but, the main problem that limits their use is the particles separation from
Ramezani et al. 2173Vol. 28, No. 11, 2017
the solutions. Nonmagnetic particles are separated from the solution by centrifugation. Particles such as nanosilver need high speed centrifuge that is not available in every laboratory. Some researchers prepare mini column cartridge with fine filter to solve the problem.19,20 Separations of nonmagnetic particles are still challenging and require special equipment.
Picric acid has been used for a long time in the colorimetric determination of phenothiazines.4,21 It has already been shown that it can be efficiently adsorbed on iron oxide nanoparticles.22 Therefore, in the present work, at first picric acid was loaded on the non magnetic iron oxide nanoparticles (PA-IONPs) surfaces. Secondly, PA-IONPs were immobilized on the surface of the HPLC syringe filter. Finally, PA-IONPs was introduced as a novel SPE sorbent for PPZ pre-concentration and separation as representative of phenothiazines family. It introduces an inexpensive, more sensitive and selective method for phenothiazine pre-concentration and separation.
Experimental
Reagents and materials
All chemicals including 1.2% m/v picric acid solution, hydrochloric and nitric acids, phosphate salts, sodium hydroxide, and solvents such as methanol, dichloromethane, as well as any other organic materials used in this study were prepared from Merck (Darmstadt, Germany). Perphenazine was prepared from Sigma (Saint Louis, USA). Doubled distilled water was used throughout this study.
Iron oxide nanoparticles (IONPs) were prepared according to the previous work.23 The procedure is briefly described below.
IONPs preparation
About 100 mL of 2.4 M NaOH in water:ethanol (3:1) was added gradually to 100 mL mixture containing 0.4 M FeCl3 in water:ethanol (3:1) and 6 g of sodium dodecyl sulfate (SDS). A reddish brown precipitate was obtained and the resulting suspension was stirred for 2 h. The mixture was filtered and washed several times with distilled water and was calcinated at 600 °C for 1 h.
Standard solution preparation
Stock solution of 100 µg mL-1 PPZ in methanol was prepared by adding 5 mg pure perphenazine to 50 mL volumetric flask, dissolving in minimum amount of methanol and then diluted to the mark with doubly distilled
water. Aqueous working solutions were made by successive dilution of this stock solution.
Instruments
All spectrophotometric measurements were done on 7850 JASCO UV/Vis spectrophotometer (Japan). 632 Metrohm pH-meter (Herisau, Switzerland) was used for pH adjustments. Ultrasonic bath (Transistor/Ultrasonic T-14, USA) was used for agitation purposes. Vortex70 Brucker FT-IR spectrophotometer (Germany) equipped with attenuated total reflection (ATR) with Zn-Se sensor was used to record the Fourier transform infrared (FTIR) spectrum of the nanoparticles before and after surface modification. Millipore org/aq HPLC syringe filter with pore diameter of 0.2 µm was used as SPE cartridge to retain iron oxide nanoparticles. A 12 port Vacuum manifold (Millipore Company) that was connected to laboratory central vacuum system was used to perform SPE. The solvents flow rate was controlled by adjusting the vacuum.
Transmission electron microscopy (TEM) image of the prepared nanoparticles was captured using TM 200 FGE Philips transmission electron microscope. X-ray diffraction (XRD) analysis of the particles was obtained using Philips X-ray diffractometer PW1840 with Cu Kα radiation (λ = 0.154 nm). DSC1 STAR system (Mettler Toledo, Switzerland) differential scanning calorimeter (DSC) was used to record thermal behaviors.
Methods
Loading picric acid on the surface of iron oxide nanoparticlesIn a 100 mL beaker, about 25 mL of 1.2% m/v picric
acid was added to 105 mg iron oxide nanoparticles. The resulted suspension was placed in an ultrasonic bath for about 60 minutes. The extent of picric acid loading was determined by absorption measurements of supernatant at 352 nm, maximum absorption wavelength of picric acid in aqueous solutions. Picric acid loading was decided to be completed when no considerable changes in the absorbance of supernatants at 352 nm was observed. The resulting PA-IONPs were separated from the solution by high speed centrifuge. To remove non-bonded PA from the surface of the particles, PA-IONPs were washed several times with 15 mL portions of doubly distilled water till the supernatant became colorless. The particles were dried in air and characterized by particle size analyzer (PSA) and FTIR.
Immobilization of PA-IONPs on HPLC syringe filterAs shown in Figure 1, certain amounts of picric acid
loaded iron oxide nanoparticles suspension (contains
Pre-Concentration and Separation of Perphenazine Using Picric Acid Loaded α-Fe2O3 Nanoparticles J. Braz. Chem. Soc.2174
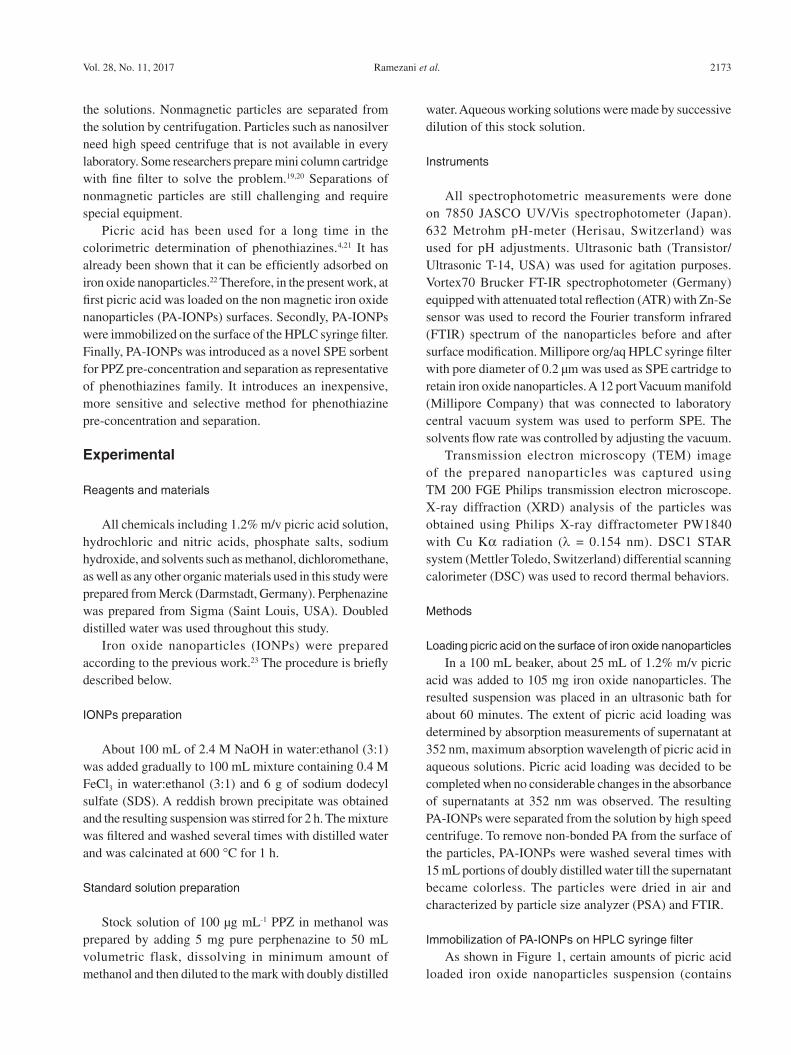
35 mg PA-IONPs) was injected on the top of 0.2 µm HPLC syringe filter by back pressure (Figure 1, right). The color changes of the filter surface and the clear solution that exits from its outlet are good indicators of complete immobilization of the modified nanoparticles on the surface of the filter materials. Figure 1 (left) shows the filter before and after loading with the modified nanoparticles. PA-IONPs suspension was stable for about two weeks.
Solid phase extraction procedureTwelve 0.2 µm HPLC syringe filters containing
PA-IONPs were placed on top of the 12 channel vacuum manifold system. All filters were washed with 3 mL distilled water. Portions of 25 mL of 0.5 to 100 ng mL-1 PPZ solutions at pH 8 were passed through each filter, consequently. The filters were again washed with 2 mL distilled water to remove any water soluble impurity. Then, they were allowed to dry under vacuum for about 3 min. Finally, the PPZ complex was eluted by passing 3 mL dichloromethane through the filter at the rate of 4.7 mL min-1. The dichloromethane phase was collected and its absorbance was measured at 254 nm. All unknown concentrations were measured using the method calibration curve.
Results and Discussion
In order to check the ability of bare iron oxide nanoparticles (IONPs) to adsorb PPZ, batch experiments at different pH and IONPs doses were performed. As it was concluded from the results, the maximum PPZ adsorption on the unmodified IONPs was 56% and dichloromethane could desorb about 75% of this adsorbed amount. So a total of 42% of PPZ was recovered from the unmodified iron oxide nanoparticles. It indicated low ability of bare IONPs as sorbent for pre-concentration and separation of PPZ, while PA-IONPs showed approximately 100% adsorption and above 90% desorption capability. Above all, bare iron nanoparticles have low selectivity and can adsorb a vast
variety of compounds other than PPZ. Chemical structures of PPZ and PA are presented in Figure 2. Having considered the chemical structures, PA has 7 sites as hydrogen bond acceptor (all oxygen atoms in the molecule) and one site as hydrogen bond donor (OH). Figure 2 also shows that picric acid (pKa = 0.42) attached to the surface of IONPs through oxygen of OH group. Hydrogen bonding and affinity of PPZ oxygen toward nitrogen atoms of PA is the basis for complex formation between PA and PPZ. This specific interaction makes the PA-IONPs as selective sorbent for phenothiazine. Therefore, PA-IONPs were assumed as an effective and selective sorbent for PPZ separation and pre-concentration. However, effects of different parameters in PPZ separation and pre-concentration using the present nanoparticles were evaluated.
Characterization of picric acid loaded iron oxide nanoparticles
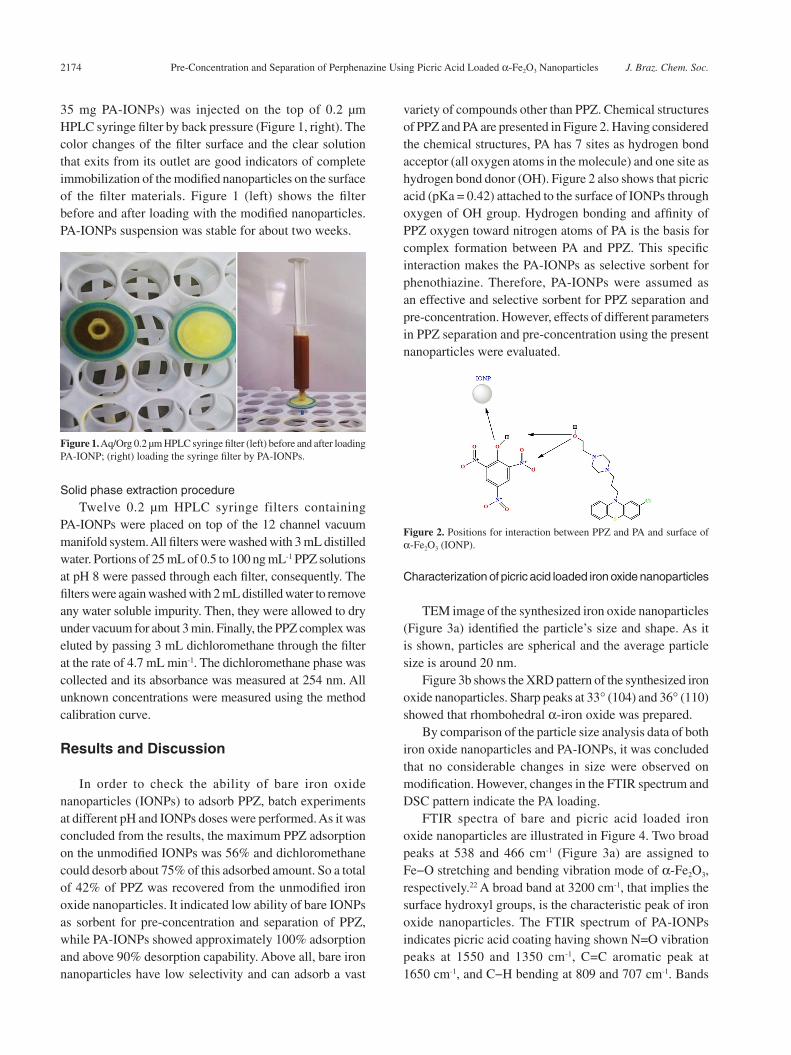
TEM image of the synthesized iron oxide nanoparticles (Figure 3a) identified the particle’s size and shape. As it is shown, particles are spherical and the average particle size is around 20 nm.
Figure 3b shows the XRD pattern of the synthesized iron oxide nanoparticles. Sharp peaks at 33° (104) and 36° (110) showed that rhombohedral α-iron oxide was prepared.
By comparison of the particle size analysis data of both iron oxide nanoparticles and PA-IONPs, it was concluded that no considerable changes in size were observed on modification. However, changes in the FTIR spectrum and DSC pattern indicate the PA loading.
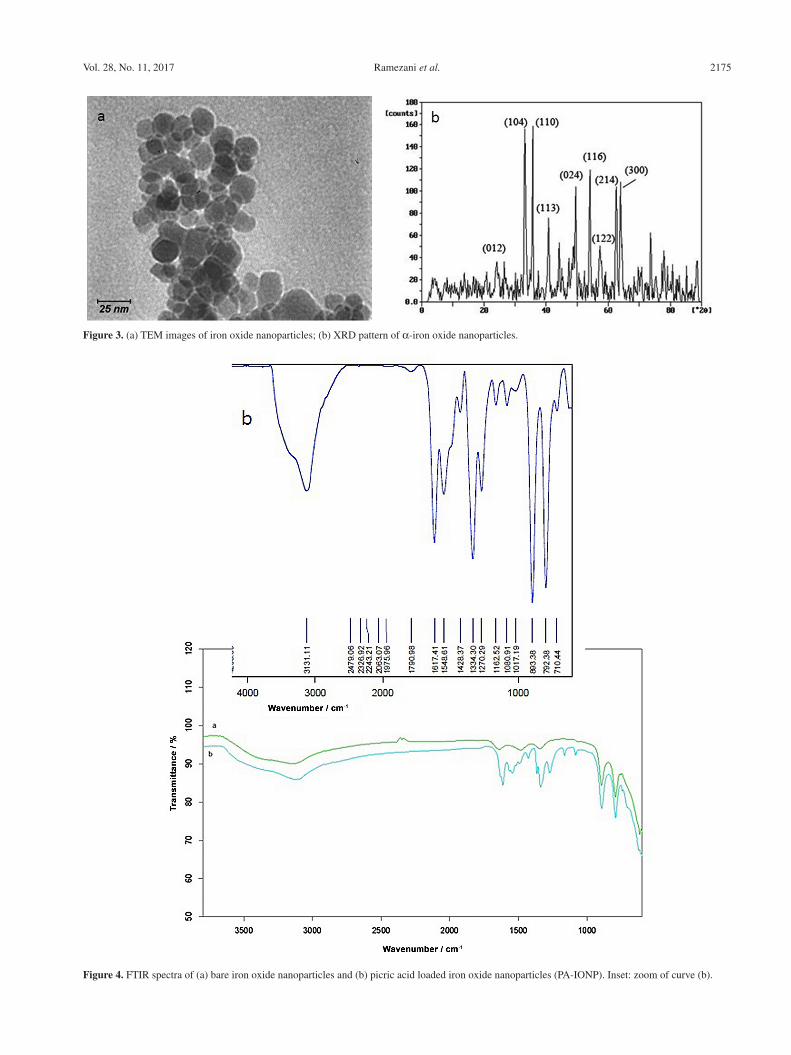
FTIR spectra of bare and picric acid loaded iron oxide nanoparticles are illustrated in Figure 4. Two broad peaks at 538 and 466 cm-1 (Figure 3a) are assigned to Fe−O stretching and bending vibration mode of α-Fe2O3, respectively.22 A broad band at 3200 cm-1, that implies the surface hydroxyl groups, is the characteristic peak of iron oxide nanoparticles. The FTIR spectrum of PA-IONPs indicates picric acid coating having shown N=O vibration peaks at 1550 and 1350 cm-1, C=C aromatic peak at 1650 cm-1, and C−H bending at 809 and 707 cm-1. Bands
Figure 1. Aq/Org 0.2 µm HPLC syringe filter (left) before and after loading PA-IONP; (right) loading the syringe filter by PA-IONPs.
Figure 2. Positions for interaction between PPZ and PA and surface of α-Fe2O3 (IONP).
Ramezani et al. 2175Vol. 28, No. 11, 2017
Figure 3. (a) TEM images of iron oxide nanoparticles; (b) XRD pattern of α-iron oxide nanoparticles.
Figure 4. FTIR spectra of (a) bare iron oxide nanoparticles and (b) picric acid loaded iron oxide nanoparticles (PA-IONP). Inset: zoom of curve (b).
Pre-Concentration and Separation of Perphenazine Using Picric Acid Loaded α-Fe2O3 Nanoparticles J. Braz. Chem. Soc.2176
that correspond to C−C, C−O, and C−N observed at frequency of 911 cm-1 are also present. Therefore, the presence of the aromatic compounds on the surface of α-Fe2O3 surface was confirmed.
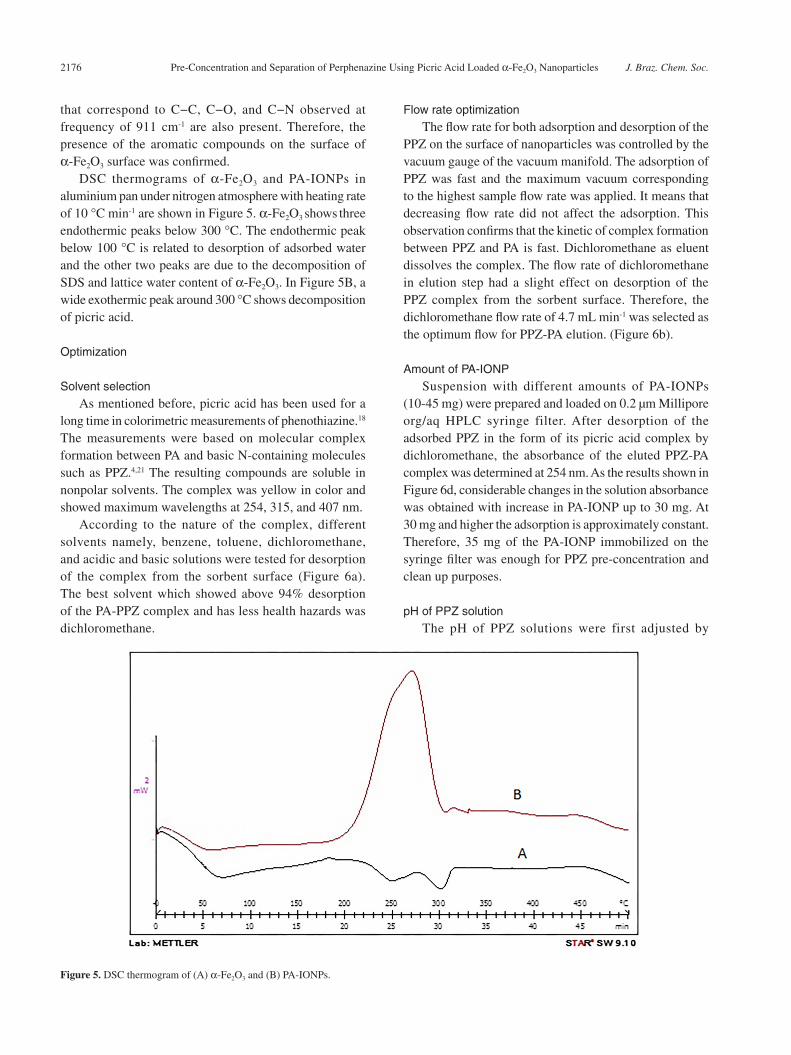
DSC thermograms of α-Fe2O3 and PA-IONPs in aluminium pan under nitrogen atmosphere with heating rate of 10 °C min-1 are shown in Figure 5. α-Fe2O3 shows three endothermic peaks below 300 °C. The endothermic peak below 100 °C is related to desorption of adsorbed water and the other two peaks are due to the decomposition of SDS and lattice water content of α-Fe2O3. In Figure 5B, a wide exothermic peak around 300 °C shows decomposition of picric acid.
Optimization
Solvent selectionAs mentioned before, picric acid has been used for a
long time in colorimetric measurements of phenothiazine.18 The measurements were based on molecular complex formation between PA and basic N-containing molecules such as PPZ.4,21 The resulting compounds are soluble in nonpolar solvents. The complex was yellow in color and showed maximum wavelengths at 254, 315, and 407 nm.
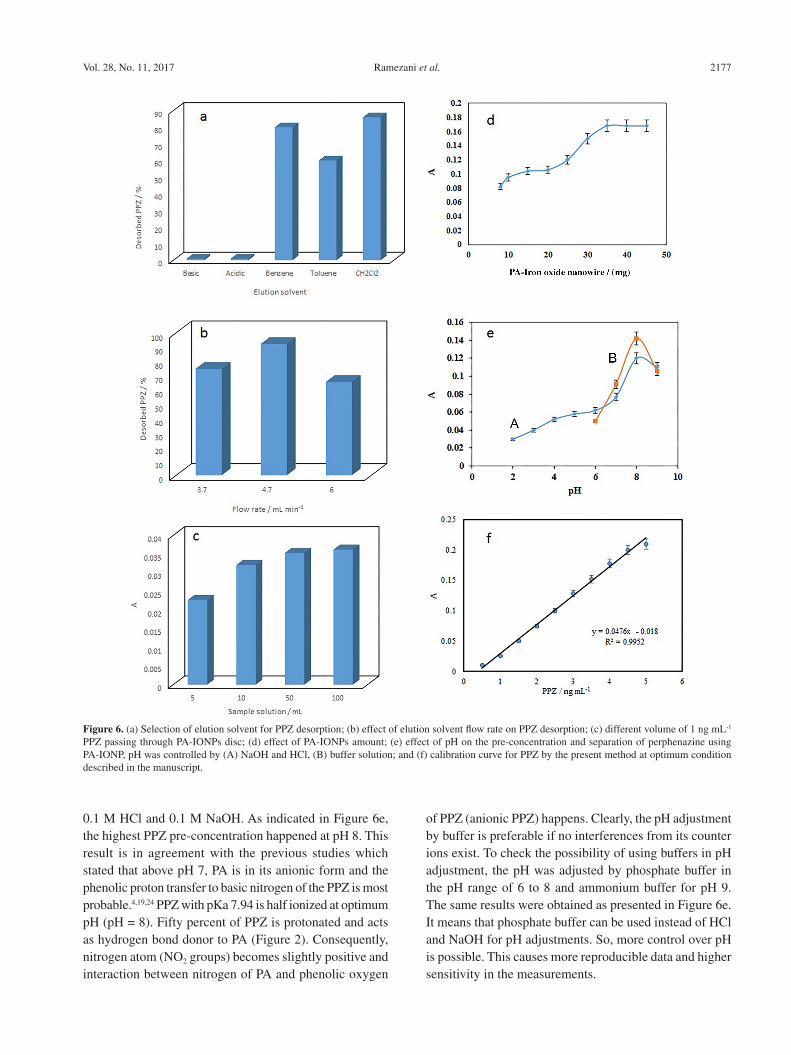
According to the nature of the complex, different solvents namely, benzene, toluene, dichloromethane, and acidic and basic solutions were tested for desorption of the complex from the sorbent surface (Figure 6a). The best solvent which showed above 94% desorption of the PA-PPZ complex and has less health hazards was dichloromethane.
Flow rate optimizationThe flow rate for both adsorption and desorption of the
PPZ on the surface of nanoparticles was controlled by the vacuum gauge of the vacuum manifold. The adsorption of PPZ was fast and the maximum vacuum corresponding to the highest sample flow rate was applied. It means that decreasing flow rate did not affect the adsorption. This observation confirms that the kinetic of complex formation between PPZ and PA is fast. Dichloromethane as eluent dissolves the complex. The flow rate of dichloromethane in elution step had a slight effect on desorption of the PPZ complex from the sorbent surface. Therefore, the dichloromethane flow rate of 4.7 mL min-1 was selected as the optimum flow for PPZ-PA elution. (Figure 6b).
Amount of PA-IONPSuspension with different amounts of PA-IONPs
(10-45 mg) were prepared and loaded on 0.2 µm Millipore org/aq HPLC syringe filter. After desorption of the adsorbed PPZ in the form of its picric acid complex by dichloromethane, the absorbance of the eluted PPZ-PA complex was determined at 254 nm. As the results shown in Figure 6d, considerable changes in the solution absorbance was obtained with increase in PA-IONP up to 30 mg. At 30 mg and higher the adsorption is approximately constant. Therefore, 35 mg of the PA-IONP immobilized on the syringe filter was enough for PPZ pre-concentration and clean up purposes.
pH of PPZ solutionThe pH of PPZ solutions were first adjusted by
Figure 5. DSC thermogram of (A) α-Fe2O3 and (B) PA-IONPs.
Ramezani et al. 2177Vol. 28, No. 11, 2017
0.1 M HCl and 0.1 M NaOH. As indicated in Figure 6e, the highest PPZ pre-concentration happened at pH 8. This result is in agreement with the previous studies which stated that above pH 7, PA is in its anionic form and the phenolic proton transfer to basic nitrogen of the PPZ is most probable.4,19,24 PPZ with pKa 7.94 is half ionized at optimum pH (pH = 8). Fifty percent of PPZ is protonated and acts as hydrogen bond donor to PA (Figure 2). Consequently, nitrogen atom (NO2 groups) becomes slightly positive and interaction between nitrogen of PA and phenolic oxygen
of PPZ (anionic PPZ) happens. Clearly, the pH adjustment by buffer is preferable if no interferences from its counter ions exist. To check the possibility of using buffers in pH adjustment, the pH was adjusted by phosphate buffer in the pH range of 6 to 8 and ammonium buffer for pH 9. The same results were obtained as presented in Figure 6e. It means that phosphate buffer can be used instead of HCl and NaOH for pH adjustments. So, more control over pH is possible. This causes more reproducible data and higher sensitivity in the measurements.
Figure 6. (a) Selection of elution solvent for PPZ desorption; (b) effect of elution solvent flow rate on PPZ desorption; (c) different volume of 1 ng mL-1 PPZ passing through PA-IONPs disc; (d) effect of PA-IONPs amount; (e) effect of pH on the pre-concentration and separation of perphenazine using PA-IONP, pH was controlled by (A) NaOH and HCl, (B) buffer solution; and (f) calibration curve for PPZ by the present method at optimum condition described in the manuscript.
Pre-Concentration and Separation of Perphenazine Using Picric Acid Loaded α-Fe2O3 Nanoparticles J. Braz. Chem. Soc.2178
Method validationFigure of merit of the present analytical method was
determined and evaluated. The calibration was linear in the range of 0.5 to 5 ng mL-1 (Y = 0.047X + 0.018 (R2 = 0.9952), Figure 6f). The limit of detection, determined as 3SD (standard deviation) of the blank, was 0.16 ng mL-1. Enrichment factor, determined as the slope of the method calibration curve to that of the reference method of the United State Pharmacopeia (USP), was 1.88. It indicates that the present method is more sensitive than its USP counterpart. The pre-concentration factor (i.e. volume of the solution passing through the sorbent to the dichloromethane volume) was 8.33. The reproducibility was obtained by calculating the within days and between days coefficient of variation for different concentrations in the calibration range (0.5, 2, 5 ng mL-1; 3 replicate samples) and was in the acceptable range (0.74 to 1.11).
Method reliabilityThe reliability of the method was tested by performing
the method of recovery and checking interferences of the constituents that may be present in the perphenazine pharmaceutical forms and biological matrices.
The interference effects of different cations, anions, sucrose, oxalic acid, urea, sodium benzoate, glucose and starch were tested. Measurement error above 5% for each compound was considered as interference. The results showed no interference for tested ions. This observation may be due to selectivity of the reaction between PA present at the nanoparticle surface and PPZ, which results in formation of an insoluble molecular complex.4
In order to evaluate the reliability of the pre-concentration and separation method, spiked tap water samples were analyzed for perphenazine content using the
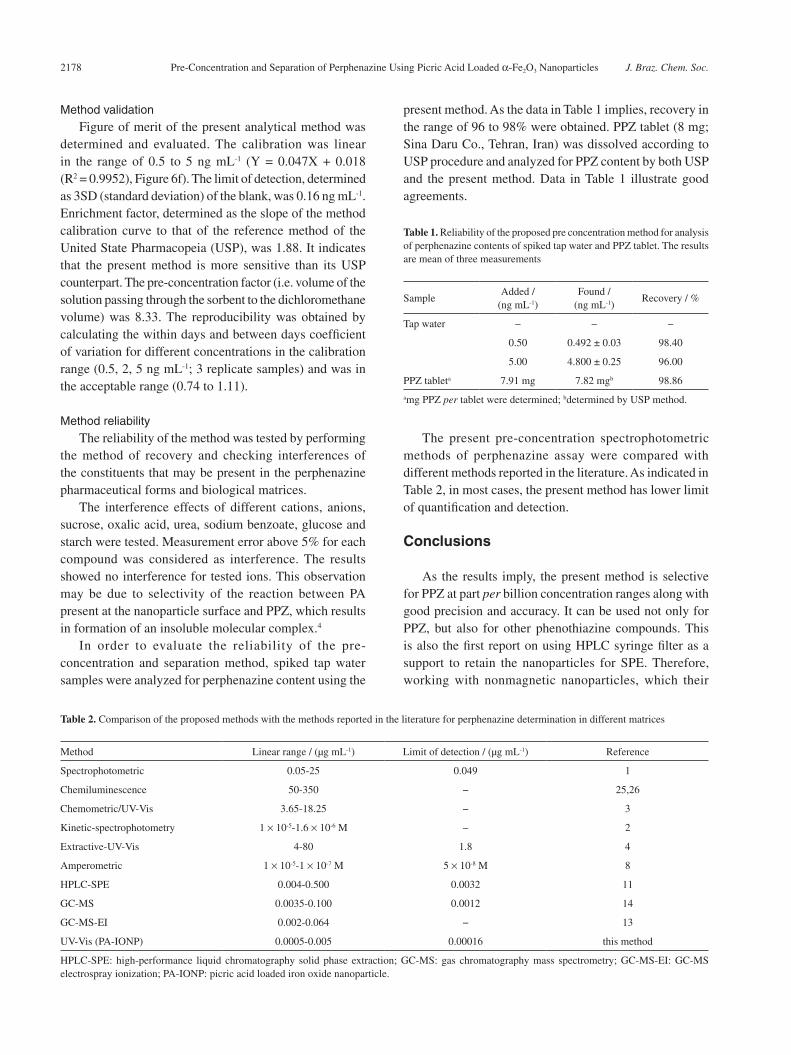
present method. As the data in Table 1 implies, recovery in the range of 96 to 98% were obtained. PPZ tablet (8 mg; Sina Daru Co., Tehran, Iran) was dissolved according to USP procedure and analyzed for PPZ content by both USP and the present method. Data in Table 1 illustrate good agreements.
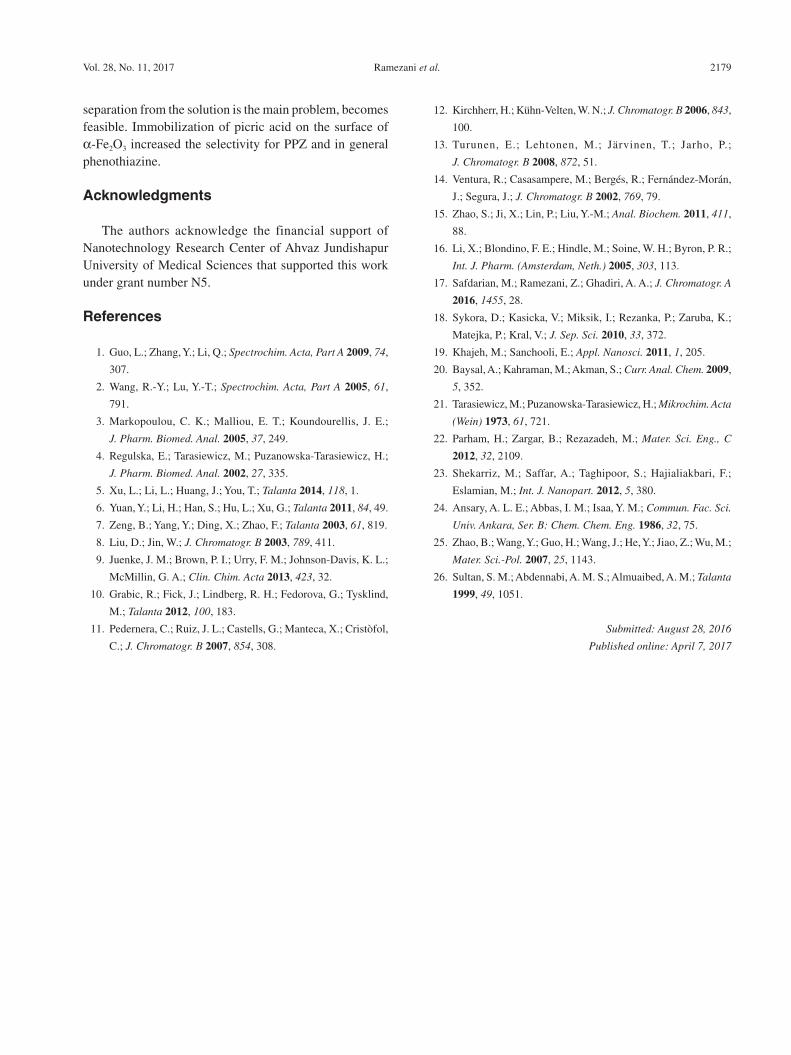
The present pre-concentration spectrophotometric methods of perphenazine assay were compared with different methods reported in the literature. As indicated in Table 2, in most cases, the present method has lower limit of quantification and detection.
Conclusions
As the results imply, the present method is selective for PPZ at part per billion concentration ranges along with good precision and accuracy. It can be used not only for PPZ, but also for other phenothiazine compounds. This is also the first report on using HPLC syringe filter as a support to retain the nanoparticles for SPE. Therefore, working with nonmagnetic nanoparticles, which their
Table 1. Reliability of the proposed pre concentration method for analysis of perphenazine contents of spiked tap water and PPZ tablet. The results are mean of three measurements
SampleAdded /
(ng mL-1)Found /
(ng mL-1)Recovery / %
Tap water − − −
0.50 0.492 ± 0.03 98.40
5.00 4.800 ± 0.25 96.00
PPZ tableta 7.91 mg 7.82 mgb 98.86
amg PPZ per tablet were determined; bdetermined by USP method.
Table 2. Comparison of the proposed methods with the methods reported in the literature for perphenazine determination in different matrices
Method Linear range / (µg mL-1) Limit of detection / (µg mL-1) Reference
Spectrophotometric 0.05-25 0.049 1
Chemiluminescence 50-350 − 25,26
Chemometric/UV-Vis 3.65-18.25 − 3
Kinetic-spectrophotometry 1 × 10⁻⁵-1.6 × 10⁻⁶ M − 2
Extractive-UV-Vis 4-80 1.8 4
Amperometric 1 × 10⁻⁵-1 × 10⁻⁷ M 5 × 10⁻⁸ M 8
HPLC-SPE 0.004-0.500 0.0032 11
GC-MS 0.0035-0.100 0.0012 14
GC-MS-EI 0.002-0.064 − 13
UV-Vis (PA-IONP) 0.0005-0.005 0.00016 this method
HPLC-SPE: high-performance liquid chromatography solid phase extraction; GC-MS: gas chromatography mass spectrometry; GC-MS-EI: GC-MS electrospray ionization; PA-IONP: picric acid loaded iron oxide nanoparticle.
Ramezani et al. 2179Vol. 28, No. 11, 2017
separation from the solution is the main problem, becomes feasible. Immobilization of picric acid on the surface of α-Fe2O3 increased the selectivity for PPZ and in general phenothiazine.
Acknowledgments
The authors acknowledge the financial support of Nanotechnology Research Center of Ahvaz Jundishapur University of Medical Sciences that supported this work under grant number N5.
References
1. Guo, L.; Zhang, Y.; Li, Q.; Spectrochim. Acta, Part A 2009, 74,
307.
2. Wang, R.-Y.; Lu, Y.-T.; Spectrochim. Acta, Part A 2005, 61,
791.
3. Markopoulou, C. K.; Malliou, E. T.; Koundourellis, J. E.;
J. Pharm. Biomed. Anal. 2005, 37, 249.
4. Regulska, E.; Tarasiewicz, M.; Puzanowska-Tarasiewicz, H.;
J. Pharm. Biomed. Anal. 2002, 27, 335.
5. Xu, L.; Li, L.; Huang, J.; You, T.; Talanta 2014, 118, 1.
6. Yuan, Y.; Li, H.; Han, S.; Hu, L.; Xu, G.; Talanta 2011, 84, 49.
7. Zeng, B.; Yang, Y.; Ding, X.; Zhao, F.; Talanta 2003, 61, 819.
8. Liu, D.; Jin, W.; J. Chromatogr. B 2003, 789, 411.
9. Juenke, J. M.; Brown, P. I.; Urry, F. M.; Johnson-Davis, K. L.;
McMillin, G. A.; Clin. Chim. Acta 2013, 423, 32.
10. Grabic, R.; Fick, J.; Lindberg, R. H.; Fedorova, G.; Tysklind,
M.; Talanta 2012, 100, 183.
11. Pedernera, C.; Ruiz, J. L.; Castells, G.; Manteca, X.; Cristòfol,
C.; J. Chromatogr. B 2007, 854, 308.
12. Kirchherr, H.; Kühn-Velten, W. N.; J. Chromatogr. B 2006, 843,
100.
13. Turunen, E.; Lehtonen, M.; Järvinen, T.; Jarho, P.;
J. Chromatogr. B 2008, 872, 51.
14. Ventura, R.; Casasampere, M.; Bergés, R.; Fernández-Morán,
J.; Segura, J.; J. Chromatogr. B 2002, 769, 79.
15. Zhao, S.; Ji, X.; Lin, P.; Liu, Y.-M.; Anal. Biochem. 2011, 411,
88.
16. Li, X.; Blondino, F. E.; Hindle, M.; Soine, W. H.; Byron, P. R.;
Int. J. Pharm. (Amsterdam, Neth.) 2005, 303, 113.
17. Safdarian, M.; Ramezani, Z.; Ghadiri, A. A.; J. Chromatogr. A
2016, 1455, 28.
18. Sykora, D.; Kasicka, V.; Miksik, I.; Rezanka, P.; Zaruba, K.;
Matejka, P.; Kral, V.; J. Sep. Sci. 2010, 33, 372.
19. Khajeh, M.; Sanchooli, E.; Appl. Nanosci. 2011, 1, 205.
20. Baysal, A.; Kahraman, M.; Akman, S.; Curr. Anal. Chem. 2009,
5, 352.
21. Tarasiewicz, M.; Puzanowska-Tarasiewicz, H.; Mikrochim. Acta
(Wein) 1973, 61, 721.
22. Parham, H.; Zargar, B.; Rezazadeh, M.; Mater. Sci. Eng., C
2012, 32, 2109.
23. Shekarriz, M.; Saffar, A.; Taghipoor, S.; Hajialiakbari, F.;
Eslamian, M.; Int. J. Nanopart. 2012, 5, 380.
24. Ansary, A. L. E.; Abbas, I. M.; Isaa, Y. M.; Commun. Fac. Sci.
Univ. Ankara, Ser. B: Chem. Chem. Eng. 1986, 32, 75.
25. Zhao, B.; Wang, Y.; Guo, H.; Wang, J.; He, Y.; Jiao, Z.; Wu, M.;
Mater. Sci.-Pol. 2007, 25, 1143.
26. Sultan, S. M.; Abdennabi, A. M. S.; Almuaibed, A. M.; Talanta
1999, 49, 1051.
Submitted: August 28, 2016
Published online: April 7, 2017


![J. Braz. Chem. Soc. Articlestatic.sites.sbq.org.br/jbcs.sbq.org.br/pdf/160177AR.pdf · 2020. 1. 8. · Henry reactions,27 we hypothesized that HT [Calc.] could promote the in situ](https://static.fdocument.org/doc/165x107/60e0c27bb7bbdf5b0f1361d4/j-braz-chem-soc-2020-1-8-henry-reactions27-we-hypothesized-that-ht-calc.jpg)