High-resolution δ C stratigraphy of the Chuar Group (ca ...eps et al_GSABull_… · glaciomarine...
14
For permission to copy, contact [email protected] © 2005 Geological Society of America ABSTRACT A high-resolution C-isotope record based on δ 13 C org from organic-rich shales and δ 13 C carb from dolomites in the ca. 770–742 Ma Chuar Group provides important new data for evaluating the significance of large-mag- nitude C-isotope anomalies in Neoproterozoic climate change. Three successive, large-mag- nitude isotopic excursions (8–15‰) are inter- preted to represent primary seawater values based on a series of diagenetic tests, and they are not associated with evidence of significant long-term (10 6 –10 7 m.y.) sea-level change nor glaciomarine deposits. Intrabasinal cor- relation of δ 13 C org values suggests that most Chuar shales record primary values and is consistent with previously reported H/C ratios of >0.49 indicating that Chuar shales experienced minimal thermal alteration. Although some Chuar dolomites reveal early diagenetic alteration, their δ 13 C dol values typi- cally fall near those of coeval “least-altered” dolomites or organic-rich shales (relative to dolomite values). The Chuar carbon record is interpreted to reflect predominantly primary organic carbon δ 13 C values and contains suf- ficient primary carbonate δ 13 C data to use for calculating ∆δ 13 C values and for comparison with other mid-Neoproterozoic successions. The Chuar δ 13 C shifts are in phase with dolomite-poor/dolomite-rich lithostratigraphic sequences and with shale petrologic and min- eralogical trends. These data sets collectively indicate long-term (m.y.-scale) wetter-to-drier climate change and concomitant low-ampli- tude sea-level change. The Chuar basin may be a proxy for mid-Neoproterozoic low- latitude basins that accommodated signifi- cant organic carbon burial during this time. Models for other Neoproterozoic long-term δ 13 C anomalies may not require significant continental (and) or low-latitude glaciation as a mechanism for generating large-magnitude C-isotope shifts. Keywords: Neoproterozoic, Grand Canyon, C-isotope record, Chuar Group, lithostratig- raphy, shale geochemistry, climate change. INTRODUCTION The Proterozoic Eon records the largest- magnitude δ 13 C excursions known from the geologic record (Kaufman and Knoll, 1995; Melezhik et al., 1999) and chemostratigraphic data figure prominently in our understanding of the relationships between climate, tectonics, and biologic evolution of the Proterozoic Earth sys- tem (Knoll, 2003). There has been much focus on the late Neoproterozoic chemostratigraphic record (ca. 750–545 Ma) due to the discovery of large-magnitude δ 13 C excursions in association with equatorial glaciomarine diamictites (e.g., “snowball Earth” hypothesis; Kirschvink, 1992; Kaufman et al., 1997; Hoffman et al., 1998a, 1998b) and the emergence of metazoans (Knoll and Holland, 1995). However, the middle Neo- proterozoic (ca. 850–750 Ma) strata records equally large δ 13 C excursions that are not associated with direct sedimentologic evidence of glaciation (e.g., Kaufman and Knoll, 1995; Kaufman et al., 1997; Karlstrom et al., 2000; Hill and Walter, 2000; Halverson et al., 2002; Corsetti and Kaufman, 2003). Importantly, the mid-Neoproterozoic rock record may hold the key for understanding the ensuing dramatic climatic and biologic culminations of the Pro- terozoic Eon. This study presents δ 13 C and major, minor, and rare-earth element (REE) data and min- eralogy from the mid-Neoproterozoic Chuar Group, Grand Canyon. Recent work on the Chuar Group indicates a marine origin (Dehler et al., 2001a), an age range of ca. 770–742 Ma (Karlstrom et al., 2000; Williams et al., 2003), an intracratonic rift setting in near-equatorial (2°S to 18°N) latitudes (Timmons et al., 2001; Weil et al., 2004), and establishment of a diverse biota including Earth’s earliest-known hetero- trophic protists (Porter and Knoll, 2000). Thus, the Chuar Group provides a rich mid-Neopro- terozoic record for understanding how δ 13 C fluctuations and the carbon cycle are related to climate, weathering, sedimentation, tectonics, and biologic evolution. GEOLOGIC BACKGROUND The Chuar Group (1600 m thick) is excep- tionally well exposed, unmetamorphosed, and gently folded below the flat-lying Cambrian Tapeats Sandstone. It is exclusively exposed in a 150 km 2 area of the remote eastern Grand Canyon (Fig. 1). The Chuar Group is dominated by variegated and organic-rich shales (“shale” defined by Potter et al., 1980), with subordinate meter-thick sandstone, siltstone, and dolomite High-resolution δ 13 C stratigraphy of the Chuar Group (ca. 770 –742 Ma), Grand Canyon: Implications for mid-Neoproterozoic climate change C.M. Dehler † Department of Geology, Utah State University, 4505 Old Main Hill, Logan, Utah 84322-4505, USA M. Elrick J.D. Bloch L.J. Crossey K.E. Karlstrom Department of Earth and Planetary Sciences, University of New Mexico, Albuquerque, New Mexico 87131-1116, USA D.J. Des Marais Mail Stop 239-4, Ames Research Center, Moffett Field, California 94035-1000, USA GSA Bulletin; January/February 2005; v. 117; no. 1/2; p. 32–45; doi: 10.1130/B25471.1; 9 figures; 1 table; Data Repository item 2005020. † E-mail: [email protected]. 32
Transcript of High-resolution δ C stratigraphy of the Chuar Group (ca ...eps et al_GSABull_… · glaciomarine...
For permission to copy, contact [email protected]© 2005 Geological Society of America
ABSTRACT
A high-resolution C-isotope record based on δ13C
org from organic-rich shales and
δ13Ccarb
from dolomites in the ca. 770–742 Ma Chuar Group provides important new data for evaluating the signifi cance of large-mag-nitude C-isotope anomalies in Neoproterozoic climate change. Three successive, large-mag-nitude isotopic excursions (8–15‰) are inter-preted to represent primary seawater values based on a series of diagenetic tests, and they are not associated with evidence of signifi cant long-term (106–107 m.y.) sea-level change nor glaciomarine deposits. Intrabasinal cor-relation of δ13C
org values suggests that most
Chuar shales record primary values and is consistent with previously reported H/C ratios of >0.49 indicating that Chuar shales experienced minimal thermal alteration. Although some Chuar dolomites reveal early diagenetic alteration, their δ13C
dol values typi-
cally fall near those of coeval “least-altered” dolomites or organic-rich shales (relative to dolomite values). The Chuar carbon record is interpreted to refl ect predominantly primary organic carbon δ13C values and contains suf-fi cient primary carbonate δ13C data to use for calculating ∆δ13C values and for comparison with other mid-Neoproterozoic successions.
The Chuar δ13C shifts are in phase with dolomite-poor/dolomite-rich litho strati graphic sequences and with shale petrologic and min-eralogical trends. These data sets collectively
indicate long-term (m.y.-scale) wetter-to-drier climate change and concomitant low-ampli-tude sea-level change. The Chuar basin may be a proxy for mid-Neoproterozoic low-latitude basins that accommodated signifi -cant organic carbon burial during this time. Models for other Neoproterozoic long-term δ13C anomalies may not require signifi cant continental (and) or low-latitude glaciation as a mechanism for generating large-magnitude C-isotope shifts.
Keywords: Neoproterozoic, Grand Canyon, C-isotope record, Chuar Group, lithostratig-raphy, shale geochemistry, climate change.
INTRODUCTION
The Proterozoic Eon records the largest-magnitude δ13C excursions known from the geologic record (Kaufman and Knoll, 1995; Melezhik et al., 1999) and chemostratigraphic data fi gure prominently in our understanding of the relationships between climate, tectonics, and biologic evolution of the Proterozoic Earth sys-tem (Knoll, 2003). There has been much focus on the late Neoproterozoic chemostratigraphic record (ca. 750–545 Ma) due to the discovery of large-magnitude δ13C excursions in association with equatorial glaciomarine diamictites (e.g., “snowball Earth” hypothesis; Kirschvink, 1992; Kaufman et al., 1997; Hoffman et al., 1998a, 1998b) and the emergence of metazoans (Knoll and Holland, 1995). However, the middle Neo-proterozoic (ca. 850–750 Ma) strata records equally large δ13C excursions that are not associated with direct sedimentologic evidence
of glaciation (e.g., Kaufman and Knoll, 1995; Kaufman et al., 1997; Karlstrom et al., 2000; Hill and Walter, 2000; Halverson et al., 2002; Corsetti and Kaufman, 2003). Importantly, the mid-Neoproterozoic rock record may hold the key for understanding the ensuing dramatic climatic and biologic culminations of the Pro-terozoic Eon.
This study presents δ13C and major, minor, and rare-earth element (REE) data and min-eralogy from the mid-Neoproterozoic Chuar Group, Grand Canyon. Recent work on the Chuar Group indicates a marine origin (Dehler et al., 2001a), an age range of ca. 770–742 Ma (Karlstrom et al., 2000; Williams et al., 2003), an intracratonic rift setting in near-equatorial (2°S to 18°N) latitudes (Timmons et al., 2001; Weil et al., 2004), and establishment of a diverse biota including Earth’s earliest-known hetero-trophic protists (Porter and Knoll, 2000). Thus, the Chuar Group provides a rich mid-Neopro-terozoic record for understanding how δ13C fl uctuations and the carbon cycle are related to climate, weathering, sedimentation, tectonics, and biologic evolution.
GEOLOGIC BACKGROUND
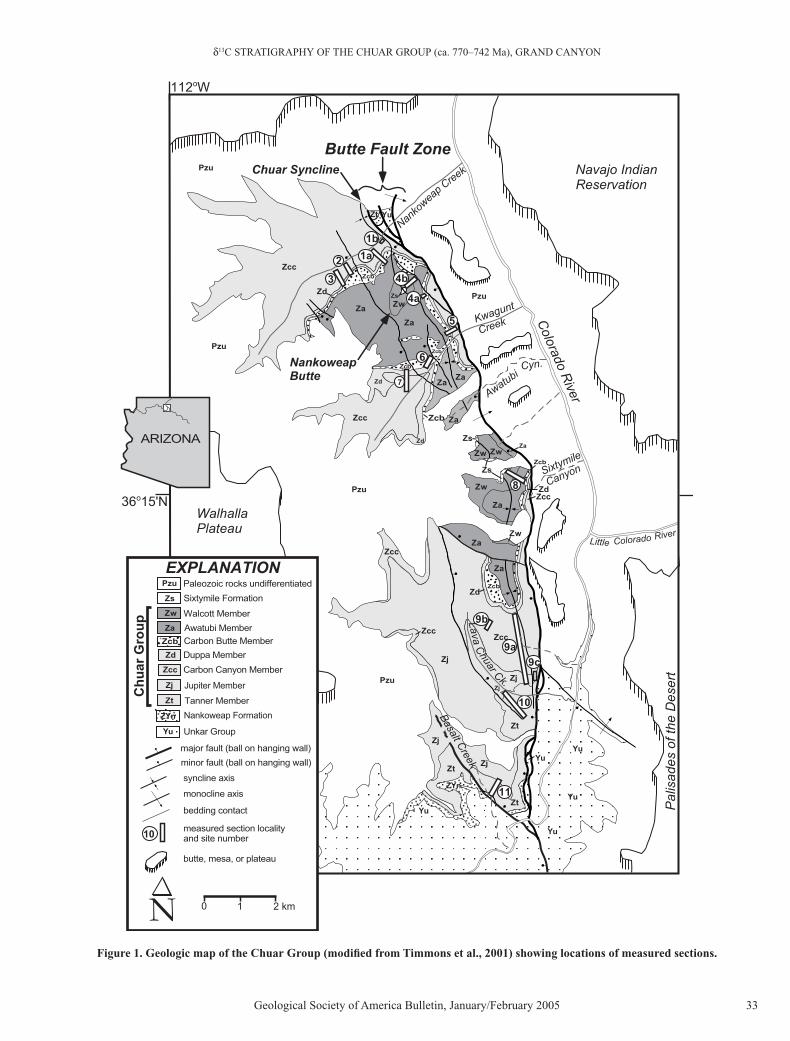
The Chuar Group (1600 m thick) is excep-tionally well exposed, unmetamorphosed, and gently folded below the fl at-lying Cambrian Tapeats Sandstone. It is exclusively exposed in a 150 km2 area of the remote eastern Grand Canyon (Fig. 1). The Chuar Group is dominated by variegated and organic-rich shales (“shale” defi ned by Potter et al., 1980), with subordinate meter-thick sandstone, siltstone, and dolomite
High-resolution δ13C stratigraphy of the Chuar Group (ca. 770 –742 Ma), Grand Canyon: Implications for mid-Neoproterozoic climate change
C.M. Dehler†
Department of Geology, Utah State University, 4505 Old Main Hill, Logan, Utah 84322-4505, USA
M. ElrickJ.D. BlochL.J. CrosseyK.E. KarlstromDepartment of Earth and Planetary Sciences, University of New Mexico, Albuquerque, New Mexico 87131-1116, USA
D.J. Des MaraisMail Stop 239-4, Ames Research Center, Moffett Field, California 94035-1000, USA
GSA Bulletin; January/February 2005; v. 117; no. 1/2; p. 32–45; doi: 10.1130/B25471.1; 9 fi gures; 1 table; Data Repository item 2005020.
†E-mail: [email protected].
32
δ13C STRATIGRAPHY OF THE CHUAR GROUP (ca. 770–742 Ma), GRAND CANYON
Geological Society of America Bulletin, January/February 2005 33
Yu
Yu
Yu
ZYn
Zt
Zt
Zj
Zj
Zcc
Zcc
Zd
Za
Za
Zw ZdZcc
Zw
Zs
Zs
ZwZa
Za
Zw
Zcc
Zj
Zj
Zt
Yu
Yu
Pzu
Za
Zcc
Zd
ZaZd
Za
Za
Zw
Zcc
Zd
Zcb
Pzu
Pzu
Yu
Pzu
Zj
Butte Fault ZoneChuar Syncline
Pzu
Navajo IndianReservation
NankoweapButte
Zt
3
4a
7
1a
1b
4b
6
5
Zs
Zcb
8
9b
9a
9c
11
10
WalhallaPlateau
Zcb
Zcb
Zcb
Zcb
Pal
isad
es o
f the
Des
ert
Sixtymile
Canyon
AwatubiCyn.
Kwagunt
Creek
Nanko
weap Creek
LavaChuar Ck.
Basalt Creek
Colorado River
Little Colorado River
2
Za
112oW
ARIZONA
major fault (ball on hanging wall)
syncline axis
monocline axis
Pzu
Carbon Butte Member
Duppa Member
Carbon Canyon MemberZcc
Zd
Zcb
Nankoweap Formation
Za
Zw
Zj
Zt
Zs
Walcott Member
Awatubi Member
Sixtymile Formation
Tanner Member
Unkar GroupYu
ZYn
Jupiter Member
measured section localityand site number
bedding contact
N
10
0 1 2 km
butte, mesa, or plateau
minor fault (ball on hanging wall)
Paleozoic rocks undifferentiated
Ch
uar
Gro
up
EXPLANATION
36o15'N
Figure 1. Geologic map of the Chuar Group (modifi ed from Timmons et al., 2001) showing locations of measured sections.
DEHLER et al.
34 Geological Society of America Bulletin, January/February 2005
dolomite rich
dolomite poor
A
dolomite rich
dolomite poor
B
dolomite
dolomite
black shale
C
dolomite rich
dolomite poor
D
E
δ13C STRATIGRAPHY OF THE CHUAR GROUP (ca. 770–742 Ma), GRAND CANYON
Geological Society of America Bulletin, January/February 2005 35
beds (Figs. 2 and 3). Shale intervals contain a diverse assemblage of microfossils including acritarchs (e.g., Chuaria circularis) and the vase-shaped microfossil, Melanocyrillium (Fig. 3; Bloeser 1985; Vidal and Ford, 1985; Porter and Knoll, 2000). The age of the Chuar Group is ca. 770 Ma to 742 ± 6 Ma, based on U-Pb age determinations of shale-hosted authigenic mona-zite (Williams et al., 2003) and ash-hosted zircon (Karlstrom et al., 2000), respectively. The Chuar Group rests unconformably upon the Nankoweap Formation and is unconformably overlain by the Sixtymile Formation (~30 m thick), which con-tains a narrow incised paleovalley (~15 m deep) inferred to represent Sturtian-age (750–700 Ma), or younger, base-level fall (Timmons et al., 2001; Dehler et al., 2001a).
Stratigraphy, Facies, and Cycle Interpretations in the Chuar Group
The Chuar Group consists of the Galeros and overlying Kwagunt formations. The contact between the two formations is at the base of the prominent, thick sandstone unit (Fig. 3; Ford and Breed, 1973). The Galeros Formation is divided into the Tanner, Jupiter, Carbon Canyon, and Duppa members; the Kwagunt Formation is divided into the Carbon Butte, Awatubi, and Walcott members (Ford and Breed, 1973).
The facies in the Chuar Group indicate wave- and tide-infl uenced, relatively deep to shallow subtidal and peritidal marine environ-ments (Dehler et al., 2001a). The sandstone and dolomite beds exhibit laminations, mudcracks, and mudcrack casts. The sandstone beds show reverse-fl ow indicators, mud-draped and mud-
cracked symmetrical ripplemarks, and rare HCS. The dolomites are dominantly fi nely crystalline, are commonly crinkly laminated and have four different types of stratigraphically distinctive stromatolitic complexes. There are also dolomitic to silicifi ed oolitic grainstones and rare coarsely crystalline dolomites in the lower and upper Chuar Group. The organic-rich and variegated shales (typically tens to hundreds of meters thick) are laminated to massive and are interpreted to represent the relatively deep-est water environments (below wave base).
Chuar facies record cyclic sedimentation at the meter scale and at the hundred-meter scale in a differentially subsiding intracratonic basin (Timmons et al., 2001; Dehler et al., 2001a). Meter-scale cycles in the Chuar Group (1–20 m thick) are composed of basal shale facies capped by either sandstone or dolomite facies. Cycles commonly exhibit shallowing upward from sub-tidal marine to peritidal environments, and some dolomite cycle caps exhibit subaerial exposure features. Meter-scale cycles are interpreted to be high frequency (104–105 years) and controlled by glacioeustasy, with some tectonic modifi cation of cycles due to syndepositional faulting and related differential subsidence (Dehler et al., 2001a).
Four lithostratigraphic sequences (tens to hundreds of meters thick) are recognized by Dehler et al. (2001a); each sequence consisting of dolomite-poor (0%–<1% of interval thick-ness is dolomite) and dolomite-rich (5%–40% of interval thickness is dolomite) intervals (Figs. 2 and 3; Dehler, 2001). The dolomite beds in the dolomite-rich interval typically show evidence of subaerial exposure (e.g., microkarst features, karst-collapse features, cm- to m-scale
dessication cracks, iron-oxidized bed tops) and represent prolonged subaerial exposure surfaces associated with subtle sea-level fall (Dehler et al., 2001a). These sequences are interpreted to be controlled by longer-term (m.y. scale) wet-ter-to-drier climate changes and subtle long-term sea-level changes.
METHODS
Sampling Selection and Preparation
Shales and dolomites were collected (avoid-ing fractures, veins, and silicifi ed and oxidized zones) from all members of the Chuar Group except the interbedded quartz-arenite and oxidized shales of the Carbon Butte Member (Fig. 3). Stratigraphic spacing for all sample types was on the order of three meters (Fig. 3). Members were sampled in two different locali-ties (>10 km apart) where possible, and marker beds were sampled along strike to evaluate lat-eral consistency of δ13C values (Figs. 1 and 3).
Conventional and cathodoluminescence (CL) petrographic methods were used to determine sample quality and the diagenetic history of carbonate rocks (e.g., Fairchild et al., 1990; Kaufman et al., 1991; Kaufman and Knoll, 1995). Whole-rock powders (<200 mesh) were generated from samples that showed homo-geneous dull to moderate luminescence and primary textures (e.g., laminations, fi nely crys-talline). Whenever possible, primary features such as ooids, intraclasts, and laminations were sampled by microdrilling. Both whole-rock and microdrilled powders were taken from a subset of samples to compare resultant geochemistry.
Shales were analyzed for δ13Corg
values and TOC, and all carbonate powders were analyzed for δ13C
dol and δ18O
dol values. To prepare shale
samples for C-isotope analysis of organic matter, rock chips were cleaned in 10% HCl, then dried and powdered to <200 mesh. The powders were digested in 10% HCl until all carbonate was dissolved, then rinsed with deionized water and dried. Dolomite compositions (Ca, Mg, Mn, Fe, and Sr) were determined from a subset of samples representative of all dolomite facies. A subset of whole-rock dolomite powders was dissolved in HCl and the insoluble residues were analyzed for organic δ13C (δ13C
insol, e.g., Kah et al., 1999).
TOC was determined by evolved CO2 volume
(Strauss et al., 1992b) and by EA-IRMS using a Carlo Erba Elemental Analyzer coupled to the Finnigan Mat Delta Plus XL. Procedural carbon blanks were less than the equivalent of 0.01 wt% of samples. To ensure that sample/blank carbon values exceeded 10, only measured sample concentrations ≥0.1 wt% were included in the interpretations. Powdered dolomite samples
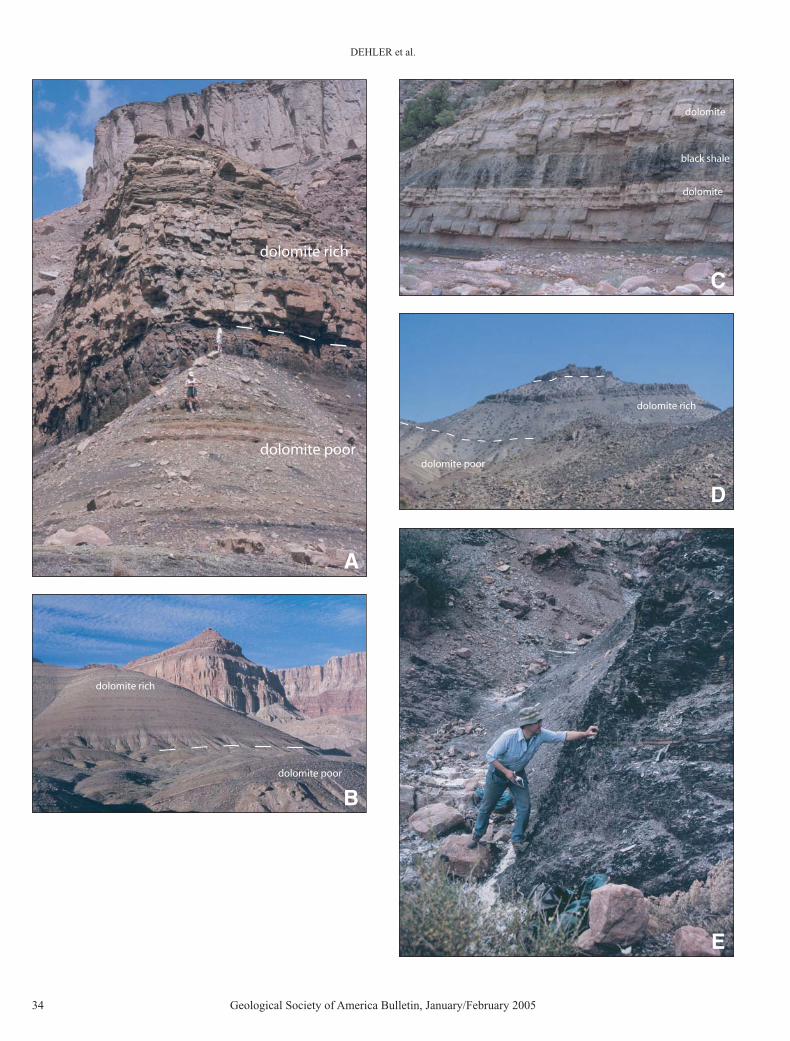
Figure 2. (A) Photograph showing part of measured section 11 in the lower Chuar Group—the contact between the Tanner and Jupiter members of the Chuar Group. The majority of the Tanner Member is considered a dolomite-poor part of a lithostratigraphic sequence and shows signifi cant variability in δ13C values (gray shale slope with sandstone interbeds). The basal Jupiter Member, shown in this picture as the blocky lighter colored beds, is a dolo-mite-rich interval and records near-zero primary δ13C values. Susannah Porter and Shari Kelley for scale. (B) Photograph of part of measured section 9a, and identifi cation of dolo-mite-poor to dolomite-rich intervals in the middle Chuar Group. The dolomite-poor inter-val corresponds to the majority of the Jupiter Member. The dolomite-rich interval corre-sponds with the Carbon Canyon Member—neither interval is shown in entirety. The contact between intervals (and members) is gradational. Total thickness of outcrop in photograph is ~350 m. (C) Photograph showing a dolomite-rich interval in the Carbon Canyon Member. Note the interbedding between black shale and dolomite. This allowed isotope analyses of both organic and carbonate carbon. (D) Photograph of Nankoweap Butte showing ~400 m of the upper Chuar Group, the corresponding dolomite-poor/dolomite-rich intervals, and Nankoweap Canyon measured section (see Fig. 3). The top of the Chuar Group is shown by the upper dashed white line. (E) Photograph showing highly organic-rich black shales of the Walcott Member and corresponding dolomite-rich interval. δ13C
org values from this interval
exhibit a narrow range from –28 to –24‰. Andy Knoll for scale.
DEHLER et al.
36 Geological Society of America Bulletin, January/February 2005
δδ
δ
δδ
∆δ∆δ
Fig
ure
3. C
ompo
site
str
atig
raph
ic s
ecti
on a
nd c
orre
spon
ding
C-i
soto
pe d
ata
from
two
mea
sure
d se
ctio
ns o
f the
Chu
ar G
roup
. Iso
topi
c da
ta p
rese
nted
incl
ude
orga
nic-
carb
on
data
fro
m o
rgan
ic-r
ich
shal
es a
nd i
nsol
uble
res
idue
s, a
nd i
norg
anic
-car
bon
data
fro
m d
olom
ites
. See
exp
lana
tion
for
defi
nit
ion
of s
ymbo
ls. M
easu
red
sect
ions
for
iso
topi
c sa
mpl
ing
wer
e gr
oupe
d in
to t
wo
com
posi
te s
ecti
ons
base
d on
ava
ilabl
e ou
tcro
p di
stri
buti
on o
f m
embe
rs. *
The
Lav
a C
huar
/Six
tym
ile s
ecti
on in
clud
es s
ites
10,
9a,
and
8 f
rom
F
igur
e 1.
**T
he N
anko
wea
p/B
asal
t se
ctio
n in
clud
es s
ites
11,
1a,
4a,
and
4b
from
Fig
ure
1. B
est-
fi t e
nvel
opes
are
qua
litat
ive
and
excl
ude
obvi
ous
outl
ying
val
ues.

δ13C STRATIGRAPHY OF THE CHUAR GROUP (ca. 770–742 Ma), GRAND CANYON
Geological Society of America Bulletin, January/February 2005 37
(10 mg) for isotopic analyses were reacted with 100% phosphoric acid in a vacuum at 50 °C for 8 h (McCrea, 1950). The CO
2 evolved was purifi ed
cryogenically and measured on a Finnigan Mat Delta E and (or) Plus XL mass spectrometer. Oxygen isotope data were corrected using the carbonate-phosphoric acid fractionation factor of 1.0106 (Rosenbaum and Shepard, 1986). Micro-drilled powders were dissolved in 2% HNO
3 and
analyzed for cations on a Perkin Elmer-Sciex Elan 6000 ICP-MS using internal standards of Ir and Rh. All stable isotopic data are reported relative to the Peedee belemnite (PDB) carbon-ate standard and are expressed in the δ notation. Precision of analyses is within 0.1‰ for carbon and 0.3‰ for oxygen based on multiple analyses of internal standards and duplicate samples. The Carrara Marble laboratory standard used in this study (δ13C = 1.95‰ and δ18O = 2.2‰) was cali-brated against NBS19.
Complete characterization of the bulk chem-istry and mineralogy of Chuar Group shales includes bulk chemical analysis of major and minor elements by X-ray fl uorescence (XRF), bulk X-ray diffraction (XRD) of whole rock powders, selective clay mineral analysis by XRD of <2 µm separates, rare-earth element (REE) analysis of select samples by ICP-MS and petrographic analysis by backscattered electron microscopy (BSEM). Bulk chemi-cal and mineralogical data are used as input to determine mineral abundances (mode) by linear programming (LPNORM, Caritat et al., 1994). Details of analytical methods and error estimates are given in Bloch et al. (1999). REE and minor element analyses (Rb, Sr, Y, Zr, Nb, Ba, Th, U) were done by ICP-MS on whole-rock digestions (HF and HNO
3) using standard
addition to correct for matrix effects. Analytical details are given in Jenner et al. (1990). BSEM was done on carbon-coated, polished sections using a JEOL 5800LV SEM equipped with an annular 2 kV-threshold BSE detector. Operating conditions were 20 kV, 75 mA fi lament current, spot size 12 µm, and a working distance of ~10 mm. The SEM is equipped with an Oxford ISIS 300 ultra-thin window EDS detector for mineral and matrix characterization.
RESULTS
Evaluation of Sample Alteration
δ13C values from 263 shale samples and 67 dolomite samples from the Chuar Group are similar to those observed from other Neopro-terozoic successions (Tables DR1 and DR21, Fig. 2; cf. Knoll et al., 1986; Kaufman and Knoll, 1995; Hill and Walter, 2000) and are interpreted to represent dominantly primary values based
on the diagenetic assessments described below. Still, ~10% of the samples were interpreted to be altered (i.e., no longer exhibiting primary δ13C values) and are either shown in the fi gures with different symbols or fall outside our best-fi t envelope (Figs. 3 and 4).
A series of diagenetic tests have been devel-oped to assess the degree of diagenetic altera-tion of carbonate rocks (Brand and Veizer, 1980; Brand and Veizer, 1981; Veizer 1983; Banner et al., 1988) and many have been applied to che-mostratigraphic studies of Precambrian rocks, such as using δ18O, Mn, Fe, and Sr analyses, and comparing the differences between δ13C
org
and δ13Cdol
(∆δ13C) (e.g., Knoll et al., 1986; Kaufman et al., 1991; Derry et al., 1992; Kaufman and Knoll, 1995; Kah et al., 1999; Corsetti and Kaufman, 2003). Tests have also been suggested for assessing the degree of alter-ation of organic matter such as H/C ratios and TOC concentrations (Hayes, 1983; Knoll et al., 1986; Kaufman and Knoll, 1995; DesMarais, 1997). Intrabasinal isotopic correlation is also an important tool to test local versus regional δ13C values (e.g., Knoll et al., 1986; Kaufman and Knoll, 1995). The results of these tests allow for an evaluation of overall sample quality and the extent to which the C-isotopic composi-tion of each sample has been altered, although we found that some individual test results were not refl ective of alteration of Chuar samples.
δ18O Analysisδ18O values from Chuar carbonates range
from –8.8 to –0.5‰ (−4‰ average, PDB). About 65% of δ18O values are >–5‰ and fall into the category of “least altered” according to Kaufman and Knoll (1995), and no values are less than –10‰, which Kaufman and Knoll (1995) consider unacceptable for C-isotope analysis (Fig. 5, Table DR2). A comparison of values from microdrilled powders with values from whole-rock powders typically show little to no difference in δ18O and especially δ13C values (difference ranges from 0.12 to 1.29‰ and 0.03 and 1.06‰, respectively; Fig. 5A), indicating that most whole-rock isotope analyses capture the representative isotope values of these Chuar rocks. In comparing δ18O values with δ13C values, a weak trend suggests that the lowest δ18O and δ13C values might represent alteration (Fig. 5B; e.g., Fairchild et al., 1990; Kaufman and Knoll, 1995). However, the lowest δ18O values do not
consistently correlate with high Mn/Sr ratios or high Mn concentrations, suggesting that either Mn concentrations likely increased during early rather than late diagenesis or that Mn concentra-tions were controlled by bulk rock chemistry or both (Fig. 6). Therefore, the lowest δ18O values are not consistent with trends indicating exten-sive diagenetic alteration.
Mn, Fe, and Sr AnalysesThe concentrations of Mn and Fe typically
increase and the concentration of Sr typically decreases during diagenetic recrystallization of calcite (Brand and Veizer, 1980; Brand and Veizer, 1981; Lorens, 1981; Banner and Hanson, 1990). For Proterozoic carbonates, low Mn/Sr mean abundance ratios (<2, <3, <8, <10, Derry et al., 1992; Kaufman et al., 1993; Knoll et al., 1995a; Kaufman and Knoll, 1995, respectively) are interpreted to indicate unaltered or “least-altered” carbonates that retain their primary C-isotope compositions. Chuar dolomites exhibit a range of Mn/Sr values from 0.8 to 45.7 (10.9 average, Table DR2). About 60% of analyzed samples have Mn/Sr values <10 and no correlation exists between Mn/Sr values and δ18O (Fig. 6). No par-ticular Mn/Sr value defi nes a threshold between “least-altered” and “more-altered” Chuar dolo-mites. Four extremely high Mn/Sr values might indeed refl ect more substantial alteration; how-ever, these high values, when plotted in strati-graphic order, have δ13C values that are similar to those of adjacent samples that contain Mn/Sr <10 (Fig. 3) and also correspond to a wide range of δ18O values (Figs. 3 and 5). These relationships indicate that primary C-isotope trends may be preserved despite potential diagenetic alteration, probably because the carbon was abundant rela-tive to carbon in diagenetic fl uids.
TOC of Shales and Insoluble ResiduesTOC
org values in the Chuar Group range
from 0.01 to 9.4 wt% and TOCinsol
values range between <.01 to ≤1.2 wt%. TOC
org values >~1%
are associated with δ13C values dominantly between –24 and –29‰, and TOC values <1% are associated with δ13C values that range from −13 to −33‰ (Fig 7; Table DR1). Samples with TOC
org values <0.1% typically plot in the same
place on the stratigraphic δ13C curve as samples with TOC
org values >0.1% (Fig. 3). These trends
indicate that samples with TOCorg
values <1% and as low as <0.1% may preserve primary δ13C values. To insure the ratio of real sample carbon to blank carbon was at least 10 or more, we do not include in the interpretations any isotope data for samples having TOC values less than 0.1 wt%. All but 7 insoluble residue samples had TOC
insol values ≤0.1 wt% and were therefore not
used for interpretation. TOCinsol
values >0.1 wt%
1GSA Data Repository item 2005020, C-isotope data from Chuar Group Shales and dolomites, and bulk chemical data and calculated modes from Chuar Group shales, is available on the Web at http://www.geosociety.org/pubs/ft2005.htm. Requests may also be sent to [email protected].
DEHLER et al.
38 Geological Society of America Bulletin, January/February 2005
δ13C
carb
(0/0
0 P
DB
)-4
-20
24
68
10
-6
TannerMemberJupiter Member
Carbon CanyonMember
DuppaMember
CarbonButteMbr.
AwatubiMember
WalcottMember
qu
art
z
illi
te ka
oli
nit
e
p
m
10
07
55
02
50
Min
era
log
y (
cu
mu
lati
ve w
t %
)C
IA
60
90
70
80
no
da
ta
no
da
ta
no
da
ta
20
0
10
0
0
124 3
do
lom
ite
ab
un
da
nc
e
E D B ACδ13
Cfe
atu
res
red s
andsto
ne
TannerMemberJupiter Member
Carbon CanyonMember
DuppaMember
CarbonButteMbr.
AwatubiMember
WalcottMember
C
742+
6 M
a
1070+
70 M
a
?
Stra
tifer
a/In
zeria
Tanner
dolo
mite
Baic
alia
poly
gonal bed
flaky d
olo
mite
dolo
mite c
ouple
t
ka
rste
d d
olo
mite
Tap
eats
San
dsto
ne
Six
tym
ileF
orm
ation
Baic
alia
/Box
.
~760 M
a
Neo Mesoprot.
UnkarGroup
(upper)Cardenas
Basalt
Na
nk
ow
ea
pF
orm
ati
on
Kwagunt Formation Galeros Formation
Chuar GroupMiddle Neoproterozoic
~770 M
a
xx
xx
lith
os
tra
tig
rap
hic
se
qu
en
ce
s
wet(warm)
dry(cool)
cli
ma
tein
terp
reta
tio
n
qu
art
z
no
da
ta
no
da
ta
no
da
ta
no
da
ta
no
da
ta
-28
-26
-24
-22
-20
-18
-16
-14
δ13C
org
(0/0
0 P
DB
)
-30
-32
-34 C
om
po
sit
e C
urv
e
m
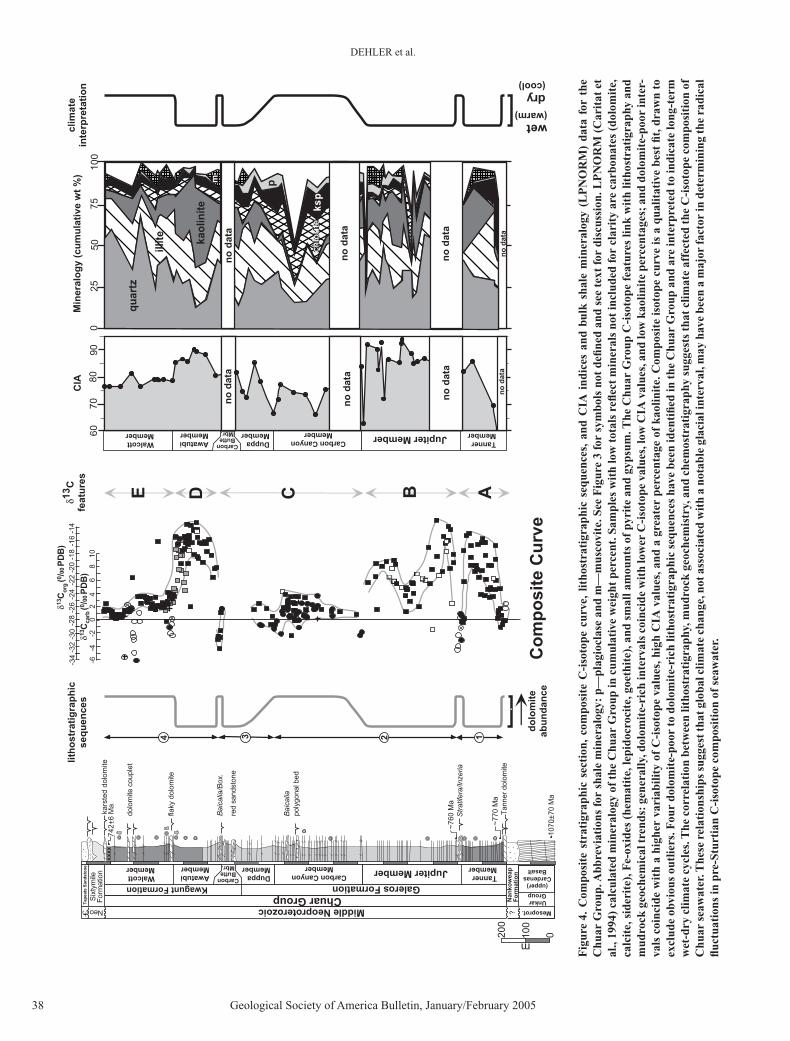
Fig
ure
4. C
ompo
site
str
atig
raph
ic s
ecti
on,
com
posi
te C
-iso
tope
cur
ve,
litho
stra
tigr
aphi
c se
quen
ces,
and
CIA
ind
ices
and
bul
k sh
ale
min
eral
ogy
(LP
NO
RM
) da
ta f
or t
he
Chu
ar G
roup
. Abb
revi
atio
ns fo
r sh
ale
min
eral
ogy:
p—
plag
iocl
ase
and
m—
mus
covi
te. S
ee F
igur
e 3
for
sym
bols
not
defi
ned
and
see
tex
t fo
r di
scus
sion
. LP
NO
RM
(C
arit
at e
t al
., 19
94)
calc
ulat
ed m
iner
alog
y of
the
Chu
ar G
roup
in c
umul
ativ
e w
eigh
t pe
rcen
t. S
ampl
es w
ith
low
tot
als
refl e
ct m
iner
als
not
incl
uded
for
clar
ity
are
carb
onat
es (
dolo
mit
e,
calc
ite,
sid
erit
e), F
e-ox
ides
(he
mat
ite,
lepi
docr
ocit
e, g
oeth
ite)
, and
sm
all a
mou
nts
of p
yrit
e an
d gy
psum
. The
Chu
ar G
roup
C-i
soto
pe f
eatu
res
link
wit
h lit
host
rati
grap
hy a
nd
mud
rock
geo
chem
ical
tren
ds: g
ener
ally
, dol
omit
e-ri
ch in
terv
als
coin
cide
wit
h lo
wer
C-i
soto
pe v
alue
s, lo
w C
IA v
alue
s, a
nd lo
w k
aolin
ite
perc
enta
ges;
and
dol
omit
e-po
or in
ter-
vals
coi
ncid
e w
ith
a hi
gher
var
iabi
lity
of C
-iso
tope
val
ues,
hig
h C
IA v
alue
s, a
nd a
gre
ater
per
cent
age
of k
aolin
ite.
Com
posi
te is
otop
e cu
rve
is a
qua
litat
ive
best
fi t,
dra
wn
to
excl
ude
obvi
ous
outl
iers
. Fou
r do
lom
ite-
poor
to d
olom
ite-
rich
lith
ostr
atig
raph
ic s
eque
nces
hav
e be
en id
enti
fi ed
in th
e C
huar
Gro
up a
nd a
re in
terp
rete
d to
indi
cate
long
-ter
m
wet
-dry
clim
ate
cycl
es. T
he c
orre
lati
on b
etw
een
litho
stra
tigr
aphy
, mud
rock
geo
chem
istr
y, a
nd c
hem
ostr
atig
raph
y su
gges
ts t
hat
clim
ate
affe
cted
the
C-i
soto
pe c
ompo
siti
on o
f C
huar
sea
wat
er. T
hese
rel
atio
nshi
ps s
ugge
st th
at g
loba
l clim
ate
chan
ge, n
ot a
ssoc
iate
d w
ith
a no
tabl
e gl
acia
l int
erva
l, m
ay h
ave
been
a m
ajor
fact
or in
det
erm
inin
g th
e ra
dica
l fl u
ctua
tion
s in
pre
-Stu
rtia
n C
-iso
tope
com
posi
tion
of
seaw
ater
.
δ13C STRATIGRAPHY OF THE CHUAR GROUP (ca. 770–742 Ma), GRAND CANYON
Geological Society of America Bulletin, January/February 2005 39
correspond to δ13C values between −25.3 and −27.9‰ and likely record primary values (Fig. 3, Table DR2). The interpretation that the majority of TOC values from Chuar organic carbon may preserve primary δ13C values is consistent with the interpretation of minimal thermal alteration;
an interpretation also supported by high H/C ratios of Chuar rocks (0.49–0.93; Strauss et al., 1992a; Summons 1992).
∆δ13C of Dolomites, Shales, and Insoluble Residues
In general, equilibrium ∆δ13C values in rocks throughout geologic time average between 25 and 32‰ and refl ect the effects of biologi-cal isotopic fractionation (Schidlowski et al., 1975; Knoll et al., 1986; Lambert et al., 1987; DesMarais et al., 1992; Narbonne et al., 1994; Knoll et al., 1995b; Hayes et al., 1999). These variations in ∆δ13C values might represent differ-ences in pCO
2 availability and (or) in the kinetic
properties of the CO2-fi xing enzymes (Kaufman
and Knoll, 1995; DesMarais, 1997; Hayes et al., 1999). Hayes et al. (1999) show global ∆δ13C val-ues for the time period between 800 and 750 Ma ranging between 28 and 32‰, with ∆δ13C values increasing to >32‰ at 752 Ma and 740–732 Ma. If Chuar rocks record primary global ∆δ13C val-ues, they should refl ect similar values.
The ∆δ13Cdol-org
(dolomite and mudrock) val-ues from the Chuar Group samples range from 12.0 to 31.2‰ with an average value of 28‰ (Tables DR1 and DR2, Fig. 3). ∆δ13C
dol-org values
<~25‰ typically correspond to relatively low δ13C
dol values (Fig. 3, Table DR2). Three of the
lowest δ13Cdol
values (<–5‰) are from organic-rich dolomite beds and densely fossiliferous dolomite concretions that are interbedded with pyritic organic-rich shales in the Walcott Mem-ber at the Sixtymile Canyon locality (Porter and Knoll, 2000; Fig. 3). The mass balance of the exogenic carbon cycle will not allow for open marine C-isotope values this low, except dur-ing increased weathering rates of sedimentary organic matter, relative to those of carbonates. Therefore, these dolomites most probably formed in either a restricted environment (i.e., local, unmixed), simultaneously with organic-matter oxidation, or both (Irwin et al., 1977; Derry et al., 1992). Additionally, the tight clus-tering of δ13C
org values in this same stratigraphic
interval suggest that the δ13Corg
values are likely primary (Figs. 3 and 4), and the ∆δ13C values for this interval are dominantly <25‰, which is not consistent with Hayes et al.’s (1999) ∆δ13C assessment of this time interval. In the basal Jupiter Member, dolomites with δ13C
dol values
as low as –4.2‰ are intimately interbedded with
B
A
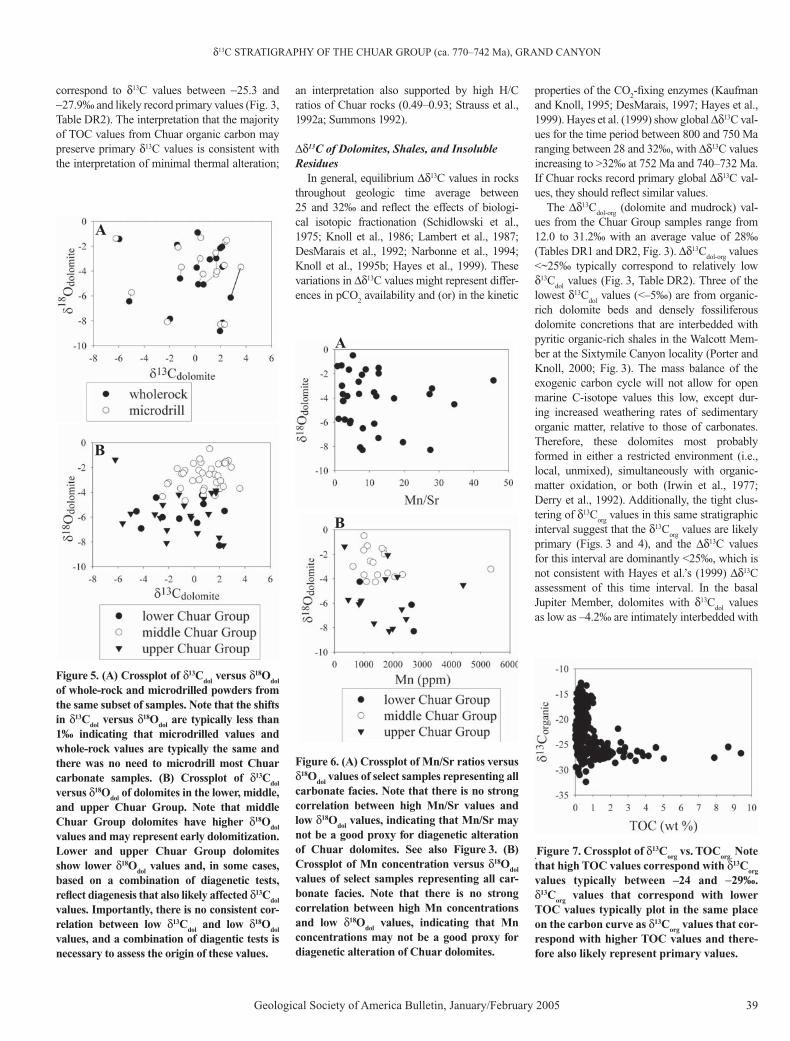
Figure 5. (A) Crossplot of δ13Cdol
versus δ18Odol
of whole-rock and microdrilled powders from the same subset of samples. Note that the shifts in δ13C
dol versus δ18O
dol are typically less than
1‰ indicating that microdrilled values and whole-rock values are typically the same and there was no need to microdrill most Chuar carbonate samples. (B) Crossplot of δ13C
dol
versus δ18Odol
of dolomites in the lower, middle, and upper Chuar Group. Note that middle Chuar Group dolomites have higher δ18O
dol
values and may represent early dolomitization. Lower and upper Chuar Group dolomites show lower δ18O
dol values and, in some cases,
based on a combination of diagenetic tests, refl ect diagenesis that also likely affected δ13C
dol
values. Importantly, there is no consistent cor-relation between low δ13C
dol and low δ18O
dol
values, and a combination of diagentic tests is necessary to assess the origin of these values.
A
B
Figure 6. (A) Crossplot of Mn/Sr ratios versus δ18O
dol values of select samples representing all
carbonate facies. Note that there is no strong correlation between high Mn/Sr values and low δ18O
dol values, indicating that Mn/Sr may
not be a good proxy for diagenetic alteration of Chuar dolomites. See also Figure 3. (B) Crossplot of Mn concentration versus δ18O
dol
values of select samples representing all car-bonate facies. Note that there is no strong correlation between high Mn concentrations and low δ18O
dol values, indicating that Mn
concentrations may not be a good proxy for diagenetic alteration of Chuar dolomites.
.Figure 7. Crossplot of δ13C
org vs. TOC
org. Note
that high TOC values correspond with δ13Corg
values typically between –24 and −29‰. δ13C
org values that correspond with lower
TOC values typically plot in the same place on the carbon curve as δ13C
org values that cor-
respond with higher TOC values and there-fore also likely represent primary values.
DEHLER et al.
40 Geological Society of America Bulletin, January/February 2005
shales with δ13Corg
values of ~–28‰ (Fig. 3). The ∆δ13C for most of these values are ~<25‰, which is low for this time in the Neoproterozoic (Hayes et al., 1999). These δ13C
dol values were
also likely shifted to more negative values during local organic-matter oxidation and (or) restricted conditions. Other dolomites, mostly in the middle Chuar Group, show ∆δ13C
dol-org of ~28‰,
which is consistent with Hayes et al.’s (1999) assessment that global ∆δ13C was ~28‰ during this time interval (800–750 Ma). Therefore, it appears that most negative δ13C
dol values in the
Chuar Group apparently indicate that diagenesis caused a negative carbon isotopic shift, whereas most shales and the dolomites having relatively higher δ13C
dol values (~–1–4‰) have remained
relatively unaffected by diagenetic processes.Insoluble residues from carbonates (with
TOC >0.1 wt%) exhibit ∆δ13Cdol-insol
values in the range 19–30‰. The higher ∆δ13C
dol-insol values,
those >25‰, are from the middle Chuar Group and are interpreted to refl ect near- primary to primary values (e.g., Knoll et al., 1986; Kaufman and Knoll, 1995; Hayes et al., 1999; Figs. 2 and 5B, Table DR2). The lower ∆δ13C
dol-
insol values are from the upper Chuar Group and
refl ect alteration. Assuming that the least altered δ13C
insol values are those that are similar to the
δ13Corg
values of the interbedded shales, one concludes that the dolomites are probably more extensively altered isotopically. ∆δ13C
dol-insol val-
ues between 9.7 and 31.2‰ are observed from samples with TOC values <1.0 wt%, and many likely refl ect primary values.
Intrabasinal Isotopic CorrelationThe two composite sections can be correlated
using δ13Corg
data, some of the δ13Cdol
data, and the nine marker beds (Figs. 3 and 4). Meter-scale shale marker beds show lateral isotopic variability of <0.2‰ (δ13C
org), and least-altered
dolomite marker beds show lateral variability of <0.4‰ (δ13C
dol) across ~10 km (Figs. 1 and
3, Tables DR1 and DR2), indicating little dif-ferential diagenesis between sections and dem-onstrating the excellent preservation of the δ13C record. Additionally, both composite sections exhibit overall similar C-isotope trends (Fig. 3).
Both measured sections of the Tanner Mem-ber show a similar range of δ13C
org variability
(<14‰), however the Lava Chuar section is incomplete due to covered intervals (Fig. 3). The δ13C
org values for the Lava Chuar Canyon Tanner
Member section exhibit scatter, yet the overall shift to more positive δ13C
org values and the
subsequent drop to values ~–28‰ is observed in both measured sections (Fig. 3). The δ13C
dol
values from the basal Tanner dolomite at the two different locales yield values of ~2‰, suggest-ing that either the carbon isotopes have not been
or have been equally altered by diagenetic pro-cesses. The δ13C
org values from the two measured
Jupiter Member sections correlate relatively well—both sections exhibit a rise to positive δ13C
org values at the base followed by a fall to
~–25‰. Both sections also show the ensuing rise to more positive values, although the Lava Chuar-east section is more complete. The δ13C
dol
values in the basal Jupiter show a large range of values at both sections, and values from the same horizon at the different sections do not correlate well, likely refl ecting diagenesis.
Intrabasinal correlation of the Carbon Canyon and Duppa members shows a general trend of δ13C
org values remaining between ~–29 and
–24‰, and interbedded δ13Cdol
values remaining between –2 and 4‰ with δ13C values in the Nan-koweap–Lava Chuar-east–Basalt section shifting toward more negative values near the Carbon Canyon/Duppa member contact (Fig. 3). In the middle and upper Awatubi and the Walcott mem-bers, intrabasinal correlation is strong and shows laterally reproducible variability in δ13C
org. The
basal Awatubi Member interval remains untested for intrabasinal δ13C
org correlation due to the lack
of sample data from the lower part of the Six-tymile canyon section, except for the basal stro-matolitic dolomite marker bed, which yielded a value of ~1.7‰ at both localities. The relatively positive values in the upper and middle Awatubi Member are likely primary. The majority of car-bonate from this interval in the Sixtymile section likely has not retained primary δ13C
dol values (see
above section on ∆δ13C, Fig. 3); however, values from the same bed at the two different localities do correlate (both ~2‰, “upper dolomite cou-plet” marker bed, Fig. 3).
The Composite Chuar C-curve
An isotopic curve was constructed using δ13Corg
and δ13C
dol values that we interpret to represent
the δ13C composition of Chuar seawater (Fig. 4). To construct this composite curve, we combined the δ13C
org data with the δ13C
dol data from the two
composite sections (Fig. 3). Although the major-ity of data points are δ13C
org values, all points
were plotted relative to both δ13Corg
and δ13Cdol
values to allow comparison with other Neopro-terozoic δ13C
carb data sets. We acknowledge that
the isotopic differences between coeval carbon-ates and organic carbon were not necessarily constant in the Neoproterozoic (e.g., Hayes et al., 1999). Where ∆δ13C
dol-org values were obtain-
able in the Chuar Group, these values fell within a well-defi ned range for most of the samples (Fig. 3, Tables DR1 and DR2, ∆δ13C
dol-org values
of ~25–30‰). The best fi t between data sets resulted in an average ∆δ13C
dol-org value of ~28‰,
which is consistent with other studies where both
δ13Corg
values and δ13Ccarb
values have been used to construct a C-isotope curve (Fig. 4; e.g., Knoll et al., 1986) and is also consistent with Hayes et al.’s (1999) observations that between ca. 800 and 750 Ma the ∆δ13C
org-carb values were typically
between ~28 and 32‰.
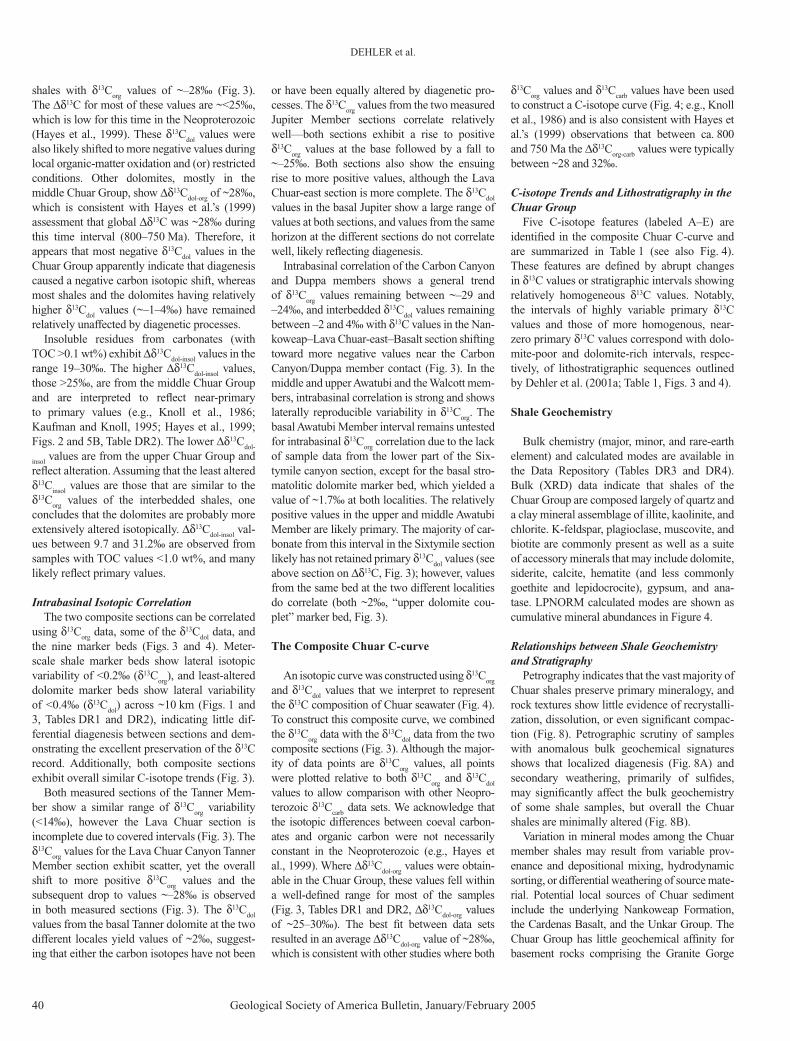
C-isotope Trends and Lithostratigraphy in the Chuar Group
Five C-isotope features (labeled A–E) are identifi ed in the composite Chuar C-curve and are summarized in Table 1 (see also Fig. 4). These features are defi ned by abrupt changes in δ13C values or stratigraphic intervals showing relatively homogeneous δ13C values. Notably, the intervals of highly variable primary δ13C values and those of more homogenous, near-zero primary δ13C values correspond with dolo-mite-poor and dolomite-rich intervals, respec-tively, of lithostratigraphic sequences outlined by Dehler et al. (2001a; Table 1, Figs. 3 and 4).
Shale Geochemistry
Bulk chemistry (major, minor, and rare-earth element) and calculated modes are available in the Data Repository (Tables DR3 and DR4). Bulk (XRD) data indicate that shales of the Chuar Group are composed largely of quartz and a clay mineral assemblage of illite, kaolinite, and chlorite. K-feldspar, plagioclase, muscovite, and biotite are commonly present as well as a suite of accessory minerals that may include dolomite, siderite, calcite, hematite (and less commonly goethite and lepidocrocite), gypsum, and ana-tase. LPNORM calculated modes are shown as cumulative mineral abundances in Figure 4.
Relationships between Shale Geochemistry and Stratigraphy
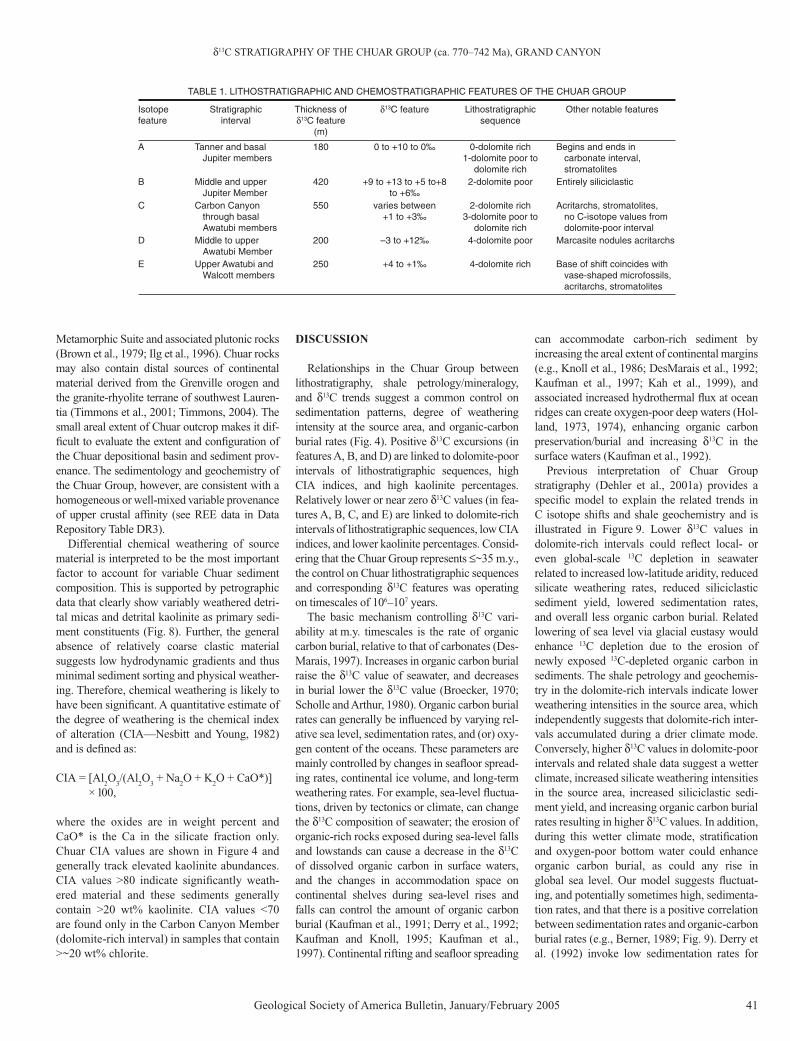
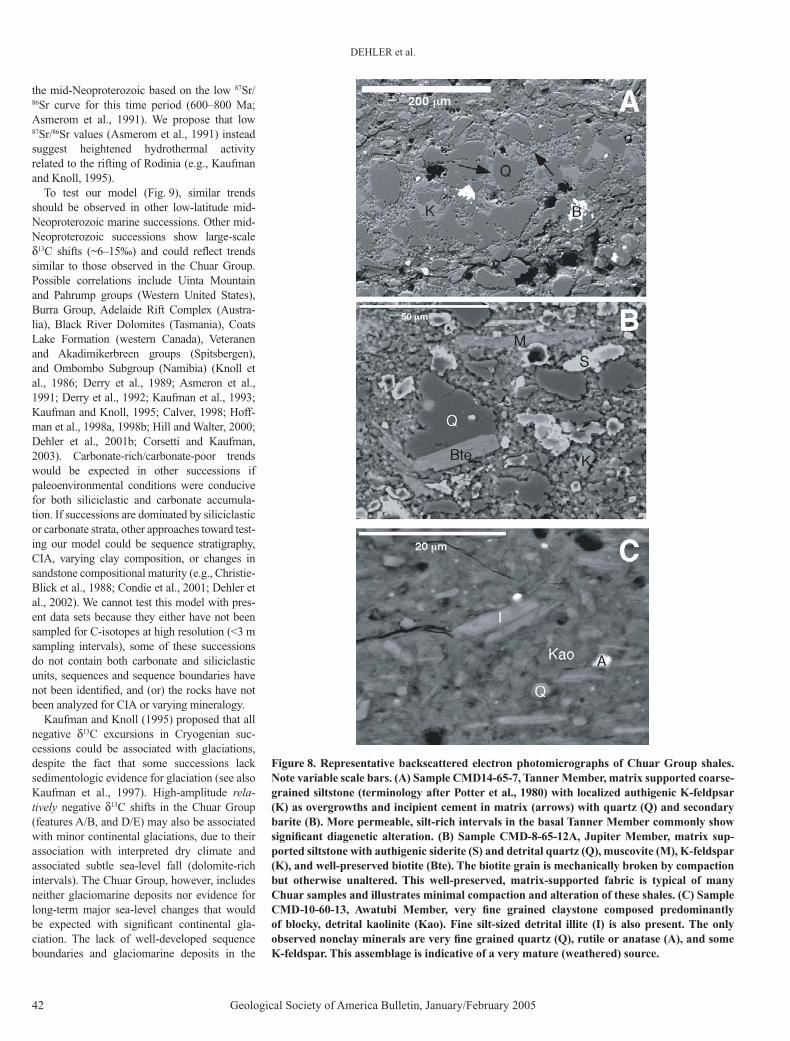
Petrography indicates that the vast majority of Chuar shales preserve primary mineralogy, and rock textures show little evidence of recrystalli-zation, dissolution, or even signifi cant compac-tion (Fig. 8). Petrographic scrutiny of samples with anomalous bulk geochemical signatures shows that localized diagenesis (Fig. 8A) and secondary weathering, primarily of sulfi des, may signifi cantly affect the bulk geochemistry of some shale samples, but overall the Chuar shales are minimally altered (Fig. 8B).
Variation in mineral modes among the Chuar member shales may result from variable prov-enance and depositional mixing, hydrodynamic sorting, or differential weathering of source mate-rial. Potential local sources of Chuar sediment include the underlying Nankoweap Formation, the Cardenas Basalt, and the Unkar Group. The Chuar Group has little geochemical affi nity for basement rocks comprising the Granite Gorge
δ13C STRATIGRAPHY OF THE CHUAR GROUP (ca. 770–742 Ma), GRAND CANYON
Geological Society of America Bulletin, January/February 2005 41
Metamorphic Suite and associated plutonic rocks (Brown et al., 1979; Ilg et al., 1996). Chuar rocks may also contain distal sources of continental material derived from the Grenville orogen and the granite-rhyolite terrane of southwest Lauren-tia (Timmons et al., 2001; Timmons, 2004). The small areal extent of Chuar outcrop makes it dif-fi cult to evaluate the extent and confi guration of the Chuar depositional basin and sediment prov-enance. The sedimentology and geochemistry of the Chuar Group, however, are consistent with a homogeneous or well-mixed variable provenance of upper crustal affi nity (see REE data in Data Repository Table DR3).
Differential chemical weathering of source material is interpreted to be the most important factor to account for variable Chuar sediment composition. This is supported by petrographic data that clearly show variably weathered detri-tal micas and detrital kaolinite as primary sedi-ment constituents (Fig. 8). Further, the general absence of relatively coarse clastic material suggests low hydrodynamic gradients and thus minimal sediment sorting and physical weather-ing. Therefore, chemical weathering is likely to have been signifi cant. A quantitative estimate of the degree of weathering is the chemical index of alteration (CIA—Nesbitt and Young, 1982) and is defi ned as:
CIA = [Al2O
3/(Al
2O
3 + Na
2O + K
2O + CaO*)]
× 100,
where the oxides are in weight percent and CaO* is the Ca in the silicate fraction only. Chuar CIA values are shown in Figure 4 and generally track elevated kaolinite abundances. CIA values >80 indicate signifi cantly weath-ered material and these sediments generally contain >20 wt% kaolinite. CIA values <70 are found only in the Carbon Canyon Member (dolomite-rich interval) in samples that contain >~20 wt% chlorite.
DISCUSSION
Relationships in the Chuar Group between lithostratigraphy, shale petrology/mineralogy, and δ13C trends suggest a common control on sedimentation patterns, degree of weathering intensity at the source area, and organic-carbon burial rates (Fig. 4). Positive δ13C excursions (in features A, B, and D) are linked to dolomite-poor intervals of lithostratigraphic sequences, high CIA indices, and high kaolinite percentages. Relatively lower or near zero δ13C values (in fea-tures A, B, C, and E) are linked to dolomite-rich intervals of lithostratigraphic sequences, low CIA indices, and lower kaolinite percentages. Consid-ering that the Chuar Group represents ≤~35 m.y., the control on Chuar lithostratigraphic sequences and corresponding δ13C features was operating on timescales of 106–107 years.
The basic mechanism controlling δ13C vari-ability at m.y. timescales is the rate of organic carbon burial, relative to that of carbonates (Des-Marais, 1997). Increases in organic carbon burial raise the δ13C value of seawater, and decreases in burial lower the δ13C value (Broecker, 1970; Scholle and Arthur, 1980). Organic carbon burial rates can generally be infl uenced by varying rel-ative sea level, sedimentation rates, and (or) oxy-gen content of the oceans. These parameters are mainly controlled by changes in seafl oor spread-ing rates, continental ice volume, and long-term weathering rates. For example, sea-level fl uctua-tions, driven by tectonics or climate, can change the δ13C composition of seawater; the erosion of organic-rich rocks exposed during sea-level falls and lowstands can cause a decrease in the δ13C of dissolved organic carbon in surface waters, and the changes in accommodation space on continental shelves during sea-level rises and falls can control the amount of organic carbon burial (Kaufman et al., 1991; Derry et al., 1992; Kaufman and Knoll, 1995; Kaufman et al., 1997). Continental rifting and seafl oor spreading
can accommodate carbon-rich sediment by increasing the areal extent of continental margins (e.g., Knoll et al., 1986; DesMarais et al., 1992; Kaufman et al., 1997; Kah et al., 1999), and associated increased hydrothermal fl ux at ocean ridges can create oxygen-poor deep waters (Hol-land, 1973, 1974), enhancing organic carbon preservation/burial and increasing δ13C in the surface waters (Kaufman et al., 1992).
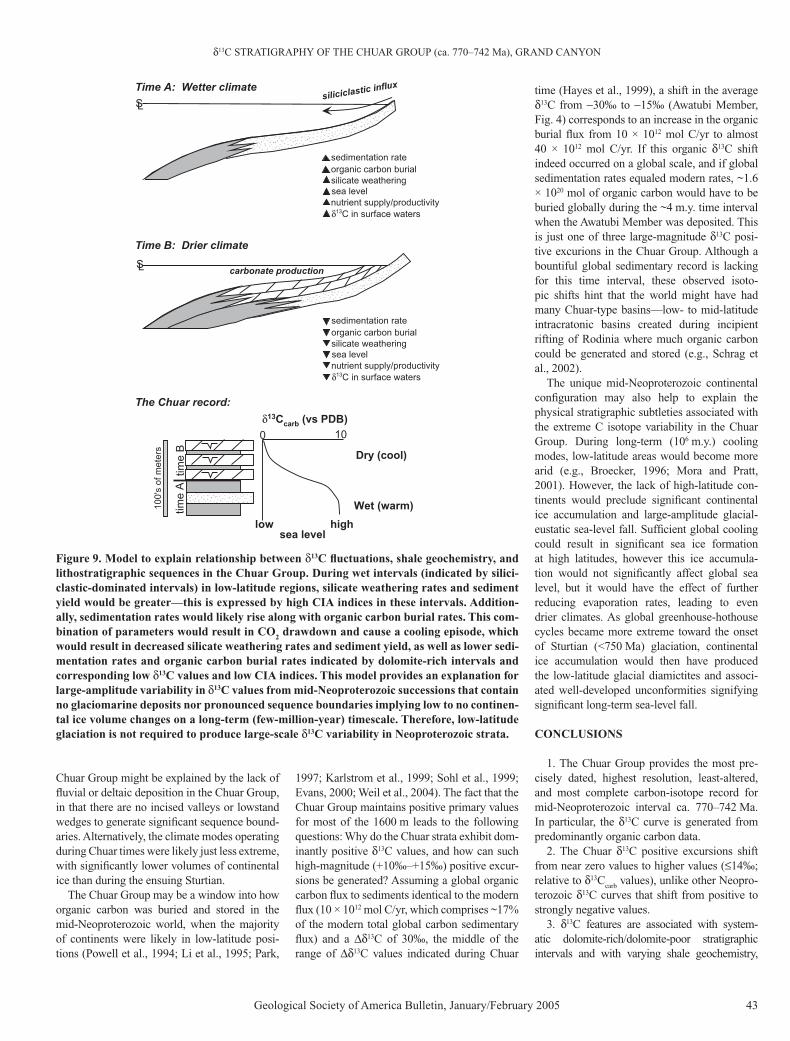
Previous interpretation of Chuar Group stratigraphy (Dehler et al., 2001a) provides a specifi c model to explain the related trends in C isotope shifts and shale geochemistry and is illustrated in Figure 9. Lower δ13C values in dolomite-rich intervals could refl ect local- or even global-scale 13C depletion in seawater related to increased low-latitude aridity, reduced silicate weathering rates, reduced siliciclastic sediment yield, lowered sedimentation rates, and overall less organic carbon burial. Related lowering of sea level via glacial eustasy would enhance 13C depletion due to the erosion of newly exposed 13C-depleted organic carbon in sediments. The shale petrology and geochemis-try in the dolomite-rich intervals indicate lower weathering intensities in the source area, which independently suggests that dolomite-rich inter-vals accumulated during a drier climate mode. Conversely, higher δ13C values in dolomite-poor intervals and related shale data suggest a wetter climate, increased silicate weathering intensities in the source area, increased siliciclastic sedi-ment yield, and increasing organic carbon burial rates resulting in higher δ13C values. In addition, during this wetter climate mode, stratifi cation and oxygen-poor bottom water could enhance organic carbon burial, as could any rise in global sea level. Our model suggests fl uctuat-ing, and potentially sometimes high, sedimenta-tion rates, and that there is a positive correlation between sedimentation rates and organic-carbon burial rates (e.g., Berner, 1989; Fig. 9). Derry et al. (1992) invoke low sedimentation rates for
TABLE 1. LITHOSTRATIGRAPHIC AND CHEMOSTRATIGRAPHIC FEATURES OF THE CHUAR GROUP
Isotope feature
Stratigraphic interval
Thickness of δ13C feature
(m)
δ13C feature Lithostratigraphic sequence
Other notable features
A Tanner and basal Jupiter members
180 0 to +10 to 0‰ 0-dolomite rich1-dolomite poor to
dolomite rich
Begins and ends in carbonate interval, stromatolites
B Middle and upper Jupiter Member
420 +9 to +13 to +5 to+8 to +6‰
2-dolomite poor Entirely siliciclastic
C Carbon Canyon through basal Awatubi members
550 varies between +1 to +3‰
2-dolomite rich3-dolomite poor to
dolomite rich
Acritarchs, stromatolites, no C-isotope values from dolomite-poor interval
D Middle to upper Awatubi Member
200 –3 to +12‰ 4-dolomite poor Marcasite nodules acritarchs
E Upper Awatubi and Walcott members
250 +4 to +1‰ 4-dolomite rich Base of shift coincides with vase-shaped microfossils, acritarchs, stromatolites
DEHLER et al.
42 Geological Society of America Bulletin, January/February 2005
the mid-Neoproterozoic based on the low 87Sr/86Sr curve for this time period (600–800 Ma; Asmerom et al., 1991). We propose that low 87Sr/86Sr values (Asmerom et al., 1991) instead suggest heightened hydrothermal activity related to the rifting of Rodinia (e.g., Kaufman and Knoll, 1995).
To test our model (Fig. 9), similar trends should be observed in other low-latitude mid-Neoproterozoic marine successions. Other mid-Neoproterozoic successions show large-scale δ13C shifts (~6–15‰) and could refl ect trends similar to those observed in the Chuar Group. Possible correlations include Uinta Mountain and Pahrump groups (Western United States), Burra Group, Adelaide Rift Complex (Austra-lia), Black River Dolomites (Tasmania), Coats Lake Formation (western Canada), Veteranen and Akadimikerbreen groups (Spitsbergen), and Ombombo Subgroup (Namibia) (Knoll et al., 1986; Derry et al., 1989; Asmeron et al., 1991; Derry et al., 1992; Kaufman et al., 1993; Kaufman and Knoll, 1995; Calver, 1998; Hoff-man et al., 1998a, 1998b; Hill and Walter, 2000; Dehler et al., 2001b; Corsetti and Kaufman, 2003). Carbonate-rich/carbonate-poor trends would be expected in other successions if paleoenvironmental conditions were conducive for both siliciclastic and carbonate accumula-tion. If successions are dominated by siliciclastic or carbonate strata, other approaches toward test-ing our model could be sequence stratigraphy, CIA, varying clay composition, or changes in sandstone compositional maturity (e.g., Christie-Blick et al., 1988; Condie et al., 2001; Dehler et al., 2002). We cannot test this model with pres-ent data sets because they either have not been sampled for C-isotopes at high resolution (<3 m sampling intervals), some of these successions do not contain both carbonate and siliciclastic units, sequences and sequence boundaries have not been identifi ed, and (or) the rocks have not been analyzed for CIA or varying mineralogy.
Kaufman and Knoll (1995) proposed that all negative δ13C excursions in Cryogenian suc-cessions could be associated with glaciations, despite the fact that some successions lack sedimentologic evidence for glaciation (see also Kaufman et al., 1997). High-amplitude rela-tively negative δ13C shifts in the Chuar Group (features A/B, and D/E) may also be associated with minor continental glaciations, due to their association with interpreted dry climate and associated subtle sea-level fall (dolomite-rich intervals). The Chuar Group, however, includes neither glaciomarine deposits nor evidence for long-term major sea-level changes that would be expected with signifi cant continental gla-ciation. The lack of well-developed sequence boundaries and glaciomarine deposits in the
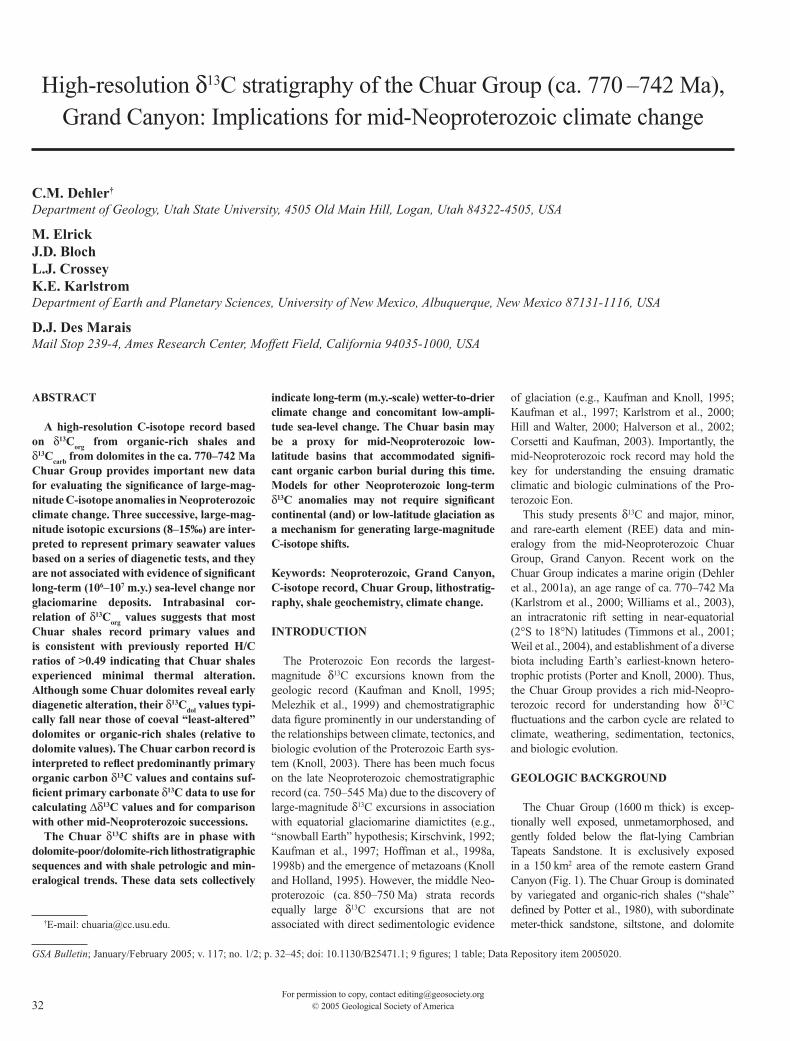
Figure 8. Representative backscattered electron photomicrographs of Chuar Group shales. Note variable scale bars. (A) Sample CMD14-65-7, Tanner Member, matrix supported coarse-grained siltstone (terminology after Potter et al., 1980) with localized authigenic K-feldpsar (K) as overgrowths and incipient cement in matrix (arrows) with quartz (Q) and secondary barite (B). More permeable, silt-rich intervals in the basal Tanner Member commonly show signifi cant diagenetic alteration. (B) Sample CMD-8-65-12A, Jupiter Member, matrix sup-ported siltstone with authigenic siderite (S) and detrital quartz (Q), muscovite (M), K-feldspar (K), and well-preserved biotite (Bte). The biotite grain is mechanically broken by compaction but otherwise unaltered. This well-preserved, matrix-supported fabric is typical of many Chuar samples and illustrates minimal compaction and alteration of these shales. (C) Sample CMD-10-60-13, Awatubi Member, very fi ne grained claystone composed predominantly of blocky, detrital kaolinite (Kao). Fine silt-sized detrital illite (I) is also present. The only observed nonclay minerals are very fi ne grained quartz (Q), rutile or anatase (A), and some K-feldspar. This assemblage is indicative of a very mature (weathered) source.
δ13C STRATIGRAPHY OF THE CHUAR GROUP (ca. 770–742 Ma), GRAND CANYON
Geological Society of America Bulletin, January/February 2005 43
Chuar Group might be explained by the lack of fl uvial or deltaic deposition in the Chuar Group, in that there are no incised valleys or lowstand wedges to generate signifi cant sequence bound-aries. Alternatively, the climate modes operating during Chuar times were likely just less extreme, with signifi cantly lower volumes of continental ice than during the ensuing Sturtian.
The Chuar Group may be a window into how organic carbon was buried and stored in the mid-Neoproterozoic world, when the majority of continents were likely in low-latitude posi-tions (Powell et al., 1994; Li et al., 1995; Park,
1997; Karlstrom et al., 1999; Sohl et al., 1999; Evans, 2000; Weil et al., 2004). The fact that the Chuar Group maintains positive primary values for most of the 1600 m leads to the following questions: Why do the Chuar strata exhibit dom-inantly positive δ13C values, and how can such high-magnitude (+10‰–+15‰) positive excur-sions be generated? Assuming a global organic carbon fl ux to sediments identical to the modern fl ux (10 × 1012 mol C/yr, which comprises ~17% of the modern total global carbon sedimentary fl ux) and a ∆δ13C of 30‰, the middle of the range of ∆δ13C values indicated during Chuar
time (Hayes et al., 1999), a shift in the average δ13C from −30‰ to −15‰ (Awatubi Member, Fig. 4) corresponds to an increase in the organic burial fl ux from 10 × 1012 mol C/yr to almost 40 × 1012 mol C/yr. If this organic δ13C shift indeed occurred on a global scale, and if global sedimentation rates equaled modern rates, ~1.6 × 10²⁰ mol of organic carbon would have to be buried globally during the ~4 m.y. time interval when the Awatubi Member was deposited. This is just one of three large-magnitude δ13C posi-tive excurions in the Chuar Group. Although a bountiful global sedimentary record is lacking for this time interval, these observed isoto-pic shifts hint that the world might have had many Chuar-type basins—low- to mid-latitude intracratonic basins created during incipient rifting of Rodinia where much organic carbon could be generated and stored (e.g., Schrag et al., 2002).
The unique mid-Neoproterozoic continental confi guration may also help to explain the physical stratigraphic subtleties associated with the extreme C isotope variability in the Chuar Group. During long-term (106 m.y.) cooling modes, low-latitude areas would become more arid (e.g., Broecker, 1996; Mora and Pratt, 2001). However, the lack of high-latitude con-tinents would preclude signifi cant continental ice accumulation and large-amplitude glacial-eustatic sea-level fall. Suffi cient global cooling could result in signifi cant sea ice formation at high latitudes, however this ice accumula-tion would not signifi cantly affect global sea level, but it would have the effect of further reducing evaporation rates, leading to even drier climates. As global greenhouse-hothouse cycles became more extreme toward the onset of Sturtian (<750 Ma) glaciation, continental ice accumulation would then have produced the low-latitude glacial diamictites and associ-ated well-developed unconformities signifying signifi cant long-term sea-level fall.
CONCLUSIONS
1. The Chuar Group provides the most pre-cisely dated, highest resolution, least-altered, and most complete carbon-isotope record for mid-Neoproterozoic interval ca. 770–742 Ma. In particular, the δ13C curve is generated from predominantly organic carbon data.
2. The Chuar δ13C positive excursions shift from near zero values to higher values (≤14‰; relative to δ13C
carb values), unlike other Neopro-
terozoic δ13C curves that shift from positive to strongly negative values.
3. δ13C features are associated with system-atic dolomite-rich/dolomite-poor stratigraphic intervals and with varying shale geochemistry,
Figure 9. Model to explain relationship between δ13C fl uctuations, shale geochemistry, and lithostratigraphic sequences in the Chuar Group. During wet intervals (indicated by silici-clastic-dominated intervals) in low-latitude regions, silicate weathering rates and sediment yield would be greater—this is expressed by high CIA indices in these intervals. Addition-ally, sedimentation rates would likely rise along with organic carbon burial rates. This com-bination of parameters would result in CO
2 drawdown and cause a cooling episode, which
would result in decreased silicate weathering rates and sediment yield, as well as lower sedi-mentation rates and organic carbon burial rates indicated by dolomite-rich intervals and corresponding low δ13C values and low CIA indices. This model provides an explanation for large-amplitude variability in δ13C values from mid-Neoproterozoic successions that contain no glaciomarine deposits nor pronounced sequence boundaries implying low to no continen-tal ice volume changes on a long-term (few-million-year) timescale. Therefore, low-latitude glaciation is not required to produce large-scale δ13C variability in Neoproterozoic strata.
SL carbonate production
sedimentation rate
organic carbon burial
δ13C in surface waters
silicate weathering
nutrient supply/productivity
sea level
Time B: Drier climate
siliciclastic influx
sedimentation rate
organic carbon burial
δ13C in surface waters
silicate weathering
nutrient supply/productivity
sea level
SL
Time A: Wetter climate
tim
e B
tim
e A
10
0's
of
me
ters
δ13Ccarb
(vs PDB)
0 10
sea levellow high
Wet (warm)
Dry (cool)
The Chuar record:
DEHLER et al.
44 Geological Society of America Bulletin, January/February 2005
indicating 106 m.y. wetter-to-drier climate changes and associated subtle long-term sea-level changes.
4. Dolomite-poor intervals correlate with low-to-high δ13C values, high CIA values, and increased kaolinite abundances. Dolo-mite-rich intervals are characterized by low δ13C values, low CIA values, and decreased kaolinite abundances.
5. Widespread glaciation is not required to produce longer-term large-magnitude δ13C changes in Neoproterozoic oceans. Alternatively, these δ13C changes could indicate longer-term wetter-to-drier climate changes in low-latitude areas that affected weathering/sedimentation and organic carbon burial rates. The low-latitude positioning of the majority of Neoproterozoic continents allowed such climate changes to have global effects on organic carbon burial.
6. The Chuar Group may be a proxy for mid-Neoproterozoic intracratonic basins. Such low-latitude basins could have sequestered much of the large volume of organic carbon burial required to produce the large-magnitude C isotope shifts and overall positive δ13C content of oceans at this time (ca. 770–742 Ma).
ACKNOWLEDGMENTS
This project was made possible by NSF grant EAR 9706541 to Karl Karlstrom, John Geissman, and Maya Elrick; and GSA, Colorado Scientifi c Society, and SEPM grants to Dehler. Support was also provided by Ben Donegan Consultants. We are thankful for permits and support provided by Grand Canyon National Park. We thank Frank Corsetti and anonymous reviewers for improving this manuscript. Feedback from Joel Ped-erson, Viorel Atudorei, Susannah Porter, Gary Smith, Zach Sharp, Jay Kaufman, Andy Knoll, and Roger Summons was also helpful. Special thanks to Mike Timmons for geological and boating skills. We also thank fi eld assistants Claudia Borchert, Dan Koning, Mike Gaud, Kate Jones, and Anna Snider.
REFERENCE CITED
Asmerom, Y., Jacobsen, S.B., Knoll, A.H., Butterfi eld, N.J., and Swett, K., 1991, Strontium isotopic variations of Neoproterozoic seawater: Implications for crustal evolution: Geochimica et Cosmochimica Acta, v. 55, p. 2,883–2,894, doi: 10.1016/0016-7037(91)90453-C.
Banner, J., and Hanson, G.N., 1990, Calculation of simul-taneous trace element and isotopic variations during water-rock interaction with applications to carbonate diagenesis: Geochimica et Cosmochimica Acta, v. 54, p. 3,123–3,137, doi: 10.1016/0016-7037(90)90128-8.
Banner, J., Hanson, G.N., and Meyers, W.J., 1988, Determi-nation of initial Sr isotopic compositions of dolostones from the Burlington-Keokuk Formation (Mississip-pian): Constraints from cathodoluminescence, glau-conite paragenesis and analytical methods: Journal of Sedimentary Petrology, v. 58, p. 673–687.
Berner, R.A., 1989, Biogeochemical cycles of carbon and sulfur and their effect on atmospheric oxygen over Phanerozoic time: Global and Planetary Change, v. 75, p. 97–122, doi: 10.1016/0921-8181(89)90018-0.
Bloch, J.D., Schröder-Adams, C.J., Leckie, D.A., Craig, J., and McIntyre, D.J., 1999, Sedimentology, micropale-ontology, geochemistry and hydrocarbon potential of shale from the Cretaceous lower Colorado Group in
Western Canada: Geological Survey of Canada Bul-letin, v. 531, 185 p.
Bloeser, B., 1985, Melanocyrillium, a new genus of structur-ally complex Late Proterozoic microfossils from the Kwagunt Formation (Chuar Group), Grand Canyon, Arizona: Journal of Paleontology, v. 59, p. 741–765.
Brand, U., and Veizer, J., 1980, Chemical diagenesis of multi-component carbonate system—1, Trace elements: Jour-nal of Sedimentary Petrology, v. 50, p. 1,219–1,236.
Brand, U., and Veizer, J., 1981, Chemical diagenesis of a multicomponent system—II, Stable isotopes: Journal of Sedimentary Petrology, v. 51, p. 987–998.
Broecker, W., 1970, A boundary condition on the evolu-tion of atmospheric oxygen: Journal of Geophysical Research, v. 75, p. 3,553–3,557.
Broecker, W., 1996, Climate in the tropics: Science, v. 272, p. 1,902–1,904.
Brown, E.H., Babcock, R.S., Clark, M.D., and Livingston, D.E., 1979, Geology of the older Precambrian rocks of the Grand Canyon Part 1, petrology and structure of the Vishnu Complex: Precambrian Research, v. 8, p. 219–241, doi: 10.1016/0301-9268(79)90030-5.
Calver, C.R., 1998, Isotope stratigraphy of the Neoprotero-zoic Togari Group, Tasmania: Australian Journal of Earth Sciences, v. 45, p. 865–874.
Caritat, Patrice de, Bloch, J., and Hutcheon, I.E., 1994, LPNORM: A linear programming normative analysis code: Computers and Geosciences, v. 20, p. 313–347.
Christie-Blick, N., Grotzinger, J.P., and von der Borch, C.C., 1988, Sequence stratigraphy in Proterozoic succes-sions: Geology, v. 16, p. 100–104, doi: 10.1130/0091-7613(1988)0162.3.CO;2.
Condie, K.C., Lee, D., and Farmer, G.L., 2001, Tectonic setting and provenance of the Neoproterozoic Uinta Mountain and Big Cottonwood groups, northern Utah: Constraints from geochemistry, Nd isotopes, and detrital modes: Sedimentary Geology, v. 141–142, p. 443–464, doi: 10.1016/S0037-0738(01)00086-0.
Corsetti, F.A., and Kaufman, A.J., 2003, Stratigraphic inves-tigations of carbon isotope anomalies and Neoprotero-zoic ice ages in Death Valley, California: Geological Society of America Bulletin, v. 115, p. 916–932, doi: 10.1130/B25066.1.
Dehler, C.M., 2001, Facies analysis, cyclostratigraphy, and carbon-isotope stratigraphy of the Neoproterozoic Chuar Group, Grand Canyon, Arizona [Ph.D. thesis]: Albuquerque, University of New Mexico, 371 p.
Dehler, C.M., Elrick, M.E., Karlstrom, K.E., Smith, G.A., Crossey, L.J., and Timmons, M.J., 2001a, Neoprotero-zoic Chuar Group (~800–742 Ma), Grand Canyon: A record of cyclic marine deposition during global climatic and tectonic transitions, in Eriksson, P.G., Catuneanu, O., Aspler, L.B., Chiarenzelli, J.R., Mar-tins-Neto, M.A., eds., The infl uences of magmatism, tectonics, sea-level change and paleoclimate on Pre-cambrian basin evolution: Change over time: Sedimen-tary Geology, v. 141–142, p. 465–499.
Dehler, C.M., Prave, A.R., Crossey, L.I., Karlstrom, K.E., Atudorei, V., and Porter, S.M., 2001b, Linking mid-Neoproterozoic successions in the western UNITED STATES: The Chuar Group-Uinta Mountain Group-Pahrump Group connection (CHUMP): Geological Society of America Abstracts with Programs, v. 33, no. 5, p. 20–21.
Dehler, C.M., Crossey, L.J., and Atudorei, V., Bloch, J.B., Karlstrom, K.E., 2002, Characterization of the Red Pine Shale, Uinta Mountain Group: Mid-Neoprotero-zoic paleogeography of NE Utah: Geological Society of America Abstracts with Program, v. 34, no. 6, p. 272–273.
Derry, L.A., Keto, L.S., Jacobsen, S.B., Knoll, A.H., and Swett, K., 1989, Sr isotopic variation of upper Pro-terozoic carbonates from East Greenland and Svalbard: Geochimica et Cosmochimica Acta, v. 53, p. 2,331–2,339, doi: 10.1016/0016-7037(89)90355-4.
Derry, L.A., Kaufman, A.J., and Jacobsen, S.B., 1992, Sedimentary cycling and environmental change in the Late Proterozoic: Evidence from stable and radiogenic isotopes: Geochimica et Cosmochimica Acta, v. 56, p. 1,317–1,329, doi: 10.1016/0016-7037(92)90064-P.
DesMarais, D.J., 1997, Isotopic evolution of the biogeochem-ical carbon cycle during the Proterozoic Eon: Organic
Geochemistry, v. 27, p. 185–193, doi: 10.1016/S0146-6380(97)00061-2.
DesMarais, D.J., Strauss, H., Summons, R.E., and Hayes, J.M., 1992, Carbon isotopic evidence for the step-wise oxidation of the Proterozoic environment: Nature, v. 359, p. 605–609, doi: 10.1038/359605A0.
Evans, D.A., 2000, Stratigraphic, geochronological, and paleomagnetic constraints upon the Neoproterozoic climatic paradox: American Journal of Science, v. 300, p. 347–433.
Fairchild, I.J., Marshall, J.D., and Bertrand-Sarfati, J., 1990, Stratigraphic shifts in carbon isotopes from Protero-zoic stromatolitic carbonates (Mauritania): Infl uences of primary mineralogy and diagenesis: American Jour-nal of Science, v. 290-A, p. 46–79.
Ford, T.D., and Breed, W.J., 1973, Late Precambrian Chuar Group, Grand Canyon, Arizona: Geological Society of America Bulletin, v. 84, p. 1,243–1,260.
Halverson, G.P., Hoffman, P.F., and Shrag, D.P., 2002, A major perturbation of the carbon cycle before the Ghuab glaciation (Neoproterozoic) in Namibia: A trigger mechanism for snowball Earth?: Geochemistry, Geophysics, Geosystems, v. 3, no. 6, p. 244–260, doi: 10.1029/2001GC000244.
Hayes, J.M., 1983, Geochemical evidence bearing on the origin of aerobiosis, a speculative hypothesis, in Schopf, J.W., ed., Earth’s earliest biosphere: Its origin and evolution: Princeton, New Jersey, Princeton Uni-versity Press, p. 291–301.
Hayes, J.M., Strauss, H., and Kaufman, A.J., 1999, The abundance of 13C in marine organic matter and isotopic fractionation in the global biogeochemical cycle of car-bon during the past 800 Ma: Chemical Geology, v. 161, p. 103–125, doi: 10.1016/S0009-2541(99)00083-2.
Hill, A.C., and Walter, M.R., 2000, Mid-Neoproterozoic (~830–750 Ma) isotope stratigraphy of Australia and global correlation: Precambrian Research, v. 100, p. 181–211, doi: 10.1016/S0301-9268(99)00074-1.
Hoffman, P.F., Kaufman, A.J., and Halverson, G.P., 1998a, Comings and goings of global glaciations in a Neo-proterozoic tropical platform of Namibia: GSA Today, v. 8, no. 5, p. 1–9.
Hoffman, P.F., Kaufman, A.K., Halverson, G.P., and Schrag, D.P., 1998b, A Neoproterozoic Snowball Earth: Science, v. 281, p. 1,342–1,346, doi: 10.1126/SCIENCE.281.5381.1342.
Holland, H.D., 1973, The oceans: A possible source of iron in iron formations: Economic Geology and the Bul-letin of the Society of Economic Geologists, v. 68, p. 1,169–1,172.
Holland, H.D., 1974, The chemical evolution of the atmo-sphere and oceans: Princeton, New Jersey, Princeton University Press, 582 p.
Ilg, B.R., Karlstrom, K.E., Hawkins, D.P., and Williams, M.L., 1996, Tectonic evolution of Paleoproterozoic rocks in the Grand Canyon: Insights into middle-crustal processes: Geological Society of America Bulletin, v. 108, p. 1,149–1,166, doi: 10.1130/0016-7606(1996)1082.3.CO;2.
Irwin, H., Curtis, C., and Coleman, 1977, Isotopic evidence for source of diagenetic carbonates formed during burial of organic-rich sediments: Nature, v. 269, p. 209–213.
Jenner, G.A., Longerich, H.P., Jackson, S.E., and Fryer, B.J., 1990, ICP-MS; A powerful tool for high-precision, trace-element analyses in earth sciences; evidence from analysis of selected U.S. Geological Survey reference samples: Chemical Geology, v. 83, no. 1-2, p. 133–148, doi: 10.1016/0009-2541(90)90145-W.
Kah, L.C., Sherman, A.G., Narbonne, G.M., Knoll, A.H., and Kaufman, A.J., 1999, δ13C stratigraphy of the Proterozoic Bylot Supergroup, Baffi n Island, Canada: Implications for regional lithostratigraphic correla-tions: Canadian Journal of Earth Sciences, v. 36, p. 313–332, doi: 10.1139/CJES-36-3-313.
Karlstrom, K.E., Harlan, S.S., Williams, M.L., McLelland, J., Geissman, J.W., and Åhäll, K.-I., 1999, Refi ning Rodinia: Geological evidence for the Australia-Western U.S. connection in the Proterozoic: GSA Today, v. 9, no. 10, p. 1–7.
Karlstrom, K.E., Bowring, S.A., Dehler, C.M., Knoll, A.H., Porter, S.M., DesMarais, D.J., Weil, A.B., Sharp, Z.D., Geissman, J.W., Elrick, M.B., Timmons, J.M., Crossey, L.J., and Davidek, K.L., 2000, Chuar Group
δ13C STRATIGRAPHY OF THE CHUAR GROUP (ca. 770–742 Ma), GRAND CANYON
Geological Society of America Bulletin, January/February 2005 45
of the Grand Canyon: Record of breakup of Rodinia, associated change in the global carbon cycle, and eco-system expansion by 740 Ma: Geology, v. 28, p. 619–622, doi: 10.1130/0091-7613(2000)0282.3.CO;2.
Kaufman, A.J., and Knoll, A.H., 1995, Neoproterozoic variations in the C-isotopic composition of seawater: Stratigraphic and biogeochemical implications: Pre-cambrian Research, v. 73, p. 27–49, doi: 10.1016/0301-9268(94)00070-8.
Kaufman, A.J., Hayes, J.M., Knoll, A.H., and Germs, G.J.B., 1991, Isotopic compositions of carbonates and organic carbon from upper Proterozoic successions in Namibia: Stratigraphic variation and the effects of diagenesis and metamorphism: Precambrian Research, v. 49, p. 301–327, doi: 10.1016/0301-9268(91)90039-D.
Kaufman, A.J., Knoll, A.H., and Awramick, S.M., 1992, Biostratigraphic and chemostratigraphic correla-tion of Neoproterozoic sedimentary successions: Upper Tindir Group, northwestern Canada, as a test case: Geology, v. 20, p. 181–185, doi: 10.1130/0091-7613(1992)0202.3.CO;2.
Kaufman, A.J., Jacobsen, S.B., and Knoll, A.H., 1993, The Vendian record of Sr and C isotopic variations in seawater: Implications for tectonics and paleoclimate: Earth and Planetary Science Letters, v. 120, no. 3-4, p. 409–430, doi: 10.1016/0012-821X(93)90254-7.
Kaufman, A.J., Knoll, A.H., and Narbonne, G.M., 1997, Isotopes, ice ages, and terminal Proterozoic earth his-tory: Proceedings of the National Academy of Sciences of the United States of America, v. 94, p. 6,600–6,605, doi: 10.1073/PNAS.94.13.6600.
Kirschvink, J.L., 1992, Late Proterozoic low latitude glaciation: The snowball Earth, in Schopf, J.W., and Klein, C., eds., The Proterozoic biosphere: A Multi-disciplinary Study: Cambridge, Cambridge University Press, p. 51–52.
Knoll, A.H., 2003, Life on a Young Planet: The First Three Billion Years of Evolution on Earth: Princeton, New Jersey, Princeton University Press, 304 p.
Knoll, A.H., and Holland, H.D., 1995, Oxygen and Protero-zoic evolution: an update, in Stanley, S., ed., Effects of Past Global Change on Life: Washington, National Academy Press, p. 21–33.
Knoll, A.H., Hayes, J.M., Kaufman, A.J., Swett, K., and Lambert, I.B., 1986, Secular variation in carbon isotope ratios from Upper Proterozoic successions of Svalbard and East Greenland: Nature, v. 321, p. 832–838.
Knoll, A.H., Grotzinger, J.P., Kaufman, A.J., and Kolosov, P., 1995a, Integrated approaches to terminal Protero-zoic stratigraphy: An example from the Olenek Uplift, northeastern Siberia: Precambrian Research, v. 73, p. 251–270, doi: 10.1016/0301-9268(94)00081-2.
Knoll, A.H., Kaufman, A.J., and Semikhatov, M.A., 1995b, The carbon-isotopic composition of Proterozoic carbonates: Riphean successions from northwestern Siberia (Anabar Massif, Turukhansk Uplift): American Journal of Science, v. 295, p. 832–850.
Lambert, I.B., Walter, M.R., Wenlong, Z., Songnian, L., and Guogan, M., 1987, Paleoenvironmental and carbon isotope stratigraphy of the Upper Proterozoic carbon-ates of the Yangtze Platform: Nature, v. 325, no. 6101, p. 140–142, doi: 10.1038/325140A0.
Li, Z.-X., Zhang, L., Powell, C.McA, 1995, South China in Rodinia: Part of the missing link between Aus-tralia-East Antartica and Laurentia: Geology, v. 23, p. 407–410.
McCrea, J.M., 1950, On the isotope chemistry of carbonates and a paleotemperature scale: The Journal of Chemical Physics, v. 18, p. 849–857.
Melezhik, V.A., Fallick, A.E., Medvedev, P.V., and Makarikhin, V.V., 1999, Extreme δ13C
carb enrichment in ca. 2.0 Ga
magnesite-stromatolite-dolomite-“red beds” association in a global context; a case for the world-wide signal enhanced by a local environment: Earth Science Reviews, v. 48, p. 71–120, doi: 10.1016/S0012-8252(99)00044-6.
Mora, G., and Pratt, L.M., 2001, Isotopic evidence for cooler and drier conditions in the tropical Andes during the last glacial stage: Geology, v. 29, p. 519–522, doi: 10.1130/0091-7613(2001)0292.0.CO;2.
Narbonne, G.M., Kaufman, A.J., and Knoll, A.H., 1994, Integrated chemostratigraphy and biostratigraphy of the Windermere Supergroup, northwestern Canada: Impli-cations for Neoproterozoic correlations and the early evolution of animals: Geological Society of America Bulletin, v. 106, p. 1,281–1,292, doi: 10.1130/0016-7606(1994)1062.3.CO;2.
Nesbitt, H.W., and Young, G.M., 1982, Early Proterozoic climates and plate motions inferred from major ele-ment chemistry of lutites: Nature, v. 299, p. 715–717.
Park, J.K., 1997, Paleomagnetic evidence for low-latitude glaciation during deposition of the Neoproterozoic Rapitan Group, Mackenzie Mountains N.W.T. Canada: Canadian Journal of Earth Sciences, v. 34, p. 34–49.
Porter, S.M., and Knoll, A.H., 2000, Testate amoebae in the Neoproterozoic Era: Evidence from vase-shaped microfossils in the Chuar Group, Grand Canyon: Paleobiology 26, v. 3, p. 345–370.
Potter, P.E., Maynard, J.B., and Pryor, W.A., 1980, Sedimen-tology of Shale: New York, Springer-Verlag, 306 p.
Powell, C.M., Preiss, W.V., Gatehouse, C.G., Krapez, B., and Li, Z.X., 1994, South Australian record of a Rodin-ian epicontinental basin and its mid-Neoproterozoic breakup (~700 Ma) to form the Palaeo-Pacifi c ocean: Tectonophysics, v. 237, p. 113–140, doi: 10.1016/0040-1951(94)90250-X.
Rosenbaum, J., and Shepard, S.M.F., 1986, An isotopic study of siderites, dolomites, and ankerites at high tem-peratures: Geochimica et Cosmochimica Acta, v. 50, p. 1,147–1,150, doi: 10.1016/0016-7037(86)90396-0.
Schidlowski, M., Eichman, R., and Junge, C.E., 1975, Precambrian sedimentary carbonates: Carbon and oxygen isotope geochemistry and implications for the terrestrial oxygen budget: Precambrian Research, v. 2, p. 1–69, doi: 10.1016/0301-9268(75)90018-2.
Scholle, P.A., and Arthur, M.A., 1980, Carbon isotope fl uctuationsin Cretaceous pelagic limestones: potential stratigraphic and petroleum exploration tool: American Association of Petroleum Geologists Bulletin v. 64, p. 67–87.
Schrag, D.P., Berner, R.A., and Hoffman, P.F., 2002, On the initiation of a snowball Earth: Geochemistry Geophys-ics and Geosystems, v. 3, no. 6, p. 1–21.
Sohl, L.E., Christie-Blick, N., and Kent, D.V., 1999, Paleomag-netic polarity reversals in Marinoan (ca. 600 Ma) glacial
deposits of Australia: Implications for the duration of low-latitude glaciation in Neoproterozoic time: Geologi-cal Society of America Bulletin, v. 111, p. 1,120–1,139, doi: 10.1130/0016-7606(1999)1112.3.CO;2.
Strauss, H., DesMarais, D.J., Hayes, J.M., and Summons, R.E., 1992a, The carbon-isotopic record, in Schopf, J.W., and Klein, C., eds., The Proterozoic Biosphere: A Multidis-ciplinary Study: Cambridge, UK, Cambridge University Press, p. 95–100.
Strauss, H., Des Marais, D.J., Hayes, J.M., Lambert, I.B., and Summons, R.E., 1992b, Procedures of whole rock and kerogen analysis, in Schopf, J.W., and Klein, C., eds., The Proterozoic Biosphere: A Multidisciplinary Study: Cambridge, Cambridge University Press, p. 699–708.
Summons, R.E., 1992, Abundance and composition of extract-able organic matter, in Schopf, J.W., and Klein, C., eds., The Proterozoic Biosphere: A Multidisciplinary Study: Cambridge, UK, Cambridge University Press, p. 101–115.
Timmons, M.J., Karlstrom, K.E., Dehler, C.M., Geissman, J.W., and Heizler, M.T., 2001, Proterozoic multistage (~1.1 and ~0.8 Ga) extension in the Grand Canyon Supergroup and establishment of northwest and north-south tectonic grains in the southwest-ern United States: Geological Society of America Bulletin, v. 113, p. 163–181, doi: 10.1130/0016-7606(2001)1132.0.CO;2.
Timmons, M.T., 2004, Mesoproterozoic tectonic evolution of southwestern North America: Protracted intracratonic deformation, sedimentation, and differential exhuma-tion in the Grand Canyon and the Rocky Mountain Region [Ph.D. thesis]: Albuquerque, University of New Mexico, 314 p.
Veizer, J., 1983, Chemical diagenesis of carbonates: Theory and application of trace element technique, in Arthur, M., Anderson, T., Kaplan, I., and Veizer, J., eds., Stable iso-topes in sedimentary geology: SEPM Short Course 10, p. 1–100.
Vidal, G., and Ford, T.D., 1985, Microbiotas from the Late Proterozoic Chuar Group (Northern Arizona) and Uinta Mountain Group (Utah) and their chronostrati-graphic implications: Precambrian Research, v. 28, p. 349–389, doi: 10.1016/0301-9268(85)90038-5.
Weil, A.B., Geissman, J.W., and Van der Voo, R., 2004, Paleomagnetism of the Neoproterozoic Chuar Group, Grand Canyon Supergroup, Arizona: Implications for Laurentia’s Neoproterozoic APWP and Rodinia break-up: Precambrian Research, v. 129, p. 71–92, doi: 10.1016/J.PRECAMRES.2003.09.016.
Williams, M., Crossey, L.J., Jercinovic, M., Bloch, J.D., Karl-strom, K.E., Dehler, C.M., Heizler, M., Bowring, S., and Goncalves, P., 2003, Dating sedimentary sequences: In situ U/Th-Pb microprobe dating of early diagenetic monazite and Ar-Ar dating of marcasite nodules: Case study from Neoproterozoic black shales in the south-western U.S: Geological Society of America Abstracts with Programs, v. 35, no. 6, p. 595.
MANUSCRIPT RECEIVED BY THE SOCIETY 16 AUGUST 2003REVISED MANUSCRIPT RECEIVED 10 MAY 2004MANUSCRIPT ACCEPTED 7 JUNE 2004
Printed in the USA