High performance plasma amyloid-β biomarkers for Alzheimer ...
24
00 MONTH 2018 | VOL 000 | NATURE | 1 LETTER doi:10.1038/nature25456 High performance plasma amyloid-β biomarkers for Alzheimer’s disease Akinori Nakamura 1 , Naoki Kaneko 2 , Victor L. Villemagne 3,4 , Takashi Kato 1,5 , James Doecke 6 , Vincent Doré 3,6 , Chris Fowler 4 , Qiao-Xin Li 4 , Ralph Martins 7 , Christopher Rowe 3,4 , Taisuke Tomita 8 , Katsumi Matsuzaki 9 , Kenji Ishii 10 , Kazunari Ishii 11 , Yutaka Arahata 5 , Shinichi Iwamoto 2 , Kengo Ito 1,5 , Koichi Tanaka 2 , Colin L. Masters 4 & Katsuhiko Yanagisawa 1 To facilitate clinical trials of disease-modifying therapies for Alzheimer’s disease, which are expected to be most efficacious at the earliest and mildest stages of the disease 1,2 , supportive biomarker information is necessary. The only validated methods for identifying amyloid-β deposition in the brain—the earliest pathological signature of Alzheimer’s disease—are amyloid-β positron-emission tomography (PET) imaging or measurement of amyloid-β in cerebrospinal fluid. Therefore, a minimally invasive, cost-effective blood-based biomarker is desirable 3,4 . Despite much effort 3–7 , to our knowledge, no study has validated the clinical utility of blood-based amyloid-β markers. Here we demonstrate the measurement of high-performance plasma amyloid-β biomarkers by immunoprecipitation coupled with mass spectrometry. The ability of amyloid-β precursor protein (APP) 669–711 /amyloid-β (Aβ) 1–42 and Aβ 1–40 /Aβ 1–42 ratios, and their composites, to predict individual brain amyloid-β-positive or -negative status was determined by amyloid-β-PET imaging and tested using two independent data sets: a discovery data set (Japan, n = 121) and a validation data set (Australia, n = 252 including 111 individuals diagnosed using 11 C-labelled Pittsburgh compound-B (PIB)-PET and 141 using other ligands). Both data sets included cognitively normal individuals, individuals with mild cognitive impairment and individuals with Alzheimer’s disease. All test biomarkers showed high performance when predicting brain amyloid-β burden. In particular, the composite biomarker showed very high areas under the receiver operating characteristic curves (AUCs) in both data sets (discovery, 96.7%, n = 121 and validation, 94.1%, n = 111) with an accuracy approximately equal to 90% when using PIB-PET as a standard of truth. Furthermore, test biomarkers were correlated with amyloid-β-PET burden and levels of Aβ 1–42 in cerebrospinal fluid. These results demonstrate the potential clinical utility of plasma biomarkers in predicting brain amyloid-β burden at an individual level. These plasma biomarkers also have cost–benefit and scalability advantages over current techniques, potentially enabling broader clinical access and efficient population screening. Attempts to use conventional enzyme-linked immunosorbent assay (ELISA)-based techniques to assess plasma amyloid-β (Aβ) levels in patients have not been successful (see Supplementary Information for more detailed background information). Immunoprecipitation–mass spectrometry (IP–MS) assays have been proposed 8,9 as an alternative, although the sample sizes in both of these studies were small (n = 62 and n = 41, respectively). Using IP–MS, we originally developed a plasma biomarker that discriminated individuals with high levels of Aβ (Aβ + ) from individuals with low levels (Aβ − ) with more than 90% sensitivity and specificity when classified using PIB-PET 8 . In that study, we used IP–MS with matrix-assisted laser desorption ionization–time- of-flight (MALDI–TOF) mass spectrometry, which can also be used for protein quantification 10,11 , to measure the ratio of plasma Aβ 1–42 to a novel APP 669–711 fragment (APP 669–711 /Aβ 1–42 ) (Extended Data Fig. 1a). Here we improved the general applicability and reproducibility of the previous IP–MS methodology through exploratory studies. We found that the ratio of Aβ 1–40 /Aβ 1–42 also performed at the same level as APP 669–711 /Aβ 1–42 , and that a composite biomarker score that incorporated both could further improve performance (Supplementary Information and Extended Data Fig. 1b). Thus, we hypothesized that APP 669–711 /Aβ 1–42 , Aβ 1–40 /Aβ 1–42 and the composite biomarker gen- erated by the IP–MS assay were promising and potentially clinically useful candidates for plasma biomarkers as surrogates for brain Aβ burden. Our retrospective cross-sectional study tested this hypothesis in a discovery data set from the Japanese National Center for Geriatrics and Gerontology (NCGG) (121 samples), and was externally validated using an independent data set derived from the Australian Imaging, Biomarker and Lifestyle Study of Ageing (AIBL) 12 cohort (252 sam- ples) (Table 1). Both data sets include a balanced number of individ- uals clinically classified as cognitively normal, individuals with mild cognitive impairment (MCI) and individuals clinically diagnosed with Alzheimer’s disease (AD) with dementia. All samples had correspond- ing Aβ-PET data obtained using PIB (NCGG and AIBL), flutemeta- mol (FLUTE) or florbetapir (FBP) (AIBL). Information on the levels of Aβ in cerebrospinal fluid (CSF Aβ) was available for a subset of the AIBL cohort. The primary aim of the study was to assess the per- formance of plasma-Aβ biomarkers for determining an individual’s status of Aβ deposition, using PIB-PET as the standard of truth. For secondary outcomes, we examined the performance of the plasma-Aβ biomarker against other PET ligands (FLUTE and FBP) and within clinical categories (cognitively normal, MCI, and AD). We also exam- ined the correlations of plasma-Aβ biomarkers with Aβ-PET burden and CSF Aβ values. Figure 1 and Extended Data Fig. 2a show the normalized intensity of plasma Aβ as measured by IP–MS and the values of test biomarkers for each study site. The test biomarker values were generated by com- puting the ratio of the normalized intensity of the peptides. Aβ 1–42 was used as denominator (APP 669–711 /Aβ 1–42 and Aβ 1–40 /Aβ 1–42 ), because it yielded normal distributions (Extended Data Fig. 2b). The com- posite biomarker was generated by combining normalized scores of APP 669–711 /Aβ 1–42 and Aβ 1–40 /Aβ 1–42 with a pre-determined weight of 1:1 (Methods, Supplementary Information and Extended Data Fig. 1b). All of the test biomarkers showed highly significant differences (P < 0.0001, two-sided Student’s t-test or Welch’s t-test) between the Aβ + and Aβ − groups (Extended Data Fig. 2a). At a single peptide level, 1 Center for Development of Advanced Medicine for Dementia, National Center for Geriatrics and Gerontology, Obu, Aichi 474-8511, Japan. 2 Koichi Tanaka Mass Spectrometry Research Laboratory, Shimadzu Corporation, Kyoto 604-8511, Japan. 3 Austin Health, Department of Molecular Imaging and Therapy, Center for PET, Heidelberg, Victoria 3084, Australia. 4 The Florey Institute, The University of Melbourne, Parkville 3010, Australia. 5 National Hospital for Geriatric Medicine, National Center for Geriatrics and Gerontology, Obu, Aichi 474-8511, Japan. 6 Health and Biosecurity, CSIRO, Brisbane 4029, Australia. 7 Edith Cowan University, Joondalup, Western Australia 6027, Australia. 8 Laboratory of Neuropathology and Neuroscience, Graduate School of Pharmaceutical Sciences, The University of Tokyo, Tokyo 113-0033, Japan. 9 Graduate School of Pharmaceutical Sciences, Kyoto University, Kyoto 606-8501, Japan. 10 Team for Neuroimaging Research, Tokyo Metropolitan Institute of Gerontology, Tokyo 173-0015, Japan. 11 Department of Radiology, Kindai University Faculty of Medicine, Osakasayama, Osaka 589-8511, Japan. © 2018 Macmillan Publishers Limited, part of Springer Nature. All rights reserved.
Transcript of High performance plasma amyloid-β biomarkers for Alzheimer ...
0 0 M o n t h 2 0 1 8 | V o L 0 0 0 | n A t U R E | 1
LEttERdoi:10.1038/nature25456
High performance plasma amyloid-β biomarkers for Alzheimer’s diseaseAkinori nakamura1, naoki Kaneko2, Victor L. Villemagne3,4, takashi Kato1,5, James Doecke6, Vincent Doré3,6, Chris Fowler4, Qiao-Xin Li4, Ralph Martins7, Christopher Rowe3,4, taisuke tomita8, Katsumi Matsuzaki9, Kenji Ishii10, Kazunari Ishii11, Yutaka Arahata5, Shinichi Iwamoto2, Kengo Ito1,5, Koichi tanaka2, Colin L. Masters4 & Katsuhiko Yanagisawa1
To facilitate clinical trials of disease-modifying therapies for Alzheimer’s disease, which are expected to be most efficacious at the earliest and mildest stages of the disease1,2, supportive biomarker information is necessary. The only validated methods for identifying amyloid-β deposition in the brain—the earliest pathological signature of Alzheimer’s disease—are amyloid-β positron-emission tomography (PET) imaging or measurement of amyloid-β in cerebrospinal fluid. Therefore, a minimally invasive, cost-effective blood-based biomarker is desirable3,4. Despite much effort3–7, to our knowledge, no study has validated the clinical utility of blood-based amyloid-β markers. Here we demonstrate the measurement of high-performance plasma amyloid-β biomarkers by immunoprecipitation coupled with mass spectrometry. The ability of amyloid-β precursor protein (APP)669–711/amyloid-β (Aβ)1–42 and Aβ1–40/Aβ1–42 ratios, and their composites, to predict individual brain amyloid-β-positive or -negative status was determined by amyloid-β-PET imaging and tested using two independent data sets: a discovery data set (Japan, n = 121) and a validation data set (Australia, n = 252 including 111 individuals diagnosed using 11C-labelled Pittsburgh compound-B (PIB)-PET and 141 using other ligands). Both data sets included cognitively normal individuals, individuals with mild cognitive impairment and individuals with Alzheimer’s disease. All test biomarkers showed high performance when predicting brain amyloid-β burden. In particular, the composite biomarker showed very high areas under the receiver operating characteristic curves (AUCs) in both data sets (discovery, 96.7%, n = 121 and validation, 94.1%, n = 111) with an accuracy approximately equal to 90% when using PIB-PET as a standard of truth. Furthermore, test biomarkers were correlated with amyloid-β-PET burden and levels of Aβ1–42 in cerebrospinal fluid. These results demonstrate the potential clinical utility of plasma biomarkers in predicting brain amyloid-β burden at an individual level. These plasma biomarkers also have cost–benefit and scalability advantages over current techniques, potentially enabling broader clinical access and efficient population screening.
Attempts to use conventional enzyme-linked immunosorbent assay (ELISA)-based techniques to assess plasma amyloid-β (Aβ ) levels in patients have not been successful (see Supplementary Information for more detailed background information). Immunoprecipitation–mass spectrometry (IP–MS) assays have been proposed8,9 as an alternative, although the sample sizes in both of these studies were small (n = 62 and n = 41, respectively). Using IP–MS, we originally developed a plasma biomarker that discriminated individuals with high levels of Aβ (Aβ +) from individuals with low levels (Aβ −) with more than 90% sensitivity and specificity when classified using PIB-PET8. In that study,
we used IP–MS with matrix-assisted laser desorption ionization–time-of-flight (MALDI–TOF) mass spectrometry, which can also be used for protein quantification10,11, to measure the ratio of plasma Aβ 1–42 to a novel APP669–711 fragment (APP669–711/Aβ 1–42) (Extended Data Fig. 1a). Here we improved the general applicability and reproducibility of the previous IP–MS methodology through exploratory studies. We found that the ratio of Aβ 1–40/Aβ 1–42 also performed at the same level as APP669–711/Aβ 1–42, and that a composite biomarker score that incorporated both could further improve performance (Supplementary Information and Extended Data Fig. 1b). Thus, we hypothesized that APP669–711/Aβ 1–42, Aβ 1–40/Aβ 1–42 and the composite biomarker gen-erated by the IP–MS assay were promising and potentially clinically useful candidates for plasma biomarkers as surrogates for brain Aβ burden. Our retrospective cross-sectional study tested this hypothesis in a discovery data set from the Japanese National Center for Geriatrics and Gerontology (NCGG) (121 samples), and was externally validated using an independent data set derived from the Australian Imaging, Biomarker and Lifestyle Study of Ageing (AIBL)12 cohort (252 sam-ples) (Table 1). Both data sets include a balanced number of individ-uals clinically classified as cognitively normal, individuals with mild cognitive impairment (MCI) and individuals clinically diagnosed with Alzheimer’s disease (AD) with dementia. All samples had correspond-ing Aβ -PET data obtained using PIB (NCGG and AIBL), flutemeta-mol (FLUTE) or florbetapir (FBP) (AIBL). Information on the levels of Aβ in cerebrospinal fluid (CSF Aβ ) was available for a subset of the AIBL cohort. The primary aim of the study was to assess the per-formance of plasma-Aβ biomarkers for determining an individual’s status of Aβ deposition, using PIB-PET as the standard of truth. For secondary outcomes, we examined the performance of the plasma-Aβ biomarker against other PET ligands (FLUTE and FBP) and within clinical categories (cognitively normal, MCI, and AD). We also exam-ined the correlations of plasma-Aβ biomarkers with Aβ -PET burden and CSF Aβ values.
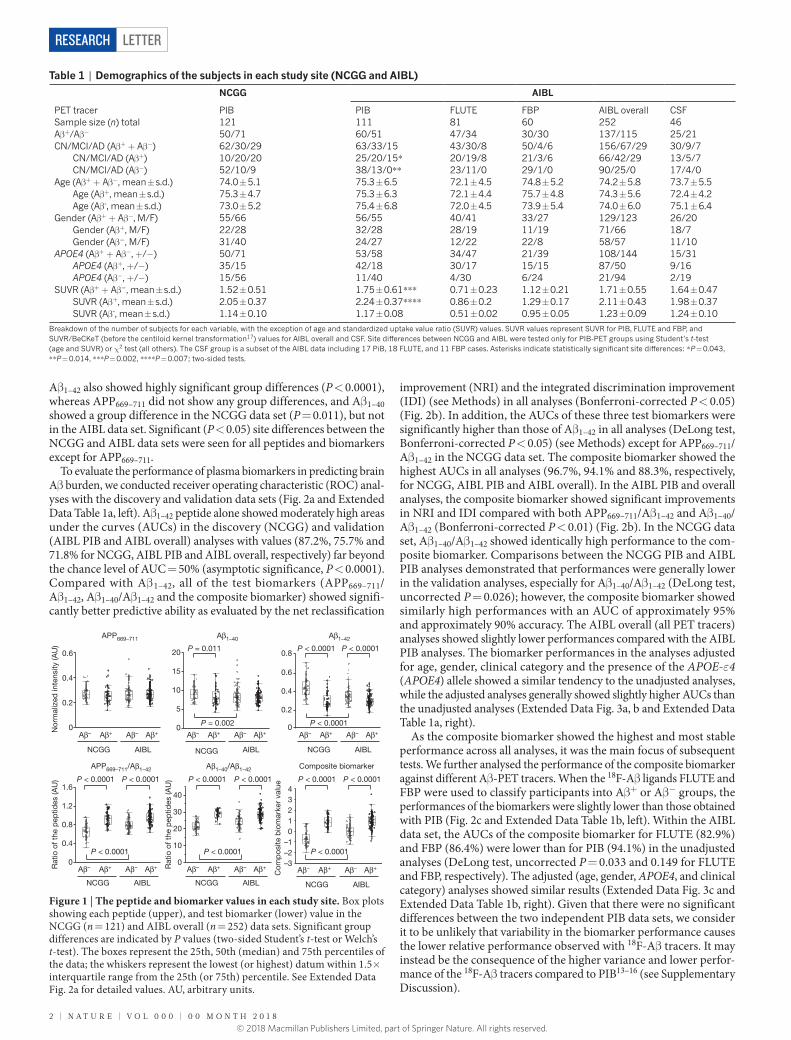
Figure 1 and Extended Data Fig. 2a show the normalized intensity of plasma Aβ as measured by IP–MS and the values of test biomarkers for each study site. The test biomarker values were generated by com-puting the ratio of the normalized intensity of the peptides. Aβ 1–42 was used as denominator (APP669–711/Aβ 1–42 and Aβ 1–40/Aβ 1–42), because it yielded normal distributions (Extended Data Fig. 2b). The com-posite biomarker was generated by combining normalized scores of APP669–711/Aβ 1–42 and Aβ 1–40/Aβ 1–42 with a pre-determined weight of 1:1 (Methods, Supplementary Information and Extended Data Fig. 1b). All of the test biomarkers showed highly significant differences (P < 0.0001, two-sided Student’s t-test or Welch’s t-test) between the Aβ + and Aβ − groups (Extended Data Fig. 2a). At a single peptide level,
1Center for Development of Advanced Medicine for Dementia, National Center for Geriatrics and Gerontology, Obu, Aichi 474-8511, Japan. 2Koichi Tanaka Mass Spectrometry Research Laboratory, Shimadzu Corporation, Kyoto 604-8511, Japan. 3Austin Health, Department of Molecular Imaging and Therapy, Center for PET, Heidelberg, Victoria 3084, Australia. 4The Florey Institute, The University of Melbourne, Parkville 3010, Australia. 5National Hospital for Geriatric Medicine, National Center for Geriatrics and Gerontology, Obu, Aichi 474-8511, Japan. 6Health and Biosecurity, CSIRO, Brisbane 4029, Australia. 7Edith Cowan University, Joondalup, Western Australia 6027, Australia. 8Laboratory of Neuropathology and Neuroscience, Graduate School of Pharmaceutical Sciences, The University of Tokyo, Tokyo 113-0033, Japan. 9Graduate School of Pharmaceutical Sciences, Kyoto University, Kyoto 606-8501, Japan. 10Team for Neuroimaging Research, Tokyo Metropolitan Institute of Gerontology, Tokyo 173-0015, Japan. 11Department of Radiology, Kindai University Faculty of Medicine, Osakasayama, Osaka 589-8511, Japan.
© 2018 Macmillan Publishers Limited, part of Springer Nature. All rights reserved.
2 | n A t U R E | V o L 0 0 0 | 0 0 M o n t h 2 0 1 8
LetterreSeArCH
Aβ 1–42 also showed highly significant group differences (P < 0.0001), whereas APP669–711 did not show any group differences, and Aβ 1–40 showed a group difference in the NCGG data set (P = 0.011), but not in the AIBL data set. Significant (P < 0.05) site differences between the NCGG and AIBL data sets were seen for all peptides and biomarkers except for APP669–711.
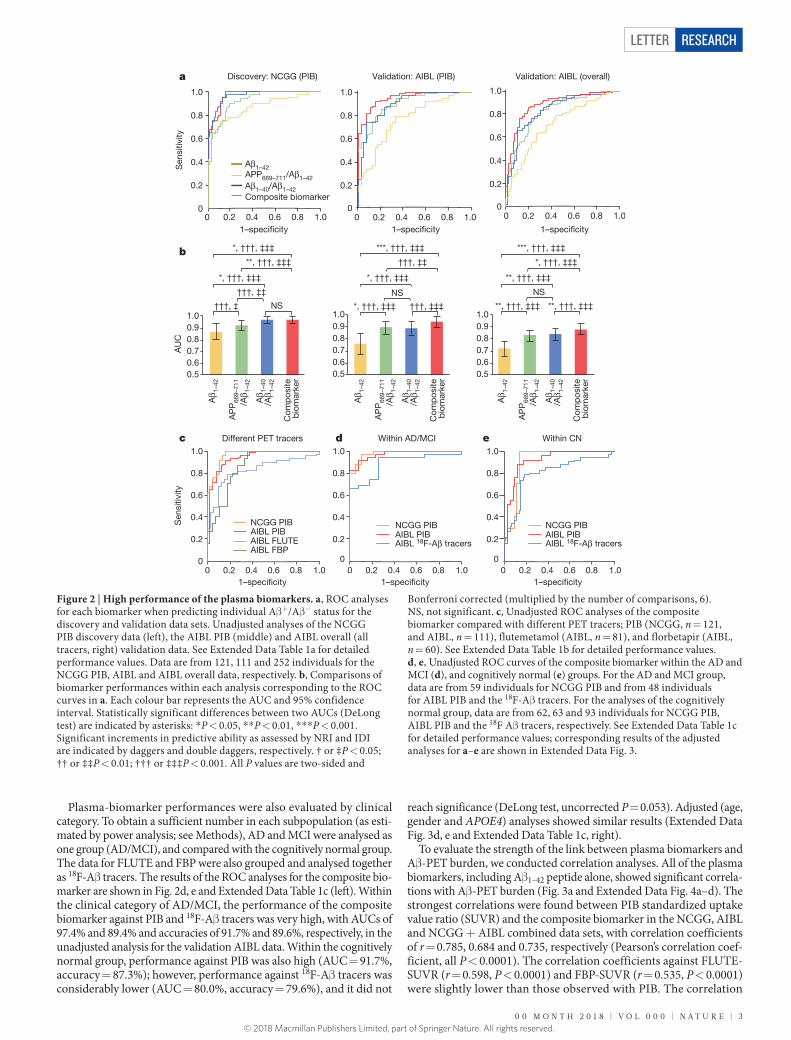
To evaluate the performance of plasma biomarkers in predicting brain Aβ burden, we conducted receiver operating characteristic (ROC) anal-yses with the discovery and validation data sets (Fig. 2a and Extended Data Table 1a, left). Aβ 1–42 peptide alone showed moderately high areas under the curves (AUCs) in the discovery (NCGG) and validation (AIBL PIB and AIBL overall) analyses with values (87.2%, 75.7% and 71.8% for NCGG, AIBL PIB and AIBL overall, respectively) far beyond the chance level of AUC = 50% (asymptotic significance, P < 0.0001). Compared with Aβ 1–42, all of the test biomarkers (APP669–711/ Aβ 1–42, Aβ 1–40/Aβ 1–42 and the composite biomarker) showed signifi-cantly better predictive ability as evaluated by the net reclassification
improvement (NRI) and the integrated discrimination improvement (IDI) (see Methods) in all analyses (Bonferroni-corrected P < 0.05) (Fig. 2b). In addition, the AUCs of these three test biomarkers were significantly higher than those of Aβ 1–42 in all analyses (DeLong test, Bonferroni-corrected P < 0.05) (see Methods) except for APP669–711/Aβ 1–42 in the NCGG data set. The composite biomarker showed the highest AUCs in all analyses (96.7%, 94.1% and 88.3%, respectively, for NCGG, AIBL PIB and AIBL overall). In the AIBL PIB and overall analyses, the composite biomarker showed significant improvements in NRI and IDI compared with both APP669–711/Aβ 1–42 and Aβ 1–40/ Aβ 1–42 (Bonferroni-corrected P < 0.01) (Fig. 2b). In the NCGG data set, Aβ 1–40/Aβ 1–42 showed identically high performance to the com-posite biomarker. Comparisons between the NCGG PIB and AIBL PIB analyses demonstrated that performances were generally lower in the validation analyses, especially for Aβ 1–40/Aβ 1–42 (DeLong test, uncorrected P = 0.026); however, the composite biomarker showed similarly high performances with an AUC of approximately 95% and approximately 90% accuracy. The AIBL overall (all PET tracers) analyses showed slightly lower performances compared with the AIBL PIB analyses. The biomarker performances in the analyses adjusted for age, gender, clinical category and the presence of the APOE-ε4 (APOE4) allele showed a similar tendency to the unadjusted analyses, while the adjusted analyses generally showed slightly higher AUCs than the unadjusted analyses (Extended Data Fig. 3a, b and Extended Data Table 1a, right).
As the composite biomarker showed the highest and most stable performance across all analyses, it was the main focus of subsequent tests. We further analysed the performance of the composite biomarker against different Aβ -PET tracers. When the 18F-Aβ ligands FLUTE and FBP were used to classify participants into Aβ + or Aβ − groups, the performances of the biomarkers were slightly lower than those obtained with PIB (Fig. 2c and Extended Data Table 1b, left). Within the AIBL data set, the AUCs of the composite biomarker for FLUTE (82.9%) and FBP (86.4%) were lower than for PIB (94.1%) in the unadjusted analyses (DeLong test, uncorrected P = 0.033 and 0.149 for FLUTE and FBP, respectively). The adjusted (age, gender, APOE4, and clinical category) analyses showed similar results (Extended Data Fig. 3c and Extended Data Table 1b, right). Given that there were no significant differences between the two independent PIB data sets, we consider it to be unlikely that variability in the biomarker performance causes the lower relative performance observed with 18F-Aβ tracers. It may instead be the consequence of the higher variance and lower perfor-mance of the 18F-Aβ tracers compared to PIB13–16 (see Supplementary Discussion).
Table 1 | Demographics of the subjects in each study site (NCGG and AIBL)
NCGG AIBL
PET tracer PIB PIB FLUTE FBP AIBL overall CSFSample size (n) total 121 111 81 60 252 46Aβ +/Aβ − 50/71 60/51 47/34 30/30 137/115 25/21CN/MCI/AD (Aβ + + Aβ −) 62/30/29 63/33/15 43/30/8 50/4/6 156/67/29 30/9/7 CN/MCI/AD (Aβ +) 10/20/20 25/20/15* 20/19/8 21/3/6 66/42/29 13/5/7 CN/MCI/AD (Aβ −) 52/10/9 38/13/0* * 23/11/0 29/1/0 90/25/0 17/4/0Age (Aβ + + Aβ −, mean ± s.d.) 74.0 ± 5.1 75.3 ± 6.5 72.1 ± 4.5 74.8 ± 5.2 74.2 ± 5.8 73.7 ± 5.5 Age (Aβ +, mean ± s.d.) 75.3 ± 4.7 75.3 ± 6.3 72.1 ± 4.4 75.7 ± 4.8 74.3 ± 5.6 72.4 ± 4.2 Age (Aβ -, mean ± s.d.) 73.0 ± 5.2 75.4 ± 6.8 72.0 ± 4.5 73.9 ± 5.4 74.0 ± 6.0 75.1 ± 6.4Gender (Aβ + + Aβ −, M/F) 55/66 56/55 40/41 33/27 129/123 26/20 Gender (Aβ +, M/F) 22/28 32/28 28/19 11/19 71/66 18/7 Gender (Aβ −, M/F) 31/40 24/27 12/22 22/8 58/57 11/10APOE4 (Aβ + + Aβ −, + /− ) 50/71 53/58 34/47 21/39 108/144 15/31 APOE4 (Aβ +, + /− ) 35/15 42/18 30/17 15/15 87/50 9/16 APOE4 (Aβ −, + /− ) 15/56 11/40 4/30 6/24 21/94 2/19SUVR (Aβ + + Aβ −, mean ± s.d.) 1.52 ± 0.51 1.75 ± 0.61* * * 0.71 ± 0.23 1.12 ± 0.21 1.71 ± 0.55 1.64 ± 0.47 SUVR (Aβ +, mean ± s.d.) 2.05 ± 0.37 2.24 ± 0.37* * * * 0.86 ± 0.2 1.29 ± 0.17 2.11 ± 0.43 1.98 ± 0.37 SUVR (Aβ -, mean ± s.d.) 1.14 ± 0.10 1.17 ± 0.08 0.51 ± 0.02 0.95 ± 0.05 1.23 ± 0.09 1.24 ± 0.10
Breakdown of the number of subjects for each variable, with the exception of age and standardized uptake value ratio (SUVR) values. SUVR values represent SUVR for PIB, FLUTE and FBP, and SUVR/BeCKeT (before the centiloid kernel transformation17) values for AIBL overall and CSF. Site differences between NCGG and AIBL were tested only for PIB-PET groups using Student’s t-test (age and SUVR) or χ 2 test (all others). The CSF group is a subset of the AIBL data including 17 PiB, 18 FLUTE, and 11 FBP cases. Asterisks indicate statistically significant site differences: * P = 0.043, * *P = 0.014, * * * P = 0.002, * * * * P = 0.007; two-sided tests.
0
0.2
0.4
0.6
0
5
10
15
20 P = 0.011
0.2
0.4
0.6
0.8P < 0.0001P < 0.0001
NCGG AIBL
Aβ+Aβ– Aβ+Aβ–
NCGG AIBL
Aβ+Aβ– Aβ+Aβ–
NCGG AIBL
Aβ+Aβ– Aβ+Aβ–
APP669–711 Aβ1–40 Aβ1–42
APP669–711/Aβ1–42 Aβ1–40/Aβ1–42 Composite biomarker
0
P < 0.0001 P < 0.0001 P < 0.0001 P < 0.0001 P < 0.0001 P < 0.0001
P < 0.0001P = 0.002
0
0.4
0.8
1.2
1.6
NCGG AIBL
Aβ+Aβ– Aβ+Aβ–
P < 0.00010
10
20
30
40
NCGG AIBL
Aβ+Aβ– Aβ+Aβ–
P < 0.0001
–3–2–101234
NCGG AIBL
Aβ+Aβ– Aβ+Aβ–
P < 0.0001
Nor
mal
ized
inte
nsity
(AU
)R
atio
of t
he p
eptid
es (A
U)
Rat
io o
f the
pep
tides
(AU
)
Com
pos
ite b
iom
arke
r va
lue
Figure 1 | The peptide and biomarker values in each study site. Box plots showing each peptide (upper), and test biomarker (lower) value in the NCGG (n = 121) and AIBL overall (n = 252) data sets. Significant group differences are indicated by P values (two-sided Student’s t-test or Welch’s t-test). The boxes represent the 25th, 50th (median) and 75th percentiles of the data; the whiskers represent the lowest (or highest) datum within 1.5× interquartile range from the 25th (or 75th) percentile. See Extended Data Fig. 2a for detailed values. AU, arbitrary units.
© 2018 Macmillan Publishers Limited, part of Springer Nature. All rights reserved.
0 0 M o n t h 2 0 1 8 | V o L 0 0 0 | n A t U R E | 3
Letter reSeArCH
Plasma-biomarker performances were also evaluated by clinical category. To obtain a sufficient number in each subpopulation (as esti-mated by power analysis; see Methods), AD and MCI were analysed as one group (AD/MCI), and compared with the cognitively normal group. The data for FLUTE and FBP were also grouped and analysed together as 18F-Aβ tracers. The results of the ROC analyses for the composite bio-marker are shown in Fig. 2d, e and Extended Data Table 1c (left). Within the clinical category of AD/MCI, the performance of the composite biomarker against PIB and 18F-Aβ tracers was very high, with AUCs of 97.4% and 89.4% and accuracies of 91.7% and 89.6%, respectively, in the unadjusted analysis for the validation AIBL data. Within the cognitively normal group, performance against PIB was also high (AUC = 91.7%, accuracy = 87.3%); however, performance against 18F-Aβ tracers was considerably lower (AUC = 80.0%, accuracy = 79.6%), and it did not
reach significance (DeLong test, uncorrected P = 0.053). Adjusted (age, gender and APOE4) analyses showed similar results (Extended Data Fig. 3d, e and Extended Data Table 1c, right).
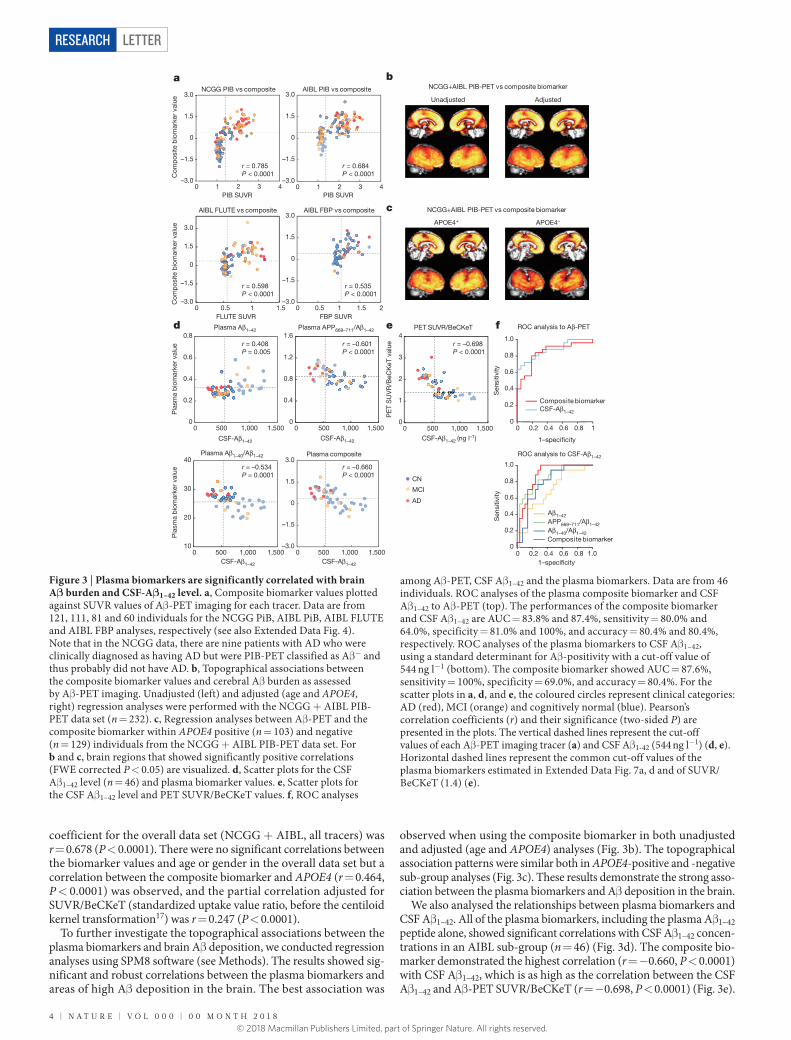
To evaluate the strength of the link between plasma biomarkers and Aβ -PET burden, we conducted correlation analyses. All of the plasma biomarkers, including Aβ 1–42 peptide alone, showed significant correla-tions with Aβ -PET burden (Fig. 3a and Extended Data Fig. 4a–d). The strongest correlations were found between PIB standardized uptake value ratio (SUVR) and the composite biomarker in the NCGG, AIBL and NCGG + AIBL combined data sets, with correlation coefficients of r = 0.785, 0.684 and 0.735, respectively (Pearson’s correlation coef-ficient, all P < 0.0001). The correlation coefficients against FLUTE-SUVR (r = 0.598, P < 0.0001) and FBP-SUVR (r = 0.535, P < 0.0001) were slightly lower than those observed with PIB. The correlation
0 0.2 0.4 0.6 0.8 1.00
0.2
0.4
0.6
0.8
1.0
Within CN
AIBL 18F-Aβ tracers AIBL PIBNCGG PIB
0 0.2 0.4 0.6 0.8 1.00
0.2
0.4
0.6
0.8
1.0
Within AD/MCI
AIBL FBPAIBL FLUTEAIBL PIBNCGG PIB
0 0.2 0.4 0.6 0.8 1.00
0.2
0.4
0.6
0.8
1.0
Different PET tracers
bio
mar
ker
Com
pos
ite
/Aβ 1
–42
Aβ 1
–40
/Aβ 1
–42
AP
P66
9–71
1
Aβ 1
–42
0.50.60.70.80.91.0
**, †††, ‡‡‡ **, †††, ‡‡‡
NS
**, †††, ‡‡‡
*, †††, ‡‡‡
***, †††, ‡‡‡
bio
mar
ker
Com
pos
ite
/Aβ 1
–42
Aβ 1
–40
/Aβ 1
–42
AP
P66
9–71
1
Aβ 1
–42
0.50.60.70.80.91.0
†††, ‡‡‡*, †††, ‡‡‡
*, †††, ‡‡‡
NS
†††, ‡‡
***, †††, ‡‡‡
Com
pos
iteb
iom
arke
r
/Aβ 1
–42
Aβ 1
–40
/Aβ 1
–42
AP
P66
9–71
1
Aβ 1
–42
0.50.60.70.80.91.0
NS†††, ‡
†††, ‡‡
*, †††, ‡‡‡
**, †††, ‡‡‡
*, †††, ‡‡‡
Validation: AIBL (overall)
0
0.2
0.4
0.6
0.8
1.0
0 0.2 0.4 0.6 0.8 1.00
0.2
0.4
0.6
0.8
1.0
1.00.80.60.40.20
Validation: AIBL (PIB)
1–speci�city 1–speci�city 1–speci�city
1–speci�city 1–speci�city 1–speci�city
1.00.80.60.40.20
Sen
sitiv
ityS
ensi
tivity
AU
C
0
0.2
0.4
0.6
0.8
1.0
Discovery: NCGG (PIB)
Composite biomarkerAβ1–40/Aβ1–42
APP669–711/Aβ1–42
Aβ1–42
edc
b
a
AIBL 18F-Aβ tracers AIBL PIBNCGG PIB
Figure 2 | High performance of the plasma biomarkers. a, ROC analyses for each biomarker when predicting individual Aβ +/Aβ − status for the discovery and validation data sets. Unadjusted analyses of the NCGG PIB discovery data (left), the AIBL PIB (middle) and AIBL overall (all tracers, right) validation data. See Extended Data Table 1a for detailed performance values. Data are from 121, 111 and 252 individuals for the NCGG PIB, AIBL and AIBL overall data, respectively. b, Comparisons of biomarker performances within each analysis corresponding to the ROC curves in a. Each colour bar represents the AUC and 95% confidence interval. Statistically significant differences between two AUCs (DeLong test) are indicated by asterisks: * P < 0.05, * * P < 0.01, * * * P < 0.001. Significant increments in predictive ability as assessed by NRI and IDI are indicated by daggers and double daggers, respectively. † or ‡P < 0.05; †† or ‡‡P < 0.01; ††† or ‡‡‡P < 0.001. All P values are two-sided and
Bonferroni corrected (multiplied by the number of comparisons, 6). NS, not significant. c, Unadjusted ROC analyses of the composite biomarker compared with different PET tracers; PIB (NCGG, n = 121, and AIBL, n = 111), flutemetamol (AIBL, n = 81), and florbetapir (AIBL, n = 60). See Extended Data Table 1b for detailed performance values. d, e, Unadjusted ROC curves of the composite biomarker within the AD and MCI (d), and cognitively normal (e) groups. For the AD and MCI group, data are from 59 individuals for NCGG PIB and from 48 individuals for AIBL PIB and the 18F-Aβ tracers. For the analyses of the cognitively normal group, data are from 62, 63 and 93 individuals for NCGG PIB, AIBL PIB and the 18F Aβ tracers, respectively. See Extended Data Table 1c for detailed performance values; corresponding results of the adjusted analyses for a–e are shown in Extended Data Fig. 3.
© 2018 Macmillan Publishers Limited, part of Springer Nature. All rights reserved.
4 | n A t U R E | V o L 0 0 0 | 0 0 M o n t h 2 0 1 8
LetterreSeArCH
coefficient for the overall data set (NCGG + AIBL, all tracers) was r = 0.678 (P < 0.0001). There were no significant correlations between the biomarker values and age or gender in the overall data set but a correlation between the composite biomarker and APOE4 (r = 0.464, P < 0.0001) was observed, and the partial correlation adjusted for SUVR/BeCKeT (standardized uptake value ratio, before the centiloid kernel transformation17) was r = 0.247 (P < 0.0001).
To further investigate the topographical associations between the plasma biomarkers and brain Aβ deposition, we conducted regression analyses using SPM8 software (see Methods). The results showed sig-nificant and robust correlations between the plasma biomarkers and areas of high Aβ deposition in the brain. The best association was
observed when using the composite biomarker in both unadjusted and adjusted (age and APOE4) analyses (Fig. 3b). The topographical association patterns were similar both in APOE4-positive and -negative sub-group analyses (Fig. 3c). These results demonstrate the strong asso-ciation between the plasma biomarkers and Aβ deposition in the brain.
We also analysed the relationships between plasma biomarkers and CSF Aβ 1–42. All of the plasma biomarkers, including the plasma Aβ 1–42 peptide alone, showed significant correlations with CSF Aβ 1–42 concen-trations in an AIBL sub-group (n = 46) (Fig. 3d). The composite bio-marker demonstrated the highest correlation (r = − 0.660, P < 0.0001) with CSF Aβ 1–42, which is as high as the correlation between the CSF Aβ 1–42 and Aβ -PET SUVR/BeCKeT (r = − 0.698, P < 0.0001) (Fig. 3e).
PIB SUVR
–3.0
–1.5
0
1.5
3.0
0 1 2 3 4
–3.0
–1.5
0
1.5
3.0
0 0.5 1 1.5–3.0
–1.5
0
1.5
3.0
0 0.5 1 1.5 2
–3.0
–1.5
0
1.5
3.0
0 1 2 3 4
0
0.4
0.8
1.2
1.6
0 500 1,000 1,5000
0.2
0.4
0.6
0.8
0 500 1,000 1,500
10
20
30
40
0 500 1,000 1,500–3.0
–1.5
0
1.5
3.0
0 500 1,000 1,500
0
1
2
3
4
0 500 1,000 1,500
a
c
b
d e
r = 0.684P < 0.0001
r = 0.785P < 0.0001
r = 0.598P < 0.0001
r = 0.535P < 0.0001
r = –0.601P < 0.0001
r = 0.408P = 0.005
r = –0.534P = 0.0001
r = –0.660P < 0.0001
r = –0.698P < 0.0001
CSF-Aβ1–42
Plasma composite
Plasma APP669–711/Aβ1–42Plasma Aβ1–42
Plasma Aβ1–40/Aβ1–42
PET SUVR/BeCKeT
PE
T S
UV
R/B
eCK
eT v
alue
NCGG PIB vs composite AIBL PIB vs composite
AIBL FLUTE vs composite AIBL FBP vs composite
NCGG+AIBL PIB-PET vs composite biomarker
NCGG+AIBL PIB-PET vs composite biomarker
APOE4+ APOE4–
Unadjusted Adjusted
CSF-Aβ1–42 (ng l–1)CSF-Aβ1–42
CSF-Aβ1–42CSF-Aβ1–42
PIB SUVR
FBP SUVRFLUTE SUVRf
0
0.2
0.4
0.6
0.8
1.0
0 0.2 0.4 0.6 0.8 1.0
0
0.2
0.4
0.6
0.8
1.0
0 0.2 0.4 0.6 0.8 1
Composite biomarkerCSF-Aβ1–42
Aβ1–42APP669–711/Aβ1–42Aβ1–40/Aβ1–42Composite biomarker
ROC analysis to Aβ-PET
ROC analysis to CSF-Aβ1–42
Sen
sitiv
ity
1–speci�city
AD
MCI
CN
Com
pos
ite b
iom
arke
r va
lue
Com
pos
ite b
iom
arke
r va
lue
Pla
sma
bio
mar
ker
valu
eP
lasm
a b
iom
arke
r va
lue
1–speci�city
Sen
sitiv
ity
Figure 3 | Plasma biomarkers are significantly correlated with brain Aβ burden and CSF-Aβ1–42 level. a, Composite biomarker values plotted against SUVR values of Aβ -PET imaging for each tracer. Data are from 121, 111, 81 and 60 individuals for the NCGG PiB, AIBL PiB, AIBL FLUTE and AIBL FBP analyses, respectively (see also Extended Data Fig. 4). Note that in the NCGG data, there are nine patients with AD who were clinically diagnosed as having AD but were PIB-PET classified as Aβ − and thus probably did not have AD. b, Topographical associations between the composite biomarker values and cerebral Aβ burden as assessed by Aβ -PET imaging. Unadjusted (left) and adjusted (age and APOE4, right) regression analyses were performed with the NCGG + AIBL PIB-PET data set (n = 232). c, Regression analyses between Aβ -PET and the composite biomarker within APOE4 positive (n = 103) and negative (n = 129) individuals from the NCGG + AIBL PIB-PET data set. For b and c, brain regions that showed significantly positive correlations (FWE corrected P < 0.05) are visualized. d, Scatter plots for the CSF Aβ 1–42 level (n = 46) and plasma biomarker values. e, Scatter plots for the CSF Aβ 1–42 level and PET SUVR/BeCKeT values. f, ROC analyses
among Aβ -PET, CSF Aβ 1–42 and the plasma biomarkers. Data are from 46 individuals. ROC analyses of the plasma composite biomarker and CSF Aβ 1–42 to Aβ -PET (top). The performances of the composite biomarker and CSF Aβ 1–42 are AUC = 83.8% and 87.4%, sensitivity = 80.0% and 64.0%, specificity = 81.0% and 100%, and accuracy = 80.4% and 80.4%, respectively. ROC analyses of the plasma biomarkers to CSF Aβ 1–42, using a standard determinant for Aβ -positivity with a cut-off value of 544 ng l−1 (bottom). The composite biomarker showed AUC = 87.6%, sensitivity = 100%, specificity = 69.0%, and accuracy = 80.4%. For the scatter plots in a, d, and e, the coloured circles represent clinical categories: AD (red), MCI (orange) and cognitively normal (blue). Pearson’s correlation coefficients (r) and their significance (two-sided P) are presented in the plots. The vertical dashed lines represent the cut-off values of each Aβ -PET imaging tracer (a) and CSF Aβ 1-42 (544 ng l−1) (d, e). Horizontal dashed lines represent the common cut-off values of the plasma biomarkers estimated in Extended Data Fig. 7a, d and of SUVR/BeCKeT (1.4) (e).
© 2018 Macmillan Publishers Limited, part of Springer Nature. All rights reserved.
0 0 M o n t h 2 0 1 8 | V o L 0 0 0 | n A t U R E | 5
Letter reSeArCH
In order to further elucidate the relevance of the three different types of Aβ -related biomarkers, we conducted ROC analyses among Aβ -PET, CSF Aβ 1−42, and plasma biomarkers. If Aβ -PET is used as the standard classifier for Aβ +/Aβ − status, the plasma composite biomarker and CSF Aβ 1–42 showed identical accuracy (80.4%) with AUCs 83.8% and 87.4%, respectively (Fig. 3f, upper). Also, if we use the CSF Aβ 1−42 as the standard classifier, the plasma composite biomarker showed 87.6% AUC and 80.4% accuracy (Fig. 3f, lower). The performance of the plasma Aβ composite biomarker was comparable to that of CSF Aβ biomarkers18–22. These results demonstrate that the three different types of Aβ -related biomarker (plasma and CSF Aβ , and PET imaging), are highly correlated with each other, clearly indicating that plasma Aβ biomarkers are strongly linked with the Aβ status of the CNS, but less affected by the Aβ known to be produced in peripheral tissues23.
The reasons for the high performance of the plasma Aβ assays and the reliability of our IP–MS method are discussed in detail in the Supplementary Discussion and demonstrated in Extended Data Fig. 5. It should be reiterated that our biomarkers are not peptide levels, but are the ratios of plasma Aβ 1–42 to the reference peptides APP669–711 and Aβ 1–40. As these reference peptides have similar amino acid sequences and molecular sizes to Aβ 1–42, the large inter-individual variances in plasma Aβ levels, which are influenced by a wide variety of conditions5,23,24 or anti-Aβ autoantibodies1, should be reduced by the use of ratios. Several reports have proposed that the plasma ratio of Aβ 1–40 and Aβ 1–42 could be useful as a surrogate for brain Aβ status, although its performance has not been sufficient to allow reliable prediction of the individual status of brain Aβ burden5,6,25. Aβ 1–40 is known to aggregate less than Aβ 1–42
26, but neither the nature nor the molecular behaviour of APP669–711 is known. Therefore, we performed two in vitro experiments, and found that APP669–711 is a real neuronal product (Supplementary Information and Extended Data Fig. 6a) and that APP669–711 showed much less self-assembly tendency than Aβ 1–42 (Supplementary Information and Extended Data Fig. 6b–d).
There were considerable site differences in plasma Aβ and biomarker levels between the NCGG and AIBL data sets. We speculate that these were mainly due to pre-analytic factors, for example, differences in the procedures used for plasma processing (Supplementary Discussion). These between-site differences may complicate the establishment of a common cut-off value, which is essential for the widespread and multicentre use of biomarkers. It should be noted that this problem is still the biggest issue for CSF biomarkers, as highlighted recently27, and it is proving difficult to solve. To elucidate the influence of these between-site differences on biomarker performance, we explored optimal common cut-off values applicable for both sites by performing additional ROC analyses for the combined data sets (NCGG + AIBL), which allowed us to assess the classifying ability under the same biomarker levels across the sites. The results demonstrated that the biomarker performances were also high in the combined data sets (Extended Data Fig. 7a), and that the composite biomarker showed the highest classifying ability (Extended Data Fig. 7b). When we applied cut-off values determined by the Youden’s index (see Methods) in the NCGG + AIBL overall data set, the performances were still very high in both the discovery and validation data sets (Extended Data Fig. 7c); for example, the composite biomarker showed 87.6% and 87.4% accuracy in the NCGG PIB and AIBL PIB data sets, respectively. The relevance of the cut-off values for biomarker performances is further visualized by the diagnostic performance plots in Extended Data Fig. 7d. These results support the stability of the biomarker performances with iden-tical cut-off levels between sites.
Finally, we estimated possible clinical utility of the plasma biomarkers in several practical situations. First, we assessed the potential benefit of the plasma composite biomarker assuming two specific settings: screen-ing for preclinical AD or prodromal AD to identify potential clinical trial candidates (see Supplementary Discussion and Extended Data Fig. 8a, b). Both scenarios suggest that the plasma biomarker screens could reduce unnecessary Aβ -PET scans, substantially facilitating
recruitment for clinical trials. Furthermore, we assessed the potential utility of the plasma biomarker in daily clinical practice. When there is diagnostic uncertainty about a clinical diagnosis of AD, Aβ -PET is considered to have a major clinical effect, providing diagnostic confi-dence or leading to changes in diagnosis28. In the NCGG data set, there were 9 out of 29 (31%) patients who had been diagnosed with AD but were PIB-PET negative, and the composite biomarker classified eight of them as Aβ negative; therefore, the plasma biomarkers can also be expected to play an important clinical role. To confirm this possibility, we conducted an additional study with a new clinical data set consisting of 31 AD (22 Aβ + and 9 Aβ −, classified by PIB-PET) and 20 non-AD (8 Aβ + and 12 Aβ −) cases (see Supplementary Discussion and Extended Data Fig. 8c, d). The plasma composite biomarker showed 96.7% sensi-tivity, 81.0% specificity, and 90.2% accuracy in the overall data (n = 51) when predicting individual Aβ status (Aβ + or Aβ −) using the common cut-off value (0.376) (Extended Data Fig. 8e–g). The results suggest that the plasma biomarker could be helpful for the differential diagnosis of AD and aid in determining therapeutic strategies, by providing addi-tional information on the brain Aβ deposition status of individuals. As cost–benefit analysis of the use of Aβ -PET for this purpose has proven controversial29, the impact of the plasma biomarker on daily clinical practice could be substantial.
The findings of the present study are considered to be robust, repro-ducible and reliable because biomarker performance was validated in a blinded manner using independent data sets (Japan and Australia) and involved an established large-scale multicentre cohort (AIBL). However, there are still several issues that need to be addressed before general clinical application can be considered. First, further valida-tion studies (preferably in subjects drawn from primary care settings) coupled with longitudinal data will be needed. Second, standardized operating procedures for the analytical process as well as the pre- and post-analytical steps should be established30, preferably through an international consortium. Under the controlled and standardized oper-ating procedures, optimal cut-off values as well as the optimal mathe-matical generation of the composite biomarker (see Supplementary Discussion and Extended Data Fig. 9a–c) should be established. Third, in clinical trials targeting Aβ reduction, the usefulness of this plasma Aβ biomarker as a monitoring tool remains to be evaluated. Fourth, biomarker performances for the differential diagnosis of other types of dementia need to be established. Finally, development of an automated assay system to stabilize the analytic factor and to enhance throughput of the IP–MS method is underway.
Online Content Methods, along with any additional Extended Data display items and Source Data, are available in the online version of the paper; references unique to these sections appear only in the online paper.
received 22 March; accepted 11 December 2017.
Published online 31 January 2018.
1. Sevigny, J. et al. The antibody aducanumab reduces Aβ plaques in Alzheimer’s disease. Nature 537, 50–56 (2016).
2. Sperling, R., Mormino, E. & Johnson, K. The evolution of preclinical Alzheimer’s disease: implications for prevention trials. Neuron 84, 608–622 (2014).
3. Henriksen, K. et al. The future of blood-based biomarkers for Alzheimer’s disease. Alzheimers Dement. 10, 115–131 (2014).
4. O’Bryant, S. E. et al. Blood-based biomarkers in Alzheimer disease: Current state of the science and a novel collaborative paradigm for advancing from discovery to clinic. Alzheimers Dement. 13, 45–58 (2017).
5. Rembach, A. et al. Changes in plasma amyloid β in a longitudinal study of aging and Alzheimer’s disease. Alzheimers Dement. 10, 53–61 (2014).
6. Swaminathan, S. et al. Association of plasma and cortical amyloid beta is modulated by APOE ε 4 status. Alzheimers Dement. 10, e9–e18 (2014).
7. Lövheim, H. et al. Plasma concentrations of free amyloid β cannot predict the development of Alzheimer’s disease. Alzheimers Dement. 13, 778–782 (2017).
8. Kaneko, N. et al. Novel plasma biomarker surrogating cerebral amyloid deposition. Proc. Jpn. Acad., Ser. B, Phys. Biol. Sci. 90, 353–364 (2014).
9. Ovod, V. et al. Amyloid β concentrations and stable isotope labeling kinetics of human plasma specific to central nervous system amyloidosis. Alzheimers Dement. 13, 841–849 (2017).
10. Gelfanova, V. et al. Quantitative analysis of amyloid-β peptides in cerebrospinal fluid using immunoprecipitation and MALDI-Tof mass spectrometry. Brief. Funct. Genomic. Proteomic. 6, 149–158 (2007).
© 2018 Macmillan Publishers Limited, part of Springer Nature. All rights reserved.
6 | n A t U R E | V o L 0 0 0 | 0 0 M o n t h 2 0 1 8
LetterreSeArCH
11. Kaneko, N., Yamamoto, R., Sato, T. A. & Tanaka, K. Identification and quantification of amyloid β-related peptides in human plasma using matrix-assisted laser desorption/ionization time-of-flight mass spectrometry. Proc. Jpn. Acad., Ser. B, Phys. Biol. Sci. 90, 104–117 (2014).
12. Ellis, K. A. et al. The Australian Imaging, Biomarkers and Lifestyle (AIBL) study of aging: methodology and baseline characteristics of 1112 individuals recruited for a longitudinal study of Alzheimer’s disease. Int. Psychogeriatr. 21, 672–687 (2009).
13. Vandenberghe, R. et al. 18F-flutemetamol amyloid imaging in Alzheimer disease and mild cognitive impairment: a phase 2 trial. Ann. Neurol. 68, 319–329 (2010).
14. Wong, D. F. et al. In vivo imaging of amyloid deposition in Alzheimer disease using the radioligand 18F-AV-45 (florbetapir F 18). J. Nucl. Med. 51, 913–920 (2010).
15. Landau, S. M. et al. Amyloid PET imaging in Alzheimer’s disease: a comparison of three radiotracers. Eur. J. Nucl. Med. Mol. Imaging 41, 1398–1407 (2014).
16. Mormino, E. C. et al. Amyloid and APOE ε 4 interact to influence short-term decline in preclinical Alzheimer disease. Neurology 82, 1760–1767 (2014).
17. Villemagne, V. L. et al. En attendant centiloid. Adv. Res. 2, 723–729 (2014).18. Fagan, A. M. et al. Comparison of analytical platforms for cerebrospinal
fluid measures of β -amyloid 1-42, total tau, and p-tau181 for identifying Alzheimer disease amyloid plaque pathology. Arch. Neurol. 68, 1137–1144 (2011).
19. Irwin, D. J. et al. Comparison of cerebrospinal fluid levels of tau and Aβ 1-42 in Alzheimer disease and frontotemporal degeneration using 2 analytical platforms. Arch. Neurol. 69, 1018–1025 (2012).
20. Jagust, W. J. et al. Relationships between biomarkers in aging and dementia. Neurology 73, 1193–1199 (2009).
21. Li, Q. X. et al. Alzheimer’s disease normative cerebrospinal fluid biomarkers validated in PET amyloid-β characterized subjects from the Australian Imaging, Biomarkers and Lifestyle (AIBL) study. J. Alzheimers Dis. 48, 175–187 (2015).
22. Shaw, L. M. et al. Cerebrospinal fluid biomarker signature in Alzheimer’s disease neuroimaging initiative subjects. Ann. Neurol. 65, 403–413 (2009).
23. Wang, J., Gu, B. J., Masters, C. L. & Wang, Y. J. A systemic view of Alzheimer disease - insights from amyloid-β metabolism beyond the brain. Nat. Rev. Neurol. 13, 612–623 (2017).
24. Janelidze, S. et al. Plasma β -amyloid in Alzheimer’s disease and vascular disease. Sci. Rep. 6, 26801 (2016).
25. Rembach, A. et al. Plasma amyloid-β levels are significantly associated with a transition toward Alzheimer’s disease as measured by cognitive decline and change in neocortical amyloid burden. J. Alzheimers Dis. 40, 95–104 (2014).
26. Jarrett, J. T., Berger, E. P. & Lansbury, P. T., Jr. The C-terminus of the β protein is critical in amyloidogenesis. Ann. NY Acad. Sci. 695, 144–148 (1993).
27. Rogers, M. B. Are CSF Assays Finally Ready for Prime Time? Alzforum https://www.alzforum.org/news/conference-coverage/are-csf-assays-finally-ready-prime-time (2017)
28. Boccardi, M. et al. Assessment of the incremental diagnostic value of florbetapir F 18 imaging in patients with cognitive impairment: the incremental diagnostic value of amyloid PET with [18F]-florbetapir (INDIA-FBP) Study. JAMA Neurol. 73, 1417–1424 (2016).
Supplementary Information is available in the online version of the paper.
Acknowledgements The NCGG study group thank all participants of the study, clinicians who referred patients, and all the staff who supported the MULNIAD project. We thank N. Sugimoto for conducting statistical analyses, S. Niida and the NCGG Biobank members for the management of plasma samples and M. Kawakage for data monitoring. This study was supported by The Research Funding for Longevity Sciences (25-24 and 26-30) from the National Center for Geriatrics and Gerontology, and partially supported by Research and Development Grants for Dementia from the Japan Agency for Medical Research and Development, AMED. This study is registered under UMIN ID: 000016144. The AIBL study would like to thank all participants of the study and the clinicians who referred participants. The AIBL study (https://aibl.csiro.au/) is a consortium between Austin Health, CSIRO, Edith Cowan University and the Florey Institute, The University of Melbourne. Partial financial support was provided by the Alzheimer’s Association (US), the Alzheimer’s Drug Discovery Foundation, an anonymous foundation, the Cooperative Research Centre for Mental Health, CSIRO Science and Industry Endowment Fund, the Dementia Collaborative Research Centres, the Victorian Government Operational Infrastructure Support program, the McCusker Alzheimer’s Research Foundation, the National Health and Medical Research Council, and the Yulgilbar Foundation. Funding sources had no role in study design, data collection, data analyses or data interpretation.
Author Contributions A.N., N.K., T.K., K.It., K.T., and K.Y. designed the study. A.N., N.K., V.L.V., C.L.M., and K.Y. wrote the manuscript and A.N., N.K., V.L.V., V.D., T.T., and K.M. made the figures. A.N., V.L.V., T.K., V.D., C.F., Q.-X.L., R.M., C.R., Ke.Is., Ka.Is., Y.A., and C.L.M. collected the data. A.N., N.K., V.L.V., T.K., J.D., V.D., C.F., Q.-X.K., R.M., C.R., Y.A., T.T., K.M., S.I., K.It., K.T., and C.L.M. analysed the data. All authors interpreted the data and critically revised the manuscript.
Author Information Reprints and permissions information is available at www.nature.com/reprints. The authors declare competing financial interests: details are available in the online version of the paper. Readers are welcome to comment on the online version of the paper. Publisher’s note: Springer Nature remains neutral with regard to jurisdictional claims in published maps and institutional affiliations. Correspondence and requests for materials should be addressed to K.Y. ([email protected]).
reviewer Information Nature thanks H. Federoff, R. Thomas and the other anonymous reviewer(s) for their contribution to the peer review of this work.
29. Caselli, R. J. & Woodruff, B. K. Clinical impact of amyloid positron emission tomography—is it worth the cost? JAMA Neurol. 73, 1396–1398 (2016).
30. O’Bryant, S. E. et al. Guidelines for the standardization of preanalytic variables for blood-based biomarker studies in Alzheimer’s disease research. Alzheimers Dement. 11, 549–560 (2015).
© 2018 Macmillan Publishers Limited, part of Springer Nature. All rights reserved.
Letter reSeArCH
MeThODSSubjects. The participants were aged 60 to 90 years. The discovery NCGG data set consisted of 62 cognitively normal individuals, 30 with MCI, and 29 with AD (121 in total) selected from in-house clinical studies at the NCGG. The AIBL data set for external validation consisted of 156 cognitively normal individuals, 68 with MCI, and 30 with AD participants (254 in total).
All participants from the NCGG were native Japanese, recruited from commu-nity dwellings and outpatients of the National Hospital for Geriatric Medicine at NCGG. The clinical classification of NCGG subjects was determined by following the inclusion criteria of the Alzheimer's Disease Neuroimaging Initiative 2 (ADNI2) study (http://adni.loni.usc.edu/). The definition of the cognitively normal group in the NCGG data set is generally equivalent to the cognitively normal group in the ADNI2 study. All of the AD and MCI subjects also fulfilled the diag-nostic criteria developed by the National Institute on Aging and the Alzheimer’s Association (NIA-AA)31,32. The samples were selected on the basis of age, clinical category (cognitively normal, MCI or AD), and data availability for both plasma measurements and Aβ -PET imaging data. Subjects under treatment for any sub-stantial medical, neurological, or psychiatric disease, or with any history of a major psychiatric disorder, alcohol dependence, or substance dependence, were excluded. Individuals with any clinically significant focal brain lesion by MRI were also excluded. There were no individuals at the extremes of socio-economic status.
AIBL is a two-site (Melbourne and Perth), longitudinal cohort study, integrating neuroimaging, biomarker, neuropsychometric, and lifestyle data. The AIBL study population was selected from English-speaking volunteers who responded to media advertisements, or clinical cases that were referred to the study by a network of doctors. The AIBL study has strict selection criteria to eliminate, as much as possible, comorbidities such as vascular disease and diabetes, but no requirement on socio-economic status. Approximately 48% of the AIBL cohort reported more than 13 years of education. Clinical classification of the AIBL study was deter-mined as previously described12. The AIBL samples were selected with the same conditions as those selected from the NCGG, so that age, sex, and clinical category matched.
In both the NCGG and AIBL data sets, all selected subjects had stored plasma samples and corresponding Aβ -PET imaging data that were acquired within one year of plasma sampling. The mean and s.d. of the time discrepancies between plasma sampling and PET imaging were 41.1 ± 97.5 and 115.7 ± 93.9 days for NCGG and AIBL, respectively.
Both studies were approved by the appropriate institutional ethics committee (NCGG Ethics Committee, Japan, and Human Research Ethics Committee, Research Governance Unit, St Vincent’s Healthcare, Australia, respectively), and were performed following all relevant ethical regulations. Written informed consent was obtained from all participants (or their legal guardians) before participation.
From the 254 plasma samples in the total AIBL data set, two outliers were excluded from the analyses. One subject’s abnormally high Aβ signals from IP–MS masked the peak of the internal standard which prevented reliable measurements, and the other subject showed Aβ concentrations 9.2–20.5 times higher than the s.d.Imaging data. Aβ -PET imaging for the discovery set in NCGG was performed with 11C-PIB (PIB), while Aβ imaging for the AIBL validation set was performed with three different radiotracers: PIB, FLUTE, or FBP. The PET methodology for each tracer has been previously described33. In brief, PET images were spatially normalized with CapAIBL using an adaptive atlas34, and sampled using a preset template of narrow cortical regions of interest (ROI). For semi-quantitative analysis, a volume of interest template was applied to the summed and spatially normalized PET images in order to obtain a standardized uptake value (SUV). The images were then scaled to the SUV of each tracer’s recommended reference region to generate a tissue ratio termed the SUV ratio (SUVR). A global measure of Aβ burden was computed using the mean SUVR in the frontal, superior parietal, lateral temporal, lateral occipital, and anterior and posterior cingulate regions. For PIB, the SUVs were normalized to the cerebellar cortex, the whole cerebellum was used as the reference region for FBP35 while for FLUTE the pons was used as the reference region36 as advocated by the pharmaceutical companies that supplied each tracer. The SUVR was dichotomized as having a high (Aβ +) or low (Aβ −) Aβ burden, using a cut-off value that was determined for each tracer. Participants who underwent PIB were considered to have high Aβ when SUVR ≥ 1.40, for FLUTE when SUVR ≥ 0.55 and for FBP when SUVR ≥ 1.05. For the analysis across different PET tracers, BeCKeT values, which are a linear transformed standardiza-tion of FLUTE and FBP SUVR onto ‘PIB-like’ SUVR17, were used.
Individual MRI with high-resolution 3D T1-weighted, T2-weighted, and fluid-attenuated inversion recovery images were acquired for all NCGG and AIBL participants. These MRIs were used to exclude subjects who had substantial brain lesions.
Voxelwise-correlational analyses were performed after spatially normalizing and scaling all PET images with CapAIBL34. In brief, a combined plasma–PET statistical analysis was performed using SPM8 software, in which the associations between plasma biomarkers and Aβ -PET were estimated using a linear regression model within each cohort (discovery, validation, and all PIB combined) and each tracer (PIB, FLUTE, FBP, and all combined), using one plasma biomarker at a time as the dependent variable and Aβ -PET as the independent variable. The models were further examined after adjusting for age and APOE status. The statistical threshold for the voxelwise computations in SPM8 was set at P < 0.05, using FWE to correct for multiple comparisons at a peak level.Blood processing and plasma storage. In the NCGG study, blood samples were collected between 11:00 and 15:00. Plasma was isolated from whole blood collected in 7-ml EDTA-2Na tubes (Venoject II, TERUMO). Within 5 min of blood collection, whole blood was centrifuged at 2273g for 5 min at room temperature. Otherwise, the blood was temporally stored on ice for up to 30 min, and then centrifuged. The plasma was immediately transferred to storage tubes (48 Jacket Tubes 2.0ml External-Type, FCR&Bio) as 250- or 500-μ l aliquots, and frozen immediately in a − 80 °C freezer. The plasma samples were stocked in the NCGG biobank, where each was assigned its own ID independent of the study ID. The research group did not intervene in sample collection and shipping to the Shimadzu Corporation for IP–MS assays was performed in a blinded manner.
In AIBL, blood samples were collected between 9:00 and 10:00. Plasma was isolated from whole blood collected in Sarstedt s-monovette 7.5-ml EDTA tubes (Sarstedt) with pre-added Prostaglandin E1 (PGE1, Sapphire Bioscience) to produce a final PGE1 concentration of 33 ng ml−1 of whole blood. Processing started after bloods had equilibrated with room temperature and within 1 h of collection. Whole blood was centrifuged at 200g for 10 min at room temperature (no deceleration) to generate a platelet-rich plasma (PRP) layer. The PRP was trans-ferred using 3-ml transfer pipettes (Livingstone) to a new 15-ml polypropylene centrifuge tube (Greiner Bio-One CELLSTAR). Both the collection tube and 15-ml tubes were centrifuged at 800g for 15 min at room temperature, maximum deceleration. Plasma was combined into a new 15-ml polypropylene tube and spun at 3,200g for 30 min to remove debris. Plasma, as 250-μ l aliquots, was stored in 1-ml capacity NUNC 2D barcoded Bank-IT polypropylene cryovials (NUNC) and frozen immediately on dry ice before long term storage in vapour-phase liquid nitrogen. For the AIBL samples, following confirmation that the proposed cohort had age, gender and APOE4 matching between the clinical groups, a new study ID was attached to the blood tubes before shipment to Shimadzu. Researchers at Shimadzu were blinded to any associated clinical or PET data until the data collected were complete and locked.Plasma Aβ measurements. Plasma Aβ levels were measured using IP–MS, which is an analytical technique that quantifies Aβ -related peptides of different mass in MALDI-TOF mass spectrometry after they have been isolated and enriched from abundant plasma proteins by immunoprecipitation using the specific affinity of an antibody. This assay was modified from previously reported procedures8 with two major modifications being made. First, general antibody beads, prepared by coupling intact IgG monoclonal antibody 6E10 (BioLegend) directly to Dynabeads M-270 Epoxy (Thermo Fisher Scientific) according to the manufacturer’s protocol, were used for immunoprecipitation. This method for preparing the antibody beads is more simple and practical than the previously reported method because it does not require generation and purification of two antigen-binding fragments (F(ab′ )) from IgGs (clone 6E10 and 4G8) or the coupling of them on beads through PEG. Second, the immunoprecipitation procedure was carried out using two rounds of repeated processing, which both reduces the non-specific binding of abundant proteins that interferes with the signals of the Aβ -related peptides, and increases specificity during the detection of Aβ -related peptides in MALDI–TOF mass spectrometry.
In detail, 250 μ l of plasma was mixed with an equal volume of Tris buffer con-taining 10 pM stable-isotope-labelled (SIL) Aβ 1–38 peptide (AnaSpec, San Jose, CA), 0.2% w/v n-dodecyl-β -d-maltoside (DDM) and 0.2% w/v n-nonyl-β -d- thiomaltoside (NTM). The SIL-Aβ 1–38 peptide was used as internal standard for normalization of signals for all Aβ -related peptides in the mass spectrum, which was different from other mass spectrometry-based studies9,37,38 that used syn-thetic peptides corresponding to each Aβ -related peptide as the internal standards (for example, SIL-Aβ 1–42 for Aβ 1–42, and SIL-Aβ 1–40 for Aβ 1-40). This was because Aβ 1–38 is relatively easy to deal with as it has a lower self-aggregating tendency and lower adsorption in storage tubes when compared to Aβ 1–42
39–41. More impor-tantly, using a common internal standard has an advantage when computing peptide ratios, because it can cancel out any implicit errors related to the amounts of added SIL-Aβ 1–38 caused by activities such as production, preparation and/or handling. Furthermore, using only one standard peptide is simpler than handling three standard peptides, which has cost–benefit implications (see Supplementary
© 2018 Macmillan Publishers Limited, part of Springer Nature. All rights reserved.
LetterreSeArCH
Discussion and Extended Data Fig. 5d–f). The nonionic detergents DDM and NTM were used for reducing nonspecific binding and obtaining high signals of Aβ -related peptides in MALDI–TOF mass spectrometry. The plasma Aβ -related peptides and internal standard were immunoprecipitated by incubating the anti-body beads with the plasma sample for 1 h. The bound peptides were washed and eluted with glycine buffer (pH 2.8) containing 0.1% w/v DDM. After the pH was adjusted to 7.4 with Tris buffer, the immunoprecipitation was repeated once and the bound peptides were eluted with 70% acetonitrile containing 5 mM HCl. The eluted peptides were applied on four wells of a 900-μ m μ Focus MALDI plateTM (Hudson Surface Technology) which was prespotted with α -cyano-4-hydroxycinnamic acid (CHCA) and methanediphosphonic acid (MDPNA). Mass spectra were acquired using a MALDI-linear TOF mass spectrometer (AXIMA Performance, Shimadzu/KRATOS) equipped with a 337-nm nitrogen laser in the positive ion mode. The m/z value and signal variability in the mass spectrometer were calibrated externally with a mixture of standard peptides to improve the precision of the Aβ -related peptide signal peak. The peak intensities were extracted using Mass+ + software v2 (ref. 42) (Shimadzu). The peptide mass tolerance for quantification was set within 2.5 Da of the theoretical mass. The limit of detection was established at a signal-to-noise ratio of 3:1. One assay produced four mass spectra and the levels of plasma Aβ -related peptides were obtained by averaging the four spectra normalized with SIL-Aβ 1–38. The normalized intensity was used as plasma Aβ -related peptide levels. The quantitativeness and reliability of the IP–MS assay were carefully validated by several steps as detailed in the Supplementary Discussion and Extended Data Fig. 5a–c. Using the IP–MS method, we tested linear relationships between the normalized signal intensity and the concentration of Aβ -related peptides in PBS containing 3 mg ml−1 bovine serum albumin, and in human plasma, and ensured the reliability of quantification. For example, we analysed the dose dependency of the normalized intensity for each of three synthetic peptides (Aβ 1–42, Aβ 1–40, and APP669–711) that had been spiked into the human plasma. The results showed very good linearity for each peptide with coefficients of determination (R2) between 0.999 and 1.000 (Extended Data Fig. 5c). These R2 values are as high as, or even higher than, those reported in a mass spectrometry-based study that used SIL- Aβ 1–42 and SIL-Aβ 1–40 as internal standards for each corresponding peptide meas-ured in CSF37. Each peptide is ionized differently during mass spectrometry; our standard curves show different slopes as previously reported37, but this does not affect the robustness and reproducibility of quantification. We also verified the reproducibility of the assay using human EDTA plasma (Tennessee Blood Services). The intra- and inter-day assay coefficients of variance obtained for Aβ 1–40 were 4.2–4.7% (n = 5) and 3.2–6.8% (n = 3), respectively; for Aβ 1-42 the coefficients were 6.8–7.8% and 1.6–7.7%, respectively, and for APP669-711 the coef-ficients were 2.9–8.2% and 4.7–10.7%, respectively. These values are smaller than those obtained for within-laboratory CSF biomarker assays43 (5% to 19%), sup-porting the reliability of our measurements. The IP–MS method can also measure other forms of plasma Aβ such as Aβ 1–38 and Aβ 1–39, but we did not focus on them in this study.CSF biomarker measurements. In the AIBL data set, 46 subjects underwent CSF testing within two months of blood sampling and Aβ -PET imaging. The procedures for CSF sampling and biomarker measurements were performed as previously described21. In this study, we focused on analysing CSF Aβ 1–42 values, which were measured by ELISA21. The cut off value of CSF Aβ 1–42 was 544 ng l−1 (ref. 21, below which Aβ 1–42 was considered abnormal).Sample size considerations. The power calculations for sample sizes in the study were estimated as follows: assuming that the biomarker candidates could be used to classify individuals as Aβ + or Aβ − with a sensitivity of ≥ 80% and a theoretical sensitivity of 50%, the sample size required to achieve a statistical power of 80% at a 5% significance level would be 20 and 20 for both Aβ + and Aβ − groups. Also, assuming that the plasma biomarkers could show more than a 0.5 correlation coefficient (r) to Aβ -PET SUVR values or to CSF biomarker values, a total sample size of 21 would be required to achieve a statistical power of 80% at a 5% signifi-cance level. Both the NCGG and AIBL data sets, including the subpopulation with CSF data, satisfied these sample size requirements.Data analyses. Data analyses were performed in a blind and independent manner. The plasma-Aβ measurements were performed at Koichi Tanaka Mass Spectrometry Research Laboratory (Shimadzu) without any clinical or imaging information. All of the PET imaging data were analysed by the AIBL imaging group. The Aβ -PET dichotomization (Aβ +/Aβ −) and generation of SUVR were performed without any clinical or biomarker information. The NCGG group conducted statis-tical analyses, and all results were confirmed by two independent biostatisticians. The test biomarker values were generated by computing the ratio of normalized intensity of Aβ 1–42 with APP669–711, and Aβ 1–40. We used Aβ 1–42 as the denominator, because these ratios (APP669–711/Aβ 1–42 and Aβ 1–40/Aβ 1–42) showed a normal distri-bution without any transformation in both the NCGG and AIBL data sets (Shapiro–
Wilk test44), whereas using Aβ 1–42 value as the numerator did not (Extended Data Fig. 2b). The composite biomarker was generated by combining the normalized scores of APP669–711/Aβ 1–42 and Aβ 1–40/Aβ 1–42 as follows: first, the discovery NCGG data set was used for a standard database, and values of APP669–711/Aβ 1–42 and Aβ 1–40/Aβ 1–42 in all data sets (both NCGG and AIBL) were normalized to z-scores using the mean (0.774 and 24.72, respectively) and s.d. (0.191 and 4.31, respec-tively) of the NCGG data; then, z-scores of APP669–711/Aβ 1–42 and Aβ 1–40/Aβ 1–42 were averaged for each subject and used as a value for the composite biomarker so that each biomarker contributed equally to the composite. Before the main analyses, the weight of the z-score composition was pre-determined as 1:1 by exploratory analyses at NCGG that were confirmed by a pilot study.
Statistical analyses were performed using R v.3.3.2. SPSS v.21 (IBM), and JMP software v.8 (SAS Institute). For categorical data, such as gender, clinical category and APOE4 carrier distributions, group differences were analysed using the χ 2 test. For numerical data, group differences were analysed by Student’s t-test or Welch’s t-test, and the effect size was assessed using Cohen’s d.
The biomarker performance when predicting Aβ +/Aβ − status was assessed using ROC analyses. The AUC, and the representative best values for the sensitivity, specificity and accuracy at an optimal cut-off point, were used for the perfor-mance measures. The cut-off points were determined by Youden’s index45, which optimizes biomarker performance when equal weight is given to sensitivity and specificity. In addition, positive predictive value (PPV) and negative predictive value (NPV) were estimated by assuming the prevalence of Aβ + individuals in specific settings. These values were computed as follows:
Where TP = true positive, TN = true negative, FP = false positive, and FN = false negative; sensitivity = TP/(FN+ TP), specificity = TN/(TN+ FP), accuracy = (TP+ TN)/(TP+ TN+ FP+ FN), PPV = 1/(1 + ((1 − prevalence)/ prevalence)((1 − specificity)/sensitivity)), and NPV = 1/(1 + (prevalence/(1 − prevalence))((1-sensitivity)/specificity)).
We performed both unadjusted and adjusted ROC analyses. In unadjusted ROC analyses, original biomarker values from the discovery (NCGG) and validation (AIBL) data were used. In adjusted ROC analyses, a predictive formula including confounders (for example, age, gender, APOE4 and clinical category) was built using a generalized linear model (GLM) (binominal logistic regression analysis) on the discovery NCGG data as follows:
π= / + α β β− + +…+e1 (1 )x i x i( , )k k1 1
Then the same formula and the same coefficients were applied to both the NCGG discovery and AIBL validation data to calculate the fitted predicted prob-abilities. These predictive values were used for the adjusted ROC analyses of the NCGG and AIBL data.
To compare the biomarker performances among Aβ 1–42, APP669–711/Aβ 1–42, Aβ 1–40/Aβ 1–42, and the composite biomarker within the same data set, the differ-ences between pairs of AUCs were statistically analysed using the DeLong test46. The P values were Bonferroni-corrected by multiplying the P values by the number of comparisons (6) to control for the multiple comparisons problem. Improvement in the predictive ability of an alternative model was also assessed using the categorical NRI and IDI in the logistic regression model47. For the categorical NRI, the reclassification ability was measured in four categories using the first, second and third quantiles of the original model’s fitted values as cut points. Statistical differences in AUCs between two different data sets were analysed using Delong’s test for two uncorrelated ROC curves46.
Pearson product–moment correlational analysis was conducted to evaluate the strength of the association between each plasma biomarker and cortical-Aβ deposition assessed by either Aβ -PET imaging or CSF Aβ values. All the tests were two-tailed, and the significance level of difference was set at P < 0.05.Data availability. Source Data for graphs plotted in Figs 1–3 and Extended Data Figs 1–9 are available in the online version of this paper. All other data are available from the corresponding author upon reasonable request.
31. Albert, M. S. et al. The diagnosis of mild cognitive impairment due to Alzheimer’s disease: recommendations from the National Institute on Aging-Alzheimer’s Association workgroups on diagnostic guidelines for Alzheimer’s disease. Alzheimers Dement. 7, 270–279 (2011).
32. McKhann, G. M. et al. The diagnosis of dementia due to Alzheimer’s disease: recommendations from the National Institute on Aging–Alzheimer’s Association workgroups on diagnostic guidelines for Alzheimer’s disease. Alzheimers Dement. 7, 263–269 (2011).
33. Rowe, C. C. et al. Amyloid imaging results from the Australian Imaging, Biomarkers and Lifestyle (AIBL) study of aging. Neurobiol. Aging 31, 1275–1283 (2010).
34. Bourgeat, P. et al. Comparison of MR-less PiB SUVR quantification methods. Neurobiol. Aging 36, S159–S166 (2015).
© 2018 Macmillan Publishers Limited, part of Springer Nature. All rights reserved.

Letter reSeArCH
35. Clark, C. M. et al. Use of florbetapir-PET for imaging β -amyloid pathology. J. Am. Med. Assoc. 305, 275–283 (2011).
36. Lundqvist, R. et al. Implementation and validation of an adaptive template registration method for 18F-flutemetamol imaging data. J. Nucl. Med. 54, 1472–1478 (2013).
37. Pannee, J. et al. A selected reaction monitoring (SRM)-based method for absolute quantification of Aβ 38, Aβ 40, and Aβ 42 in cerebrospinal fluid of Alzheimer’s disease patients and healthy controls. J. Alzheimers Dis. 33, 1021–1032 (2013).
38. Patterson, B. W. et al. Age and amyloid effects on human central nervous system amyloid-beta kinetics. Ann. Neurol. 78, 439–453 (2015).
39. Manzoni, C. et al. Overcoming synthetic Aβ peptide aging: a new approach to an age-old problem. Amyloid 16, 71–80 (2009).
40. Schlenzig, D. et al. N-Terminal pyroglutamate formation of Aβ 38 and Aβ 40 enforces oligomer formation and potency to disrupt hippocampal long-term potentiation. J. Neurochem. 121, 774–784 (2012).
41. Toombs, J., Paterson, R. W., Schott, J. M. & Zetterberg, H. Amyloid-beta 42 adsorption following serial tube transfer. Alzheimers Res. Ther. 6, 5 (2014).
42. Tanaka, S. et al. Mass+ + : A visualization and analysis tool for mass spectrometry. J. Proteome Res. 13, 3846–3853 (2014).
43. Mattsson, N. et al. CSF biomarker variability in the Alzheimer’s Association quality control program. Alzheimers Dement. 9, 251–261 (2013).
44. Shapiro, S. S. & Wilk, M. B. An analysis of variance test for normality (complete samples). Biometrika 52, 591–611 (1965).
45. Youden, W. J. Index for rating diagnostic tests. Cancer 3, 32–35 (1950).46. DeLong, E. R., DeLong, D. M. & Clarke-Pearson, D. L. Comparing the areas
under two or more correlated receiver operating characteristic curves: a nonparametric approach. Biometrics 44, 837–845 (1988).
47. Pencina, M.J., D’Agostino, R.B. Sr., D’Agostino, R.B. Jr. & Vasan, R.S. Evaluating the added predictive ability of a new marker: from area under the ROC curve to reclassification and beyond. Stat. Med. 27, 157–172 (2008).
© 2018 Macmillan Publishers Limited, part of Springer Nature. All rights reserved.
LetterreSeArCH
EISE VKM DAEFRHDSGYEVHHQKLVFFAEDVGSNKGAIIGLMVGGVV IA TVIV
Aβ1-40
Aβ1-42
APP669-711
Amyloid precursor protein(APP)
| |
| ||
669 711
1 4240
a
b
Sen
sitiv
ity
APP669-711/Aβ1-42
Aβ1-40/Aβ1-42
Composite biomarker
1-specificity
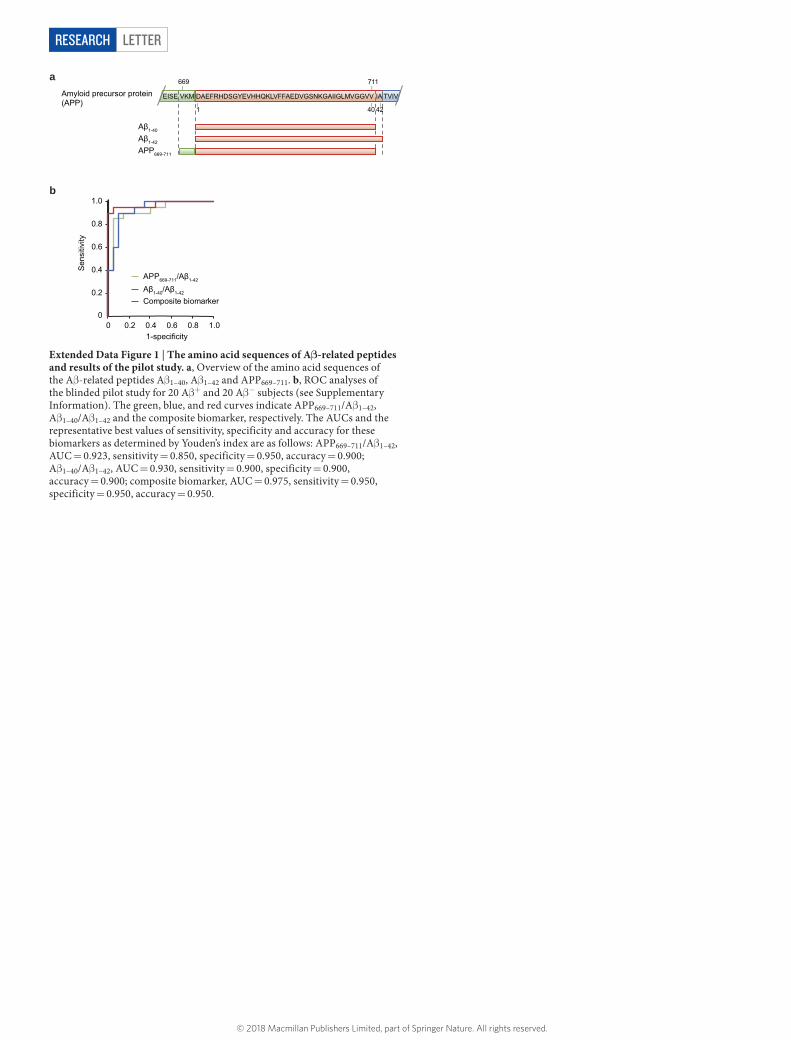
Extended Data Figure 1 | The amino acid sequences of Aβ-related peptides and results of the pilot study. a, Overview of the amino acid sequences of the Aβ -related peptides Aβ 1–40, Aβ 1–42 and APP669–711. b, ROC analyses of the blinded pilot study for 20 Aβ + and 20 Aβ − subjects (see Supplementary Information). The green, blue, and red curves indicate APP669–711/Aβ 1–42, Aβ 1–40/Aβ 1–42 and the composite biomarker, respectively. The AUCs and the representative best values of sensitivity, specificity and accuracy for these biomarkers as determined by Youden’s index are as follows: APP669–711/Aβ 1–42, AUC = 0.923, sensitivity = 0.850, specificity = 0.950, accuracy = 0.900; Aβ 1–40/Aβ 1–42, AUC = 0.930, sensitivity = 0.900, specificity = 0.900, accuracy = 0.900; composite biomarker, AUC = 0.975, sensitivity = 0.950, specificity = 0.950, accuracy = 0.950.
© 2018 Macmillan Publishers Limited, part of Springer Nature. All rights reserved.
Letter reSeArCH
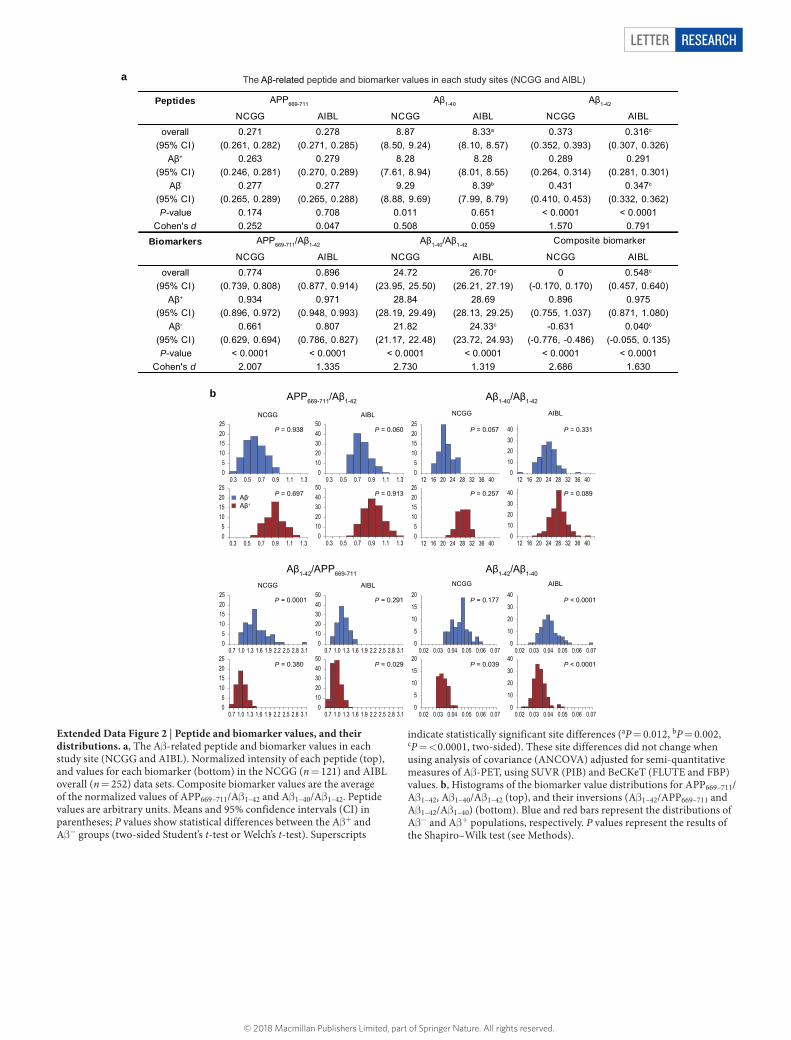
The Aβ-related peptide and biomarker values in each study sites (NCGG and AIBL)
b
0
5
10
15
20
0.02 0.03 0.04 0.05 0.06 0.0705
10152025
0.7 1.0 1.3 1.6 1.9 2.2 2.5 2.8 3.1
05
10152025
12 16 20 24 28 32 36 4005
10152025
0.3 0.5 0.7 0.9 1.1 1.3
05
10152025
0.3 0.5 0.7 0.9 1.1 1.30
1020304050
0.3 0.5 0.7 0.9 1.1 1.3
01020304050
0.3 0.5 0.7 0.9 1.1 1.3
05
10152025
12 16 20 24 28 32 36 400
10203040
12 16 20 24 28 32 36 40
010203040
12 16 20 24 28 32 36 40
05
10152025
0.7 1.0 1.3 1.6 1.9 2.2 2.5 2.8 3.10
1020304050
0.7 1.0 1.3 1.6 1.9 2.2 2.5 2.8 3.1
01020304050
0.7 1.0 1.3 1.6 1.9 2.2 2.5 2.8 3.10
10
20
30
40
0.02 0.03 0.04 0.05 0.06 0.07
0
5
10
15
20
0.02 0.03 0.04 0.05 0.06 0.070
10
20
30
40
0.02 0.03 0.04 0.05 0.06 0.07
NCGG AIBL NCGG AIBL
NCGG AIBL NCGG AIBL
APP669-711/Aβ1-42 Aβ1-40/Aβ1-42
Aβ1-42/APP669-711 Aβ1-42/Aβ1-40
P = 0.938 P = 0.060
P = 0.913
P = 0.057
P = 0.257
P = 0.331
P = 0.089
P = 0.0001
P = 0.380
P = 0.291
P = 0.029
P = 0.177
P = 0.039
P < 0.0001
P < 0.0001
a
P = 0.697Aβ-
Aβ+
PeptidesNCGG AIBL NCGG AIBL NCGG AIBL
overall(95% CI)
0.271(0.261, 0.282)
0.278(0.271, 0.285)
8.87(8.50, 9.24)
8.33a
(8.10, 8.57)0.373
(0.352, 0.393)0.316c
(0.307, 0.326)Aβ+
(95% CI)0.263
(0.246, 0.281)0.279
(0.270, 0.289)8.28
(7.61, 8.94)8.28
(8.01, 8.55)0.289
(0.264, 0.314)0.291
(0.281, 0.301)Aβ-
(95% CI)0.277
(0.265, 0.289)0.277
(0.265, 0.288)9.29
(8.88, 9.69)8.39b
(7.99, 8.79)0.431
(0.410, 0.453)0.347c
(0.332, 0.362)P-value 0.174 0.708 0.011 0.651 < 0.0001 < 0.0001
Cohen's d 0.252 0.047 0.508 0.059 1.570 0.791
BiomarkersNCGG AIBL NCGG AIBL NCGG AIBL
overall(95% CI)
0.774(0.739, 0.808)
0.896(0.877, 0.914)
24.72(23.95, 25.50)
26.70c
(26.21, 27.19)0
(-0.170, 0.170)0.548c
(0.457, 0.640)Aβ+
(95% CI)0.934
(0.896, 0.972)0.971
(0.948, 0.993)28.84
(28.19, 29.49)28.69
(28.13, 29.25)0.896
(0.755, 1.037)0.975
(0.871, 1.080)Aβ-
(95% CI)0.661
(0.629, 0.694)0.807
(0.786, 0.827)21.82
(21.17, 22.48)24.33c
(23.72, 24.93)-0.631
(-0.776, -0.486)0.040c
(-0.055, 0.135)P-value < 0.0001 < 0.0001 < 0.0001 < 0.0001 < 0.0001 < 0.0001
Cohen's d 2.007 1.335 2.730 1.319 2.686 1.630
APP669-711 Aβ1-40 Aβ1-42
APP669-711/Aβ1-42 Aβ1-40/Aβ1-42 Composite biomarker
Extended Data Figure 2 | Peptide and biomarker values, and their distributions. a, The Aβ -related peptide and biomarker values in each study site (NCGG and AIBL). Normalized intensity of each peptide (top), and values for each biomarker (bottom) in the NCGG (n = 121) and AIBL overall (n = 252) data sets. Composite biomarker values are the average of the normalized values of APP669–711/Aβ 1–42 and Aβ 1–40/Aβ 1–42. Peptide values are arbitrary units. Means and 95% confidence intervals (CI) in parentheses; P values show statistical differences between the Aβ + and Aβ − groups (two-sided Student’s t-test or Welch’s t-test). Superscripts
indicate statistically significant site differences (aP = 0.012, bP = 0.002, cP = < 0.0001, two-sided). These site differences did not change when using analysis of covariance (ANCOVA) adjusted for semi-quantitative measures of Aβ -PET, using SUVR (PIB) and BeCKeT (FLUTE and FBP) values. b, Histograms of the biomarker value distributions for APP669–711/Aβ 1–42, Aβ 1–40/Aβ 1–42 (top), and their inversions (Aβ 1–42/APP669–711 and Aβ 1–42/Aβ 1–40) (bottom). Blue and red bars represent the distributions of Aβ − and Aβ + populations, respectively. P values represent the results of the Shapiro–Wilk test (see Methods).
© 2018 Macmillan Publishers Limited, part of Springer Nature. All rights reserved.
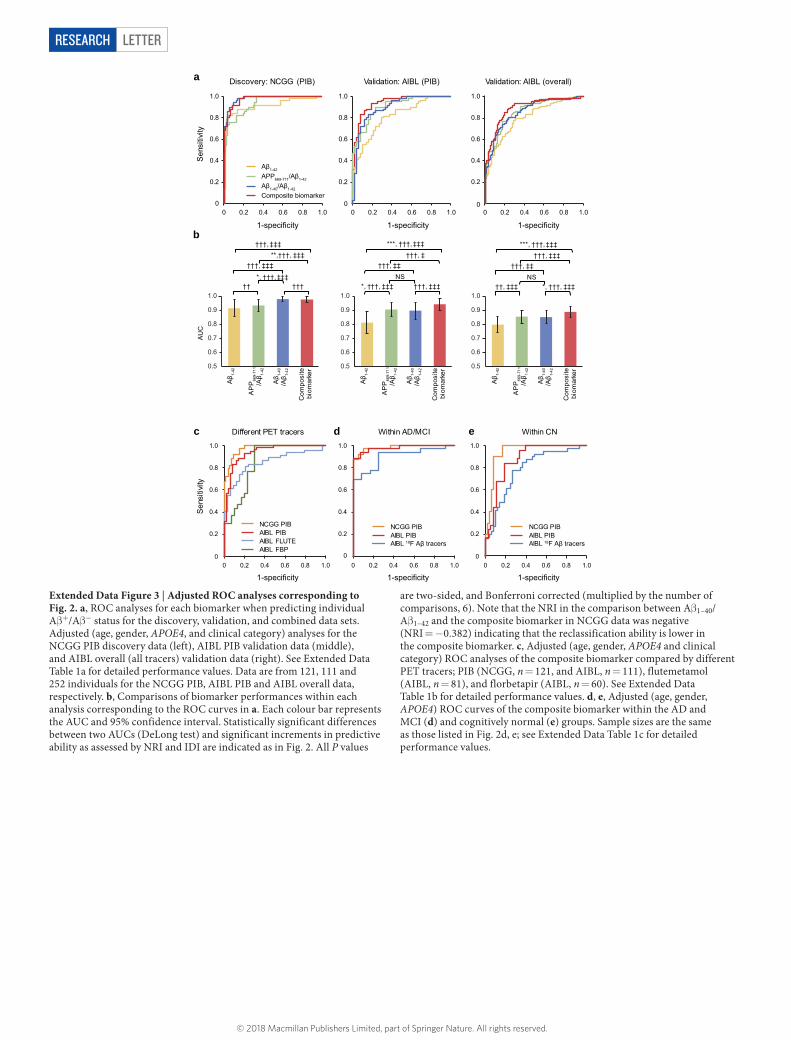
LetterreSeArCH
0
0.2
0.4
0.6
0.8
1.0
0 0.2 0.4 0.6 0.8 1.00
0.2
0.4
0.6
0.8
1.0
0 0.2 0.4 0.6 0.8 1.0
0
0.2
0.4
0.6
0.8
1.0
0 0.2 0.4 0.6 0.8 1.00
0.2
0.4
0.6
0.8
1.0
0 0.2 0.4 0.6 0.8 1.00
0.2
0.4
0.6
0.8
1.0
0 0.2 0.4 0.6 0.8 1.0
NS††, ‡‡‡ *, †††, ‡‡‡
†††, ‡‡†††, ‡‡‡
***, †††, ‡‡‡
NS*, †††, ‡‡‡ †††, ‡‡‡
†††, ‡‡†††, ‡
***, †††, ‡‡‡
*, †††, ‡‡‡†† †††
†††, ‡‡‡**,†††, ‡‡‡
†††, ‡‡‡
Validation: AIBL (overall)
Sen
sitiv
ity
1-specificity
Discovery: NCGG (PIB) Validation: AIBL (PIB) a
b
c d eDifferent PET tracers Within AD/MCI Within CN
0
0.2
0.4
0.6
0.8
1.0
0 0.2 0.4 0.6 0.8 1.0
Composite biomarkerAβ1-40/Aβ1-42
APP669-711/Aβ1-42
Aβ1-42
AIBL 18F Aβ tracers AIBL PIB NCGG PIB
AIBL FBPAIBL FLUTEAIBL PIBNCGG PIB
AIBL 18F Aβ tracers AIBL PIB NCGG PIB
1-specificity 1-specificity
AU
CS
ensi
tivity
1-specificity1-specificity 1-specificity
0.5
0.6
0.7
0.8
0.9
1.0
Aβ 1-
42
AP
P66
9-71
1/A
β 1-42
Aβ 1-
40/A
β 1-42
Com
posi
te
biom
arke
r 0.5
0.6
0.7
0.8
0.9
1.0
Aβ 1-
42
AP
P66
9-71
1/A
β 1-42
Aβ 1-
40/A
β 1-42
Com
posi
te
biom
arke
r 0.5
0.6
0.7
0.8
0.9
1.0
Aβ 1-
42
AP
P66
9-71
1/A
β 1-42
Aβ 1-
40/A
β 1-42
Com
posi
te
biom
arke
r
Extended Data Figure 3 | Adjusted ROC analyses corresponding to Fig. 2. a, ROC analyses for each biomarker when predicting individual Aβ +/Aβ − status for the discovery, validation, and combined data sets. Adjusted (age, gender, APOE4, and clinical category) analyses for the NCGG PIB discovery data (left), AIBL PIB validation data (middle), and AIBL overall (all tracers) validation data (right). See Extended Data Table 1a for detailed performance values. Data are from 121, 111 and 252 individuals for the NCGG PIB, AIBL PIB and AIBL overall data, respectively. b, Comparisons of biomarker performances within each analysis corresponding to the ROC curves in a. Each colour bar represents the AUC and 95% confidence interval. Statistically significant differences between two AUCs (DeLong test) and significant increments in predictive ability as assessed by NRI and IDI are indicated as in Fig. 2. All P values
are two-sided, and Bonferroni corrected (multiplied by the number of comparisons, 6). Note that the NRI in the comparison between Aβ 1–40/ Aβ 1–42 and the composite biomarker in NCGG data was negative (NRI = − 0.382) indicating that the reclassification ability is lower in the composite biomarker. c, Adjusted (age, gender, APOE4 and clinical category) ROC analyses of the composite biomarker compared by different PET tracers; PIB (NCGG, n = 121, and AIBL, n = 111), flutemetamol (AIBL, n = 81), and florbetapir (AIBL, n = 60). See Extended Data Table 1b for detailed performance values. d, e, Adjusted (age, gender, APOE4) ROC curves of the composite biomarker within the AD and MCI (d) and cognitively normal (e) groups. Sample sizes are the same as those listed in Fig. 2d, e; see Extended Data Table 1c for detailed performance values.
© 2018 Macmillan Publishers Limited, part of Springer Nature. All rights reserved.
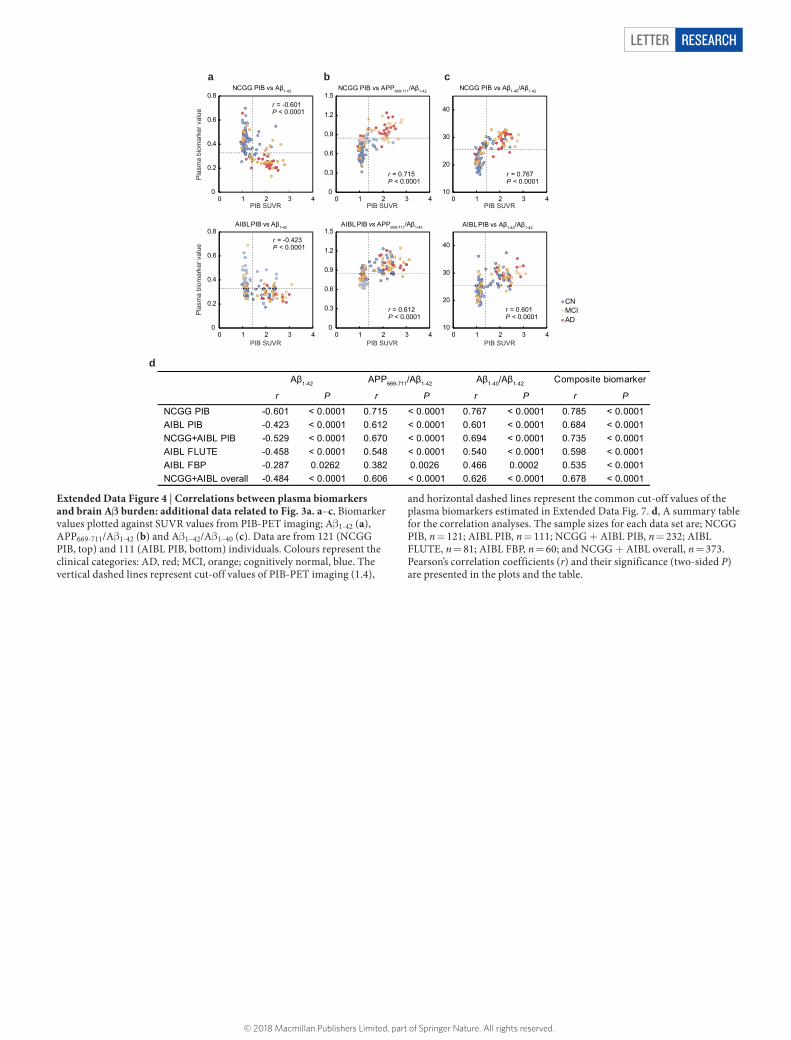
Letter reSeArCH
0
0.2
0.4
0.6
0.8
0 1 2 3 4
0
0.3
0.6
0.9
1.2
1.5
0 1 2 3 4
0
0.3
0.6
0.9
1.2
1.5
0 1 2 3 4
10
20
30
40
0 1 2 3 4
10
20
30
40
0 1 2 3 4
NCGG PIB vs APP669-711/Aβ1-42 NCGG PIB vs Aβ1-40/Aβ1-42
AIBL PIB vs Aβ1-40/Aβ1-42AIBL PIB vs APP669-711/Aβ1-42
NCGG PIB vs Aβ1-42
AIBL PIB vs Aβ1-42
a b c
d
r = -0.601P < 0.0001
r = 0.715P < 0.0001
r = 0.767P < 0.0001
r = -0.423P < 0.0001
r = 0.612P < 0.0001
r = 0.601P < 0.0001
r P r P r P r P
NCGG PIB -0.601 < 0.0001 0.715 < 0.0001 0.767 < 0.0001 0.785 < 0.0001 AIBL PIB -0.423 < 0.0001 0.612 < 0.0001 0.601 < 0.0001 0.684 < 0.0001 NCGG+AIBL PIB -0.529 < 0.0001 0.670 < 0.0001 0.694 < 0.0001 0.735 < 0.0001 AIBL FLUTE -0.458 < 0.0001 0.548 < 0.0001 0.540 < 0.0001 0.598 < 0.0001 AIBL FBP -0.287 0.0262 0.382 0.0026 0.466 0.0002 0.535 < 0.0001 NCGG+AIBL overall -0.484 < 0.0001 0.606 < 0.0001 0.626 < 0.0001 0.678 < 0.0001
Aβ1-42 APP669-711/Aβ1-42 Aβ1-40/Aβ1-42 Composite biomarker
ADMCICN
PIB SUVR PIB SUVRPIB SUVR
0
0.2
0.4
0.6
0.8
0 1 2 3 4P
lasm
a bi
omar
ker v
alue
Pla
sma
biom
arke
r val
ue
PIB SUVR PIB SUVRPIB SUVR
Extended Data Figure 4 | Correlations between plasma biomarkers and brain Aβ burden: additional data related to Fig. 3a. a–c, Biomarker values plotted against SUVR values from PIB-PET imaging; Aβ 1-42 (a), APP669-711/Aβ 1-42 (b) and Aβ 1–42/Aβ 1–40 (c). Data are from 121 (NCGG PIB, top) and 111 (AIBL PIB, bottom) individuals. Colours represent the clinical categories: AD, red; MCI, orange; cognitively normal, blue. The vertical dashed lines represent cut-off values of PIB-PET imaging (1.4),
and horizontal dashed lines represent the common cut-off values of the plasma biomarkers estimated in Extended Data Fig. 7. d, A summary table for the correlation analyses. The sample sizes for each data set are; NCGG PIB, n = 121; AIBL PIB, n = 111; NCGG + AIBL PIB, n = 232; AIBL FLUTE, n = 81; AIBL FBP, n = 60; and NCGG + AIBL overall, n = 373. Pearson’s correlation coefficients (r) and their significance (two-sided P) are presented in the plots and the table.
© 2018 Macmillan Publishers Limited, part of Springer Nature. All rights reserved.
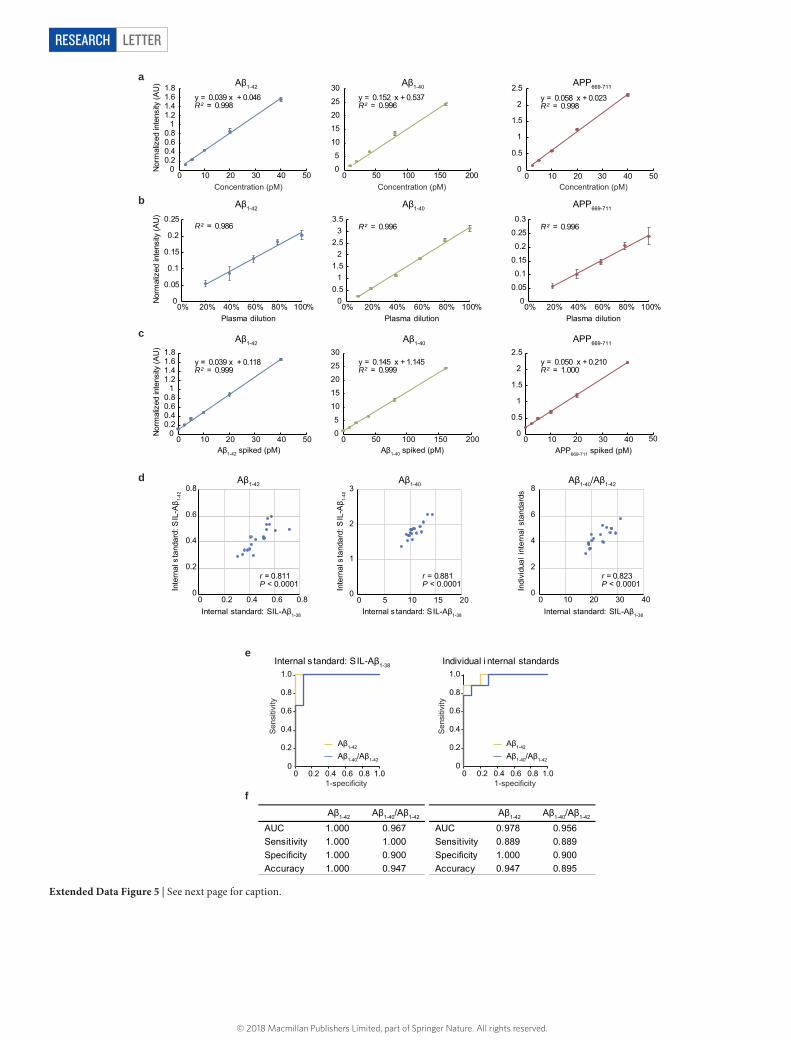
LetterreSeArCH
Aβ1-42 Aβ1-40 APP669-711
Aβ1-42 Aβ1-40 APP669-711
Aβ1-42 Aβ1-40 APP669-711
Plasma dilution
00.20.40.60.8
11.21.41.61.8
0 10 20 30 40 500
5
10
15
20
25
30
0 50 100 150 200Concentration (pM)Concentration (pM) Concentration (pM)
0
0.5
1
1.5
2
2.5
0 10 20 30 40 50
Nor
mal
ized
inte
nsity
(AU
)
00.20.40.60.8
11.21.41.61.8
0 10 20 30 40 500
0.5
1
1.5
2
2.5
0 10 20 30 400
5
10
15
20
25
30
0 50 100 150 200
Nor
mal
ized
inte
nsity
(AU
)
Plasma dilutionPlasma dilution
0
0.05
0.1
0.15
0.2
0.25
0% 20% 40% 60% 80% 100%0
0.51
1.52
2.53
3.5
0% 20% 40% 60% 80% 100%0
0.05
0.1
0.15
0.2
0.25
0.3
0% 20% 40% 60% 80% 100%
Nor
mal
ized
inte
nsity
(AU
)
Aβ1-40 spiked (pM)Aβ1-42 spiked (pM) APP669-711 spiked (pM)
a
b
c
Individual internal standardsInternal standard: SIL-Aβ1-38
0
0.2
0.4
0.6
0.8
1.0
0 0.2 0.4 0.6 0.8 1.0
Aβ1-42
Aβ1-40/Aβ1-420
0.2
0.4
0.6
0.8
1.0
0 0.2 0.4 0.6 0.8 1.0
Aβ1-42
Aβ1-40/Aβ1-42
y = 0.039 x + 0.046 R² = 0.998
y = 0.152 x + 0.537 R² = 0.996
y = 0.058 x + 0.023 R² = 0.998
R² = 0.986 R² = 0.996 R² = 0.996
y = 0.039 x + 0.118 R² = 0.999
y = 0.145 x + 1.145 R² = 0.999
y = 0.050 x + 0.210 R² = 1.000
d
e
f
Inte
rnal
sta
ndar
d: S
IL-A
β 1-40
0
1
2
3
0 5 10 15 20Internal standard: SIL-Aβ1-38
Aβ1-40
r = 0.881P < 0.0001 In
tern
al s
tand
ard:
SIL
-Aβ 1-
42
0
0.2
0.4
0.6
0.8
0 0.2 0.4 0.6 0.8Internal standard: SIL-Aβ1-38
Aβ1-42
r = 0.811P < 0.0001 In
divi
dual
inte
rnal
sta
ndar
ds
0
2
4
6
8
0 10 20 30 40Internal standard: SIL-Aβ1-38
Aβ1-40/Aβ1-42
r = 0.823P < 0.0001
50
Aβ1-42 Aβ1-40/Aβ1-42 Aβ1-42 Aβ1-40/Aβ1-42
AUC 1.000 0.967 AUC 0.978 0.956 Sensitivity 1.000 1.000 Sensitivity 0.889 0.889 Specificity 1.000 0.900 Specificity 1.000 0.900 Accuracy 1.000 0.947 Accuracy 0.947 0.895
Sen
sitiv
ity
1-specificity
Sen
sitiv
ity
1-specificity
Extended Data Figure 5 | See next page for caption.
© 2018 Macmillan Publishers Limited, part of Springer Nature. All rights reserved.
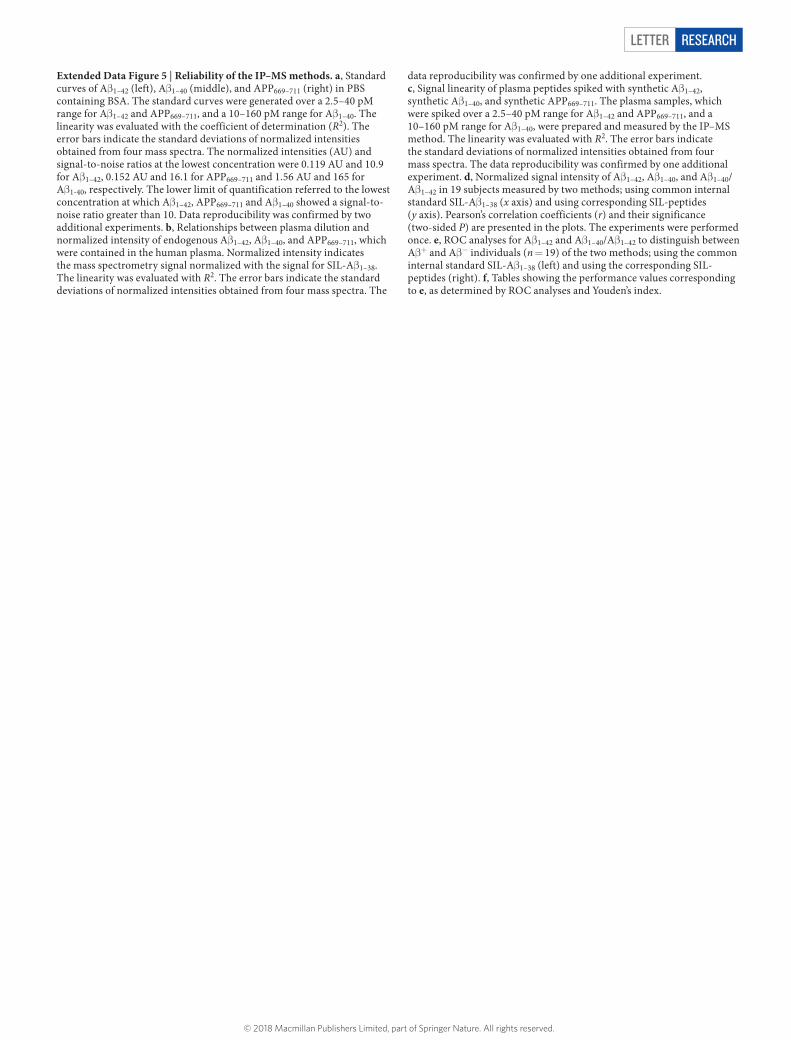
Letter reSeArCH
Extended Data Figure 5 | Reliability of the IP–MS methods. a, Standard curves of Aβ 1–42 (left), Aβ 1–40 (middle), and APP669–711 (right) in PBS containing BSA. The standard curves were generated over a 2.5–40 pM range for Aβ 1–42 and APP669–711, and a 10–160 pM range for Aβ 1–40. The linearity was evaluated with the coefficient of determination (R2). The error bars indicate the standard deviations of normalized intensities obtained from four mass spectra. The normalized intensities (AU) and signal-to-noise ratios at the lowest concentration were 0.119 AU and 10.9 for Aβ 1–42, 0.152 AU and 16.1 for APP669–711 and 1.56 AU and 165 for Aβ 1-40, respectively. The lower limit of quantification referred to the lowest concentration at which Aβ 1–42, APP669–711 and Aβ 1–40 showed a signal-to-noise ratio greater than 10. Data reproducibility was confirmed by two additional experiments. b, Relationships between plasma dilution and normalized intensity of endogenous Aβ 1–42, Aβ 1–40, and APP669–711, which were contained in the human plasma. Normalized intensity indicates the mass spectrometry signal normalized with the signal for SIL-Aβ 1–38. The linearity was evaluated with R2. The error bars indicate the standard deviations of normalized intensities obtained from four mass spectra. The
data reproducibility was confirmed by one additional experiment. c, Signal linearity of plasma peptides spiked with synthetic Aβ 1–42, synthetic Aβ 1–40, and synthetic APP669–711. The plasma samples, which were spiked over a 2.5–40 pM range for Aβ 1–42 and APP669–711, and a 10–160 pM range for Aβ 1–40, were prepared and measured by the IP–MS method. The linearity was evaluated with R2. The error bars indicate the standard deviations of normalized intensities obtained from four mass spectra. The data reproducibility was confirmed by one additional experiment. d, Normalized signal intensity of Aβ 1–42, Aβ 1–40, and Aβ 1–40/Aβ 1–42 in 19 subjects measured by two methods; using common internal standard SIL-Aβ 1–38 (x axis) and using corresponding SIL-peptides (y axis). Pearson’s correlation coefficients (r) and their significance (two-sided P) are presented in the plots. The experiments were performed once. e, ROC analyses for Aβ 1–42 and Aβ 1–40/Aβ 1–42 to distinguish between Aβ + and Aβ − individuals (n = 19) of the two methods; using the common internal standard SIL-Aβ 1–38 (left) and using the corresponding SIL-peptides (right). f, Tables showing the performance values corresponding to e, as determined by ROC analyses and Youden’s index.
© 2018 Macmillan Publishers Limited, part of Springer Nature. All rights reserved.
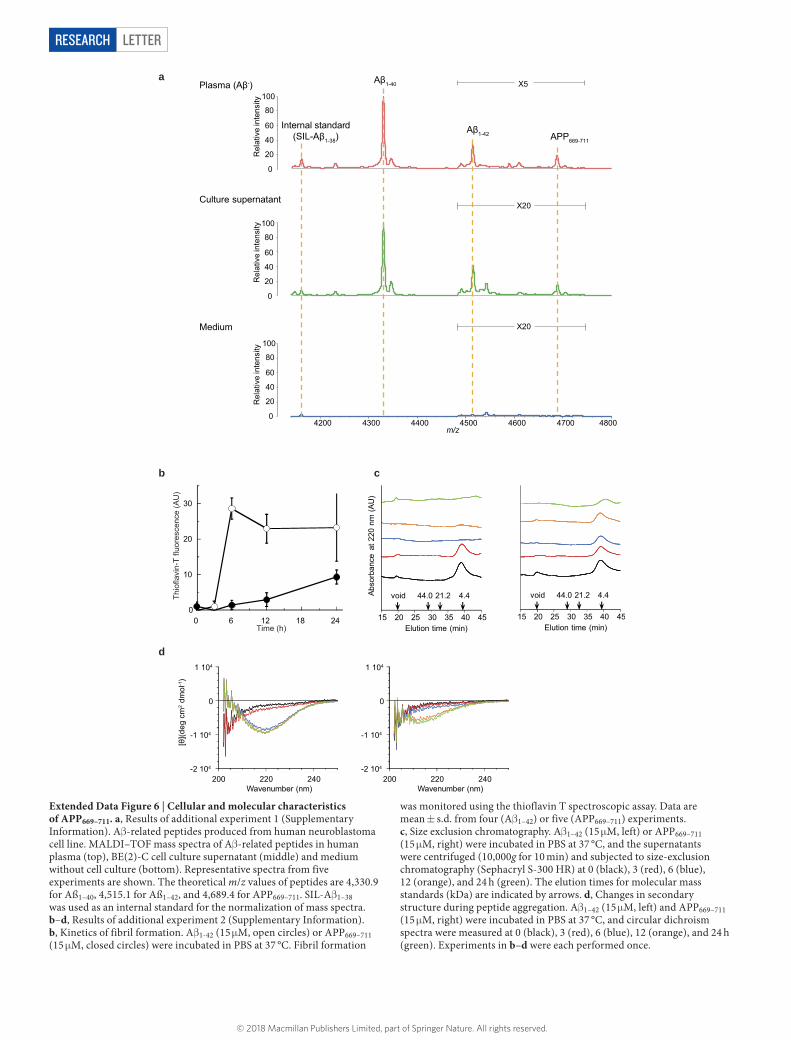
LetterreSeArCH
0
20
40
60
80
100
4200 4300 4400 4500 4600 4700 4800m/z
X20
X5
0
20
40
60
80
100
0
20
40
60
80
100
X20Medium
Culture supernatant
Plasma (Aβ-)
Rel
ativ
e in
tens
ityR
elat
ive
inte
nsity
Rel
ativ
e in
tens
ity
a
0
10
20
30
0 6 12 18 24 15 20 25 30 35 40 45Elution time (min)
Abso
rban
ce a
t 220
nm
(AU
)
void 44.0 21.2 4.4
15 20 25 30 35 40 45Elution time (min)
void 44.0 21.2 4.4
Time (h)
Thio
flavi
n-T
fluor
esce
nce
(AU
)
b c
-2 104
-1 104
0
1 104
200 220 240Wavenumber (nm)
-2 104
-1 104
0
1 104
200 220 240Wavenumber (nm)
[θ](d
eg c
m2 d
mol
-1)
d
Internal standard (SIL-Aβ1-38)
Aβ1-40
Aβ1-42 APP669-711
Extended Data Figure 6 | Cellular and molecular characteristics of APP669–711. a, Results of additional experiment 1 (Supplementary Information). Aβ -related peptides produced from human neuroblastoma cell line. MALDI–TOF mass spectra of Aβ -related peptides in human plasma (top), BE(2)-C cell culture supernatant (middle) and medium without cell culture (bottom). Representative spectra from five experiments are shown. The theoretical m/z values of peptides are 4,330.9 for Aß1–40, 4,515.1 for Aß1–42, and 4,689.4 for APP669–711. SIL-Aβ 1–38 was used as an internal standard for the normalization of mass spectra. b–d, Results of additional experiment 2 (Supplementary Information). b, Kinetics of fibril formation. Aβ 1-42 (15 μ M, open circles) or APP669–711 (15 μ M, closed circles) were incubated in PBS at 37 °C. Fibril formation
was monitored using the thioflavin T spectroscopic assay. Data are mean ± s.d. from four (Aβ 1–42) or five (APP669–711) experiments. c, Size exclusion chromatography. Aβ 1–42 (15 μ M, left) or APP669–711 (15 μ M, right) were incubated in PBS at 37 °C, and the supernatants were centrifuged (10,000g for 10 min) and subjected to size-exclusion chromatography (Sephacryl S-300 HR) at 0 (black), 3 (red), 6 (blue), 12 (orange), and 24 h (green). The elution times for molecular mass standards (kDa) are indicated by arrows. d, Changes in secondary structure during peptide aggregation. Aβ 1–42 (15 μ M, left) and APP669–711 (15 μ M, right) were incubated in PBS at 37 °C, and circular dichroism spectra were measured at 0 (black), 3 (red), 6 (blue), 12 (orange), and 24 h (green). Experiments in b–d were each performed once.
© 2018 Macmillan Publishers Limited, part of Springer Nature. All rights reserved.
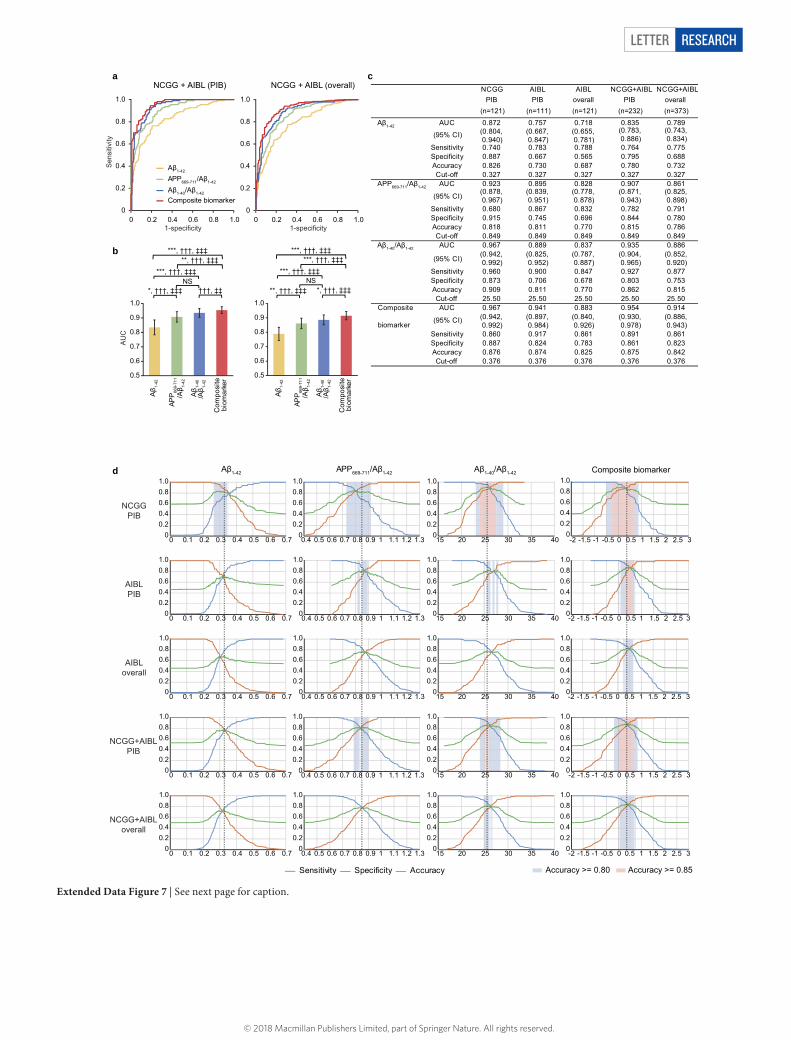
Letter reSeArCH
d
00.20.40.60.81.0
0 0.1 0.2 0.3 0.4 0.5 0.6 0.7
00.20.40.60.81.0
0.4 0.5 0.6 0.7 0.8 0.9 1 1.1 1.2 1.3
00.20.40.60.81.0
0.4 0.5 0.6 0.7 0.8 0.9 1 1.1 1.2 1.30
0.20.40.60.81.0
15 20 25 30 35 40
00.20.40.60.81.0
0 0.1 0.2 0.3 0.4 0.5 0.6 0.70
0.20.40.60.81.0
0.4 0.5 0.6 0.7 0.8 0.9 1 1.1 1.2 1.30
0.20.40.60.81.0
15 20 25 30 35 400
0.20.40.60.81.0
-2 -1.5 -1 -0.5 0 0.5 1 1.5 2 2.5 3
00.20.40.60.81.0
0 0.1 0.2 0.3 0.4 0.5 0.6 0.70
0.20.40.60.81.0
0.4 0.5 0.6 0.7 0.8 0.9 1 1.1 1.2 1.30
0.20.40.60.81.0
15 20 25 30 35 400
0.20.40.60.81.0
-2 -1.5 -1 -0.5 0 0.5 1 1.5 2 2.5 3
00.20.40.60.81.0
0 0.1 0.2 0.3 0.4 0.5 0.6 0.70
0.20.40.60.81.0
15 20 25 30 35 400
0.20.40.60.81.0
-2 -1.5 -1 -0.5 0 0.5 1 1.5 2 2.5 3
00.20.40.60.81.0
0 0.1 0.2 0.3 0.4 0.5 0.6 0.70
0.20.40.60.81.0
0.4 0.5 0.6 0.7 0.8 0.9 1 1.1 1.2 1.30
0.20.40.60.81.0
15 20 25 30 35 400
0.20.40.60.81.0
-2 -1.5 -1 -0.5 0 0.5 1 1.5 2 2.5 3
Aβ1-42 APP669-711/Aβ1-42 Composite biomarkerAβ1-40/Aβ1-42
Accuracy >= 0.80 Accuracy >= 0.85
NCGGPIB
AIBLPIB
AIBLoverall
NCGG+AIBLPIB
NCGG+AIBLoverall
Aβ1-42
APP669-711/Aβ1-42
Aβ1-40/Aβ1-42
Composite biomarker0
0.2
0.4
0.6
0.8
1.0
0 0.2 0.4 0.6 0.8 1.00
0.2
0.4
0.6
0.8
1.0
0 0.2 0.4 0.6 0.8 1.0
NCGG + AIBL (PIB) NCGG + AIBL (overall) a
b
NS
***, †††, ‡‡‡**, †††, ‡‡‡
***, †††, ‡‡‡
*, †††, ‡‡‡ †††, ‡‡NS
***, †††, ‡‡‡***, †††, ‡‡‡
***, †††, ‡‡‡
**, †††, ‡‡‡ *, †††, ‡‡‡
0.5
0.6
0.7
0.8
0.9
1.0
Aβ 1-
42
APP
669-
711
/Aβ 1-
42
Aβ 1-
40/A
β 1-42
Com
posi
te
biom
arke
r 0.5
0.6
0.7
0.8
0.9
1.0
Aβ 1-
42
APP
669-
711
/Aβ 1-
42
Aβ 1-
40/A
β 1-42
Com
posi
te
biom
arke
r
cNCGG AIBL AIBL NCGG+AIBL NCGG+AIBL
PIB PIB overall PIB overall(n=121) (n=111) (n=121) (n=232) (n=373)
Aβ1-42 AUC 0.872 0.757 0.718 0.835 0.789
(95% CI) (0.804, 0.940)
(0.667, 0.847)
(0.655, 0.781)
(0.783, 0.886)
(0.743, 0.834)
Sensitivity 0.740 0.783 0.788 0.764 0.775Specificity 0.887 0.667 0.565 0.795 0.688Accuracy 0.826 0.730 0.687 0.780 0.732Cut-off 0.327 0.327 0.327 0.327 0.327
APP669-711/Aβ1-42 AUC 0.923 0.895 0.828 0.907 0.861
(95% CI)(0.878, 0.967)
(0.839, 0.951)
(0.778, 0.878)
(0.871, 0.943)
(0.825, 0.898)
Sensitivity 0.680 0.867 0.832 0.782 0.791Specificity 0.915 0.745 0.696 0.844 0.780Accuracy 0.818 0.811 0.770 0.815 0.786Cut-off 0.849 0.849 0.849 0.849 0.849
Aβ1-40/Aβ1-42 AUC 0.967 0.889 0.837 0.935 0.886
(95% CI)(0.942, 0.992)
(0.825, 0.952)
(0.787, 0.887)
(0.904, 0.965)
(0.852, 0.920)
Sensitivity 0.960 0.900 0.847 0.927 0.877Specificity 0.873 0.706 0.678 0.803 0.753Accuracy 0.909 0.811 0.770 0.862 0.815Cut-off 25.50 25.50 25.50 25.50 25.50
Composite AUC 0.967 0.941 0.883 0.954 0.914
biomarker(95% CI) (0.942,
0.992)(0.897, 0.984)
(0.840, 0.926)
(0.930, 0.978)
(0.886, 0.943)
Sensitivity 0.860 0.917 0.861 0.891 0.861Specificity 0.887 0.824 0.783 0.861 0.823Accuracy 0.876 0.874 0.825 0.875 0.842Cut-off 0.376 0.376 0.376 0.376 0.376
00.20.40.60.81.0
-2 -1.5 -1 -0.5 0 0.5 1 1.5 2 2.5 3
Sensitivity Specificity Accuracy
AU
C
1-specificity 1-specificity
Sen
sitiv
ity
Extended Data Figure 7 | See next page for caption.
© 2018 Macmillan Publishers Limited, part of Springer Nature. All rights reserved.

LetterreSeArCH
Extended Data Figure 7 | Common cut-off values are applicable for both NCGG and AIBL data sets. a, Unadjusted ROC analyses for each biomarker when predicting individual Aβ +/Aβ − status for the NCGG + AIBL PIB (left, n = 232) and NCGG + AIBL overall (right, n = 373) data sets. b, Comparisons of biomarker performances within each analysis corresponding to the ROC curves in a. Each colour bar represents the AUC and 95% confidence. Statistically significant differences between two AUCs (DeLong test) and significant increments in predictive ability as assessed by NRI and IDI are indicated as in Fig. 2. All P values are two-sided, and Bonferroni corrected (multiplied by the number of comparisons, 6). c, Biomarker performances when applying the same cut-off values to each data set. For each biomarker, an optimal
common cut-off value was determined by the Youden’s index of the ROC analysis for the NCGG + AIBL overall data set. The sensitivity, specificity and accuracy were then calculated at the common cut-off point for each biomarker in all data sets. d, Diagnostic performance plots for Aβ 1–42, APP669–711/Aβ 1–42, Aβ 1–40/Aβ 1–42 and the composite biomarker. Each row from top to bottom shows the plots for the NCGG PIB, AIBL PIB, AIBL overall, NCGG + AIBL PIB, and NCGG + AIBL overall data (unadjusted), respectively. Sensitivity (orange), specificity (blue) and accuracy (green) were plotted using the values of the biomarkers (x axis). The vertical dashed lines indicate the common cut-off values as shown in c. The blue and pink shaded squares indicate ranges in which a biomarker can perform with at least 80% and 85% accuracy, respectively.
© 2018 Macmillan Publishers Limited, part of Springer Nature. All rights reserved.
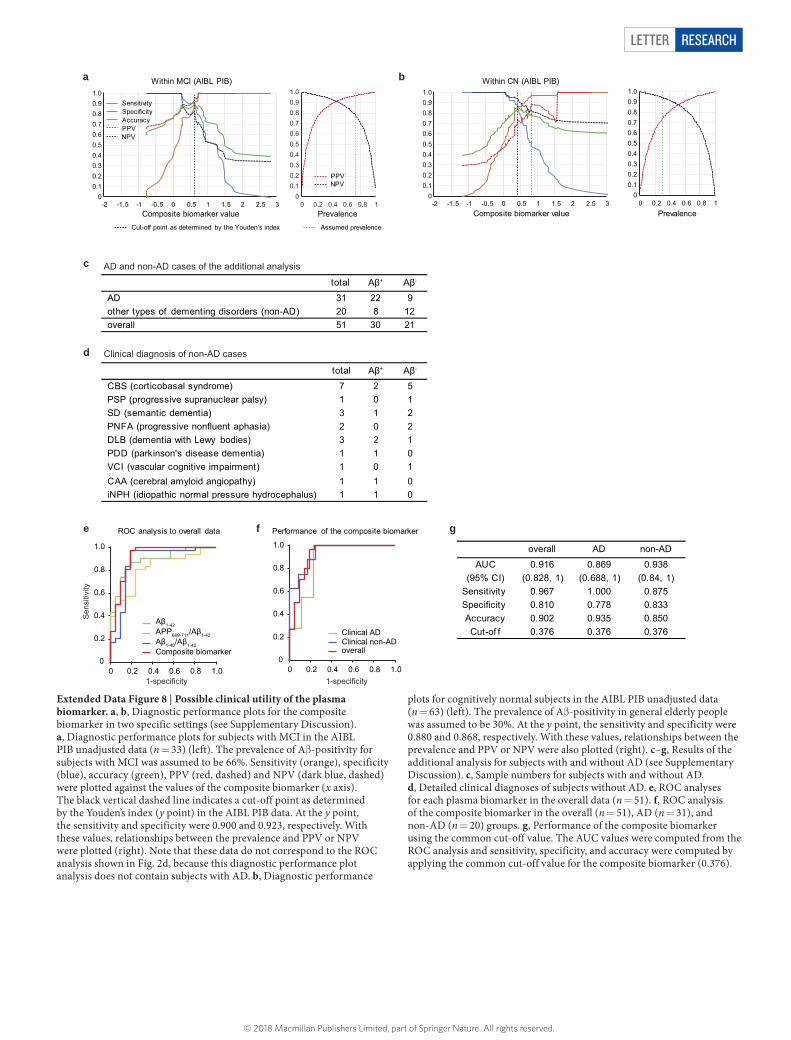
Letter reSeArCH
c
d
e f gROC analysis to overall data Performance of the composite biomarker
Aβ1-42APP669-711/Aβ1-42Aβ1-40/Aβ1-42Composite biomarker
Clinical ADClinical non-ADoverall
Clinical diagnosis of non-AD cases
AD and non-AD cases of the additional analysis
total Aβ+ Aβ-
AD 31 22 9 other types of dementing disorders (non-AD) 20 8 12 overall 51 30 21
total Aβ+ Aβ-
CBS (corticobasal syndrome) 7 2 5 PSP (progressive supranuclear palsy) 1 0 1 SD (semantic dementia) 3 1 2 PNFA (progressive nonfluent aphasia) 2 0 2 DLB (dementia with Lewy bodies) 3 2 1 PDD (parkinson's disease dementia) 1 1 0 VCI (vascular cognitive impairment) 1 0 1 CAA (cerebral amyloid angiopathy) 1 1 0 iNPH (idiopathic normal pressure hydrocephalus) 1 1 0
overall AD non-AD
AUC 0.916 0.869 0.938(95% CI) (0.828, 1) (0.688, 1) (0.84, 1)
Sensitivity 0.967 1.000 0.875Specificity 0.810 0.778 0.833Accuracy 0.902 0.935 0.850Cut-of f 0.376 0.376 0.376
a b
00.10.20.30.40.50.60.70.80.91.0
-2 -1.5 -1 -0.5 0 0.5 1 1.5 2 2.5 30
0.10.20.30.40.50.60.70.80.91.0
0 0.2 0.4 0.6 0.8 1
Within MCI (AIBL PIB)
PrevalenceCut-off point as determined by the Youden’s index Assumed prevalence
Composite biomarker value
SensitivitySpecificityAccuracyPPVNPV
PPVNPV
Sen
sitiv
ity
1-specificity 1-specificity
PrevalenceComposite biomarker value
00.10.20.30.40.50.60.70.80.91.0
0 0.2 0.4 0.6 0.8 1
Within CN (AIBL PIB)
00.10.20.30.40.50.60.70.80.91.0
2.5-2 -1.5 0-1 -0.5 0.5 1 1.5 2 3
Extended Data Figure 8 | Possible clinical utility of the plasma biomarker. a, b, Diagnostic performance plots for the composite biomarker in two specific settings (see Supplementary Discussion). a, Diagnostic performance plots for subjects with MCI in the AIBL PIB unadjusted data (n = 33) (left). The prevalence of Aβ -positivity for subjects with MCI was assumed to be 66%. Sensitivity (orange), specificity (blue), accuracy (green), PPV (red, dashed) and NPV (dark blue, dashed) were plotted against the values of the composite biomarker (x axis). The black vertical dashed line indicates a cut-off point as determined by the Youden’s index (y point) in the AIBL PIB data. At the y point, the sensitivity and specificity were 0.900 and 0.923, respectively. With these values, relationships between the prevalence and PPV or NPV were plotted (right). Note that these data do not correspond to the ROC analysis shown in Fig. 2d, because this diagnostic performance plot analysis does not contain subjects with AD. b, Diagnostic performance
plots for cognitively normal subjects in the AIBL PIB unadjusted data (n = 63) (left). The prevalence of Aβ -positivity in general elderly people was assumed to be 30%. At the y point, the sensitivity and specificity were 0.880 and 0.868, respectively. With these values, relationships between the prevalence and PPV or NPV were also plotted (right). c–g, Results of the additional analysis for subjects with and without AD (see Supplementary Discussion). c, Sample numbers for subjects with and without AD. d, Detailed clinical diagnoses of subjects without AD. e, ROC analyses for each plasma biomarker in the overall data (n = 51). f, ROC analysis of the composite biomarker in the overall (n = 51), AD (n = 31), and non-AD (n = 20) groups. g, Performance of the composite biomarker using the common cut-off value. The AUC values were computed from the ROC analysis and sensitivity, specificity, and accuracy were computed by applying the common cut-off value for the composite biomarker (0.376).
© 2018 Macmillan Publishers Limited, part of Springer Nature. All rights reserved.
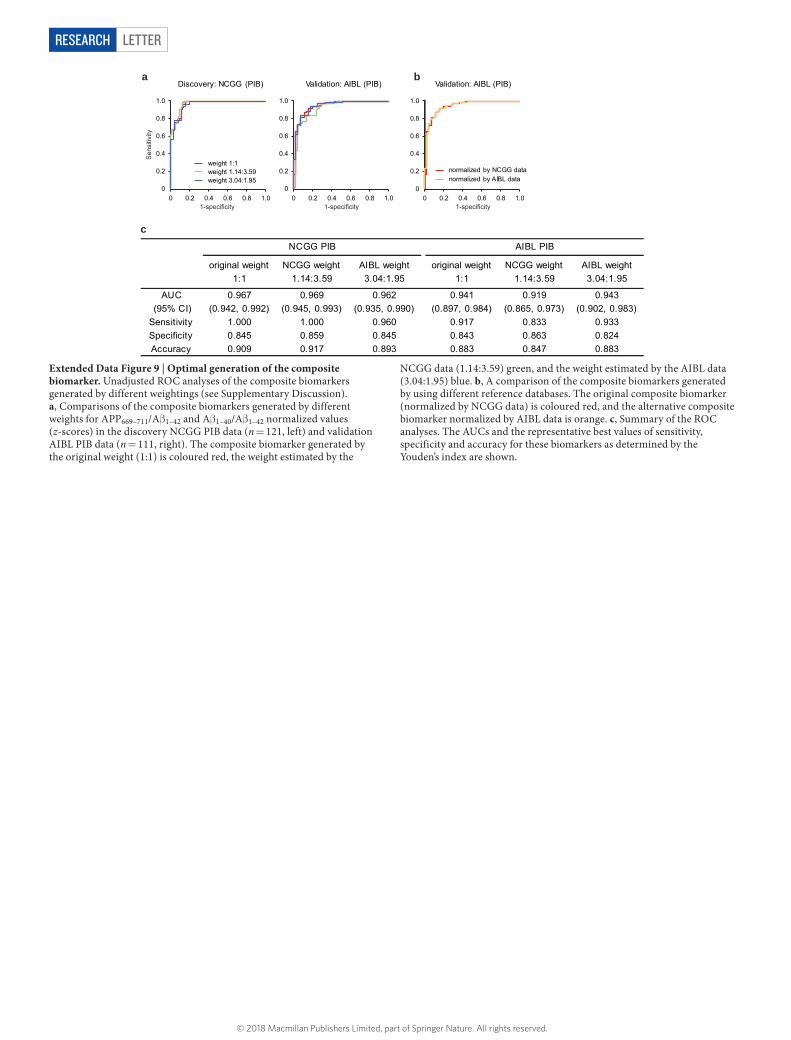
LetterreSeArCH
c
1:1original weight NCGG weight
1.14:3.59AIBL weight3.04:1.95
original weight1:1
NCGG weight1.14:3.59
AIBL weight3.04:1.95
AUC 0.967 0.969 0.962 0.941 0.919 0.943(95% CI)
Specificity
(0.942, 0.992) (0.945, 0.993) (0.935, 0.990) (0.897, 0.984) (0.865, 0.973) (0.902, 0.983)Sensitivity 1.000 1.000 0.960 0.917 0.833 0.933
0.845 0.859 0.845 0.843 0.863 0.824Accuracy 0.909 0.917 0.893 0.883 0.847 0.883
NCGG PIB AIBL PIB
0
0.2
0.4
0.6
0.8
1.0
0 0.2 0.4 0.6 0.8 1.00
0.2
0.4
0.6
0.8
1.0
0 0.2 0.4 0.6 0.8 1.00
0.2
0.4
0.6
0.8
1.0
0 0.2 0.4 0.6 0.8 1.0
Discovery: NCGG (PIB) Validation: AIBL (PIB) Validation: AIBL (PIB)
weight 1.14:3.59weight 3.04:1.95
weight 1:1
normalized by AIBL datanormalized by NCGG data
a b
Sen
sitiv
ity
1-specificity 1-specificity 1-specificity
Extended Data Figure 9 | Optimal generation of the composite biomarker. Unadjusted ROC analyses of the composite biomarkers generated by different weightings (see Supplementary Discussion). a, Comparisons of the composite biomarkers generated by different weights for APP669–711/Aβ 1–42 and Aβ 1–40/Aβ 1–42 normalized values (z-scores) in the discovery NCGG PIB data (n = 121, left) and validation AIBL PIB data (n = 111, right). The composite biomarker generated by the original weight (1:1) is coloured red, the weight estimated by the
NCGG data (1.14:3.59) green, and the weight estimated by the AIBL data (3.04:1.95) blue. b, A comparison of the composite biomarkers generated by using different reference databases. The original composite biomarker (normalized by NCGG data) is coloured red, and the alternative composite biomarker normalized by AIBL data is orange. c, Summary of the ROC analyses. The AUCs and the representative best values of sensitivity, specificity and accuracy for these biomarkers as determined by the Youden’s index are shown.
© 2018 Macmillan Publishers Limited, part of Springer Nature. All rights reserved.
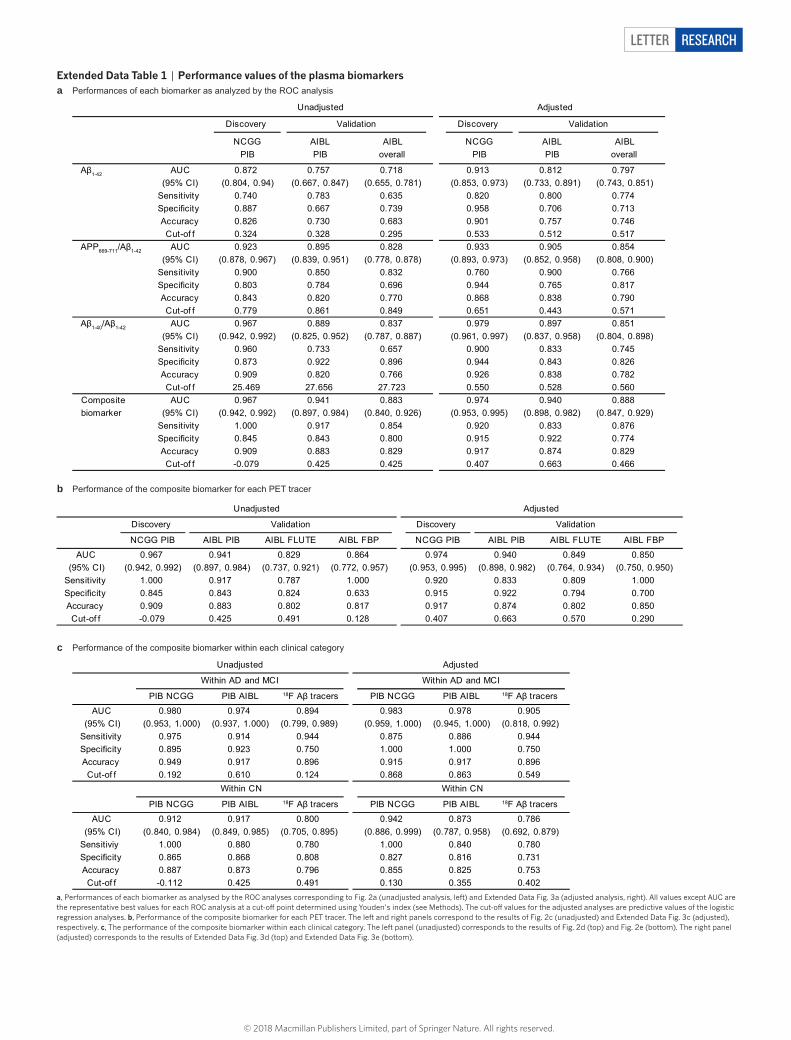
Letter reSeArCH
extended Data Table 1 | Performance values of the plasma biomarkers
a, Performances of each biomarker as analysed by the ROC analyses corresponding to Fig. 2a (unadjusted analysis, left) and Extended Data Fig. 3a (adjusted analysis, right). All values except AUC are the representative best values for each ROC analysis at a cut-off point determined using Youden’s index (see Methods). The cut-off values for the adjusted analyses are predictive values of the logistic regression analyses. b, Performance of the composite biomarker for each PET tracer. The left and right panels correspond to the results of Fig. 2c (unadjusted) and Extended Data Fig. 3c (adjusted), respectively. c, The performance of the composite biomarker within each clinical category. The left panel (unadjusted) corresponds to the results of Fig. 2d (top) and Fig. 2e (bottom). The right panel (adjusted) corresponds to the results of Extended Data Fig. 3d (top) and Extended Data Fig. 3e (bottom).
a
b
c
Performances of each biomarker as analyzed by the ROC analysis
Performance of the composite biomarker for each PET tracer
Performance of the composite biomarker within each clinical category
Unadjusted Adjusted
Discovery Discovery
NCGGPIB
AIBLPIB
AIBLoverall
NCGGPIB
AIBLPIB
AIBLoverall
Aβ1-42 AUC 0.872 0.757 0.718 0.913 0.812 0.797(95% CI) (0.804, 0.94) (0.667, 0.847) (0.655, 0.781) (0.853, 0.973) (0.733, 0.891) (0.743, 0.851)
Sensitivity 0.740 0.783 0.635 0.820 0.800 0.774Specificity 0.887 0.667 0.739 0.958 0.706 0.713Accuracy 0.826 0.730 0.683 0.901 0.757 0.746Cut-of f 0.324 0.328 0.295 0.533 0.512 0.517
APP669-711/Aβ1-42 AUC 0.923 0.895 0.828 0.933 0.905 0.854(95% CI) (0.878, 0.967) (0.839, 0.951) (0.778, 0.878) (0.893, 0.973) (0.852, 0.958) (0.808, 0.900)
Sensitivity 0.900 0.850 0.832 0.760 0.900 0.766Specificity 0.803 0.784 0.696 0.944 0.765 0.817Accuracy 0.843 0.820 0.770 0.868 0.838 0.790Cut-of f 0.779 0.861 0.849 0.651 0.443 0.571
Aβ1-40/Aβ1-42 AUC 0.967 0.889 0.837 0.979 0.897 0.851(95% CI) (0.942, 0.992) (0.825, 0.952) (0.787, 0.887) (0.961, 0.997) (0.837, 0.958) (0.804, 0.898)
Sensitivity 0.960 0.733 0.657 0.900 0.833 0.745Specificity 0.873 0.922 0.896 0.944 0.843 0.826Accuracy 0.909 0.820 0.766 0.926 0.838 0.782Cut-of f 25.469 27.656 27.723 0.550 0.528 0.560
Composite AUC 0.967 0.941 0.883 0.974 0.940 0.888 biomarker (95% CI) (0.942, 0.992) (0.897, 0.984) (0.840, 0.926) (0.953, 0.995) (0.898, 0.982) (0.847, 0.929)
Sensitivity 1.000 0.917 0.854 0.920 0.833 0.876Specificity 0.845 0.843 0.800 0.915 0.922 0.774Accuracy 0.909 0.883 0.829 0.917 0.874 0.829Cut-of f -0.079 0.425 0.425 0.407 0.663 0.466
Validation Validation
Discovery Discovery
NCGG PIB AIBL PIB AIBL FLUTE AIBL FBP NCGG PIB AIBL PIB AIBL FLUTE AIBL FBP
AUC 0.967 0.941 0.829 0.864 0.974 0.940 0.849 0.850(95% CI) (0.942, 0.992) (0.897, 0.984) (0.737, 0.921) (0.772, 0.957) (0.953, 0.995) (0.898, 0.982) (0.764, 0.934) (0.750, 0.950)
Sensitivity 1.000 0.917 0.787 1.000 0.920 0.833 0.809 1.000Specificity 0.845 0.843 0.824 0.633 0.915 0.922 0.794 0.700Accuracy 0.909 0.883 0.802 0.817 0.917 0.874 0.802 0.850Cut-of f -0.079 0.425 0.491 0.128 0.407 0.663 0.570 0.290
Validation
Unadjusted Adjusted
Validation
PIB NCGG PIB AIBL 18F Aβ tracers PIB NCGG PIB AIBL 18F Aβ tracers
AUC 0.980 0.974 0.894 0.983 0.978 0.905(95% CI) (0.953, 1.000) (0.937, 1.000) (0.799, 0.989) (0.959, 1.000) (0.945, 1.000) (0.818, 0.992)
Sensitivity 0.975 0.914 0.944 0.875 0.886 0.944Specificity 0.895 0.923 0.750 1.000 1.000 0.750Accuracy 0.949 0.917 0.896 0.915 0.917 0.896Cut-of f 0.192 0.610 0.124 0.868 0.863 0.549
PIB NCGG PIB AIBL 18F Aβ tracers PIB NCGG PIB AIBL 18F Aβ tracers
AUC 0.912 0.917 0.800 0.942 0.873 0.786(95% CI) (0.840, 0.984) (0.849, 0.985) (0.705, 0.895) (0.886, 0.999) (0.787, 0.958) (0.692, 0.879)
Sensitiviy 1.000 0.880 0.780 1.000 0.840 0.780Specificity 0.865 0.868 0.808 0.827 0.816 0.731Accuracy 0.887 0.873 0.796 0.855 0.825 0.753
Cut-of f -0.112 0.425 0.491 0.130 0.355 0.402
Within AD and MCI Within AD and MCI
Unadjusted Adjusted
Within CN Within CN
© 2018 Macmillan Publishers Limited, part of Springer Nature. All rights reserved.
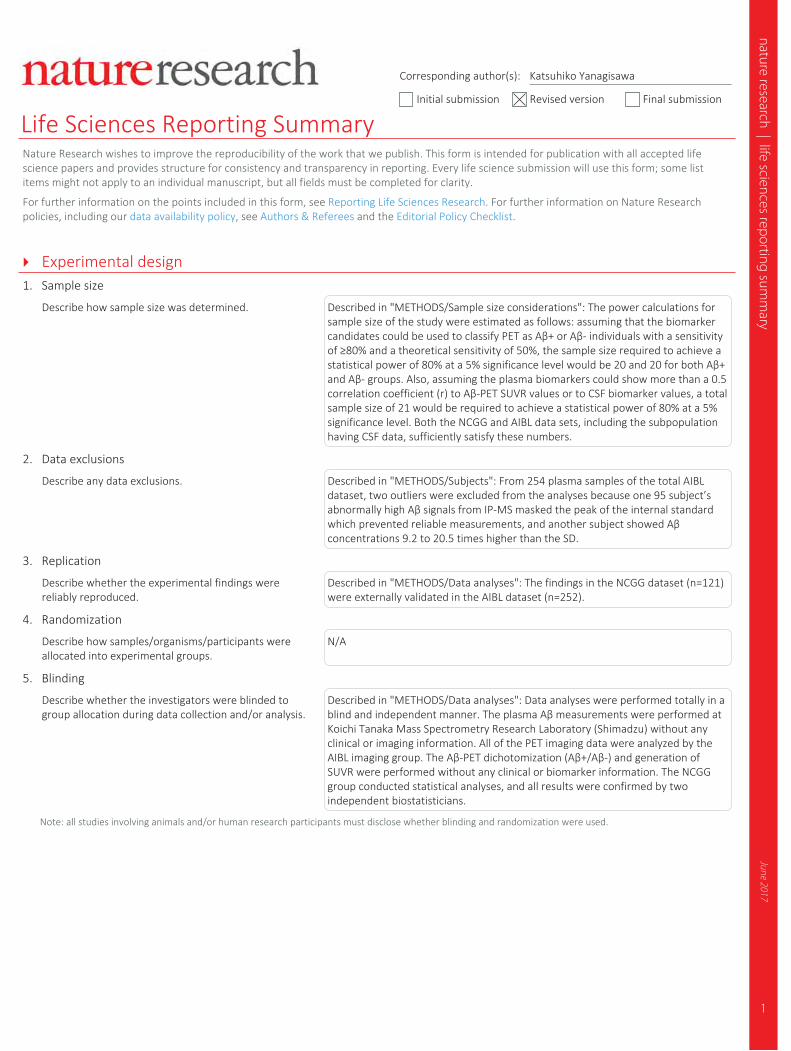
1
nature research | life sciences reporting summ
aryJune 2017
Corresponding author(s): Katsuhiko Yanagisawa
Initial submission Revised version Final submission
Life Sciences Reporting SummaryNature Research wishes to improve the reproducibility of the work that we publish. This form is intended for publication with all accepted life science papers and provides structure for consistency and transparency in reporting. Every life science submission will use this form; some list items might not apply to an individual manuscript, but all fields must be completed for clarity.
For further information on the points included in this form, see Reporting Life Sciences Research. For further information on Nature Research policies, including our data availability policy, see Authors & Referees and the Editorial Policy Checklist.
Experimental design1. Sample size
Describe how sample size was determined. Described in "METHODS/Sample size considerations": The power calculations for sample size of the study were estimated as follows: assuming that the biomarker candidates could be used to classify PET as Aβ+ or Aβ- individuals with a sensitivity of ≥80% and a theoretical sensitivity of 50%, the sample size required to achieve a statistical power of 80% at a 5% significance level would be 20 and 20 for both Aβ+ and Aβ- groups. Also, assuming the plasma biomarkers could show more than a 0.5 correlation coefficient (r) to Aβ-PET SUVR values or to CSF biomarker values, a total sample size of 21 would be required to achieve a statistical power of 80% at a 5% significance level. Both the NCGG and AIBL data sets, including the subpopulation having CSF data, sufficiently satisfy these numbers.
2. Data exclusions
Describe any data exclusions. Described in "METHODS/Subjects": From 254 plasma samples of the total AIBL dataset, two outliers were excluded from the analyses because one 95 subject’s abnormally high Aβ signals from IP-MS masked the peak of the internal standard which prevented reliable measurements, and another subject showed Aβ concentrations 9.2 to 20.5 times higher than the SD.
3. Replication
Describe whether the experimental findings were reliably reproduced.
Described in "METHODS/Data analyses": The findings in the NCGG dataset (n=121) were externally validated in the AIBL dataset (n=252).
4. Randomization
Describe how samples/organisms/participants were allocated into experimental groups.
N/A
5. Blinding
Describe whether the investigators were blinded to group allocation during data collection and/or analysis.
Described in "METHODS/Data analyses": Data analyses were performed totally in a blind and independent manner. The plasma Aβ measurements were performed at Koichi Tanaka Mass Spectrometry Research Laboratory (Shimadzu) without any clinical or imaging information. All of the PET imaging data were analyzed by the AIBL imaging group. The Aβ-PET dichotomization (Aβ+/Aβ-) and generation of SUVR were performed without any clinical or biomarker information. The NCGG group conducted statistical analyses, and all results were confirmed by two independent biostatisticians.
Note: all studies involving animals and/or human research participants must disclose whether blinding and randomization were used.
2
nature research | life sciences reporting summ
aryJune 2017
6. Statistical parameters For all figures and tables that use statistical methods, confirm that the following items are present in relevant figure legends (or in the Methods section if additional space is needed).
n/a Confirmed
The exact sample size (n) for each experimental group/condition, given as a discrete number and unit of measurement (animals, litters, cultures, etc.)
A description of how samples were collected, noting whether measurements were taken from distinct samples or whether the same sample was measured repeatedly
A statement indicating how many times each experiment was replicated
The statistical test(s) used and whether they are one- or two-sided (note: only common tests should be described solely by name; more complex techniques should be described in the Methods section)
A description of any assumptions or corrections, such as an adjustment for multiple comparisons
The test results (e.g. P values) given as exact values whenever possible and with confidence intervals noted
A clear description of statistics including central tendency (e.g. median, mean) and variation (e.g. standard deviation, interquartile range)
Clearly defined error bars
See the web collection on statistics for biologists for further resources and guidance.
SoftwarePolicy information about availability of computer code
7. Software
Describe the software used to analyze the data in this study.
Described in "METHODS/Data analyses" and "METHODS/Imaging data": R ver. 3.3.2, SPSS ver. 21, and JMP software ver. 8., CapAIBL (https://milxcloud.csiro.au/), SPM8 (http://www.fil.ion.ucl.ac.uk/spm/)
For manuscripts utilizing custom algorithms or software that are central to the paper but not yet described in the published literature, software must be made available to editors and reviewers upon request. We strongly encourage code deposition in a community repository (e.g. GitHub). Nature Methods guidance for providing algorithms and software for publication provides further information on this topic.
Materials and reagentsPolicy information about availability of materials
8. Materials availability
Indicate whether there are restrictions on availability of unique materials or if these materials are only available for distribution by a for-profit company.
Described in "Data availability": Source data of graphs plotted in Table 1, Fig. 1-3, and Extended Data Figs1-9 are available as source files. Other data are available from the corresponding author upon reasonable request.
9. Antibodies
Describe the antibodies used and how they were validated for use in the system under study (i.e. assay and species).
Described in "METHODS/Plasma Aβ measurements" : IgG monoclonal antibody 6E10 (BioLegend, San Diego, CA, USA)
10. Eukaryotic cell linesa. State the source of each eukaryotic cell line used. Described in "Supplementary Information/Cell Culture": BE(2)-C cell (CRL-2268),
American Type Culture Collection
b. Describe the method of cell line authentication used. N/A
c. Report whether the cell lines were tested for mycoplasma contamination.
Described in "Supplementary Information/Cell Culture": We routinely check mycoplasma contamination by DAPI staining and PCR analysis.
d. If any of the cell lines used are listed in the database of commonly misidentified cell lines maintained by ICLAC, provide a scientific rationale for their use.
N/A

3
nature research | life sciences reporting summ
aryJune 2017
Animals and human research participantsPolicy information about studies involving animals; when reporting animal research, follow the ARRIVE guidelines
11. Description of research animalsProvide details on animals and/or animal-derived materials used in the study.
N/A
Policy information about studies involving human research participants
12. Description of human research participantsDescribe the covariate-relevant population characteristics of the human research participants.
Described in "METHODS/Subjects": The participants were aged 60 to 90 years. The discovery NCGG dataset consisted of 62 CN, 30 MCI, and 29 AD individuals (121 in total) selected from the NCGG’s in-house clinical studies. The AIBL dataset for external validation consisted of 156 CN, 68 MCI, and 30 AD participants (254 in total).