HIF-2α dependent lipid storage promotes endoplasmic...
40
1 HIF-2α dependent lipid storage promotes endoplasmic reticulum homeostasis in clear cell renal cell carcinoma Bo Qiu 1,2 , Daniel Ackerman 1 , Danielle J. Sanchez 1,3 , Bo Li 1 , Joshua D. Ochocki 1 , Alison Grazioli 1 , Ekaterina Bobrovnikova-Marjon 1,* , J. Alan Diehl 4 , Brian Keith 1,2 , M. Celeste Simon 1,3,5 1 Abramson Family Cancer Research Institute, 2 Department of Cancer Biology, 3 Department of Cell and Developmental Biology, Perelman School of Medicine at the University of Pennsylvania, Philadelphia, PA 19104, USA 4 Department of Biochemistry and Molecular Biology, Medical University of South Carolina, Charleston, SC 29425, USA 5 Howard Hughes Medical Institute * Present address: Agios Pharmaceuticals, Cambridge, MA 02139 Running title: HIF-2α and lipid storage in clear cell renal cell carcinoma Keywords: HIF-2α, lipid storage, lipid droplets, clear cell renal cell carcinoma, ER stress Word Count: 5982 Figures: 7 primary figures, 3 supplemental tables, 9 supplemental figures Financial Support: This work was supported by the Howard Hughes Medical Institute, NIH grant 2-P01- CA104838 to M.C.S, and NIH fellowship 5-F30-CA177106 to B.Q. Conflicts of Interest: The authors have no conflicts of interest to report. Corresponding Author: M. Celeste Simon, Ph.D Rm 456 BRB II/III 421 Curie Blvd Philadelphia, PA 19104 Phone: (215) 746-5532 Facsimile: (215) 746-5511 Email: [email protected] Research. on June 19, 2018. © 2015 American Association for Cancer cancerdiscovery.aacrjournals.org Downloaded from Author manuscripts have been peer reviewed and accepted for publication but have not yet been edited. Author Manuscript Published OnlineFirst on March 31, 2015; DOI: 10.1158/2159-8290.CD-14-1507
Transcript of HIF-2α dependent lipid storage promotes endoplasmic...
1
HIF-2α dependent lipid storage promotes endoplasmic reticulum homeostasis in clear cell renal
cell carcinoma
Bo Qiu1,2, Daniel Ackerman1, Danielle J. Sanchez 1,3, Bo Li1, Joshua D. Ochocki1, Alison Grazioli1,
Ekaterina Bobrovnikova-Marjon1,*, J. Alan Diehl 4, Brian Keith1,2, M. Celeste Simon1,3,5
1 Abramson Family Cancer Research Institute,
2 Department of Cancer Biology,
3 Department of Cell and Developmental Biology, Perelman School of Medicine at the University of
Pennsylvania, Philadelphia, PA 19104, USA
4 Department of Biochemistry and Molecular Biology, Medical University of South Carolina, Charleston,
SC 29425, USA
5 Howard Hughes Medical Institute
* Present address: Agios Pharmaceuticals, Cambridge, MA 02139
Running title: HIF-2α and lipid storage in clear cell renal cell carcinoma
Keywords: HIF-2α, lipid storage, lipid droplets, clear cell renal cell carcinoma, ER stress
Word Count: 5982
Figures: 7 primary figures, 3 supplemental tables, 9 supplemental figures
Financial Support: This work was supported by the Howard Hughes Medical Institute, NIH grant 2-P01-
CA104838 to M.C.S, and NIH fellowship 5-F30-CA177106 to B.Q.
Conflicts of Interest: The authors have no conflicts of interest to report.
Corresponding Author: M. Celeste Simon, Ph.D Rm 456 BRB II/III 421 Curie Blvd Philadelphia, PA 19104 Phone: (215) 746-5532 Facsimile: (215) 746-5511 Email: [email protected]
Research. on June 19, 2018. © 2015 American Association for Cancercancerdiscovery.aacrjournals.org Downloaded from
Author manuscripts have been peer reviewed and accepted for publication but have not yet been edited. Author Manuscript Published OnlineFirst on March 31, 2015; DOI: 10.1158/2159-8290.CD-14-1507
2
Abstract: Two hallmarks of clear cell renal cell carcinoma (ccRCC) are constitutive hypoxia inducible
factor (HIF) signaling and abundant intracellular lipid droplets (LDs). However, regulation of lipid storage
and its role in ccRCC are incompletely understood. Transcriptional profiling of primary ccRCC samples
revealed that expression of the LD coat protein gene PLIN2 was elevated in tumors and correlated with
HIF-2α, but not HIF-1α, activation. HIF-2α dependent PLIN2 expression promoted lipid storage,
proliferation, and viability in xenograft tumors. Mechanistically, lipid storage maintained integrity of the
endoplasmic reticulum (ER), which is functionally and physically associated with LDs. Specifically, PLIN2
dependent lipid storage suppressed cytotoxic ER stress responses that otherwise result from elevated
protein synthetic activity characteristic of ccRCC cells. Thus, in addition to promoting ccRCC proliferation
and anabolic metabolism, HIF-2α modulates lipid storage to sustain ER homeostasis, particularly under
conditions of nutrient and oxygen limitation, thereby promoting tumor cell survival.
Significance: We demonstrate that HIF-2α promotes lipid storage, ER homeostasis, and cell viability in
ccRCC via upregulation of the LD coat protein PLIN2, revealing a novel function for the well documented
“clear cell” phenotype and identifying ER stress as a targetable vulnerability created by HIF-2α/PLIN2
suppression in this common renal malignancy.
Research. on June 19, 2018. © 2015 American Association for Cancercancerdiscovery.aacrjournals.org Downloaded from
Author manuscripts have been peer reviewed and accepted for publication but have not yet been edited. Author Manuscript Published OnlineFirst on March 31, 2015; DOI: 10.1158/2159-8290.CD-14-1507
3
Introduction
Clear cell renal cell carcinoma (ccRCC) is the most common form of kidney cancer worldwide (1,
2). In 90% of ccRCC tumors, pathogenesis is characterized by constitutive activation of the hypoxia
inducible factors (HIFs) due to loss of the pVHL (von Hippel-Lindau) tumor suppressor, required for
oxygen (O2) dependent suppression of HIF signaling (1). HIF regulated processes are orchestrated by
two HIF-α subunits (HIF-1α and HIF-2α), which share several common transcriptional targets, but also
exhibit distinct functions (2). This is particularly evident in ccRCC, where HIF-1α expression is frequently
lost during disease progression, and pre-clinical data indicate that it can repress tumor growth (3). The
central role of HIF-2α in ccRCC is supported by findings that 1) all pVHL-null ccRCC maintain HIF-2α
expression (4), 2) HIF-2α function is required for ccRCC xenograft growth (1, 2), and 3) polymorphisms in
EPAS1/HIF2α are associated with increased ccRCC risk in GWAS studies (5). HIF-dependent gene
expression contributes directly to enhanced cell proliferation (6) and metabolic alterations that
characterize ccRCC (1, 7).
A second hallmark of ccRCC is the presence of intracellular lipid droplets (LDs), which consist of
a neutral lipid core containing triglycerides and cholesterol-esters surrounded by a phospholipid
monolayer and associated LD surface proteins (8). Two well-characterized functions of lipid storage in
eukaryotic cells include energy homeostasis and release of lipid species for membrane synthesis during
proliferation (8). In addition, LDs are functionally and physically associated with the endoplasmic
reticulum (ER), as lipids and the proteins that synthesize/modify them are exchanged between these
organelles via transient membrane bridges (9). The PAT (Perilipin, Adipophilin, Tip47) family of LD coat
proteins regulate both lipid storage and lipolysis (8). Perilipin (PLIN1) is expressed primarily in adipose
and steroidogenic cells, while Adipophilin/Adipose Differentiation Related Protein (hereafter referred to as
Perilipin 2, PLIN2) and TIP47 (PLIN3) are ubiquitously expressed and function as the predominant LD
coat proteins in non-adipose tissue (10). Interestingly, PLIN2 expression is positively correlated with HIF-
2α activation in mouse hepatocytes in vivo (11), and our microarray data suggest that HIF-2α promotes
PLIN2 mRNA expression in ccRCC cells in vitro (12). However, it remains unknown if PLIN2 regulates
lipid metabolism and storage downstream of HIF-2α or if this phenotype has any significant tumor-
promoting functions in ccRCC.
Research. on June 19, 2018. © 2015 American Association for Cancercancerdiscovery.aacrjournals.org Downloaded from
Author manuscripts have been peer reviewed and accepted for publication but have not yet been edited. Author Manuscript Published OnlineFirst on March 31, 2015; DOI: 10.1158/2159-8290.CD-14-1507
4
Enhanced lipid storage in ccRCC suggests profoundly altered lipid metabolism. In normal cells,
lipid metabolism is carefully regulated to support membrane expansion, organelle homeostasis, signal
transduction, and cell viability. Recent work indicates that cellular transformation commits tumors to
growth programs that strain ER homeostasis, including dysregulation of protein and lipid metabolism (13).
Such ER stress is exacerbated by conditions of nutrient and O2 deprivation characteristic of solid tumor
microenvironments, which further disrupt cellular protein and lipid homeostasis (14). Mammalian cells
activate a highly conserved unfolded protein response (UPR) upon elevated mis-folded protein load or
disruption of ER membrane lipid composition (15). ER stress sensors, including PERK, IRE-1α, and
ATF6, initiate UPR signaling and adaptive processes, including a generalized reduction in protein
synthesis and selective expression of genes encoding lipid synthetic enzymes, protein-folding
chaperones, and components of the ER associated degradation (ERAD) system for enhancing
proteasome dependent proteolysis (15). However, sustained and irremediable ER stress can trigger cell
death via a “terminal” UPR (16). Indeed, anti-tumor activity of the proteasome inhibitor Bortezomib in
multiple myeloma derives at least partly from elevated mis-folded protein levels and induction of a
cytotoxic UPR (17).
In this study, we explored mechanisms that regulate lipid storage and its function in ccRCC.
Transcriptional profiling of primary ccRCC and normal kidney samples revealed that PLIN2, but not other
perilipin family members, is overexpressed in ccRCC and positively correlated with HIF-2α activation.
HIF-2α promoted PLIN2 expression and lipid storage in ccRCC cell lines, and remarkably, PLIN2 activity
accounted for a substantial portion of HIF-2α’s tumor-promoting effects in xenograft assays.
Mechanistically, the HIF-2α/PLIN2/lipid storage axis was required for ER homeostasis and resistance
against cytotoxic ER stress. These findings reveal an unexpected function for the “clear cell” phenotype
and identify enhanced ER stress as a targetable vulnerability created by HIF-2α suppression in ccRCC.
Research. on June 19, 2018. © 2015 American Association for Cancercancerdiscovery.aacrjournals.org Downloaded from
Author manuscripts have been peer reviewed and accepted for publication but have not yet been edited. Author Manuscript Published OnlineFirst on March 31, 2015; DOI: 10.1158/2159-8290.CD-14-1507
5
Results
PLIN2 is overexpressed in ccRCC patient samples and positively correlated with HIF-2α activation
To confirm the contribution of neutral lipid storage to the “clear cell” phenotype in our archived
ccRCC tissues, we performed oil red O staining of primary tumor and matched normal kidney samples
and observed enhanced neutral lipid staining in ccRCC tumor cells (Fig. 1A). Potential mediators of
enhanced lipid storage were identified by analyzing RNA-seq data released by The Cancer Genome Atlas
(TCGA) comparing primary ccRCC (n=480) and normal kidney (n=69) tissues (18). Focusing on
expression of the PAT family of lipid droplet coat proteins, we observed that PLIN2 was overexpressed in
tumors across all stages of disease (Fig. 1B). In contrast, mRNA expression of other perilipin family
members was not enhanced in ccRCC (Fig. S1A). PLIN2 upregulation was confirmed in an independent
set of matched ccRCC (n=10) and normal kidneys (n=10) from our archived samples (Fig. 1C). Analysis
of “Triglyceride Synthesis” and “Cholesterol Synthesis” gene-sets within the TCGA RNA-seq dataset, as
defined by the Broad Institute Molecular Signatures database, revealed differential expression of many
lipogenic genes (Tables S1-2). Some fatty acid and triglyceride synthesis genes were upregulated within
tumor tissues (i.e. ACLY, ELOVL2, LPCAT1), while many others were downregulated (i.e. multiple ACSL
and AGPAT family members) (Table S1). On the other hand, the expression of most cholesterol
biosynthetic enzymes was decreased in tumor tissue relative to normal kidney (Table S2). Although
altered expression of triglyceride and cholesterol synthesis enzymes may impact lipid synthesis and
storage in ccRCC, we focused our attention on PLIN2 for multiple reasons. First of all, functional studies
in murine models of hepatosteatosis have revealed that Plin2 upregulation is necessary for lipid storage
and enhanced de novo lipid synthesis, even if other lipogenic genes were overexpressed (i.e. Elovl3,
Fasn, Scd1) (19, 20). Secondly, overexpression of Plin2 alone was sufficient to drive lipid synthesis and
storage in murine liver (19) and mouse embryonic fibroblasts (21). Taken together with the observation
that HIF-2α activation and PLIN2 expression are positively correlated in various settings (11, 22), these
findings suggested a functional connection between two hallmarks of ccRCC—constitutive HIF activity
and heightened neutral lipid storage.
Analysis of microarray data profiling gene expression in normal kidney and distinct renal
malignancies (23) revealed that PLIN2, along with a panel of established HIF-2α target genes, is
Research. on June 19, 2018. © 2015 American Association for Cancercancerdiscovery.aacrjournals.org Downloaded from
Author manuscripts have been peer reviewed and accepted for publication but have not yet been edited. Author Manuscript Published OnlineFirst on March 31, 2015; DOI: 10.1158/2159-8290.CD-14-1507
6
specifically elevated in ccRCC samples (Fig. S1B). Because pVHL loss of function is a defining feature of
most ccRCC, we examined whether HIF activation promotes PLIN2 expression. To explore this link in
ccRCC patient samples, we performed transcriptome profiling of tumors previously grouped into three
categories based on HIF-α staining and VHL gene sequencing: VHL WT (no HIF-α staining), HIF-1α and
HIF-2α expressing (“H1H2”), and HIF-2α only (“H2”) (4). This analysis indicated that PLIN2 mRNA was
elevated in both H1H2 (9.7 fold overexpression, p=2.6E4) and H2 (16.7 fold overexpression, p=2.5E-6)
tumors when compared to VHL WT samples (Fig. 1D). Multiple documented HIF-2α targets in ccRCC
exhibited a similar expression pattern (Fig. 1D). Collectively, these observations suggest that PLIN2
levels increase early in disease progression and correlate with enhanced HIF-2α activity in ccRCC patient
samples.
To directly examine the role of HIF-2α in PLIN2 regulation in ccRCC, we depleted HIF-2α from
786-O (H2) and RCC4 (H1H2) ccRCC cell lines using multiple shRNAs and found that PLIN2 mRNA and
protein expression was reduced (Fig. 1E-F). In contrast, HIF1A silencing in RCC4 cells actually enhanced
PLIN2 mRNA and protein levels, while decreasing levels of the HIF-1α target pyruvate dehydrogenase
kinase 1 (PDK1) (Fig. 1F). These results are consistent with the PLIN2 expression pattern we observed in
primary patient samples (Fig. 1D). We also determined whether peroxisome proliferator-activated
receptor gamma (PPARγ) regulates PLIN2 in ccRCC, as PPARγ is overexpressed in ccRCC tissue and
was previously shown to stimulate PLIN2 transcription in the settings of hepatosteatosis and foam cell
formation (24). In A498 cells, which exhibit high levels of both PPARγ and PLIN2, PPARG shRNAs
reduced PPAR-response element reporter activity, but not PLIN2 levels (Fig. S2A-B). PPARα (PPARA)
also promotes PLIN2 transcription in states of lipid accumulation (10). However, expression of PPARA
and many of its target genes are reduced in ccRCC compared to normal kidney tissue (Fig. S2C-D),
decreasing the likelihood that it regulates PLIN2 in ccRCC. These findings suggest that constitutive HIF-
2α activity, rather than PPARγ, PPARα, or HIF-1α, regulates PLIN2 in both ccRCC cell lines and primary
patient samples.
HIF-2α/PLIN2 promote lipid storage and tumor growth in ccRCC xenografts
PLIN2 is commonly used as a marker of cellular lipid accumulation, but its overexpression is also
Research. on June 19, 2018. © 2015 American Association for Cancercancerdiscovery.aacrjournals.org Downloaded from
Author manuscripts have been peer reviewed and accepted for publication but have not yet been edited. Author Manuscript Published OnlineFirst on March 31, 2015; DOI: 10.1158/2159-8290.CD-14-1507
7
sufficient to increase lipid synthesis and storage in murine fibroblasts in vitro (21) and liver in vivo (19).
Given the numerous tumor-promoting processes downstream of HIF-2α, we tested whether PLIN2
restoration alone was sufficient for tumor growth following HIF-2α suppression in multiple model systems.
Doxycycline (Dox)-inducible shRNA was used to deplete HIF-2α in 786-O cells constitutively expressing
either pCDH empty vector (EV) or an exogenous PLIN2 cDNA. Xenografts generated from these two cell
lines grew at identical rates prior to Dox exposure (data not shown). After administration of Dox-chow to
inhibit HIF-2α, EV xenografts exhibited a steady decline in tumor volume and reduced mass at sacrifice,
whereas those expressing exogenous PLIN2 demonstrated partial maintenance of both tumor volume
and mass (Fig. 2A, left and center). qRT-PCR analysis confirmed that HIF-2α regulates PLIN2 in vivo and
exogenous PLIN2 mRNA levels were maintained following Dox-induced HIF-2α depletion (Fig. 2A, right).
Furthermore, oil red O staining indicted that HIF-2α loss reduced neutral lipid staining, whereas
exogenous PLIN2 fully restored lipid storage (Fig. 2B-C). These results indicate that PLIN2 is both
necessary and sufficient to promote neutral lipid storage in ccRCC xenografts. Further histological
analysis revealed that HIF-2α depletion dramatically decreased tumor cell proliferation, as indicated by
Ki67 staining, which was partially restored by exogenous PLIN2 (Fig. 2B-C). We also found that HIF-2α
suppression resulted in large areas of tissue necrosis and induction of apoptosis, based on cleaved
caspase 3 accumulation, which were both reduced by PLIN2 expression (Fig. 2B-C).
Despite the complexity of HIF-2α dependent tumorigenesis in vivo, including cell extrinsic effects
such as angiogenesis, PLIN2 restoration alone significantly restored tumor cell proliferation and viability.
We reasoned that enhanced lipid storage imparts a cell intrinsic advantage to tumor cells. To test this
hypothesis, we generated in vitro 3D tumor spheroids using 786-O cells, which recapitulate nutrient and
O2 gradients within solid tumors (Fig. S3A). In this assay, HIF-2α inhibition was associated with loss of
neutral lipid staining and enhanced cell death, while exogenous PLIN2 expression partially restored lipid
storage and reduced cell death (Fig. S3B-C). Thus, multiple tumor model systems suggest an essential
role for PLIN2 dependent lipid storage downstream of HIF-2α in ccRCC.
PLIN2 dependent lipid storage is required for ER homeostasis and cell viability in ccRCC cell lines
and xenograft tumors
Research. on June 19, 2018. © 2015 American Association for Cancercancerdiscovery.aacrjournals.org Downloaded from
Author manuscripts have been peer reviewed and accepted for publication but have not yet been edited. Author Manuscript Published OnlineFirst on March 31, 2015; DOI: 10.1158/2159-8290.CD-14-1507
8
The finding that PLIN2 is required for cell viability in ccRCC xenografts was surprising, as acute
PLIN2 depletion experiments have reported no effects on cell viability either in vivo or in vitro (19, 20, 25).
To assess the effects of direct PLIN2 depletion in ccRCC, we expressed multiple shRNAs targeting PLIN2
or a scrambled control (SCR) in 786-O and A498 cells. In both cell lines, we observed a dosage
dependent loss of cell viability and proliferation that correlated with degree of PLIN2 depletion (Fig. 3A-B;
S4A-B). Oil red O staining and BODIPY 493/503 quantification also revealed dosage dependent
decreases in neutral lipid levels (Fig. 3C-D). To assess functional lipid storage capacity, cells were treated
with oleic acid, a potent inducer of triglyceride synthesis and neutral lipid storage that is selectively toxic
for cells incapable of storing it as triglyceride (26). Consistent with decreased ability to store lipids within
LDs, PLIN2 depleted cells were preferentially sensitized to oleic acid induced cell death (Fig. 3E).
In light of the intimate ER/LD relationship and evidence that altered membrane properties can
trigger ER stress (13, 15), we reasoned that decreased lipid storage capacity could disrupt ER
homeostasis and trigger the UPR, cell cycle withdrawal, and cell death. PLIN2 ablation in 786-O cells
elicited dosage dependent activation of UPR sensors PERK, IRE-1α, and ATF6 and induction of multiple
UPR target genes (Fig. 4A). Furthermore, ER Tracker imaging and flow cytometry indicated ER
expansion in PLIN2 depleted cells (Fig. 4B) and ultra-structural analysis by transmission electron
microscopy (TEM) confirmed the presence of dilated and irregularly shaped rough ER (Fig. 4C), both of
which are consistent with ER stress (27). Similarly, PLIN2 depletion in A498 cells elicited morphological
and gene expression changes indicative of ER stress (Fig. S4C-D). Based on these observations, we
quantified UPR target gene expression in HIF-2α deficient xenograft tumors. Indeed, multiple UPR
targets, including the “terminal” UPR genes CHOP and TXNIP, were elevated in HIF-2α depleted tumors
and decreased by exogenous PLIN2 expression (Fig. 4D).
To determine if UPR activation promotes cell death upon PLIN2 loss in ccRCC, we utilized
previously characterized small molecule PERK and IRE-1α inhibitors, along with siRNA against ATF6, to
suppress UPR signaling (28, 29). These tools were validated in A498 cells, based on UPR sensor
phosphorylation status and target gene expression (Fig. S5A-D). In 786-O cells, PERK inhibition reduced
ATF3 levels (a PERK/ATF4 target) in PLIN2 depleted cells, but enhanced cell death and expression of
multiple IRE-1α and ATF6 target genes (Fig. 5A; S5B-D). Whereas IRE-1α and ATF6 suppression each
Research. on June 19, 2018. © 2015 American Association for Cancercancerdiscovery.aacrjournals.org Downloaded from
Author manuscripts have been peer reviewed and accepted for publication but have not yet been edited. Author Manuscript Published OnlineFirst on March 31, 2015; DOI: 10.1158/2159-8290.CD-14-1507
9
modestly restored cell viability, combined suppression of both yielded enhanced cell survival (Fig. 5B). In
A498 cells, ATF6 promoted cell death downstream of PLIN2 inhibition (Fig. S6A-B). While the specific
UPR-sensor(s) mediating cell death varies between cell lines, our results indicate that PLIN2 is required
for maintenance of ER homeostasis and prevention of cytotoxic ER stress in ccRCC. Next, we examined
the potential sources of ER stress that could explain the enhanced requirement for PLIN2-mediated ER
homeostasis in ccRCC.
PLIN2 dependent lipid storage supports ER homeostasis during oncogene mediated activation of
protein synthesis
The observation that ccRCC cells require PLIN2 for proliferation and viability was surprising,
because 1) Plin2 knockout mice are viable (30), 2) Plin2 deficient macrophages do not exhibit enhanced
sensitivity to cholesterol loading, which requires lipid storage to alleviate ER stress (31), and 3) acute
Plin2 suppression fails to elicit cell death in steatotic hepatocytes (19, 20), MCF7 breast cancer cells, or
U87 glioblastoma cells (25). One potential advantage of lipid storage in ccRCC is the ability to derive
energy from fatty acid breakdown via β-oxidation. However, in contrast to the electron transport chain
inhibitor rotenone, PLIN2 depletion did not affect ATP levels in multiple ccRCC cell lines (Fig. S7A).
Furthermore, transcription factors that promote renal tubular cell β-oxidation, including PPARA and
PPARγ coactivator 1-alpha (PPARGC1A), were substantially downregulated in primary ccRCCs
compared to normal kidney (Fig. S2C, S7B). The Carnitine/Acyl-carnitine Transporter (CAT) and
mitochondrial β-oxidation enzymes were also underexpressed in ccRCC tissues (Fig. S7B, C). In
agreement with these findings, metabolomic analysis of primary ccRCC and normal kidney tissues
revealed elevation of acyl-carnitine levels in tumors (Table S3). These features of ccRCC mirror genetic
CAT deficiency, which manifests as acyl-carnitine build up secondary to reduced β-oxidation flux (32).
Furthermore, a recent study indicates that HIF-2α suppresses peroxisomal β-oxidation via selective
autophagy of peroxisomes (33). Thus, alterations to β-oxidation are unlikely to explain the effects of
PLIN2 depletion in ccRCC.
Next, we explored whether enhanced tumor anabolic processes, downstream of oncogenic
activation, contribute to the requirement for PLIN2 dependent lipid storage in ccRCC. Particularly,
Research. on June 19, 2018. © 2015 American Association for Cancercancerdiscovery.aacrjournals.org Downloaded from
Author manuscripts have been peer reviewed and accepted for publication but have not yet been edited. Author Manuscript Published OnlineFirst on March 31, 2015; DOI: 10.1158/2159-8290.CD-14-1507
10
increased protein and lipid synthesis via mTORC1 could result in a greater requirement for lipid storage to
maintain ER homeostasis, as the ER functions as a “hub” for both protein and lipid production. We
focused on mTORC1 because 1) 30% of ccRCC harbor activating mutations in the mTOR pathway (18),
2) most tumors exhibit elevated mTORC1 activity (p-S6K1, p4EBP1 staining) (4, 34), and 3) mTORC1
can stimulate both protein and lipid synthesis (35, 36). The effects of small molecule mTOR inhibitors on
protein and lipid synthesis were characterized in ccRCC cells. As expected (35), Torin1 was more potent
than rapamycin in suppressing protein synthesis and lipogenic enzyme gene expression in ccRCC cells
(Fig. 6A-B). In both 786-O and A498 cells, rapamycin and Torin1 treatment enhanced viability and
reduced UPR gene expression following PLIN2 depletion, with Torin1 being more potent (Fig. 6C; S8A-
B). Notably, the magnitude of restored viability upon mTOR suppression was greater than that observed
upon UPR inhibition in both 786-O and A498 cells (Fig. 5A-B, 6C; S8B). We reasoned that this was due
to amelioration of ER stress, rather than merely UPR signaling itself.
Given that Torin1 suppresses both protein and lipid synthesis, we measured the relative
contribution of these activities toward Torin1 dependent effects. Suppression of protein synthesis using
the translation inhibitor cycloheximide (CHX) restored cell viability and ameliorated ER stress in PLIN2
depleted cells (Fig. 6D-E). On the other hand, silencing of sterol regulatory element-binding proteins 1
and 2 (SREBP1/2), mediators of lipid synthesis downstream of mTORC1 (35), selectively reduced viability
in PLIN2 depleted cells (Fig. S8C-D). Consistent with an adaptive function of SREBP1/2 activation in cells
experiencing ER stress (16, 37), PLIN2 depletion induced multiple lipid synthesis enzymes in an
SREBP1/2-dependent manner (Fig. S8C-D). Ultimately, CHX treatment restored cell viability in PLIN2
depleted cells, even when SREBP1 and 2 were inhibited, reflecting the aggregate activities of Torin1 (Fig.
S8C-D). These findings suggest that protein synthesis is a prominent source of ER stress and cell death
in the setting of PLIN2 depletion.
HIF-2α dependent PLIN2 expression and lipid storage promote resistance against pharmacologic
ER stress
Given that reduction of ER protein load alleviated ER stress in PLIN2 depleted cells, we
determined if such cells would also be more sensitive to agents that increase mis-folded protein load. Of
Research. on June 19, 2018. © 2015 American Association for Cancercancerdiscovery.aacrjournals.org Downloaded from
Author manuscripts have been peer reviewed and accepted for publication but have not yet been edited. Author Manuscript Published OnlineFirst on March 31, 2015; DOI: 10.1158/2159-8290.CD-14-1507
11
note, PLIN2 depleted cells were more sensitive to tunicamycin treatment, which inhibits N-linked
glycosylation, compared to controls (Fig. 7A). We performed similar experiments to determine if HIF-
2α/PLIN2 mediated lipid storage is similarly protective against pharmacological ER stress. A498 cells
expressing HIF2A shRNA exhibited reduced BODIPY staining, whereas exogenous PLIN2 expression
was sufficient to restore neutral lipid levels (Fig. 7B). Upon treatment with tunicamycin, HIF-2α depleted
cells exhibited a 3-fold enhancement of cell death that was partially ameliorated by restoring PLIN2
dependent lipid storage (Fig. 7C). Treatment with brefeldin A, an ER stress inducing agent that inhibits
ER to golgi vesicular transport, yielded consistent results (Fig. S9A-B).
PLIN2 also protected ccRCC cells from the proteasome inhibitor Bortezomib (Fig. 7D), an FDA
approved therapy for multiple myeloma that functions partly through ER stress induction (17). Specifically,
expression of the IRE-1α substrate spliced XBP1 is positively correlated with patient response to
Bortezomib and functional studies demonstrate a role for the UPR target gene CHOP in Bortezomib-
mediated cell death (38, 39). Consistent with a cytotoxic function of ER stress in Bortezomib treated
ccRCC cells, the enhanced efficacy of Bortezomib in PLIN2 depleted cells was associated with elevated
levels of spliced XBP1 and CHOP (Fig. 7E). Furthermore, HIF-2α depleted cells demonstrated enhanced
sensitivity to Bortezomib that was ameliorated by exogenous PLIN2 (Fig. 7F). Next, we tested whether
nutrient and/or O2 deprivation—ER stress inducing conditions found within the tumor microenvironment
(13)—could further enhance Bortezomib-induced cell death. Indeed, previous work indicates that hypoxia
can enhance anti-tumor activity of Bortezomib via ER stress induction (40). Growth under conditions of
serum and/or O2 deprivation enhanced Bortezomib induced cell death, most prominently in PLIN2
depleted cells (Fig. 7G). Under each condition tested, expression of the terminal UPR gene CHOP was
also positively correlated with degree of cell death (Fig. S9C).
Collectively, we suggest a model in which HIF-2α/PLIN2 dependent lipid storage promotes ER
homeostasis and prevents cytotoxic ER stress in ccRCC cells (Fig. 7H). This phenotype promotes cell
viability under multiple conditions that perturb ER homeostasis, including growth under limited nutrient/O2
delivery within solid tumors, enhanced protein synthesis downstream of oncogenic activation, and
exposure to pharmacological ER stress inducing drugs.
Research. on June 19, 2018. © 2015 American Association for Cancercancerdiscovery.aacrjournals.org Downloaded from
Author manuscripts have been peer reviewed and accepted for publication but have not yet been edited. Author Manuscript Published OnlineFirst on March 31, 2015; DOI: 10.1158/2159-8290.CD-14-1507
12
Discussion
Despite the longstanding observation that ccRCC tumor cells exhibit abundant intracellular LDs, a
clear function for this phenotype had not been identified. In this study, we explored the role of LD coat
proteins in ccRCC progression. Analysis of multiple cohorts of primary ccRCC patient samples revealed
PLIN2 overexpression in tumor samples and suggested a functional relationship between pVHL loss,
constitutive HIF-2α activation, and PLIN2 accumulation. While previous reports indicated that PLIN2
expression and lipid storage correlated with HIF-2α activation, it was unknown whether PLIN2 was a
driver of this phenotype, or a passenger of broader metabolic changes (11). Our findings indicate that
PLIN2 is both necessary and sufficient to promote lipid storage in ccRCC cell lines. Mechanistically, HIF-
2α dependent PLIN2 expression and lipid storage is required for maintenance of ER homeostasis and
prevention of cytotoxic ER stress.
The significant requirement for PLIN2 in ccRCC cells was intriguing, as Plin2 -/- mice are viable and
acute PLIN2 depletion studies in settings of lipid accumulation (i.e. hepatosteatosis or foam cell
formation) have reported no evidence of ER stress or cell death (30, 31, 41). We provide two potential
explanations for this observation. First of all, in physiological scenarios, PPAR family members
coordinately enhance expression of PLIN2 and other PAT LD coat proteins (10). In these settings, PLIN2
loss of function is associated with compensatory upregulation of other LD coat proteins (30, 41).
However, we determined that PLIN2 is upregulated in ccRCC due to HIF-2α activation, rather than by
PPARγ or PPARα. Moreover, PLIN2 is overexpressed independently of other PAT LD coat proteins in
ccRCC, likely explaining why functional compensation cannot be achieved after PLIN2 depletion.
Secondly, our results suggest that an enhanced requirement for PLIN2 dependent lipid storage and ER
homeostasis could arise from heightened ER stress downstream of oncogene activation. These include
cell intrinsic stress from enhanced protein synthesis and cell extrinsic stress due to commitment to a
growth rate that outstrips nutrient and O2 delivery.
Our results fit within an emerging theme in which oncogenic transformation coordinately induces both
anabolic processes to increase proliferation and homeostatic pathways that maintain cell viability. These
include proteasome activity downstream of mTORC1, autophagy downstream of MYC overexpression
(42), and lipid/protein scavenging by RAS transformed tumors (43, 44). Thus, different oncogenes appear
Research. on June 19, 2018. © 2015 American Association for Cancercancerdiscovery.aacrjournals.org Downloaded from
Author manuscripts have been peer reviewed and accepted for publication but have not yet been edited. Author Manuscript Published OnlineFirst on March 31, 2015; DOI: 10.1158/2159-8290.CD-14-1507
13
to solve the problem of balancing proliferation and cellular homeostasis in unique ways. In the case of
ccRCC, we suggest a model in which HIF-2α dependent lipid storage occurs early in disease progression
and functions to buffer tumor cells against cell intrinsic and extrinsic sources of ER stress. In ccRCC, the
heightened proliferation and anabolic metabolism is driven by HIF-2α dependent processes such as
autocrine growth factor signaling via TGFα and VEGFA, mTORC1 stimulation, and cell cycle progression,
and independent oncogenic events that activate mitogenic pathways (6, 18, 45). Although enhanced lipid
storage is a hallmark feature of ccRCC, this phenotype is observed in other malignancies, including
Burkitts lymphoma, hepatocellular carcinoma, and advanced prostate cancer (46, 47). While the
underlying mechanisms of lipid storage and the function it serves may vary between cancer types,
additional studies into the role of lipid storage in cancer are warranted.
Our results indicate that heightened protein synthesis is a prominent source of ER stress in PLIN2
deficient ccRCC cells. While the initial perturbation to ER homeostasis in such cells is likely due to
alterations in ER lipid content, the cumulative level of ER stress likely arises from dysregulation of both
protein and lipid metabolism, which independently trigger the UPR (14). In addition, disruption of ER lipid
composition can further impair protein-folding capacity and enhance ER stress (48). Mechanistically,
PLIN2 promotes neutral lipid content through at least two, non-mutually exclusive, mechanisms:
enhancing lipid storage and suppressing lipolysis. Our observation that oleic acid is selectively toxic to
PLIN2 depleted cells suggests that at least a portion of the PLIN2 deficient phenotype arises from loss of
the ability to package lipids into LDs. This phenotype is also observed in mouse embryonic fibroblasts
that are deficient in enzymes (diacylglyceride-acyltransferases, DGATs) that are required to incorporate
oleic acid into triglycerides (26). However, it remains to be tested how PLIN2 affects lipolysis in ccRCC.
Additionally, future studies that characterize the specific changes in ER lipid composition following PLIN2
depletion may provide additional strategies to enhance tumor cell ER stress.
Lastly, our finding that loss of HIF-2α/PLIN2 dependent lipid storage enhances sensitivity to ER stress
inducing agents has implications for ccRCC therapy. A therapeutic index has previously been
demonstrated for the proteasome inhibitor Bortezomib in multiple myeloma, where heightened
immunoglobulin synthesis within ER renders cells more sensitive to pharmacological ER stress (17). A
small phase II clinical trial evaluating Bortezomib mono-therapy for advanced renal cancer revealed
Research. on June 19, 2018. © 2015 American Association for Cancercancerdiscovery.aacrjournals.org Downloaded from
Author manuscripts have been peer reviewed and accepted for publication but have not yet been edited. Author Manuscript Published OnlineFirst on March 31, 2015; DOI: 10.1158/2159-8290.CD-14-1507
14
partial responses in only 12% (3/25) of ccRCC patients (49). HIF-2α/PLIN2 dependent lipid storage and
ER stress resistance could contribute to this limited response rate. Specifically, our observation that
multiple components of the ERAD machinery (HERP, HRD1, ERdj4) were induced in HIF-2α depleted
tumors provides initial evidence for the rational combination of proteasome inhibitors and HIF-2α
suppression, especially as HIF-2α specific inhibitors are currently under development for treatment of
ccRCC (Clinical Trial No. NCT02293980).
Research. on June 19, 2018. © 2015 American Association for Cancercancerdiscovery.aacrjournals.org Downloaded from
Author manuscripts have been peer reviewed and accepted for publication but have not yet been edited. Author Manuscript Published OnlineFirst on March 31, 2015; DOI: 10.1158/2159-8290.CD-14-1507
15
Methods
Primary patient samples
Fresh frozen ccRCC or matched normal kidney patient samples were obtained from the
Cooperative Human Tissue Network (CHTN). Samples were de-identified and handled in accordance with
institutional review boards.
Cell Culture and viability assays
Authenticated (short tandem repeat profiling) human ccRCC cell lines 786-O, A498, and RCC4
were obtained from the American Type Culture Collection in 2001. Cells were cultured for a maximum of
four weeks before thawing fresh, early passage cells. All cells were confirmed to be mycoplasma negative
(MycoAlert, tested June 2014) and verified for pVHL and HIFα expression status using western blot
analysis. Cells were cultured in Dulbecco’s Modified Eagle Medium (DMEM) + 10% FBS. Cell viability
was determined using the FITC-Annexin V, PI kit (Cat 556547) from BD Biosciences according to the
manufacturer’s instructions. Flow cytometry was performed using the BD Accuri C6 instrument and
double negative cells were deemed viable.
3D spheroid cultures were generated using the liquid overlay technique. 24 well plates were
coated with 1% agarose in DMEM prior to plating 100,000 cells per well in DMEM + 10% FBS. To
promote spheroid formation, plates were swirled prior to incubation. Media was changed every 3 days
and spheroids were harvested after 9 days. Hypoxic cells were labeled by incubating spheroids with
200μM FITC-conjugated pimonidazole hydrochloride (Hypoxyprobe, Cat HP2) prior to fixation. For
BODIPY 493/503 quantification, spheroids were dissociated with Accutase at 37°C for 30 minutes and
stained as described below in “BODIPY staining”.
Reagents
Oleic Acid (Cat O3008), rapamycin (Cat R8781), tunicamycin (Cat T7765), and brefeldin A (Cat
B7651) were purchased from Sigma Aldrich. GSK2656157 PERK inhibitor (Cat 5046510001), 4μ8C IRE-
1α inhibitor (Cat 412512), Torin1 (Cat 475991), and cycloheximide (Cat 239763) were purchased from
Millipore. siRNA pools targeting human ATF6 (Cat L-009917), SREBF1 (Cat L-006891), and SREBF2
(Cat L-009549) were purchased from Dharmacon. Rotenone (Cat 557368) was purchased from EMD
Chemicals. Bortezomib was purchased from Cell Signaling Technologies (Cat 2204S).
Research. on June 19, 2018. © 2015 American Association for Cancercancerdiscovery.aacrjournals.org Downloaded from
Author manuscripts have been peer reviewed and accepted for publication but have not yet been edited. Author Manuscript Published OnlineFirst on March 31, 2015; DOI: 10.1158/2159-8290.CD-14-1507
16
Plasmids, lentivirus production, and viral transduction
The lentiviral vector PLKO.1 SCR (Plasmid No. 17920) was obtained from Addgene. pLKO.1
vectors expressing shHIF1A_9 (TRCN0000003809), shHIF2A_6 (TRCN0000003806), shHIFA_7
(TRCN0000003807), shPLIN2_1 (TRCN0000136605), shPLIN2_2 (TRCN0000136481), shPPARG_2
(TRCN0000001672), and shPPARG_3 (TRCN0000001673) were obtained from the Broad Institute TRC
shRNA library. The GIPZ vector expressing shHIF1A_52 (V3LMM_441752) was obtained from
Dharmacon. PLIN2 open reading frame was sub-cloned from MGC sequence verified cDNA (Dharmacon,
Clone ID: 3844174) into the PCDH-CMV-MCS-EF1-HYGRO mammalian expression vector. The
Doxycycline inducible shHIF2A_7 construct was generated using the “Tet-pLKO-puro” plasmid (Addgene
Cat 21915).
Lentivirus was produced by transfecting 293T cells with the indicated expression plasmid, pRSV-
Rev, pMDL, and pCMV-VSV-G plasmids using Fugene6 (Promega). Virus was harvested 48 hours after
transfection. For viral infection, cells were incubated with medium containing virus and 8μg/ml polybrene
for 16 hours. Cells were allowed to recover for 48 hours before antibiotic selection, and surviving pools
were utilized for downstream analyses.
Xenografts
Sub-cutaneous xenograft experiments were approved by the Animal Care and Use Committee at
the University of Pennsylvania. NIH-III nude mice (Charles River, 4-6 weeks old) were injected in each
flank with five million cells in a 1:1 mixture of PBS and Matrigel (BD 356234). Tumor volume was
monitored by caliper measurements. After tumors reached 300mm3, mice were split into cohorts receiving
standard chow or Doxycycline chow (625 mg/kg, Harlan Labs Cat TD05125) ad libitum. After 11 days on
the indicated chow, animals were sacrificed by CO2 inhalation and xenograft tumors were dissected for
downstream analyses.
TCGA RNA-seq analysis
Level 3 RNA-seq data for 480 ccRCC and 69 normal kidney samples was downloaded from the
TCGA on April 2, 2013. Differential gene expression analysis of tumor and normal samples was
performed using DeSeq (Bioconductor Version 2.12). Box and whisker plots correspond to 1-99th
percentiles (bars), 25-75th percentiles (box), and median (line in box). Differentially expressed genes
Research. on June 19, 2018. © 2015 American Association for Cancercancerdiscovery.aacrjournals.org Downloaded from
Author manuscripts have been peer reviewed and accepted for publication but have not yet been edited. Author Manuscript Published OnlineFirst on March 31, 2015; DOI: 10.1158/2159-8290.CD-14-1507
17
were subjected to gene set enrichment analysis (GSEA) using the Broad Institute Molecular Signature
Database.
Microarray analyses
Classification of primary ccRCC samples into VHL WT, H1H2, and H2 sub-groups and microarray
analysis is described in Gordan et al (4). Expression data is deposited at the NCBI Gene Expression
Omnibus (GEO) under GSE11904. Expression analysis comparing normal kidney, ccRCC, papillary RCC,
and chromophobe RCC was described in Jones et al (23). Data was downloaded from GEO (GSE15641).
Tissue staining and imaging
For frozen patient samples, OCT embedded tissue was cut to 10μm sections and fixed in 4%
paraformaldehyde (PFA) prior to staining. For xenograft tumors, samples were fixed in 4% PFA,
equilibrated in 30% w/v sucrose, and embedded in OCT. 10μm sections were cut for staining. H&E
staining was performed as previously described (4).
Oil Red O: A working oil red O solution was generated by diluting a 3.5mg/ml stock (in 100%
isopropanol) 6:4 with distilled water. This solution was incubated at room temperature for 30 minutes and
filtered in Whatman paper before use. Tissue sections were incubated in 60% isopropanol for 5 minutes,
dried at room temperature, and incubated in oil red O staining solution for 1 hour at room temperature.
Slides were rinsed in distilled water and counterstained with hematoxylin prior to mounting in Prolong
Gold Antifade with DAPI (Life Technologies, Cat P36935).
Immunohistochemistry: Slides were treated in 1% hydrogen peroxide for 30 minutes and blocked
in 2% normal goat serum and 4% BSA in Tris buffer with Tween 20. Avidin/Biotin blocking was performed
and sections were incubated with primary antibodies overnight at 4°C. Ki67 antibody was used at 1:100
(BD, Cat 550609). Cleaved caspase 3 (Asp175) antibody was used at 1:400 (Cell Signaling, Cat 9661).
Slides were incubated in 1:200 dilutions of biotinylated goat anti-mouse (Vector Labs, Cat BA-9200) or
anti-rabbit (Vector Labs, Cat BA-1000) secondary antibodies for 1 hour at room temperature. Sections
were then processed using the Vectastain Elite ABC kit (Vector Labs, PK-6100) and DAB peroxidase
substrate kit (Vector Labs, Cat SK-4100), dehydrated in a standard ethanol/xylenes series, and mounted
in 75% v/v Permount (Fischer, Cat SP15-500) in xylenes.
Research. on June 19, 2018. © 2015 American Association for Cancercancerdiscovery.aacrjournals.org Downloaded from
Author manuscripts have been peer reviewed and accepted for publication but have not yet been edited. Author Manuscript Published OnlineFirst on March 31, 2015; DOI: 10.1158/2159-8290.CD-14-1507
18
Immunofluorescence: Slides were incubated in 50mM ammonium chloride for 10 minutes,
permeabilized with 0.25% Triton X-100 for 10 minutes, and blocked in 2% normal goat serum and 4%
BSA for 1 hour. Slides were incubated with cleaved caspase 3 (Asp175) antibody at 1:400 (Cell
Signaling, Cat 9661) overnight at 4°C. Secondary Alexa Flour 488 goat anti-rabbit (Life technologies, Cat
A-11008) was used at 1:200 for 1 hour at room temperature. Slides were mounted in Prolong Gold
Antifade with DAPI before imaging.
RNA reverse transcription and quantitative RT-PCR analysis
Total RNA was isolated using the RNAeasy purification kit (Qiagen). cDNA was synthesized
using the Applied Biosystems High Capacity RNA-to-cDNA master mix. qRT-PCR was performed on a
ViiA7 Real Time PCR systems from Applied Biosystems. Pre-designed Taqman primers were obtained
from Life Technologies for the following genes: TBP (HS01060665_G1), ACTB (HS01060665_G1),
VEGFA (HS00900055_M1), PLIN2 (HS00605340_M1), HIF2A/EPAS1 (HS01026149_M1), HIF1A
(HS00153153_M1), TGFA (HS00608187_M1), PDK1 (HS01561850_M1), PLIN3 (HS00998416_M1),
BiP/HSPA5 (HS00946084_G1), XBP1(spliced) (HS03929085_G1), CHOP/DDIT3 (HS00358796_G1),
ERO1A/ERO1L (HS00205880_M1), HERP/HERPUD1 (HS01124269_M1), EDEM1 (HS00976004_M1),
ERdj4/DNAJB9 (HS01052402_M1), and HRD1/SVN1 (HS00381211_M1), and ATF6 (HS00232586_M1).
SYBR-green primers were utilized for human ATF3 (Forward: TAGGCTGGAAGAGCCAAAGA, Reverse:
TTCTCACAGCTGCAAACACC).
BODIPY 493/503 and ER tracker staining
BODIPY 493/503 (Cat D3922) was purchased from Life Technologies. Live cells were washed
twice in PBS and incubated in 2μg/ml BODIPY in PBS for 15 minutes at 37°C. After staining, cells were
washed twice in PBS and fixed in 2% PFA for 15 minutes. Fixed cells were washed and re-suspended in
PBS, passed through a cell strainer, and analyzed on an Accuri C6 flow cytometer under FL-1. ER-
Tracker Red (Cat E34250) was purchased from Life Technologies. Live cells were incubated with 1μM
ER Tracker on DMEM with 10% FBS for 30 minutes. Cells were washed twice in PBS, re-suspended in
PBS with 5% serum, passed through a cell strainer, and analyzed on an Accuri C6 flow cytometer under
FL-3. Data analysis was performed using FlowJo software.
Transmission electron microscopy
Research. on June 19, 2018. © 2015 American Association for Cancercancerdiscovery.aacrjournals.org Downloaded from
Author manuscripts have been peer reviewed and accepted for publication but have not yet been edited. Author Manuscript Published OnlineFirst on March 31, 2015; DOI: 10.1158/2159-8290.CD-14-1507
19
Cells were fixed with 2.5% glutaraldehyde, 2.0% paraformaldehyde in 0.1M sodium cacodylate
buffer, pH7.4, overnight at 4°C. After subsequent buffer washes, the samples were post-fixed in 2.0%
osmium tetroxide for 1 hour at room temperature, and then washed again in buffer followed by distilled
water. After dehydration through a graded ethanol series, the tissue was infiltrated and embedded in
EMbed-812 (Electron Microscopy Sciences, Fort Washington, PA). Thin sections were stained with uranyl
acetate and lead citrate and examined with a JEOL 1010 electron microscope fitted with a Hamamatsu
digital camera and AMT Advantage image capture software.
PPRE reporter assay
The PPRE X3-TK-luc plasmid was purchased from Addgene (No. 1015). 30,000 cells were
seeded into 24 well plates and transfected with 1μg of PPRE X3-TK-luc and 100ng of Renilla luciferase
plasmids using Fugene 6 (Promega). Luciferase activity was measured two days after transfection using
the Dual Luciferase assay kit (Promega).
ATP measurement
ATP luminescence assay system (Cat 6016941) was purchased from Perkin Elmer. 100,000 cells
were plated into each well of an opaque 96 well plate and analyzed as described by the manufacturer.
Western blot analysis
Cells were lysed in lysis buffer (40mM HEPES, 2mM EDTA, 10mM pyrophosphate, 10mM
glycerophosphate, 1% Triton X-100) containing Roche complete ultra protease/phosphatase inhibitor (Cat
05892791001). Nuclear and cytoplasmic fractionation was performed using the Thermo Scientific NE-
PER kit (Cat PI-78833). Isolated proteins were resolved by SDS-PAGE and western blot analysis was
performed. All primary antibodies were diluted at 1:1000 in 5% w/v non-fat milk, unless otherwise noted.
Blots were incubated with primary antibodies overnight at 4°C. HIF-2α (Cat NB100-122) and phospho-
serine 724 IRE-1a (Cat NB-100-2323) were purchased from Novus Biologicals. HIF-1α antibody (Cat
610958) was purchased from BD Biosciences. PLIN2 antibody (Cat ab78920) was purchased from
Abcam. β-Actin (1:4000, Cat SC-47778), ATF6 (Cat SC-22799), and ATF4 (1:2000, Cat SC-200)
antibodies were purchased from Santa Cruz Biotechnology. Cleaved caspase 3 (Cat 9661), PERK
(1:4000, Cat 3192), IRE1a (Cat 3294), phospho-threonine 389 S6K1 (Cat 9234), S6K1 (Cat 2708),
phosphor-serine 65 4E-BP1 (Cat 9451), 4E-BP1 (Cat 9452), FASN (Cat 3180), ACC (Cat 3696), HDAC1
Research. on June 19, 2018. © 2015 American Association for Cancercancerdiscovery.aacrjournals.org Downloaded from
Author manuscripts have been peer reviewed and accepted for publication but have not yet been edited. Author Manuscript Published OnlineFirst on March 31, 2015; DOI: 10.1158/2159-8290.CD-14-1507
20
(1:4000, Cat 5365), and PPARG (Cat 2435) antibodies were purchased from Cell Signaling Technology.
Rabbit polyclonal phospho-threonine 980 PERK antibody was a gift from Dr. Alan Diehl. Primary
antibodies were detected using horseradish peroxidase conjugated secondary antibodies (Cell Signaling
Technologies) followed by exposure to ECL (Pierce).
Protein synthesis measurement
Protein synthesis was measured as described (50). Briefly, cells were pulsed with puromycin (30
min, 10μg/ml) and chased in puromycin free media (1 hr). Whole cell lysates were subjected to western
blot analysis using anti-puromycin antibody (Millipore, Cat MABE343) at 1:20,000.
Metabolomics analysis
Mass spectrometry based metabolomics analysis was performed in conjunction with Metabolon,
as previously described (7).
Research. on June 19, 2018. © 2015 American Association for Cancercancerdiscovery.aacrjournals.org Downloaded from
Author manuscripts have been peer reviewed and accepted for publication but have not yet been edited. Author Manuscript Published OnlineFirst on March 31, 2015; DOI: 10.1158/2159-8290.CD-14-1507

21
Acknowledgements
The authors thank John Tobias, Ph.D for bioinformatics analyses, Ray Meade for assistance in TEM, and
Hongwei Yu for histologic preparations. This work was supported by the Howard Hughes Medical
Institute, NIH grant 2-P01-CA104838 to M.C.S, and NIH fellowship 5-F30-CA177106 to B.Q.
Research. on June 19, 2018. © 2015 American Association for Cancercancerdiscovery.aacrjournals.org Downloaded from
Author manuscripts have been peer reviewed and accepted for publication but have not yet been edited. Author Manuscript Published OnlineFirst on March 31, 2015; DOI: 10.1158/2159-8290.CD-14-1507
22
References
1. Shen C, Kaelin WG, Jr. The VHL/HIF axis in clear cell renal carcinoma. Seminars in cancer biology.
2013;23:18-25.
2. Keith B, Johnson RS, Simon MC. HIF1alpha and HIF2alpha: sibling rivalry in hypoxic tumour growth
and progression. Nature reviews Cancer. 2012;12:9-22.
3. Shen C, Beroukhim R, Schumacher SE, Zhou J, Chang M, Signoretti S, et al. Genetic and functional
studies implicate HIF1alpha as a 14q kidney cancer suppressor gene. Cancer discovery. 2011;1:222-35.
4. Gordan JD, Lal P, Dondeti VR, Letrero R, Parekh KN, Oquendo CE, et al. HIF-alpha effects on c-Myc
distinguish two subtypes of sporadic VHL-deficient clear cell renal carcinoma. Cancer cell. 2008;14:435-
46.
5. Purdue MP, Johansson M, Zelenika D, Toro JR, Scelo G, Moore LE, et al. Genome-wide association
study of renal cell carcinoma identifies two susceptibility loci on 2p21 and 11q13.3. Nature genetics.
2011;43:60-5.
6. Schodel J, Bardella C, Sciesielski LK, Brown JM, Pugh CW, Buckle V, et al. Common genetic variants
at the 11q13.3 renal cancer susceptibility locus influence binding of HIF to an enhancer of cyclin D1
expression. Nature genetics. 2012;44:420-5, S1-2.
7. Li B, Qiu B, Lee DS, Walton ZE, Ochocki JD, Mathew LK, et al. Fructose-1,6-bisphosphatase opposes
renal carcinoma progression. Nature. 2014;513:251-5.
8. Walther TC, Farese RV, Jr. Lipid droplets and cellular lipid metabolism. Annual review of biochemistry.
2012;81:687-714.
9. Wilfling F, Wang H, Haas JT, Krahmer N, Gould TJ, Uchida A, et al. Triacylglycerol synthesis enzymes
mediate lipid droplet growth by relocalizing from the ER to lipid droplets. Developmental cell.
2013;24:384-99.
10. Greenberg AS, Coleman RA, Kraemer FB, McManaman JL, Obin MS, Puri V, et al. The role of lipid
droplets in metabolic disease in rodents and humans. The Journal of clinical investigation.
2011;121:2102-10.
11. Rankin EB, Rha J, Selak MA, Unger TL, Keith B, Liu Q, et al. Hypoxia-inducible factor 2 regulates
hepatic lipid metabolism. Molecular and cellular biology. 2009;29:4527-38.
Research. on June 19, 2018. © 2015 American Association for Cancercancerdiscovery.aacrjournals.org Downloaded from
Author manuscripts have been peer reviewed and accepted for publication but have not yet been edited. Author Manuscript Published OnlineFirst on March 31, 2015; DOI: 10.1158/2159-8290.CD-14-1507
23
12. Hu CJ, Wang LY, Chodosh LA, Keith B, Simon MC. Differential roles of hypoxia-inducible factor
1alpha (HIF-1alpha) and HIF-2alpha in hypoxic gene regulation. Molecular and cellular biology.
2003;23:9361-74.
13. Young RM, Ackerman D, Quinn ZL, Mancuso A, Gruber M, Liu L, et al. Dysregulated mTORC1
renders cells critically dependent on desaturated lipids for survival under tumor-like stress. Genes &
development. 2013;27:1115-31.
14. Ackerman D, Simon MC. Hypoxia, lipids, and cancer: surviving the harsh tumor microenvironment.
Trends in cell biology. 2014;24:472-8.
15. Volmer R, van der Ploeg K, Ron D. Membrane lipid saturation activates endoplasmic reticulum
unfolded protein response transducers through their transmembrane domains. Proceedings of the
National Academy of Sciences of the United States of America. 2013;110:4628-33.
16. Walter P, Ron D. The unfolded protein response: from stress pathway to homeostatic regulation.
Science. 2011;334:1081-6.
17. Obeng EA, Carlson LM, Gutman DM, Harrington WJ, Jr., Lee KP, Boise LH. Proteasome inhibitors
induce a terminal unfolded protein response in multiple myeloma cells. Blood. 2006;107:4907-16.
18. Cancer Genome Atlas Research N. Comprehensive molecular characterization of clear cell renal cell
carcinoma. Nature. 2013;499:43-9.
19. Sun Z, Miller RA, Patel RT, Chen J, Dhir R, Wang H, et al. Hepatic Hdac3 promotes gluconeogenesis
by repressing lipid synthesis and sequestration. Nature medicine. 2012;18:934-42.
20. Imai Y, Boyle S, Varela GM, Caron E, Yin X, Dhir R, et al. Effects of perilipin 2 antisense
oligonucleotide treatment on hepatic lipid metabolism and gene expression. Physiological genomics.
2012;44:1125-31.
21. Imamura M, Inoguchi T, Ikuyama S, Taniguchi S, Kobayashi K, Nakashima N, et al. ADRP stimulates
lipid accumulation and lipid droplet formation in murine fibroblasts. American journal of physiology
Endocrinology and metabolism. 2002;283:E775-83.
22. Kim WY, Safran M, Buckley MR, Ebert BL, Glickman J, Bosenberg M, et al. Failure to prolyl
hydroxylate hypoxia-inducible factor alpha phenocopies VHL inactivation in vivo. The EMBO journal.
2006;25:4650-62.
Research. on June 19, 2018. © 2015 American Association for Cancercancerdiscovery.aacrjournals.org Downloaded from
Author manuscripts have been peer reviewed and accepted for publication but have not yet been edited. Author Manuscript Published OnlineFirst on March 31, 2015; DOI: 10.1158/2159-8290.CD-14-1507
24
23. Jones J, Otu H, Spentzos D, Kolia S, Inan M, Beecken WD, et al. Gene signatures of progression and
metastasis in renal cell cancer. Clinical cancer research : an official journal of the American Association
for Cancer Research. 2005;11:5730-9.
24. Inoue K, Kawahito Y, Tsubouchi Y, Kohno M, Yoshimura R, Yoshikawa T, et al. Expression of
peroxisome proliferator-activated receptor gamma in renal cell carcinoma and growth inhibition by its
agonists. Biochemical and biophysical research communications. 2001;287:727-32.
25. Bensaad K, Favaro E, Lewis CA, Peck B, Lord S, Collins JM, et al. Fatty Acid Uptake and Lipid
Storage Induced by HIF-1alpha Contribute to Cell Growth and Survival after Hypoxia-Reoxygenation. Cell
reports. 2014;9:349-65.
26. Listenberger LL, Han X, Lewis SE, Cases S, Farese RV, Jr., Ory DS, et al. Triglyceride accumulation
protects against fatty acid-induced lipotoxicity. Proceedings of the National Academy of Sciences of the
United States of America. 2003;100:3077-82.
27. Oslowski CM, Urano F. Measuring ER stress and the unfolded protein response using mammalian
tissue culture system. Methods in enzymology. 2011;490:71-92.
28. Atkins C, Liu Q, Minthorn E, Zhang SY, Figueroa DJ, Moss K, et al. Characterization of a novel PERK
kinase inhibitor with antitumor and antiangiogenic activity. Cancer research. 2013;73:1993-2002.
29. Cross BC, Bond PJ, Sadowski PG, Jha BK, Zak J, Goodman JM, et al. The molecular basis for
selective inhibition of unconventional mRNA splicing by an IRE1-binding small molecule. Proceedings of
the National Academy of Sciences of the United States of America. 2012;109:E869-78.
30. Chang BH, Li L, Paul A, Taniguchi S, Nannegari V, Heird WC, et al. Protection against fatty liver but
normal adipogenesis in mice lacking adipose differentiation-related protein. Molecular and cellular
biology. 2006;26:1063-76.
31. Son SH, Goo YH, Chang BH, Paul A. Perilipin 2 (PLIN2)-deficiency does not increase cholesterol-
induced toxicity in macrophages. PloS one. 2012;7:e33063.
32. Roschinger W, Muntau AC, Duran M, Dorland L, L IJ, Wanders RJ, et al. Carnitine-acylcarnitine
translocase deficiency: metabolic consequences of an impaired mitochondrial carnitine cycle. Clinica
chimica acta; international journal of clinical chemistry. 2000;298:55-68.
Research. on June 19, 2018. © 2015 American Association for Cancercancerdiscovery.aacrjournals.org Downloaded from
Author manuscripts have been peer reviewed and accepted for publication but have not yet been edited. Author Manuscript Published OnlineFirst on March 31, 2015; DOI: 10.1158/2159-8290.CD-14-1507
25
33. Walter KM, Schonenberger MJ, Trotzmuller M, Horn M, Elsasser HP, Moser AB, et al. Hif-2alpha
promotes degradation of Mammalian peroxisomes by selective autophagy. Cell metabolism.
2014;20:882-97.
34. Haddad AQ, Kapur P, Singla N, Raman JD, Then MT, Nuhn P, et al. Validation of mammalian target
of rapamycin biomarker panel in patients with clear cell renal cell carcinoma. Cancer. 2015;121:43-50.
35. Peterson TR, Sengupta SS, Harris TE, Carmack AE, Kang SA, Balderas E, et al. mTOR complex 1
regulates lipin 1 localization to control the SREBP pathway. Cell. 2011;146:408-20.
36. Duvel K, Yecies JL, Menon S, Raman P, Lipovsky AI, Souza AL, et al. Activation of a metabolic gene
regulatory network downstream of mTOR complex 1. Molecular cell. 2010;39:171-83.
37. Kammoun HL, Chabanon H, Hainault I, Luquet S, Magnan C, Koike T, et al. GRP78 expression
inhibits insulin and ER stress-induced SREBP-1c activation and reduces hepatic steatosis in mice. The
Journal of clinical investigation. 2009;119:1201-15.
38. Ling SC, Lau EK, Al-Shabeeb A, Nikolic A, Catalano A, Iland H, et al. Response of myeloma to the
proteasome inhibitor bortezomib is correlated with the unfolded protein response regulator XBP-1.
Haematologica. 2012;97:64-72.
39. Kawabata S, Gills JJ, Mercado-Matos JR, Lopiccolo J, Wilson W, 3rd, Hollander MC, et al. Synergistic
effects of nelfinavir and bortezomib on proteotoxic death of NSCLC and multiple myeloma cells. Cell
death & disease. 2012;3:e353.
40. Fels DR, Ye J, Segan AT, Kridel SJ, Spiotto M, Olson M, et al. Preferential cytotoxicity of bortezomib
toward hypoxic tumor cells via overactivation of endoplasmic reticulum stress pathways. Cancer research.
2008;68:9323-30.
41. Sztalryd C, Bell M, Lu X, Mertz P, Hickenbottom S, Chang BH, et al. Functional compensation for
adipose differentiation-related protein (ADFP) by Tip47 in an ADFP null embryonic cell line. The Journal
of biological chemistry. 2006;281:34341-8.
42. Hart LS, Cunningham JT, Datta T, Dey S, Tameire F, Lehman SL, et al. ER stress-mediated
autophagy promotes Myc-dependent transformation and tumor growth. The Journal of clinical
investigation. 2012;122:4621-34.
Research. on June 19, 2018. © 2015 American Association for Cancercancerdiscovery.aacrjournals.org Downloaded from
Author manuscripts have been peer reviewed and accepted for publication but have not yet been edited. Author Manuscript Published OnlineFirst on March 31, 2015; DOI: 10.1158/2159-8290.CD-14-1507
26
43. Commisso C, Davidson SM, Soydaner-Azeloglu RG, Parker SJ, Kamphorst JJ, Hackett S, et al.
Macropinocytosis of protein is an amino acid supply route in Ras-transformed cells. Nature.
2013;497:633-7.
44. Kamphorst JJ, Cross JR, Fan J, de Stanchina E, Mathew R, White EP, et al. Hypoxic and Ras-
transformed cells support growth by scavenging unsaturated fatty acids from lysophospholipids.
Proceedings of the National Academy of Sciences of the United States of America. 2013;110:8882-7.
45. Elorza A, Soro-Arnaiz I, Melendez-Rodriguez F, Rodriguez-Vaello V, Marsboom G, de Carcer G, et al.
HIF2alpha acts as an mTORC1 activator through the amino acid carrier SLC7A5. Molecular cell.
2012;48:681-91.
46. Yue S, Li J, Lee SY, Lee HJ, Shao T, Song B, et al. Cholesteryl ester accumulation induced by PTEN
loss and PI3K/AKT activation underlies human prostate cancer aggressiveness. Cell metabolism.
2014;19:393-406.
47. Bozza PT, Viola JP. Lipid droplets in inflammation and cancer. Prostaglandins, leukotrienes, and
essential fatty acids. 2010;82:243-50.
48. Fu S, Yang L, Li P, Hofmann O, Dicker L, Hide W, et al. Aberrant lipid metabolism disrupts calcium
homeostasis causing liver endoplasmic reticulum stress in obesity. Nature. 2011;473:528-31.
49. Kondagunta GV, Drucker B, Schwartz L, Bacik J, Marion S, Russo P, et al. Phase II trial of
bortezomib for patients with advanced renal cell carcinoma. Journal of clinical oncology : official journal of
the American Society of Clinical Oncology. 2004;22:3720-5.
50. Schmidt EK, Clavarino G, Ceppi M, Pierre P. SUnSET, a nonradioactive method to monitor protein
synthesis. Nature methods. 2009;6:275-7.
Research. on June 19, 2018. © 2015 American Association for Cancercancerdiscovery.aacrjournals.org Downloaded from
Author manuscripts have been peer reviewed and accepted for publication but have not yet been edited. Author Manuscript Published OnlineFirst on March 31, 2015; DOI: 10.1158/2159-8290.CD-14-1507
1
Figure Legends
Figure 1: HIF-2α promotes expression of the lipid droplet coat protein PLIN2 in ccRCC.
A) Oil red O staining of matched primary ccRCC and normal kidney samples. Scale bar = 50 μm.
B) Normalized RNA-seq reads of PLIN2 in ccRCC (n=480) and normal kidney (n=69) samples.
Tumors were also analyzed for PLIN2 expression according to tumor stage. RNA-seq data was
obtained from The Cancer Genome Atlas (TCGA), and p-values determined by DEseq. Whiskers
denote the 1st and 99
th percentiles.
C) Quantitative RT-PCR (qRT-PCR) analysis of VEGFA and PLIN2 in matched ccRCC (n=10) and
normal kidney (n=10) samples obtained from the Cooperative Human Tissue Network (CHTN).
Whiskers denote the 1st and 99
th percentiles.
D) Microarray analysis of primary ccRCC samples that have been previously classified by VHL
genotyping and HIF-α immunohistochemical staining to reveal 3 sub-types: VHL WT (no HIF-1α
or HIF-2α staining and confirmed WT sequence at VHL locus, n=5), H1H2 (HIF-1α and HIF-2α
staining, n=8), and H2 (HIF-2α staining only, n=8). Expression of PLIN2 and multiple known HIF-
2α target genes in ccRCC are shown. PLIN2 mRNA was elevated in both H1H2 (9.7 fold
overexpression, p=2.6E-4) and H2 (16.7 fold overexpression, p=2.5E-6) tumors compared to VHL
WT samples. p-values determined by ANOVA.
E) 786-O (H2) ccRCC cells were transduced with two independent shRNAs against HIF2A
(shHIF2A_6 and 7) or a SCR control. qRT-PCR and western blot analysis of PLIN2 are shown.
TGFA is included as a positive control for HIF-2α suppression.
F) RCC4 (H1H2) ccRCC cells were transduced with two independent shRNAs against HIF-1α
(shHIF1A_9 and 52), HIF-2α (shHIF2A_6 and 7), or a SCR control. qRT-PCR and western blot
for PLIN2 is shown. TGFA and PDK1 are included as positive controls for HIF-2α and HIF-1α
suppression, respectively. Data are representative of three independent experiments. Unless
otherwise noted, p-values were determined by student’s t-test. * p<0.05, ** p<0.01, *** p<0.001.
For qRT-PCR, TBP and ACTB were utilized as endogenous control genes and relative mRNA
expression was determined by normalizing to expression in SCR samples. Error bars denote
standard error of the mean (SEM).
Research. on June 19, 2018. © 2015 American Association for Cancercancerdiscovery.aacrjournals.org Downloaded from
Author manuscripts have been peer reviewed and accepted for publication but have not yet been edited. Author Manuscript Published OnlineFirst on March 31, 2015; DOI: 10.1158/2159-8290.CD-14-1507
2
Figure 2: HIF-2α dependent PLIN2 expression and lipid storage promotes xenograft tumor growth.
A) Sub-cutaneous tumors of 786-O cells expressing Dox-inducible shHIF2A_7, along with either
empty vector or exogenous PLIN2, were generated in NIH-III nude mice. Once tumor volume
reached 300mm3, a cohort received Dox-chow (625 mg/kg). Relative tumor volume was
monitored until 11 days of Dox treatment (left). Tumor weights at harvest were determined
(center), and qRT-PCR analysis for HIF-2α, TGFA, and PLIN2 was performed (right). EV Veh,
n=4; EV Dox, n=5; PLIN2 Veh n=6; PLIN2 Dox, n=9. For qRT-PCR, TBP and ACTB were utilized
as endogenous control genes and relative mRNA expression was determined by normalizing to
expression in EV Veh samples.
B) Histological analysis of tumors is shown. The indicated stains were performed on sections
obtained from tumors described in (A). Scale bars: 50x=400μm, 100x=200μm, 200x=100μm,
400x=50μm.
C) Oil red O area per field was determined using Image J. Percentage of cells per field that exhibited
nuclear Ki67 or cleaved caspase 3 expression is shown. For each graph, 30 fields per tumor type
were quantified. p-values were determined by two-way ANOVA with Bonferroni correction. *
p<0.05, ** p<0.01, *** p<0.001. Error bars denote SEM.
Figure 3: PLIN2 is required for lipid storage and cell viability.
A) 786-O ccRCC cells were transduced with two independent shRNAs against PLIN2 (shPLIN2_1,
shPLIN2_2) or a SCR control. qRT-PCR and western blot analysis were performed on day 3 post
shRNA transduction to assess for PLIN2 suppression. For qRT-PCR, TBP and ACTB were
utilized as endogenous control genes and relative mRNA expression was determined by
normalizing to expression in SCR samples. p-values were determined by student’s t-test. ***
p<0.001.
B) Growth curves for cells described in (A). Day 1 of growth curve corresponds to day 3 post
transduction.
C) Oil Red O staining of cells described in (A) was performed on day 3 post transduction. Scale bar
Research. on June 19, 2018. © 2015 American Association for Cancercancerdiscovery.aacrjournals.org Downloaded from
Author manuscripts have been peer reviewed and accepted for publication but have not yet been edited. Author Manuscript Published OnlineFirst on March 31, 2015; DOI: 10.1158/2159-8290.CD-14-1507
3
= 50μm.
D) Live cells described in (A) were stained with BODIPY 493/503 (2μg/ml) and fluorescence was
measured by flow cytometry. A histogram of BODIPY 493/503 fluorescence is shown.
E) Beginning on day 3 post transduction, cells from (A) were treated with BSA alone or BSA
conjugated with oleic acid (30μM). Viability was determined by annexin/PI staining after 24 hours
of treatment. Data are representative of three independent experiments. p-values were
determined by two-way ANOVA with Bonferroni correction. Asterisks denote comparison with
SCR BSA. *** p<0.001. Pound signs denote comparison of Oleic Acid with BSA treated
conditions within each cell line. # p<0.05, ## p<0.01. Error bars denote SEM.
Figure 4: PLIN2 dependent lipid storage promotes ER homeostasis in ccRCC
A) Western blot for UPR sensors was performed in 786-O cells expressing independent shRNAs
against PLIN2 (shPLIN2_1, shPLIN2_2) or a SCR control (left, day 3 post transduction).
Corresponding qRT-PCR analysis of UPR target genes is shown (right, day 4 post transduction).
Data are representative of three independent experiments. p-values were determined by
student’s t-test.
B) ER Tracker Red (500 nM) staining of live cells described in (A) was performed (day 4 post
transduction). Representative images (left) and quantification of ER Tracker fluorescence are
shown (right). Fluorescence was normalized to forward scatter for each event to account for
differences in cell size. Scale bar = 50μm. p-values were determined by student’s t-test.
C) Transmission electron microscopy of control and PLIN2 depleted cells is shown (day 4 post
transduction). Red arrows denote rough ER. Scale bar=200 nm.
D) qRT-PCR of xenograft tumor RNA assessing expression of UPR target genes. p-values were
determined by two-way ANOVA with Bonferroni correction. Asterisks denote comparison with EV
Veh. * p<0.05, ** p<0.01, *** p<0.001. Pound signs denote comparison with EV Dox. ## p<0.01,
### p<0.001. Error bars denote SEM.
Figure 5: Unfolded protein response promotes cell death upon PLIN2 depletion.
Research. on June 19, 2018. © 2015 American Association for Cancercancerdiscovery.aacrjournals.org Downloaded from
Author manuscripts have been peer reviewed and accepted for publication but have not yet been edited. Author Manuscript Published OnlineFirst on March 31, 2015; DOI: 10.1158/2159-8290.CD-14-1507
4
A) 786-O cells expressing shPLIN2_1 or SCR control were treated with PERK inhibitor (1μM) or
DMSO vehicle beginning on day 3 post transduction. Cell viability was determined by annexin/PI
staining after 48 hours of drug treatment and qRT-PCR analysis of UPR target gene expression
was performed after 24 hours of drug treatment. For qRT-PCR, TBP and ACTB were utilized as
endogenous control genes and relative mRNA expression was determined by normalizing to
expression in SCR samples. Data are representative of three independent experiments. p-values
were determined by student’s t-test. * p<0.05, ** p<0.01, *** p<0.001.
B) 786-O cells expressing shPLIN2_1 or SCR shRNA were transfected with non-targeting (NT) or
ATF6 directed siRNA (day 2 post transduction) and subsequently treated with IRE-1α inhibitor
(10μM) or DMSO vehicle (day 3 post transduction). Cell viability was determined by annexin/PI
staining after 48 hours of drug treatment (left) and qRT-PCR analysis of UPR target gene
expression was performed after 24 hours of drug treatment (right). Data are representative of
three independent experiments. p-values were determined by two-way ANOVA with Bonferroni
correction. ** p<0.01, *** p<0.001. Error bars denote SEM.
Figure 6: Suppression of protein synthesis ameliorates ER stress and cell death upon PLIN2 depletion
A) 786-O cells expressing shPLIN2_1 or SCR control were treated with rapamycin (100 nM) or
Torin1 (250 nM) for 48 hours. Western blot analysis of direct targets of mTORC1 kinase (left) and
mTORC1 regulated fatty acid synthesis enzymes (right) are shown.
B) Protein synthesis activity was measured in 786-O cells treated with rapamycin, Torin1, or DMSO
vehicle for 48 hours. Cells were pulsed with puromycin (30 min, 10μg/ml) and chased in
puromycin free media (1 hr) to allow puromycin incorporation into nascent peptides. Whole cell
lysates were subjected to western blot analysis using an anti-puromycin antibody (clone 12D10).
C) 786-O cells expressing shPLIN2_1 or SCR control were treated with rapamycin, Torin1, or DMSO
vehicle starting on day 3 post transduction and cell viability was determined by annexin/PI
staining after 48 hours of drug treatment (left). qRT-PCR comparing UPR target gene expression
in cells treated with Torin1 was performed after 24 hours of drug treatment.
D) 786-O cells expressing shPLIN2_1 or SCR shRNA were treated with cycloheximide or DMSO
Research. on June 19, 2018. © 2015 American Association for Cancercancerdiscovery.aacrjournals.org Downloaded from
Author manuscripts have been peer reviewed and accepted for publication but have not yet been edited. Author Manuscript Published OnlineFirst on March 31, 2015; DOI: 10.1158/2159-8290.CD-14-1507
5
vehicle starting on day 3 post transduction and cell viability was determined by annexin/PI
staining after 48 hours of drug treatment (left). qRT-PCR for UPR target genes was performed
after 24 hours of drug treatment (right).
E) A498 cells were treated and analyzed as described in (D). Data are representative of three
independent experiments. p-values were determined by student’s t-test for annexin/PI assays and
two-way ANOVA with Bonferroni correction for qRT-PCR. For qRT-PCR, TBP and ACTB were
utilized as endogenous control genes and relative mRNA expression was determined by
normalizing to expression in SCR Veh samples. Asterisks denote statistical comparison with
SCR Veh. * p<0.05, *** p<0.001. Pound signs denote statistical comparison with shPLIN2 Veh. #
p<0.05, ### p<0.001. Error bars denote SEM.
Figure 7. HIF-2α/PLIN2 dependent lipid storage protects ccRCC cells against pharmacological ER stress.
A) A498 cells expressing shPLIN2_1, shPLIN2_2, or SCR control were treated with tunicamycin or
DMSO at 2 days post transduction. Cell viability was determined by annexin/PI staining after 48
hours of drug treatment. Asterisks denote statistical comparison of viability under tunicamycin
treatment. Tunicamycin-induced reduction in viability was significantly different between shPLIN2
and SCR cells: shPLIN2_1 vs SCR, p<0.01; shPLIN2_2 vs SCR, p<0.01.
B) A498 cells expressing shHIF2A_7 or SCR control, along with either exogenous PLIN2 or an
empty vector (EV), were stained with BODIPY 493/503 (2μg/ml). Histograms indicating BODIPY
fluorescence was generated by flow cytometry.
C) Cells described in (B) were treated with tunicamycin or DMSO control for 48 hours and viability
was determined by annexin/PI staining.
D) A498 cells expressing shPLIN2_1, shPLIN2_2, or SCR control were treated with Bortezomib or
DMSO at 3 days post transduction. Cell viability was determined by annexin/PI staining after 24
hours of drug treatment. Asterisks denote statistical comparison of viability under Bortezomib
treatment. Bortezomib-induced reduction in viability was significantly different between shPLIN2
and SCR cells: shPLIN2_1 vs SCR, p<0.001 shPLIN2_2 vs SCR, p<0.001
E) XBP1s and CHOP expression in cells from (D) was determined by qRT-PCR. Asterisks denote
Research. on June 19, 2018. © 2015 American Association for Cancercancerdiscovery.aacrjournals.org Downloaded from
Author manuscripts have been peer reviewed and accepted for publication but have not yet been edited. Author Manuscript Published OnlineFirst on March 31, 2015; DOI: 10.1158/2159-8290.CD-14-1507
6
comparison with SCR DMSO. Pound signs denote comparison with SCR Bortezomib. For qRT-
PCR, TBP and ACTB were utilized as endogenous control genes and relative mRNA expression
was determined by normalizing to expression in SCR DMSO samples.
F) Cells described in (B) were treated with Bortezomib or DMSO control for 24 hours and viability
was determined by annexin/PI staining.
G) A498 cells expressing shPLIN2_1, shPLIN2_2, or SCR control were treated with Bortezomib or
DMSO at 3 days post transduction and incubated under the designated serum and oxygen
conditions. Cell viability was determined by annexin/PI staining after 24 hours of drug treatment.
Astericks denote comparison with SCR Bortezomib. Under each serum and oxygen condition,
Bortezomib-induced reduction in viability was significantly different between shPLIN2 and SCR
cells: shPLIN2_1 vs SCR, p<0.001 shPLIN2_2 vs SCR, p<0.001
H) Proposed model illustrating the protective function of HIF-2α dependent PLIN2 expression and
lipid storage against ER stress in ccRCC cells. Data are representative of three independent
experiments. p-values were determined by two-way ANOVA with Bonferroni correction. * p<0.05,
** p<0.01, *** p<0.001. ### p<0.001. Error bars denote SEM.
Research. on June 19, 2018. © 2015 American Association for Cancercancerdiscovery.aacrjournals.org Downloaded from
Author manuscripts have been peer reviewed and accepted for publication but have not yet been edited. Author Manuscript Published OnlineFirst on March 31, 2015; DOI: 10.1158/2159-8290.CD-14-1507
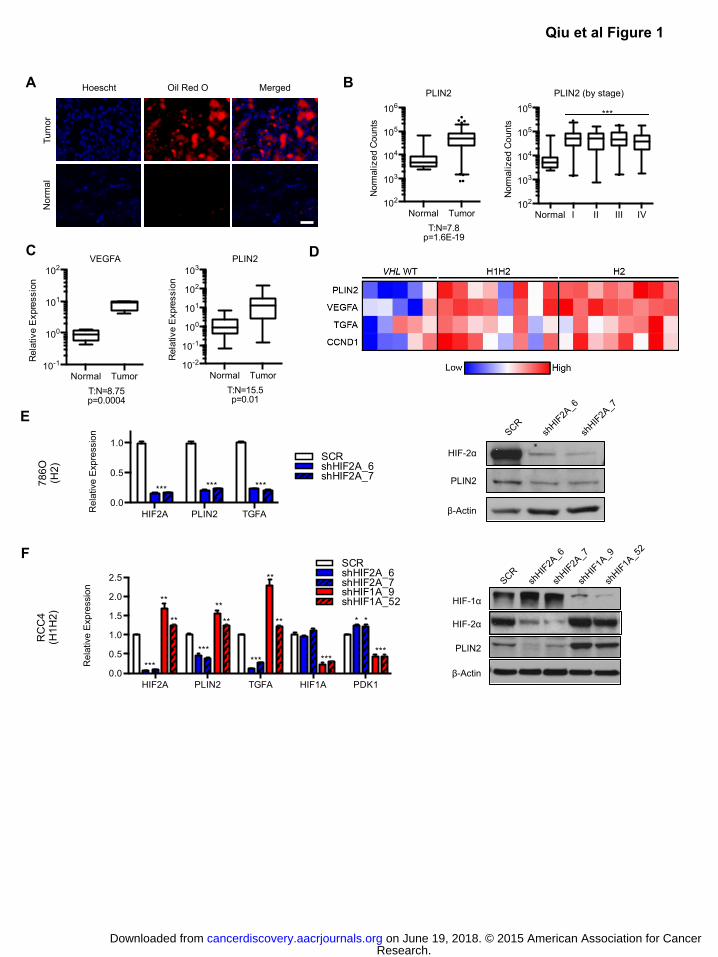
B PLIN2 PLIN2 (by stage)
A
β-Actin
PLIN2
HIF-2α
HIF-1α
HIF-2α
β-Actin
PLIN2
F
Normal I II III IV102
103
104
105
106
Nor
mal
ized
Cou
nts
***
Normal Tumor102
103
104
105
106
Nor
mal
ized
Cou
nts
T:N=7.8p=1.6E-19
RC
C4
(H1H
2)
Rel
ativ
e E
xpre
ssio
n
HIF2A PLIN2 TGFA HIF1A PDK10.0
0.5
1.0
1.5
2.0
2.5
SCR
shHIF1A_9shHIF1A_52
shHIF2A_6shHIF2A_7
***
******
**
***
**
**
**
**
***
**
**
786O
(H
2)
Rel
ativ
e E
xpre
ssio
n
SCRshHIF2A_6shHIF2A_7
HIF2A PLIN2 TGFA0.0
0.5
1.0
*** *** ***
HIF2A PLIN2 TGFA HIF1A PDK10.0
0.5
1.0
1.5
2.0
2.5
***
******
**
***
**
**
****
***
**
**
Tum
or
Nor
mal
Hoescht Oil Red O Merged
Qiu et al Figure 1
Normal Tumor10-2
10-1
100
101
102
103
Rel
ativ
e E
xpre
ssio
n
T:N=15.5p=0.01
Normal Tumor10-1
100
101
102
Rel
ativ
e E
xpre
ssio
n
T:N=8.75p=0.0004
VEGFA PLIN2 D
E
C
Research. on June 19, 2018. © 2015 American Association for Cancercancerdiscovery.aacrjournals.org Downloaded from
Author manuscripts have been peer reviewed and accepted for publication but have not yet been edited. Author Manuscript Published OnlineFirst on March 31, 2015; DOI: 10.1158/2159-8290.CD-14-1507
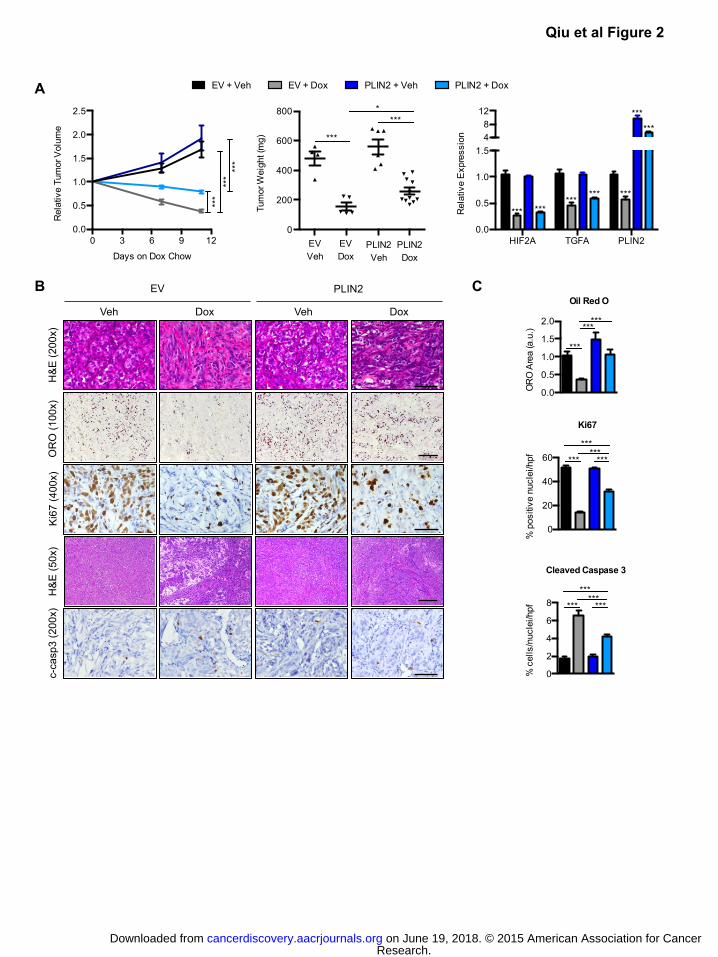
A
B
EV + Veh EV + Dox PLIN2 + Veh PLIN2 + Dox
C Veh Dox Veh Dox
H&
E (2
00x)
O
RO
(100
x)
Ki6
7 (4
00x)
H
&E
(50x
) c-
casp
3 (2
00x)
EV PLIN2
Ki67
0
20
40
60
% p
ositi
ve n
ucle
i/hpf ***
******
***
Cleaved Caspase 3
0
2
4
6
8
% c
ells
/nuc
lei/h
pf ******
***
***
Qiu et al Figure 2
Oil Red O
0.0
0.5
1.0
1.5
2.0
OR
O A
rea
(a.u
.)
***
******
0
200
400
600
800
Tum
or W
eigh
t (m
g)
EVVeh
***
EVDox
PLIN2Veh
PLIN2Dox
****
0 3 6 9 120.0
0.5
1.0
1.5
2.0
2.5
Days on Dox Chow
Rel
ativ
e Tu
mor
Vol
ume
***
***
***
HIF2A TGFA PLIN20.0
0.5
1.0
1.548
12
Rel
ativ
e E
xpre
ssio
n
*** ******
*** ***
******
Research. on June 19, 2018. © 2015 American Association for Cancercancerdiscovery.aacrjournals.org Downloaded from
Author manuscripts have been peer reviewed and accepted for publication but have not yet been edited. Author Manuscript Published OnlineFirst on March 31, 2015; DOI: 10.1158/2159-8290.CD-14-1507
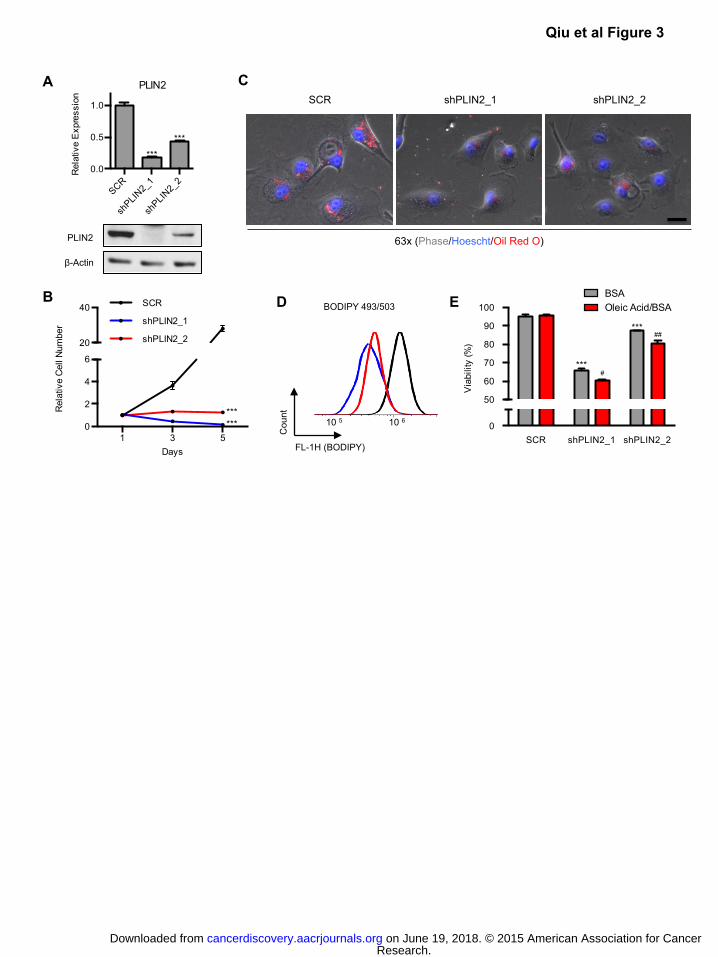
C
B E
PLIN2
β-Actin
SCR shPLIN2_1 shPLIN2_250
60
70
80
90
100
Via
bilit
y (%
)
BSAOleic Acid/BSA
*
*
D
A
1 3 50
2
4
6
20
40
Days
Rel
ativ
e C
ell N
umbe
r
******
FL-1H (BODIPY)
Cou
nt
BODIPY 493/503
10 5 10 6 1 3 5
0
2
4
6
20
40
Days
Rela
tive
Cell
Num
ber
SCR
shPLIN2_1
shPLIN2_2
******
SCR shPLIN2_1 shPLIN2_2
63x (Phase/Hoescht/Oil Red O)
Qiu et al Figure 3
SCR
shPLIN
2_1
shPLIN
2_2
0.0
0.5
1.0
Rel
ativ
e E
xpre
ssio
nPLIN2
***
***
SCR shPLIN2_1 shPLIN2_20
50
60
70
80
90
100
Via
bilit
y (%
)
***
***
#
##
Research. on June 19, 2018. © 2015 American Association for Cancercancerdiscovery.aacrjournals.org Downloaded from
Author manuscripts have been peer reviewed and accepted for publication but have not yet been edited. Author Manuscript Published OnlineFirst on March 31, 2015; DOI: 10.1158/2159-8290.CD-14-1507
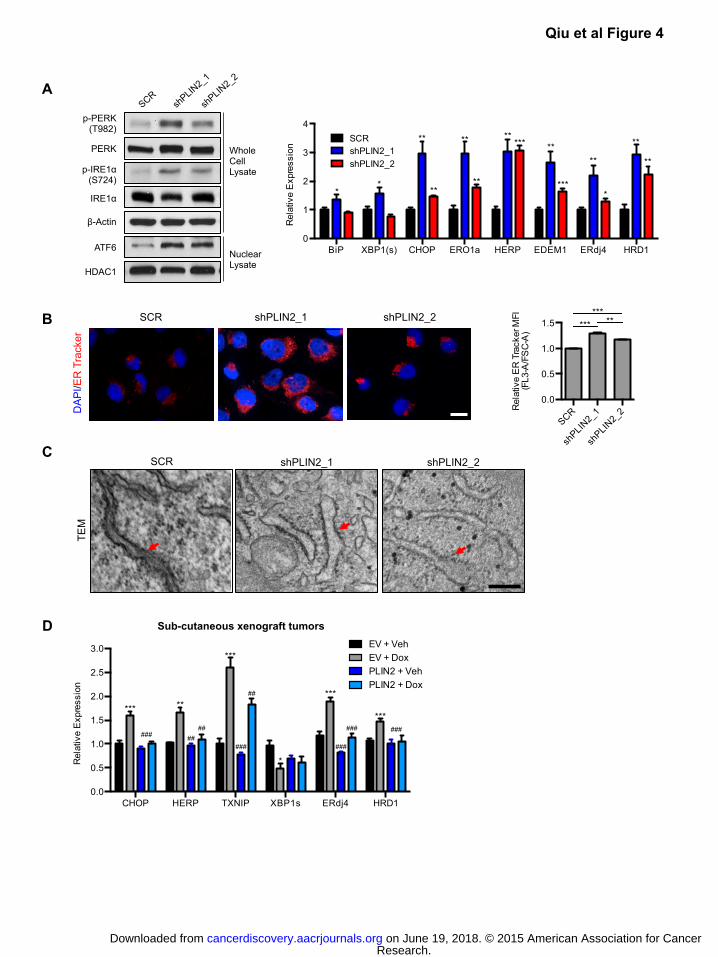
A
B
C
SCR
shPLIN
2_1
shPLIN
2_2
0.0
0.5
1.0
1.5
Rel
ativ
e E
R T
rack
er M
FI(F
L3-A
/FS
C-A
)
****** **
BiP XBP1(s) CHOP ERO1a HERP EDEM1 ERdj4 HRD10
1
2
3
4
RQ
(TB
P, A
CTB
)
786-O
SCRshPLIN2_1shPLIN2_2
**
**
**
**
**
***** **
***
**
*
**
**
DA
PI/E
R T
rack
er
SCR shPLIN2_1 shPLIN2_2
D
TEM
SCR shPLIN2_1 shPLIN2_2
Qiu et al Figure 4
Sub-cutaneous xenograft tumors EV + VehEV + DoxPLIN2 + VehPLIN2 + Dox
CHOP HERP TXNIP XBP1s ERdj4 HRD10.0
0.5
1.0
1.5
2.0
2.5
3.0
Rel
ativ
e E
xpre
ssio
n
**
***
***
*
***
#####
##
#####
###
###
###
***
BiP XBP1(s) CHOP ERO1a HERP EDEM1 ERdj4 HRD10
1
2
3
4
Rel
ativ
e E
xpre
ssio
n
**
**
**
**
**
***** **
***
**
*
**
**p-IRE1α
(S724)
IRE1α
ATF6
HDAC1
Nuclear Lysate
Whole Cell Lysate
p-PERK (T982)
PERK
β-Actin
Research. on June 19, 2018. © 2015 American Association for Cancercancerdiscovery.aacrjournals.org Downloaded from
Author manuscripts have been peer reviewed and accepted for publication but have not yet been edited. Author Manuscript Published OnlineFirst on March 31, 2015; DOI: 10.1158/2159-8290.CD-14-1507
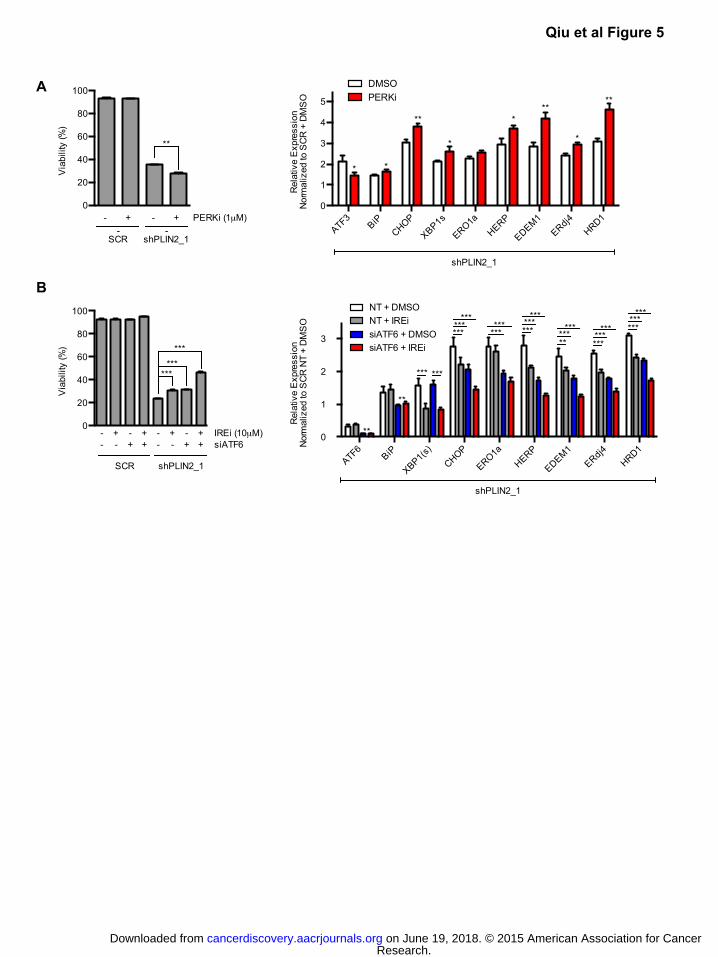
A
B NT + DMSONT + IREisiATF6 + DMSOsiATF6 + IREi
DMSOPERKi
0
20
40
60
80
100
Via
bilit
y (%
)
******
***
IREi (10µM)+
SCR
- +--- ++
+
shPLIN2_1
- +--- ++ siATF6
0
20
40
60
80
100
Via
bilit
y (%
)
PERKi (1µM)+
SCR
-
**
+
shPLIN2_1
-- -
Qiu et al Figure 5
ATF6BiP
XBP1(s)
CHOP
ERO1aHERP
EDEM1ERdj4
HRD10
1
2
3
Rel
ativ
e E
xpre
ssio
nN
orm
aliz
ed to
SC
R N
T +
DM
SO
shPLIN2_1
**
***
***
**
***
****** ***
*********
*****
******
******
******
******
ATF3BiP
CHOP
XBP1s
ERO1aHERP
EDEM1ERdj4
HRD10
1
2
3
4
5
Rel
ativ
e E
xpre
ssio
nN
orm
aliz
ed to
SC
R +
DM
SO
shPLIN2_1
* *
**
*
***
**
*
Research. on June 19, 2018. © 2015 American Association for Cancercancerdiscovery.aacrjournals.org Downloaded from
Author manuscripts have been peer reviewed and accepted for publication but have not yet been edited. Author Manuscript Published OnlineFirst on March 31, 2015; DOI: 10.1158/2159-8290.CD-14-1507
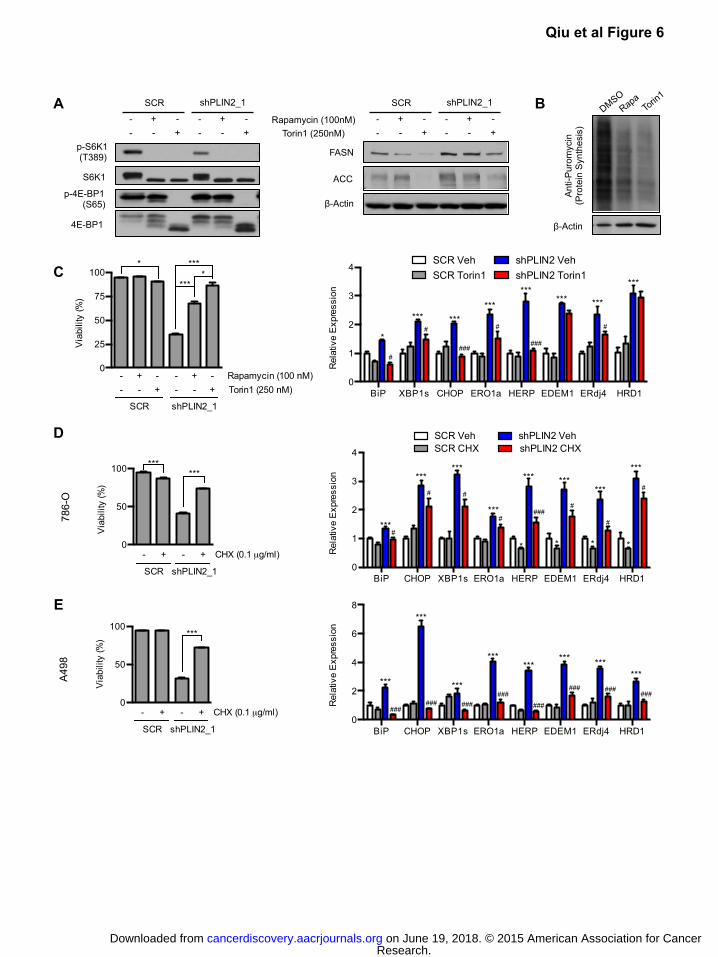
A
D
E
C
786-
O
A49
8
FASN
ACC
β-Actin
- -
shPLIN2_1
- +
+ -
- -
- +
+ -
SCR
Torin1 (250nM) Rapamycin (100nM)
p-S6K1 (T389)
S6K1
p-4E-BP1 (S65)
4E-BP1
- -
shPLIN2_1
- +
+ -
- -
- +
+ -
SCR B
Ant
i-Pur
omyc
in
(Pro
tein
Syn
thes
is)
β-Actin
0
50
100
Via
bilit
y (%
) ***
+
SCR
- +
shPLIN2_1
- CHX (0.1 µg/ml)
0
50
100
Via
bilit
y (%
)
+
SCR
-
***
+
shPLIN2_1
- CHX (0.1 µg/ml)
***
0
25
50
75
100
Via
bilit
y (%
)
Rapamycin (100 nM)Torin1 (250 nM)
SCR
* ***
****
+-+-
--
shPLIN2_1
+-+-
--
SCR VehSCR Torin1
shPLIN2 VehshPLIN2 Torin1
Qiu et al Figure 6
SCR VehSCR CHX
shPLIN2 VehshPLIN2 CHX
BiP XBP1s CHOP ERO1a HERP EDEM1 ERdj4 HRD10
1
2
3
4
Rel
ativ
e E
xpre
ssio
n*
#
***#
***
###
***
#
***
###
*** ***
#
***
BiP CHOP XBP1s ERO1a HERP EDEM1 ERdj4 HRD10
1
2
3
4
Rel
ativ
e E
xpre
ssio
n
***#
***#
***
#
***#
***
###
***
#
***
#
*
***
#
* * *
BiP CHOP XBP1s ERO1a HERP EDEM1 ERdj4 HRD10
2
4
6
8
Rel
ativ
e E
xpre
ssio
n
***
###
***
***
******
*** ******
### ######
###
### ######
Research. on June 19, 2018. © 2015 American Association for Cancercancerdiscovery.aacrjournals.org Downloaded from
Author manuscripts have been peer reviewed and accepted for publication but have not yet been edited. Author Manuscript Published OnlineFirst on March 31, 2015; DOI: 10.1158/2159-8290.CD-14-1507
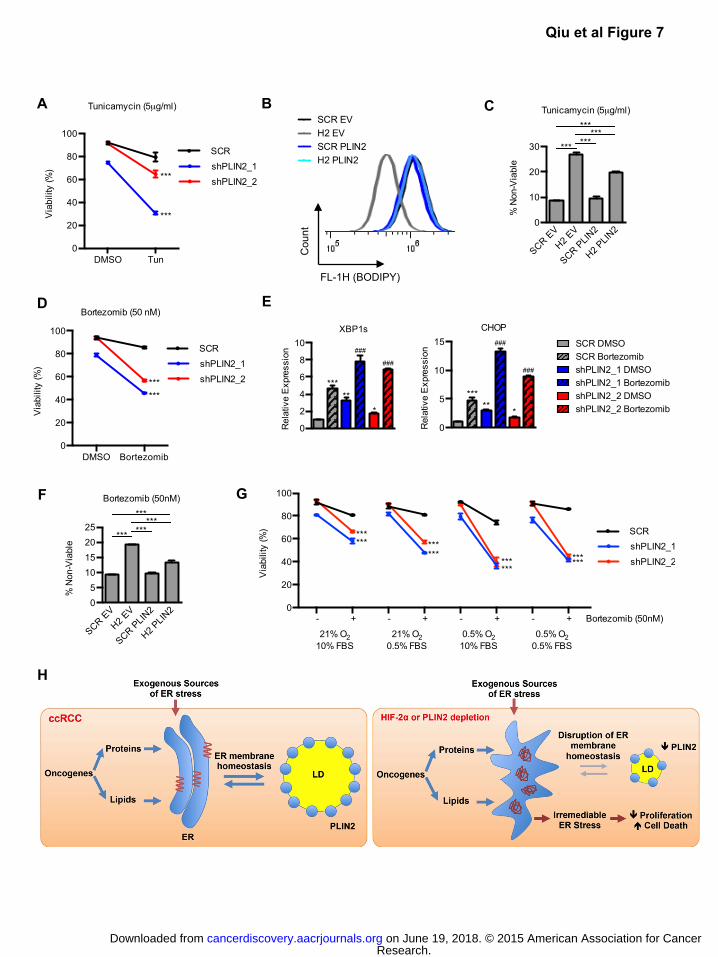
FL-1H (BODIPY)
Cou
nt
DMSO Bortezomib0
20
40
60
80
100
Via
bilit
y (%
)
Bortezomib (50 nM)
SCRshPLIN2_1shPLIN2_2***
***
DMSO Tun0
20
40
60
80
100
Via
bilit
y (%
)
Tunicamycin (5µg/ml)
SCRshPLIN2_1shPLIN2_2***
***
SCR EVH2 EVSCR PLIN2H2 PLIN2
A B C
Qiu et al Figure 7
D
F
H
SCR DMSOSCR BortezomibshPLIN2_1 DMSOshPLIN2_1 BortezomibshPLIN2_2 DMSOshPLIN2_2 Bortezomib
E
G
SCR EVH2 E
V
SCR PLIN
2
H2 PLIN
20
10
20
30
% N
on-V
iabl
e
Tunicamycin (5µg/ml)
*** ******
***
SCR EVH2 E
V
SCR PLIN
2
H2 PLIN
205
10152025
% N
on-V
iabl
e
Bortezomib (50nM)
*** ******
***
XBP1s
0
2
4
6
8
10
Rel
ativ
e E
xpre
ssio
n
*****
*
###
###
CHOP
0
5
10
15
Rel
ativ
e E
xpre
ssio
n
*****
*
###
###
Research. on June 19, 2018. © 2015 American Association for Cancercancerdiscovery.aacrjournals.org Downloaded from
Author manuscripts have been peer reviewed and accepted for publication but have not yet been edited. Author Manuscript Published OnlineFirst on March 31, 2015; DOI: 10.1158/2159-8290.CD-14-1507
Published OnlineFirst March 31, 2015.Cancer Discovery Bo Qiu, Daniel Ackerman, Danielle J Sanchez, et al. reticulum homeostasis in clear cell renal cell carcinoma
dependent lipid storage promotes endoplasmicαHIF-2
Updated version
10.1158/2159-8290.CD-14-1507doi:
Access the most recent version of this article at:
Material
Supplementary
http://cancerdiscovery.aacrjournals.org/content/suppl/2015/05/08/2159-8290.CD-14-1507.DC2
Access the most recent supplemental material at:
Manuscript
Authoredited. Author manuscripts have been peer reviewed and accepted for publication but have not yet been
E-mail alerts related to this article or journal.Sign up to receive free email-alerts
Subscriptions
Reprints and
To order reprints of this article or to subscribe to the journal, contact the AACR Publications
Permissions
Rightslink site. Click on "Request Permissions" which will take you to the Copyright Clearance Center's (CCC)
.http://cancerdiscovery.aacrjournals.org/content/early/2015/03/31/2159-8290.CD-14-1507To request permission to re-use all or part of this article, use this link
Research. on June 19, 2018. © 2015 American Association for Cancercancerdiscovery.aacrjournals.org Downloaded from
Author manuscripts have been peer reviewed and accepted for publication but have not yet been edited. Author Manuscript Published OnlineFirst on March 31, 2015; DOI: 10.1158/2159-8290.CD-14-1507