Graph Cuts for Image Segmentation - cse.iitb.ac.in
39
Introduction Energy Minimization Min-cuts in Flow Graphs Normalized Graph Cuts Summary Graph Cuts for Image Segmentation Meghshyam G. Prasad CSE Department IIT Bombay Mumbai. November 30, 2012 Meghshyam G. Prasad Graph Cuts for Image Segmentation
Transcript of Graph Cuts for Image Segmentation - cse.iitb.ac.in

IntroductionEnergy Minimization
Min-cuts in Flow GraphsNormalized Graph Cuts
Summary
Graph Cuts for Image Segmentation
Meghshyam G. Prasad
CSE DepartmentIIT BombayMumbai.
November 30, 2012
Meghshyam G. Prasad Graph Cuts for Image Segmentation
IntroductionEnergy Minimization
Min-cuts in Flow GraphsNormalized Graph Cuts
Summary
Outline
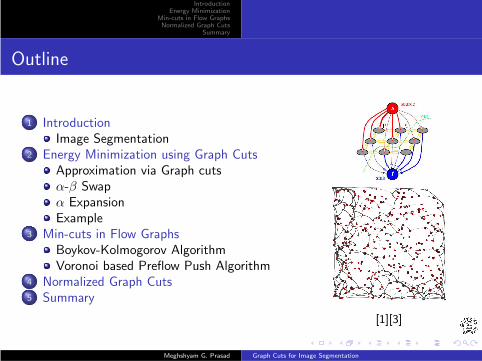
1 IntroductionImage Segmentation
2 Energy Minimization using Graph CutsApproximation via Graph cutsα-β Swapα ExpansionExample
3 Min-cuts in Flow GraphsBoykov-Kolmogorov AlgorithmVoronoi based Preflow Push Algorithm
4 Normalized Graph Cuts5 Summary
[1][3]
Meghshyam G. Prasad Graph Cuts for Image Segmentation

IntroductionEnergy Minimization
Min-cuts in Flow GraphsNormalized Graph Cuts
Summary
Image Segmentation
Image Segmentation
[6]
Goal of Image Segmentation is to cluster pixelsinto salient image regions, i.e., regionscorresponding to individual surfaces, objects, ornatural parts of objects. Each of the pixels in aregion are similar with respect to somecharacteristic or computed property, such ascolor, intensity, or texture.
Applications :- Medical Imaging (TumorDetection), Face Recognition, Machine Visionetc.
Meghshyam G. Prasad Graph Cuts for Image Segmentation

IntroductionEnergy Minimization
Min-cuts in Flow GraphsNormalized Graph Cuts
Summary
Image Segmentation
Previous Approaches
Region Based Segmentation
Image is partitioned into connected regions by grouping neighboringpixels of similar intensity levels.
Adjacent regions are then merged under some criterion based onhomogeneity.
Over-stringent criteria create fragmentation; lenient ones overlookblurred boundaries and over-merge.
Watershed based Image Segmentation
Visualizes images in 3-dimensions: x, y, and intensity.
Object is distinguished from the background by its up-lifted edges.
Give segments with continuous boundaries, also give rise toover-segmentation.
Meghshyam G. Prasad Graph Cuts for Image Segmentation
IntroductionEnergy Minimization
Min-cuts in Flow GraphsNormalized Graph Cuts
Summary
Image Segmentation
Previous Approaches
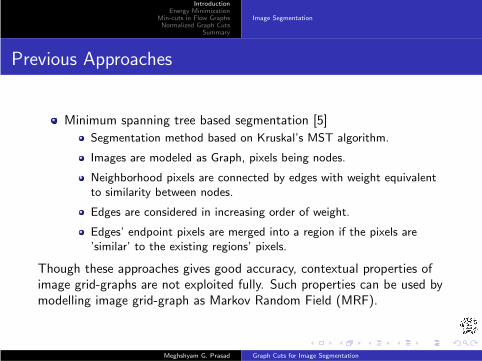
Minimum spanning tree based segmentation [5]
Segmentation method based on Kruskal’s MST algorithm.
Images are modeled as Graph, pixels being nodes.
Neighborhood pixels are connected by edges with weight equivalentto similarity between nodes.
Edges are considered in increasing order of weight.
Edges’ endpoint pixels are merged into a region if the pixels are’similar’ to the existing regions’ pixels.
Though these approaches gives good accuracy, contextual properties ofimage grid-graphs are not exploited fully. Such properties can be used bymodelling image grid-graph as Markov Random Field (MRF).
Meghshyam G. Prasad Graph Cuts for Image Segmentation
IntroductionEnergy Minimization
Min-cuts in Flow GraphsNormalized Graph Cuts
Summary
Approximation via Graph cutsα-β Swapα ExpansionExample
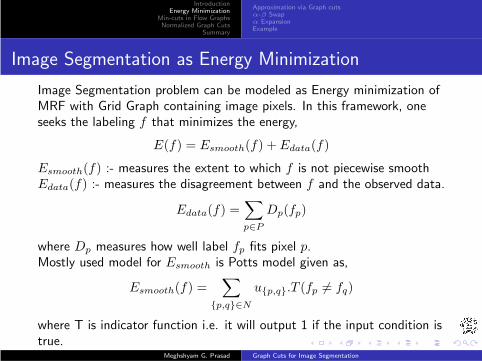
Image Segmentation as Energy Minimization
Image Segmentation problem can be modeled as Energy minimization ofMRF with Grid Graph containing image pixels. In this framework, oneseeks the labeling f that minimizes the energy,
E(f) = Esmooth(f) + Edata(f)
Esmooth(f) :- measures the extent to which f is not piecewise smoothEdata(f) :- measures the disagreement between f and the observed data.
Edata(f) =∑
p∈P
Dp(fp)
where Dp measures how well label fp fits pixel p.Mostly used model for Esmooth is Potts model given as,
Esmooth(f) =∑
{p,q}∈N
u{p,q}.T (fp 6= fq)
where T is indicator function i.e. it will output 1 if the input condition istrue.
Meghshyam G. Prasad Graph Cuts for Image Segmentation

IntroductionEnergy Minimization
Min-cuts in Flow GraphsNormalized Graph Cuts
Summary
Approximation via Graph cutsα-β Swapα ExpansionExample
New Moves
Any labeling f can be uniquely represented by a partition of image pixelsP = {Pl|l ∈ L} where Pl = {p ∈ P |fp = l} is a subset of pixels assignedlabel l.
Standard moves allow only single pixel changing its label at a time,so time consuming.
So, Boykov et.al[4] proposed new moves which allows many pixels tochange their labels at a time:
α-β swap
Move which changes partition P to P′such that some pixels that
were labeled α in P are now labeled as β in P′, and vice-e-versa.
Pixels whose labels are other than α,β retain their labels.
α-expansion
α-expansion move allows any set of image pixels to change theirlabels to α.But, pixels labeled α retain their labels.
Meghshyam G. Prasad Graph Cuts for Image Segmentation
IntroductionEnergy Minimization
Min-cuts in Flow GraphsNormalized Graph Cuts
Summary
Approximation via Graph cutsα-β Swapα ExpansionExample
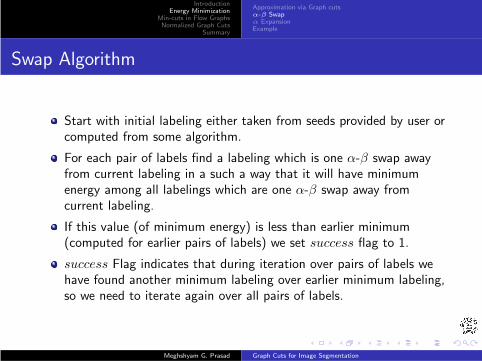
Swap Algorithm
Start with initial labeling either taken from seeds provided by user orcomputed from some algorithm.
For each pair of labels find a labeling which is one α-β swap awayfrom current labeling in a such a way that it will have minimumenergy among all labelings which are one α-β swap away fromcurrent labeling.
If this value (of minimum energy) is less than earlier minimum(computed for earlier pairs of labels) we set success flag to 1.
success Flag indicates that during iteration over pairs of labels wehave found another minimum labeling over earlier minimum labeling,so we need to iterate again over all pairs of labels.
Meghshyam G. Prasad Graph Cuts for Image Segmentation
IntroductionEnergy Minimization
Min-cuts in Flow GraphsNormalized Graph Cuts
Summary
Approximation via Graph cutsα-β Swapα ExpansionExample
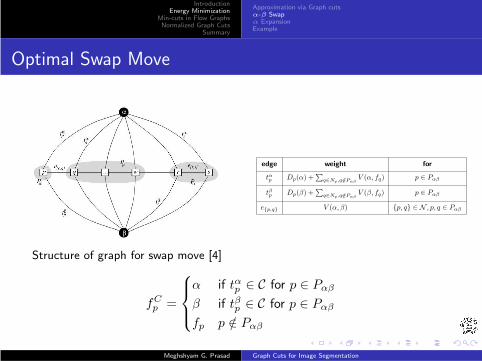
Optimal Swap Move
Structure of graph for swap move [4]
edge weight for
tαp Dp(α) +∑
q∈Np,q /∈PαβV (α, fq) p ∈ Pαβ
tβp Dp(β) +∑
q∈Np,q /∈PαβV (β, fq) p ∈ Pαβ
e{p,q} V (α, β) {p, q} ∈ N , p, q ∈ Pαβ
fCp =
α if tαp ∈ C for p ∈ Pαβ
β if tβp ∈ C for p ∈ Pαβ
fp p /∈ Pαβ
Meghshyam G. Prasad Graph Cuts for Image Segmentation
IntroductionEnergy Minimization
Min-cuts in Flow GraphsNormalized Graph Cuts
Summary
Approximation via Graph cutsα-β Swapα ExpansionExample
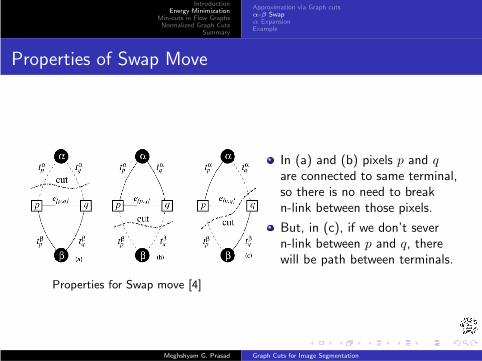
Properties of Swap Move
Properties for Swap move [4]
In (a) and (b) pixels p and qare connected to same terminal,so there is no need to breakn-link between those pixels.
But, in (c), if we don’t severn-link between p and q, therewill be path between terminals.
Meghshyam G. Prasad Graph Cuts for Image Segmentation
IntroductionEnergy Minimization
Min-cuts in Flow GraphsNormalized Graph Cuts
Summary
Approximation via Graph cutsα-β Swapα ExpansionExample
Expansion Algorithm
Similar to α-β Swap algorithm.
In each iteration (for each label) we try to find labeling which is oneα-expansion from current labeling.
Some pixels whose label is other than α (the label on which we areiterating over) may change their labels to α.
But pixels whose label is α do not change their label.
α-Expansion can be thought of special case of α-β Swap, where β iscollection of all labels other than α and movement from only β to αis allowed.
Meghshyam G. Prasad Graph Cuts for Image Segmentation
IntroductionEnergy Minimization
Min-cuts in Flow GraphsNormalized Graph Cuts
Summary
Approximation via Graph cutsα-β Swapα ExpansionExample
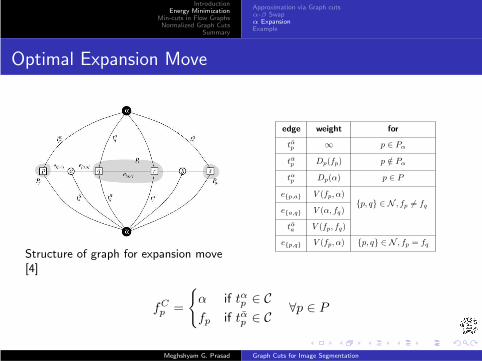
Optimal Expansion Move
Structure of graph for expansion move[4]
edge weight for
tαp ∞ p ∈ Pα
tαp Dp(fp) p /∈ Pα
tαp Dp(α) p ∈ P
e{p,a} V (fp, α){p, q} ∈ N , fp 6= fq
e{a,q} V (α, fq)
tαa V (fp, fq)
e{p,q} V (fp, α) {p, q} ∈ N , fp = fq
fCp =
{
α if tαp ∈ C
fp if tαp ∈ C∀p ∈ P
Meghshyam G. Prasad Graph Cuts for Image Segmentation
IntroductionEnergy Minimization
Min-cuts in Flow GraphsNormalized Graph Cuts
Summary
Approximation via Graph cutsα-β Swapα ExpansionExample
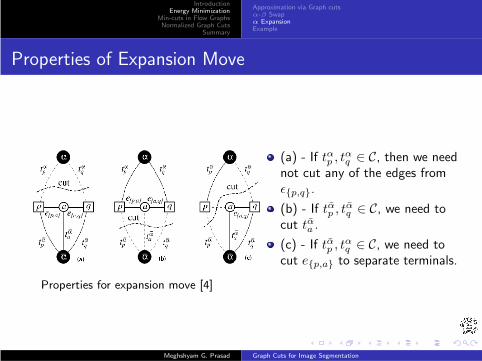
Properties of Expansion Move
Properties for expansion move [4]
(a) - If tαp , tαq ∈ C, then we need
not cut any of the edges fromǫ{p,q}.
(b) - If tαp , tαq ∈ C, we need to
cut tαa .
(c) - If tαp , tαq ∈ C, we need to
cut e{p,a} to separate terminals.
Meghshyam G. Prasad Graph Cuts for Image Segmentation

IntroductionEnergy Minimization
Min-cuts in Flow GraphsNormalized Graph Cuts
Summary
Approximation via Graph cutsα-β Swapα ExpansionExample
Example
Assume, an image consisting ofjust three pixels 1,2 and 3arranged in one row.
Three possible labels a, b, c.
Data Term:- The values for Dp
for each pixel/label combinationare shown in Figure.
Coherence Term :- LetV (a, b) = V (b, c) = K/2 andV (a, c) = K.
Initially label all pixels as a.
Dp values [4]
Meghshyam G. Prasad Graph Cuts for Image Segmentation
IntroductionEnergy Minimization
Min-cuts in Flow GraphsNormalized Graph Cuts
Summary
Approximation via Graph cutsα-β Swapα ExpansionExample
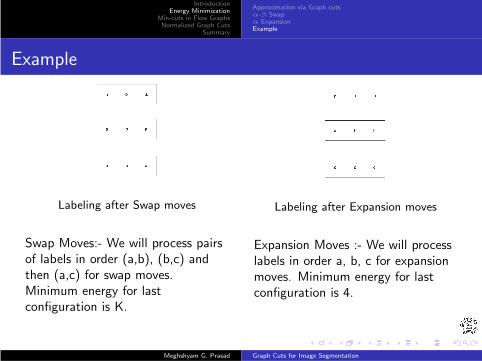
Example
Labeling after Swap moves
Swap Moves:- We will process pairsof labels in order (a,b), (b,c) andthen (a,c) for swap moves.Minimum energy for lastconfiguration is K.
Labeling after Expansion moves
Expansion Moves :- We will processlabels in order a, b, c for expansionmoves. Minimum energy for lastconfiguration is 4.
Meghshyam G. Prasad Graph Cuts for Image Segmentation
IntroductionEnergy Minimization
Min-cuts in Flow GraphsNormalized Graph Cuts
Summary
BK AlgorithmVPP Algorithm
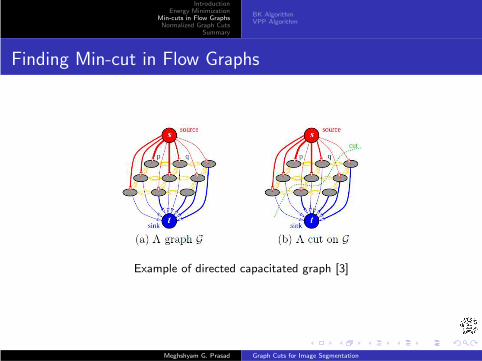
Finding Min-cut in Flow Graphs
Example of directed capacitated graph [3]
Meghshyam G. Prasad Graph Cuts for Image Segmentation
IntroductionEnergy Minimization
Min-cuts in Flow GraphsNormalized Graph Cuts
Summary
BK AlgorithmVPP Algorithm
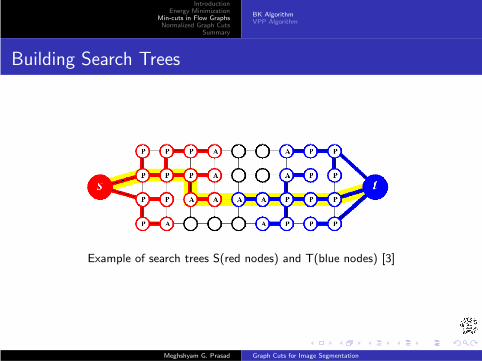
Building Search Trees
Example of search trees S(red nodes) and T(blue nodes) [3]
Meghshyam G. Prasad Graph Cuts for Image Segmentation
IntroductionEnergy Minimization
Min-cuts in Flow GraphsNormalized Graph Cuts
Summary
BK AlgorithmVPP Algorithm
Boykov-Kolmogorov Algorithm I
“growth” stage: search trees S and T grow until they touch givingan s → t path,
Active nodes explore adjacent non-saturated edges and acquire newchildren from set of free nodes.Newly acquired nodes will become active members of correspondingsearch trees.The growth stage terminates if an active node encounters aneighboring node that belongs to the opposite tree.
“augmentation” stage: the found path is augmented, search tree(s)break into forest(s),
As we are pushing maximum possible flow through augmenting path,some edge(s) will become saturated.When we remove such edge(s), some of the nodes in the trees S andT may become orphans.It effects split of the search trees S and T into forests.
Meghshyam G. Prasad Graph Cuts for Image Segmentation

IntroductionEnergy Minimization
Min-cuts in Flow GraphsNormalized Graph Cuts
Summary
BK AlgorithmVPP Algorithm
Boykov-Kolmogorov Algorithm II
The source s and the sink t are still roots of two of the trees whileorphans form roots of all other trees.
“adoption” stage: trees S and T are restored.
Most important step of the algorithm.
Tries to find valid parent for orphans created in “augmentation”
stage.
A new parent should belong to the same set, S or T, as the orphan.
A parent should also be connected through a non-saturated edge.
If there is no qualifying parent we remove the orphan from S or Tand make it a free node.
After the adoption stage is completed the algorithm returns to thegrowth stage. The algorithm terminates when the search trees S andT can not grow.
Meghshyam G. Prasad Graph Cuts for Image Segmentation
IntroductionEnergy Minimization
Min-cuts in Flow GraphsNormalized Graph Cuts
Summary
BK AlgorithmVPP Algorithm
Drawbacks of Boykov-Kolmogorov Algorithm
Provable time bound is weaker O(n3C), where n is the number ofnodes and C is the cost of minimum cut.
Nodes touched in growth/adoption is large as there is little controlover augmenting path lengths and the amount of flow pushed ineach path.
Total effort is spread over a very large number of flow augmentationiterations.
Meghshyam G. Prasad Graph Cuts for Image Segmentation
IntroductionEnergy Minimization
Min-cuts in Flow GraphsNormalized Graph Cuts
Summary
BK AlgorithmVPP Algorithm
Voronoi based Preflow Push Algorithm (VPP)
Algorithm based on push-relabel method.
Structure of Graph same as in B-K Algorithm.
Flows in t-links are set equal to their capacities, and in n-links thoseare set to zero.
Label the vertices other than s and t by their excesses(inflow − outflow), and delete all t-links.
Source-Sink max-flow problem is solved in the resultant flow graphby treating nodes with positive excesses as sources and those withnegative excesses as sinks.
All sinks are labeled as 0 and labels for sources are shortest distanceto a sink node on a sink cluster boundary.
Meghshyam G. Prasad Graph Cuts for Image Segmentation
IntroductionEnergy Minimization
Min-cuts in Flow GraphsNormalized Graph Cuts
Summary
BK AlgorithmVPP Algorithm
Major steps in VPP algorithm
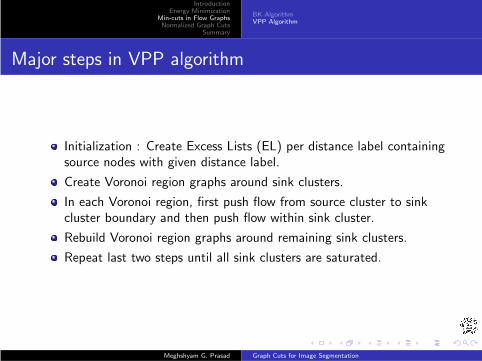
Initialization : Create Excess Lists (EL) per distance label containingsource nodes with given distance label.
Create Voronoi region graphs around sink clusters.
In each Voronoi region, first push flow from source cluster to sinkcluster boundary and then push flow within sink cluster.
Rebuild Voronoi region graphs around remaining sink clusters.
Repeat last two steps until all sink clusters are saturated.
Meghshyam G. Prasad Graph Cuts for Image Segmentation
IntroductionEnergy Minimization
Min-cuts in Flow GraphsNormalized Graph Cuts
Summary
BK AlgorithmVPP Algorithm
Voronoi Region Graphs
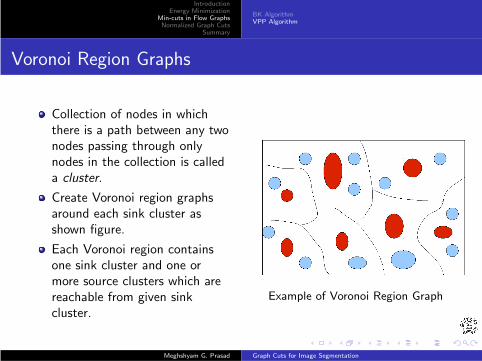
Collection of nodes in whichthere is a path between any twonodes passing through onlynodes in the collection is calleda cluster.
Create Voronoi region graphsaround each sink cluster asshown figure.
Each Voronoi region containsone sink cluster and one ormore source clusters which arereachable from given sinkcluster.
Example of Voronoi Region Graph
Meghshyam G. Prasad Graph Cuts for Image Segmentation

IntroductionEnergy Minimization
Min-cuts in Flow GraphsNormalized Graph Cuts
Summary
BK AlgorithmVPP Algorithm
Push Stage
Push flow happens in two phases.
In first phase, excess from sources is pushed to the boundaries ofsink cluster in topological order.
From a node, flow is pushed saturating the out edges till the nodehas no excess left or all out edges of the node get saturated.The saturated edges are deleted and a node whose all out-edges aredeleted is inserted in a list called Disconnected List(DL).
Second phase moves the excess (which is accumulated at boundarynodes of a sink cluster), inside the sink cluster.- It starts from those sink cluster boundary nodes with positiveexcess on them and pushes the excess inside the cluster in a breadthfirst manner.
Meghshyam G. Prasad Graph Cuts for Image Segmentation

IntroductionEnergy Minimization
Min-cuts in Flow GraphsNormalized Graph Cuts
Summary
BK AlgorithmVPP Algorithm
Rebuild Stage
A node v is put in disconnected list during the Push flow stagebecause all paths from v to the sink of a Voronoi region graph havebeen saturated.
Similarly, nodes in the Voronoi region graphs for which all paths to asink pass through nodes which are already put in DL are alsoeffectively disconnected.
Rebuild stage first identifies all such nodes whose distance labelsneed to be corrected.
Meghshyam G. Prasad Graph Cuts for Image Segmentation
IntroductionEnergy Minimization
Min-cuts in Flow GraphsNormalized Graph Cuts
Summary
BK AlgorithmVPP Algorithm
Rebuild Stage (cont.)
An augmenting path from a node v in DL(d) to a sink in the newresidual graph will necessarily have to pass through a node whichhas its path to sink intact.
If such path exists from node v will have to pass through a neighborw not in its out-edge list (in earlier push phase).
For such node w, its label d(w) was greater than or equal to d(v) inthe Voronoi region graph in which flow was pushed.
So, increase label of v to d(w) + 1.
Meghshyam G. Prasad Graph Cuts for Image Segmentation

IntroductionEnergy Minimization
Min-cuts in Flow GraphsNormalized Graph Cuts
Summary
BK AlgorithmVPP Algorithm
Example
Flow Graph states [2]
Sinks clusters are circles labeled A,B,C, and D. Rest of the circles aresource clusters.(a) : Four Voronoi regions corresponding to sink clusters A,B,C, and D.(b) : Thick dashed lines indicate saturated edges while dashed circlesshow the changes in sources and sink clusters.(c) : After Rebuild only three Voronoi regions are created correspondingto the remaining sink clusters.
Meghshyam G. Prasad Graph Cuts for Image Segmentation
IntroductionEnergy Minimization
Min-cuts in Flow GraphsNormalized Graph Cuts
Summary
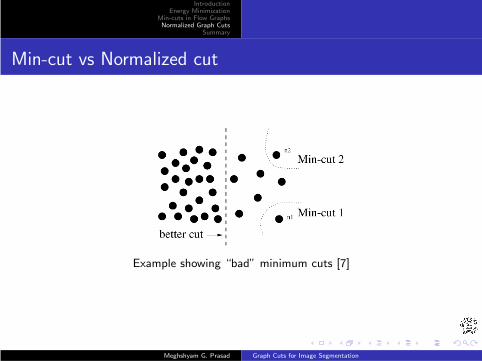
Min-cut vs Normalized cut
Example showing “bad” minimum cuts [7]
Meghshyam G. Prasad Graph Cuts for Image Segmentation

IntroductionEnergy Minimization
Min-cuts in Flow GraphsNormalized Graph Cuts
Summary
Normalized Cut
Normalized Cut is defined as,
Ncut(A,B) =cut(A,B)
assoc(A, V )+
cut(A,B)
assoc(B, V )
where assoc(A, V ) =∑
u∈A,t∈V w(u, t) measures overall association ofpartition A with whole graph.Similarly, normalized association within groups for a given partition is:
Nassoc(A,B) =assoc(A,A)
assoc(A, V )+
assoc(B,B)
assoc(B, V )
where assoc(A,A) and assoc(B,B) are total weights of edgesconnecting nodes within A and B, respectively.
⇒ Ncut(A,B) = 2−Nassoc(A,B)
Meghshyam G. Prasad Graph Cuts for Image Segmentation
IntroductionEnergy Minimization
Min-cuts in Flow GraphsNormalized Graph Cuts
Summary
Optimal Partition
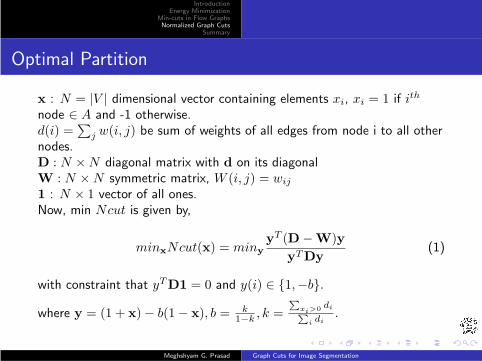
x : N = |V | dimensional vector containing elements xi, xi = 1 if ith
node ∈ A and -1 otherwise.d(i) =
∑
j w(i, j) be sum of weights of all edges from node i to all othernodes.D : N ×N diagonal matrix with d on its diagonalW : N ×N symmetric matrix, W (i, j) = wij
1 : N × 1 vector of all ones.Now, min Ncut is given by,
minxNcut(x) = miny
yT (D−W)y
yTDy(1)
with constraint that yTD1 = 0 and y(i) ∈ {1,−b}.
where y = (1 + x)− b(1− x), b = k1−k , k =
∑xi>0 di∑
i di.
Meghshyam G. Prasad Graph Cuts for Image Segmentation
IntroductionEnergy Minimization
Min-cuts in Flow GraphsNormalized Graph Cuts
Summary
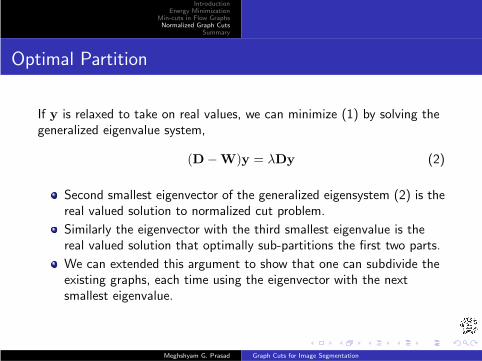
Optimal Partition
If y is relaxed to take on real values, we can minimize (1) by solving thegeneralized eigenvalue system,
(D−W)y = λDy (2)
Second smallest eigenvector of the generalized eigensystem (2) is thereal valued solution to normalized cut problem.
Similarly the eigenvector with the third smallest eigenvalue is thereal valued solution that optimally sub-partitions the first two parts.
We can extended this argument to show that one can subdivide theexisting graphs, each time using the eigenvector with the nextsmallest eigenvalue.
Meghshyam G. Prasad Graph Cuts for Image Segmentation
IntroductionEnergy Minimization
Min-cuts in Flow GraphsNormalized Graph Cuts
Summary
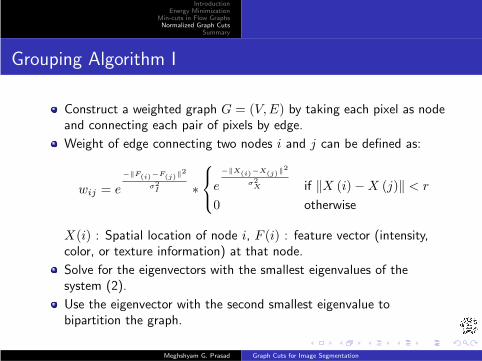
Grouping Algorithm I
Construct a weighted graph G = (V,E) by taking each pixel as nodeand connecting each pair of pixels by edge.
Weight of edge connecting two nodes i and j can be defined as:
wij = e
−‖F(i)−F(j)‖2
σ2I ∗
e
−‖X(i)−X(j)‖2
σ2X if ‖X (i)−X (j)‖ < r
0 otherwise
X(i) : Spatial location of node i, F (i) : feature vector (intensity,color, or texture information) at that node.
Solve for the eigenvectors with the smallest eigenvalues of thesystem (2).
Use the eigenvector with the second smallest eigenvalue tobipartition the graph.
Meghshyam G. Prasad Graph Cuts for Image Segmentation

IntroductionEnergy Minimization
Min-cuts in Flow GraphsNormalized Graph Cuts
Summary
Grouping Algorithm II
Decide if the current partition should be subdivided by checking thestability of the cut.
Meghshyam G. Prasad Graph Cuts for Image Segmentation
IntroductionEnergy Minimization
Min-cuts in Flow GraphsNormalized Graph Cuts
Summary
Summary I
Graph based methods are preferred over other approaches for solvingImage Segmentation problem.
In [4] new moves namely, α-β swap and α expansion were proposed.
These moves allow large number of pixels to change their label asopposed to single pixel changing its label in standard moves.
Min-cut problem is mainly solved by two methods: augmentingpaths or push-relabel.
Boykov-Kolmogorov [3] Algorithm has given an efficient way to findaugmenting path as we don’t have to start from scratch while findingnew augmenting path but use existing structure itself with minorarrangements.- Experimental Comparison done in [3] shows that this algorithmoutperforms standard algorithms (in terms of time taken).C. Arora et.al. [2] has proposed an algorithm namely “Voronoi basedPush Preflow”(VPP) based on Push-relabel method.
Meghshyam G. Prasad Graph Cuts for Image Segmentation

IntroductionEnergy Minimization
Min-cuts in Flow GraphsNormalized Graph Cuts
Summary
Summary II
VPP algorithm exploits structural properties inherent in imagegrid-graphs.It pushes flow in phases while relabeling is done only in globalmanner.It is observed[2] that number of nodes “touched” in each iterationreduces drastically which improves its time complexity significantlyover BK algorithm.
In [7], new approach called as “Normalized cuts” is proposed.
It focuses on extracting the global impression of an image rather thanfocusing on local features and their consistencies in the image data.Normalized cut criterion measures both the total dissimilaritybetween the different groups as well as the total similarity within thegroups.An efficient computational technique based on a generalizedeigenvalue problem can be used to optimize this criterion.
Meghshyam G. Prasad Graph Cuts for Image Segmentation
IntroductionEnergy Minimization
Min-cuts in Flow GraphsNormalized Graph Cuts
Summary
References I
[1] graph-tool.https://projects.skewed.de/graph-tool/doc/dev/flow.html.
[2] Chetan Arora, Subhashis Banerjee, Prem Kalra, and S. Maheshwari.An efficient graph cut algorithm for computer vision problems.In Computer Vision ECCV 2010, volume 6313 of Lecture Notes in
Computer Science, pages 552–565. Springer Berlin / Heidelberg,2010.
[3] Yuri Boykov and Vladimir Kolmogorov.An experimental comparison of min-cut/max-flow algorithms forenergy minimization in vision.IEEE Transactions on Pattern Analysis and Machine Intelligence,26:1124–1138, 2004.
Meghshyam G. Prasad Graph Cuts for Image Segmentation
IntroductionEnergy Minimization
Min-cuts in Flow GraphsNormalized Graph Cuts
Summary
References II
[4] Yuri Boykov, Olga Veksler, and Ramin Zabih.Fast approximate energy minimization via graph cuts.IEEE Transactions on Pattern Analysis and Machine Intelligence,23:1222–1238, 2001.
[5] Pedro F. Felzenszwalb and Daniel P. Huttenlocher.Efficient graph-based image segmentation.International Journal of Computer Vision, 59(2):167–182, 2004.
[6] Maria Murgasova, Leigh Dyet, David Edwards, Mary Rutherford,Jo Hajnal, and Daniel Rueckert.Segmentation of brain mri in young children.Academic Radiology, 14(11):1350 – 1366, 2007.
Meghshyam G. Prasad Graph Cuts for Image Segmentation

IntroductionEnergy Minimization
Min-cuts in Flow GraphsNormalized Graph Cuts
Summary
References III
[7] Jianbo Shi and Jitendra Malik.Normalized cuts and image segmentation.IEEE Transactions on Pattern Analysis and Machine Intelligence,22:888–905, 2000.
Meghshyam G. Prasad Graph Cuts for Image Segmentation