Global Analysis of Data on the Spin-orbit-coupled A1Î ...
20
Providence College Providence College DigitalCommons@Providence DigitalCommons@Providence Engineering & Physics Faculty Publications Engineering & Physics 2011 Global Analysis of Data on the Spin-orbit-coupled A1Σ+ and b3Πu Global Analysis of Data on the Spin-orbit-coupled A1 + and b3 u States of Cs2 States of Cs2 Seth T. Ashman Providence College, [email protected] J. Bai E H. Ahmed T. Bergeman Follow this and additional works at: https://digitalcommons.providence.edu/physics_fac Part of the Physics Commons Ashman, Seth T.; Bai, J.; Ahmed, E H.; and Bergeman, T., "Global Analysis of Data on the Spin-orbit-coupled A1Σ+ and b3Πu States of Cs2" (2011). Engineering & Physics Faculty Publications. 2. https://digitalcommons.providence.edu/physics_fac/2 This Article is brought to you for free and open access by the Engineering & Physics at DigitalCommons@Providence. It has been accepted for inclusion in Engineering & Physics Faculty Publications by an authorized administrator of DigitalCommons@Providence. For more information, please contact [email protected].
Transcript of Global Analysis of Data on the Spin-orbit-coupled A1Î ...
Providence College Providence College
DigitalCommons@Providence DigitalCommons@Providence
Engineering & Physics Faculty Publications Engineering & Physics
2011
Global Analysis of Data on the Spin-orbit-coupled A1Σ+ and b3Πu Global Analysis of Data on the Spin-orbit-coupled A1 + and b3 u
States of Cs2 States of Cs2
Seth T. Ashman Providence College, [email protected]
J. Bai
E H. Ahmed
T. Bergeman
Follow this and additional works at: https://digitalcommons.providence.edu/physics_fac
Part of the Physics Commons
Ashman, Seth T.; Bai, J.; Ahmed, E H.; and Bergeman, T., "Global Analysis of Data on the Spin-orbit-coupled A1Σ+ and b3Πu States of Cs2" (2011). Engineering & Physics Faculty Publications. 2. https://digitalcommons.providence.edu/physics_fac/2
This Article is brought to you for free and open access by the Engineering & Physics at DigitalCommons@Providence. It has been accepted for inclusion in Engineering & Physics Faculty Publications by an authorized administrator of DigitalCommons@Providence. For more information, please contact [email protected].
arX
iv:1
101.
5412
v1 [
phys
ics.
atom
-ph]
27
Jan
2011
Global analysis of data on the spin-orbit coupled A1Σ
+uand b3Π
ustates of Cs2
Jianmei Bai, E. H. Ahmed, B. Beser, Y. Guan, S. Kotochigova, and A. M. LyyraPhysics Department, Temple University, Philadelphia, PA 19122
S. Ashman,∗ C. M. Wolfe,† and J. HuennekensDepartment of Physics, Lehigh University, Bethlehem, Pennsylvania 18015
Feng Xie, Dan Li,‡ and Li LiDepartment of Physics and Key Lab of Atomic and Molecular Nanoscience, Tsinghua University, Beijing 100084, China
M. Tamanis and R. FerberLaser Center, Department of Physics, University of Latvia, 19 Rains Blvd., Riga LV-1586, Latvia
A. Drozdova, E. Pazyuk and A. V. Stolyarov§
Department of Chemistry, Moscow State University,GSP-2 Leninskie gory 1/3, Moscow 119992, Russia
J. G. Danzl and H.-C. NagerlInstitut fur Experimentalphysik und Zentrum fur Quantenphysik,
Universitat Innsbruck, Technikerstrasse 25, A-6020 Innsbruck, Austria
N. Bouloufa, O. Dulieu, and C. Amiot¶
Laboratoire Aime Cotton, CNRS, Universite Paris-Sud, Bat. 505, 91405 Orsay Cedex, France
H. Salami∗∗ and T. BergemanDepartment of Physics and Astronomy, SUNY, Stony Brook, NY 11794-3800
(Dated: January 31, 2011)
We present experimentally derived potential curves and spin-orbit interaction functions for thestrongly perturbed A1Σ+
u and b3Πu states of the cesium dimer. The results are based on data fromseveral sources. Laser-induced fluorescence Fourier transform spectroscopy (LIF FTS) was used sometime ago in the Laboratoire Aime Cotton primarily to study the X1Σ+
g state. More recent workat Tsinghua University provides information from moderate resolution spectroscopy on the lowestlevels of the b3Π±
0u states as well as additional high resolution data. From Innsbruck University,we have precision data obtained with cold Cs2 molecules. Recent data from Temple University wasobtained using the optical-optical double resonance polarization spectroscopy technique, and finally,a group at the University of Latvia has added additional LIF FTS data. In the Hamiltonian matrix,we have used analytic potentials (the Expanded Morse Oscillator form) with both finite-difference(FD) coupled-channels and discrete variable representation (DVR) calculations of the term values.Fitted diagonal and off-diagonal spin-orbit functions are obtained and compared with ab initioresults from Temple and Moscow State universities.
PACS numbers: 33.20.t,33.20.Kf,33.15.Pw,31.50.Df,31.15.aj
∗ Present address: Department of Physics and Astronomy, Univer-sity of Wisconsin - Stevens Point, Stevens Point, WI 54481
† Present address: Army Research Laboratory, RDRL-WMP-A,Aberdeen Proving Ground, MD 21005-5066
‡ Present address: State Key Laboratory of Precision Spectroscopyand Department of Physics, East China Normal University,Shanghai 200062
§ Email [email protected]¶ Retired from LAC
∗∗ Present address: Department of Physics, Faculty of Sciences (V),Lebanese University, Nabatieh, Lebanon
I. INTRODUCTION
The lowest electronically excited states of alkali dimersfor long have been of interest as gateway or ”window”states for the excitation of higher singlet or triplet lev-els [1]. Quite recently, various low excited states of al-kali dimers have also been used as intermediaries in theproduction of ultracold molecules, as for RbCs [2], LiCs[3], KRb [4–6], NaCs [7], Rb2 [8] and Cs2 [9–14]. Al-though molecules with electric dipole moments have at-tracted the most interest, homonuclear species, such asCs2, also offer the interesting conceptual challenge ofnon-spherically symmetric particles in a condensate [15].Furthermore the cold atoms can be prepared with fewer
2
lasers than required for dual species systems. Cold Cs2molecules may also be useful in experiments designed tobe sensitive to the electron:proton mass ratio, as dis-cussed in [16].
Various new possibilities inherent in cold moleculeshave prompted efforts to obtain and analyze the spectraof alkali dimer molecules. The lowest excited states abovethe 2S +2 S limit, namely the A1Σ+
(u) and b3Π(u) states
(where the ungerade designation applies only to homonu-clear species), would seem to be especially interesting inthis regard. However, transitions from the ground statemay require frequencies for which the availability of lasersources is limited. Furthermore, spin-orbit perturbativeinteractions between the A and b state levels complicatethe spectra. As a route to cold ground state moleculesfrom weakly bound molecules that are formed on a Fes-hbach resonance (FR), the A and b states of homonu-clear species do not have the special advantage of possibletriplet to singlet transfer which is possible in heteronu-clear species [17] which have no gerade/ungerade selectionrules. In view of these difficulties, it is noteworthy that,to date, only for Cs2 have the A and b states been usedas intermediates in the production of cold molecules [11–14]. The spin-orbit perturbations are somewhat moresevere in species containing Rb or Cs than in the A andb states of other alkali dimers. Nevertheless, with Cs2,Refs. [11–14] used the X1Σ+
g component of a weakly
bound molecule formed on a FR to excite to the A1Σ+u
component of an upper state level. Two two-photon stepswere used to efficiently connect the FR molecular state,via X(v = 73, J = 2) to X(v = 0, J = 0).
Recently, the methods available for analyzing andmodeling spectroscopic data on highly perturbed stateshave been extended [18–27] As is evident from the dis-cussion below, each effort to perform a ”global analy-sis” of all available data on these two electronic statesraises additional questions about what Hamiltonian ele-ments and functions are required, and what data is re-quired to determine the parameters so as to achieve afit with residuals comparable to experimental uncertain-ties. There has been impresssive progress in data acqui-sition and analysis for the heteronuclear A and b statesfrom work on NaK [28–32] to more recent work on NaRb[19, 23], NaCs [24], KCs [25, 26], and RbCs [21, 27]. ForNaRb, NaCs, and KCs, vibrational assignments of bothstates have been reliably determined, and the perturba-tive interactions have been modeled to an accuracy of0.01 cm−1 or better. Higher-order spin-orbit effects wereincluded in [24] and in [25], and there was quite goodagreement between empirically extracted and ab initiopotentials. Curiously, for one alkali dimer recently usedfor cold molecule work, namely KRb [4, 5], spectroscopicdata on low levels of the A1Σ+ and b3Π states appear tobe lacking, and optical state transfer processes leading tocold KRb molecules have used other pathways.There have also been a succession of studies of the
A and b states of the lighter homonuclear alkali dimerspecies Li2 [33–36], Na2 [22, 37–41], K2 [18, 20, 42–46]
and Rb2 [47, 48]. For Na2 [22], data now extend al-most continuously from the lowest vibrational levels tothe atomic limit.One question that arises when considering this sum-
mary of spectroscopic data on the A and b states of Cs2is why hyperfine structure (hfs) is not reported. Earlierwork [37] on the A and b states of Na2, using a molec-ular beam, and accessing levels with significant 3Π2u
character, showed hfs structure spanning several hun-dred MHz. The atomic hfs interaction of 133Cs is largerthan that of 23Na. Two of the techniques in the presentwork, namely optical-optical double resonance polariza-tion spectroscopy, and spectroscopy with cold groundstate Cs2 molecules, have very small inherent linewidths.Nevertheless, the transitions observed here are not ex-pected to exhibit hyperfine structure, as we discuss inSection VI below.This paper presents a detailed model of the energy
level structure of the A and b states of Cs2. In section II,we describe experimental techniques used to obtain highresolution spectra. Section III describes the model usedto fit the data. Section IV discusses presents ab initioresults for potentials and spin-orbit functions, calculatedfrom two different approaches. Section V discusses ra-diative properties of the A ∼ b complex, including cer-tain anomalies occurring for mixed singlet-triplet upperstates. Section VI discusses the possibilities for observ-ing hyperfine structure, while section VII gives a shortsummary and conclusion.
II. THE EXPERIMENTAL DATA
This report combines experimental data from severalsources. A substantial part comes from Fourier trans-form spectroscopy (FTS) performed in the LaboratoireAimee Cotton (LAC), Orsay, France, in connection withthe study of the Cs2 X1Σ+
g ground state as presented in[49, 50]. More recently, FTS data has been obtained atthe University of Latvia in Riga. Additional high resolu-tion data were obtained in Tsinghua University, Beijing,using fluorescence excitation spectroscopy. Another valu-able component of the data consists of fluorescence linesfrom the 23∆1g state [51], observed at Tsinghua Uni-versity, which provided information on the lowest vibra-tional levels of the b3Π0u state, of both parities, ±(−1)J .An ultra-high resolution data set, limited in absolute ac-curacy by wavelength meter calibration, was obtainedby excitation of cold Cs2 molecules at the University ofInnsbruck, covering a limited range of energies. Finally,because of a substantial gap in the above data on higherA/b levels, the Lyyra and Huennekens groups, workingat Temple University, employed optical-optical doubleresonance (OODR) polarization spectroscopy, with col-lisional orientation transfer as in [48], to partially fill inthis gap. Unlike the other data sets, the work at Tem-ple has not been published previously and therefore thediscussion is more detailed.
3
A. Data from Fourier transform spectroscopy
Many of the term values used in the present work arethe upper state levels from transitions observed in LACand reported in [49] and [50]. Cs atoms in a heat pipeoven at 600K were excited, in the 1987 study by an argon-ion laser, and in the 2002 work by a titanium-doped sap-phire (Ti:Sa) laser, pumped by an argon-ion laser. Thefluorescence in the backward direction was collected andsent into a Fourier spectrometer with a 2m optical pathlength difference. Wave numbers were calibrated by ref-erence to a xenon atomic transition near 3.5 µm, withabsolute uncertainties between 0.001 and 0.003 cm−1.For [50], 16,900 transitions were measured from 113 mainfluorescence series and 348 series including rotational re-laxation. The data are no longer available on the LACwebsite, but are posted in the EPAPS file associated withthis article [52].At the University of Latvia, FTS data on the A and
b states of Cs2 have been obtained recently in the pro-cess of analyzing the A/b→ X laser-induced fluorescence(LIF) spectra of KCs [25, 26] and RbCs [27] molecules. Inthese spectra, along with transitions in KCs and RbCs,the A/b→ X LIF spectra of Cs2 molecules were presentas well. In the experiments, the molecules were producedin a linear heat-pipe at about 565K temperature and ex-cited by diode lasers centered at 980nm, 1020nm and1050nm. The backward LIF spectra have been recordedby Fourier transform spectrometer IFS-125HR with 0.03cm−1 resolution. The transition frequencies obtained,with ca. 0.003 - 0.004 cm−1 accuracy, have been addedto the X state term values of Cs2 calculated with theX state potential of [50], corrected by [53]. The esti-mated overall uncertainty of term values, accounting forDoppler broadening, is about 0.01 cm−1.The relative LIF intensity distributions have been de-
termined in sufficiently lengthy progressions, accountingfor the spectral sensitivity of the InGaAs detector as de-scribed in Ref. [25]. For comparison with theory, theintensities were averaged over P,R doublet componentsand corrected for the spectral sensitivity of the detector.
B. Fluorescence excitation spectroscopy
This approach, employed at Tsinghua University, in-volved two-photon excitation to a higher state (3Πg or3∆g) from levels of the X1Σ+
g state via levels of the
A1Σ+u state, which was monitored by observing decay
(direct, or collision-induced) to the a3Σ+u state. After
the double resonance signal was found and optimized,the same 33Πg(v, J = J ′ + 1) [or 23∆g(v, J = J ′ + 1)]or 33Πg(v, J = J ′ − 1) [or 23∆g(v, J = J ′ − 1)] upperlevel was excited from A1Σ+
u (v′, J ′ +2) or A1Σ+
u (v′, J ′−
2) intermediate levels. Thus the term values of theA1Σ+
u (v′, J ′+2) orA1Σ+
u (v′, J ′−2) levels can be obtained
by adding the term values of the X1Σ+g (v
′′, J ′′ = J ′ + 1,
or J ′ + 3) or X1Σ+g (v
′′, J ′′ = J ′ − 1, or J ′ − 3) ground
levels [50] to the pump laser frequency with an accuracyof ∼0.003 cm−1.
C. Spectroscopic observations on cold Cs2molecules
As part of the effort at the University of Innsbruckto produce ultracold Cs2 molecules in the rovibronicground state near quantum degeneracy [11, 14], weaklybound molecules were formed by association of atoms ona Feshbach resonance in a high phase-space density sam-ple. Subsequently, two STIRAP transitions were usedto transfer the population to X(v = 0). A first pair oflasers linked the Feshbach level to the intermediate level,X(v = 73, J = 0 or J = 2), via an A/b excited statelevel near 12,500 cm−1. Unfortunately, in the presentstudy there were insufficient data points near the levelsaround 12,500 cm−1, so these term values could not beaccurately fit in our analysis.The second two-photon transition starting from the
X(v = 73) level involved an A/b intermediate level near10,000 cm−1. Spectroscopy on the first transition, asdescribed in detail in Ref. [13], was carried out by irradi-ating the Feshbach molecules for a given time with lightnear 1126 nm, stepping the laser frequency with eachcycle of the experiment. For spectroscopy near 10,000cm−1, molecules were first coherently transferred by STI-RAP to X(v = 73, J = 2), and then irradiated withlight near 1350 nm, as described in Ref. [12]. For de-tection, the molecules were transferred back to the orig-inal weakly bound state, dissociated, and the resultingatoms were imaged by absorption imaging. For STI-RAP, the lasers were stabilized to reach both a short-termlinewidth and long-term stability on the kHz level bylocking to optical resonators and additional referencing toa stabilized optical frequency comb. However, waveme-ter calibration was estimated to be 0.01 cm−1, presentinga limitation on the absolute frequency accuracy of thesetransitions. Ultimately, the radiative linewidth of per-haps 1 MHz would limit the resolution.Approximately 14 A/b levels excited from X state lev-
els near v=73 are included in the data set analyzed in thepresent work. These term values are listed in Table 1 of[12] in connection with an earlier version of the presentanalysis.
D. Fluorescence from higher-lying states
These data were obtained at Tsinghua University, andare taken from Ref. [51]. Two successive diode lasers,each of 5 MHz linewidth, were used to excite A1Σ+
u ←X1Σ+
g and 23∆1g ← A1Σ+u transitions. Fluorescence
from 23∆1g → b3Π0u was dispersed with a 0.85 m doublegrating Spex 1404 monochromator. The accuracy of thefluorescence lines was estimated to be about 1.5 cm−1,with some better and others worse.
4
E. Data from OODR polarization spectoscopy,facilitated by collisional molecular orientation
transfer
V-type optical-optical double-resonance (OODR) po-larization spectroscopy was performed at Temple Uni-versity to obtain data on mixed A/b levels in a region ofenergy not studied previously. Among different types ofpolarization spectroscopy [54–57], this technique is wellsuited to observe selected transitions in the congestedspectra of Cs2 since in the single-laser based sub-Dopplerexperiments, the assignment of spectral lines is not triv-ial. Furthermore, collisional transfer of orientation pro-duces a series of well-separated spectral lines associatedwith nearby levels that have been oriented and polarized.Another possible approach might be optical triple reso-nance, as used for Li2 [36], Na2 [40], and K2 [44, 45].This approach would overcome the unfavorable Franck-Condon factors mentioned below, but would not yield therange of J values obtained in the present work, since opti-mization of signal to noise through cooling of the samplemolecules would probably be necessary.
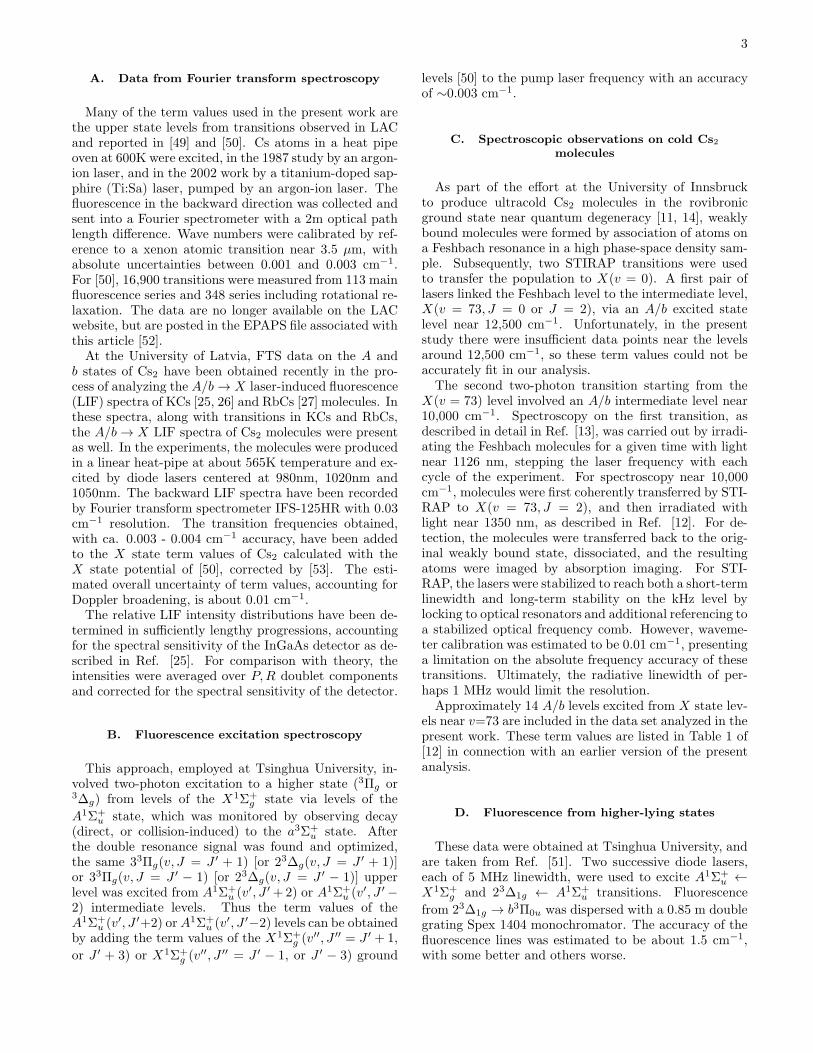
As in previous implementations of this technique (see[48] and [22] and references therein), a circularly polar-ized pump laser beam, tuned to a chosen transition, cre-ates an anisotropic distribution of magnetic sublevel pop-ulations (net orientation) in one or more ground staterovibrational levels. The counterpropagating linearly po-larized probe laser beam can be considered to be made upof equal parts left and right circular polarization. Whenthe probe frequency is tuned to a transition sharing ei-ther level with the pump transition, the orientation cre-ated by the pump causes the two circularly polarizedprobe components to experience different absorption co-efficients (circular dichroism) and different indices of re-fraction (circular birefringence). Consequently, when theprobe beam exits the oven, the two components no longersum to the initial linear polarization, but rather the beamhas a slight elliptical polarization and some fraction of itis transmitted through a final crossed linear polarizer be-fore reaching the detector. Figure 1 shows schematicallythe transitions in this technique. More information onthe C1Πu state is available from the potentials shown inFig. 5. A representation of the apparatus is shown in[22]. The experimental setup used here was similar tothe one used previously for Rb2 [48].
Collisional lines help to expand the data field but canonly be observed if orientation is transferred from theground state level labeled by the pump laser to a neigh-boring level. A quantitative study of the transfer of pop-ulation and orientation in collisions of NaK moleculeswith argon and potassium atoms has been carried outand reported in [58] and [59]. These references discussthe transfer of orientation following the discussion of Ref.[60], and also present a complete analysis of polarizationspectroscopy line shapes, extending the textbook presen-tation in [61].
In our experiments, the Cs2 metal was loaded at the
center of a five-arm heat pipe oven, which was keptat a temperature of 550 K, with 3 Torr Argon buffergas. A CR-699-29 tunable single mode laser with Ki-ton Red 620 dye was used as the circularly polarizedpump laser, tuned to known [62] Cs2 C1Πu(v
′, J ′± 1)←X1Σ+
g (v′′, J ′′) transitions. A CR-899-29 Ti-Sapphire sin-
gle mode laser served as the linearly polarized probe laser.The two lasers were counter-propagating and overlappedin the center of the heatpipe with a crossing angle thatwas minimized so as to maximize the overlap area. Thepower of the pump (probe) laser was 100mW (20mW) infront of the heatpipe. The spot sizes (defined as a ra-dius at 1/e2 intensity) of the pump (1.2 mm) and probe(0.9mm) laser beams in the interaction region were mea-sured with a razor blade technique [64]. Two lenses wereplaced in the path of each laser beam for collimation in-side the heatpipe.
A Glan Thompson linear polarizer and a λ/4 Babinet-Soleil compensator from Karl Lambrecht Corp. [63] wereused to make the pump beam circularly polarized. Twolinear polarizers in the probe laser beam path (one beforeand one after the heat pipe oven) had relative transmis-sion axes at a 90 degree angle for maximum extinction ofthe probe laser when it was off resonance. A power meter(Coherent LabMax TO) with a sensitive detector (LM-2)placed after the second polarizer was used to make fineadjustments of the orientation of the second polarizer tocreate an optimal extinction ratio of 10−6 (and then re-moved for data acquisition). The observed ratio includeseffects of window birefringence and circular dichroism.A photomultiplier tube (Hamamatsu R636-10) detectedthe polarization signal. Its output was amplified usinga lock-in amplifier (Stanford Research Systems SR 850)for phase sensitive detection. The pump laser was modu-lated at a frequency of 980 Hz using a mechanical chopper(Stanford Research Systems SR 540).
The pump laser was calibrated using an iodine atlas[65, 66], with estimated accuracy of ∼0.004 cm−1. TheTi:Sapphire laser was calibrated by comparing optogal-vanic spectroscopy signals from a uranium lamp to linepositions in the uranium atlas [67] when it scanned above11000 cm−1. The listed wavenumbers in the Uraniumatlas are accurate to ±0.003 cm−1. A Burleigh 1600wavemeter and BOMEM DA8 FTIR were used to cal-ibrate the Ti:Sapphire frequency when it scanned below11000 cm−1. The calibrated wavenumbers of the exper-imental peaks were added to the term values of theircorresponding ground state levels, calculated from theDunham parameters of [50], to get the A/b state termvalues.
Because the Franck-Condon factors for transitions ofinterest were weaker by a factor of 100 in Cs2 than forthe Rb2 lines in [48], the signal to noise ratio was smallerand fewer collisional satellites were observed than withRb2 (∆J ≤ 12 rather than ≤ 58). Also, due to spectralcongestion in Cs2, the pump transitions were difficult toisolate. Some of the pump transitions were confirmed byanalyzing the resolved fluorescence recorded by a SPEX
5
model 1404 0.85 m dual grating monochromator. Otherpump transitions were confirmed by scanning the pumplaser while the probe laser was tuned to a previously as-signed collisional peak.26 different C ← X transitions (ground state 3 ≤ v ≤ 8
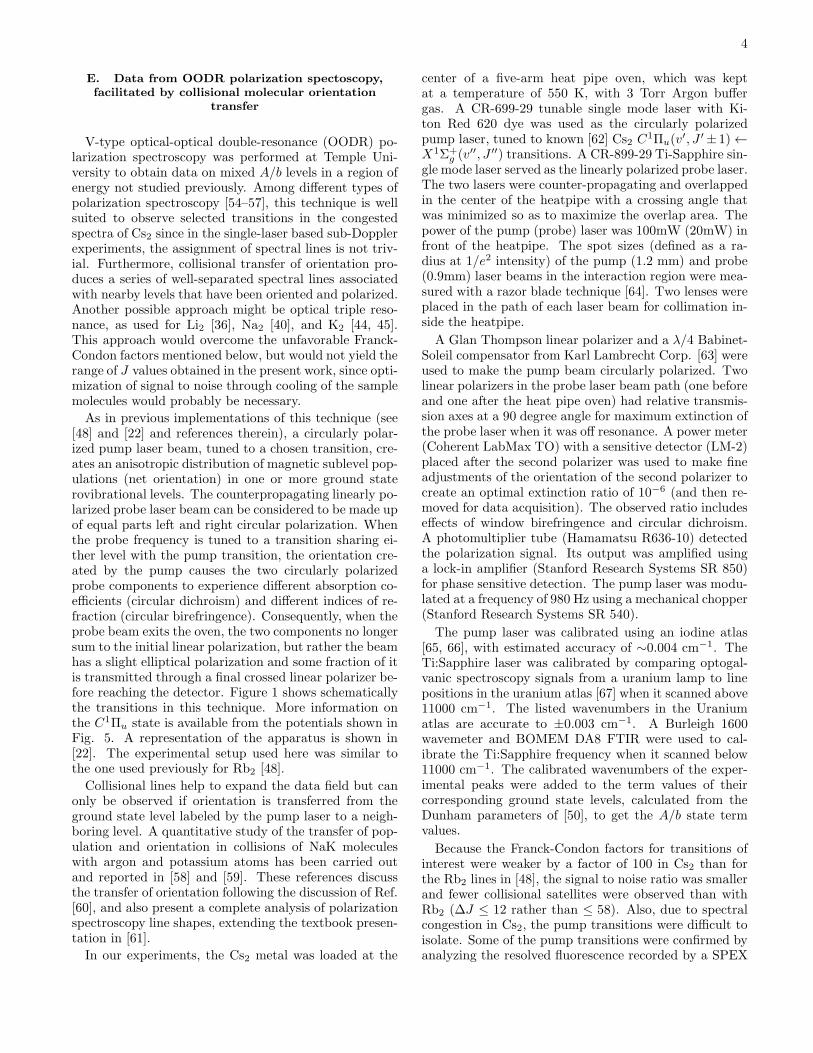
and 52 ≤ J ≤ 121) were confirmed and 20 of them servedas pump transitions in the experiment presented in thiswork. These transitions are listed in the EPAPS file [52].Figure 2 shows one OODR polarization spectroscopy
data scan. For homonuclear molecules, the selection rulefor collisions is ∆J = even due to the symmetry proper-ties of the nuclear spin wavefunctions (for states that arenot parity doubled). However, in the case shown in Fig.2, the C1Πu and X1Σ+
g rotational spacings are such that
two pump transitions C1Πu(7, 73) − X1Σ+g (6, 74) and
C1Πu(7, 72)−X1Σ+g (6, 73) overlap within their Doppler
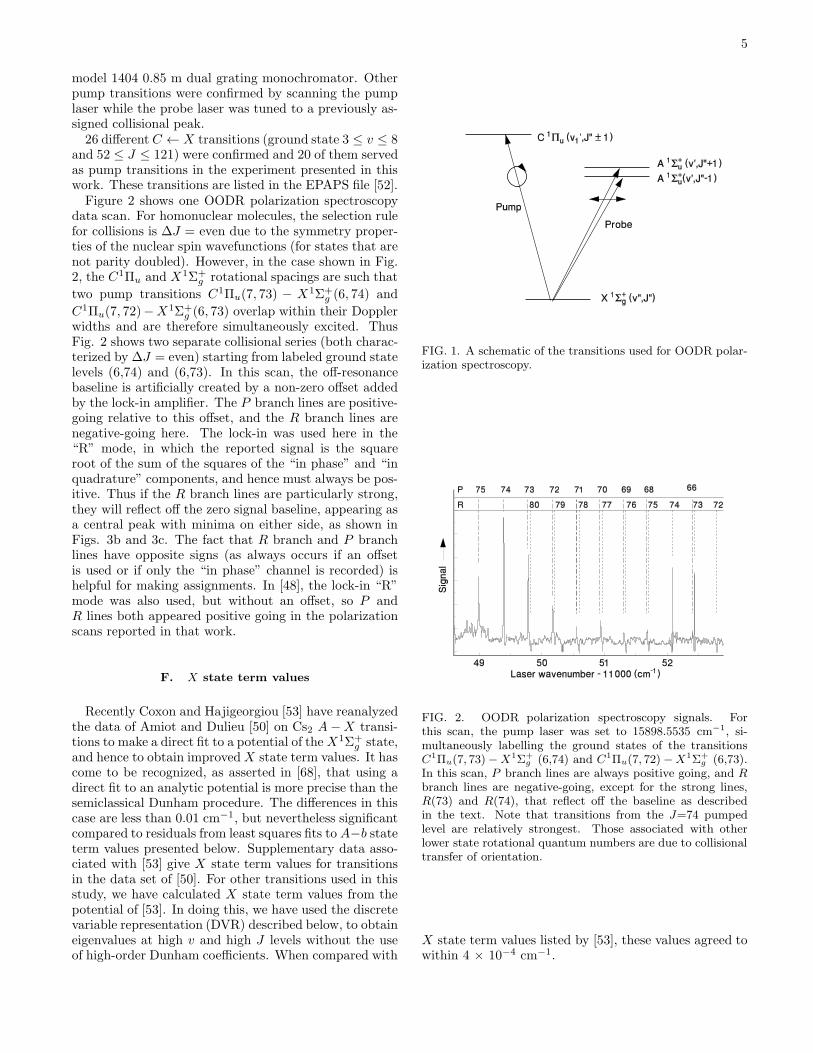
widths and are therefore simultaneously excited. ThusFig. 2 shows two separate collisional series (both charac-terized by ∆J = even) starting from labeled ground statelevels (6,74) and (6,73). In this scan, the off-resonancebaseline is artificially created by a non-zero offset addedby the lock-in amplifier. The P branch lines are positive-going relative to this offset, and the R branch lines arenegative-going here. The lock-in was used here in the“R” mode, in which the reported signal is the squareroot of the sum of the squares of the “in phase” and “inquadrature” components, and hence must always be pos-itive. Thus if the R branch lines are particularly strong,they will reflect off the zero signal baseline, appearing asa central peak with minima on either side, as shown inFigs. 3b and 3c. The fact that R branch and P branchlines have opposite signs (as always occurs if an offsetis used or if only the “in phase” channel is recorded) ishelpful for making assignments. In [48], the lock-in “R”mode was also used, but without an offset, so P andR lines both appeared positive going in the polarizationscans reported in that work.
F. X state term values
Recently Coxon and Hajigeorgiou [53] have reanalyzedthe data of Amiot and Dulieu [50] on Cs2 A−X transi-tions to make a direct fit to a potential of theX1Σ+
g state,and hence to obtain improvedX state term values. It hascome to be recognized, as asserted in [68], that using adirect fit to an analytic potential is more precise than thesemiclassical Dunham procedure. The differences in thiscase are less than 0.01 cm−1, but nevertheless significantcompared to residuals from least squares fits to A−b stateterm values presented below. Supplementary data asso-ciated with [53] give X state term values for transitionsin the data set of [50]. For other transitions used in thisstudy, we have calculated X state term values from thepotential of [53]. In doing this, we have used the discretevariable representation (DVR) described below, to obtaineigenvalues at high v and high J levels without the useof high-order Dunham coefficients. When compared with
FIG. 1. A schematic of the transitions used for OODR polar-ization spectroscopy.
FIG. 2. OODR polarization spectroscopy signals. Forthis scan, the pump laser was set to 15898.5535 cm−1, si-multaneously labelling the ground states of the transitionsC1Πu(7, 73)−X1Σ+
g (6,74) and C1Πu(7, 72)−X1Σ+g (6,73).
In this scan, P branch lines are always positive going, and Rbranch lines are negative-going, except for the strong lines,R(73) and R(74), that reflect off the baseline as describedin the text. Note that transitions from the J=74 pumpedlevel are relatively strongest. Those associated with otherlower state rotational quantum numbers are due to collisionaltransfer of orientation.
X state term values listed by [53], these values agreed towithin 4 × 10⁻⁴ cm−1.
6
FIG. 3. OODR polarization spectroscopy line shapes for theparticular conditions used in the present experiments. In eachpanel, there is a positive-going P line and an R line. In (a),the R line is weak and entirely negative-going. In (b) and (c),the R line is stronger and reflects off the zero signal baseline,producing a double minimum line shape. The vertical scalevaries between parts (a)-(c), as can be seen by comparisonwith the previous figure.
G. Summary of the data
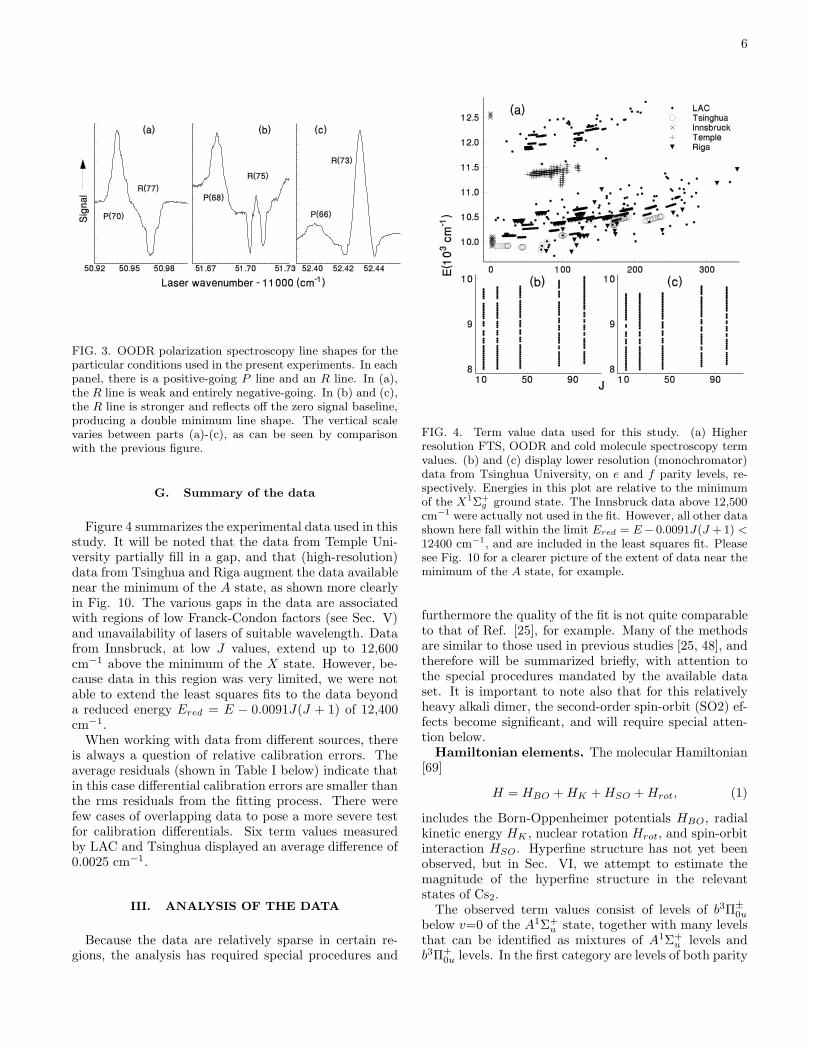
Figure 4 summarizes the experimental data used in thisstudy. It will be noted that the data from Temple Uni-versity partially fill in a gap, and that (high-resolution)data from Tsinghua and Riga augment the data availablenear the minimum of the A state, as shown more clearlyin Fig. 10. The various gaps in the data are associatedwith regions of low Franck-Condon factors (see Sec. V)and unavailability of lasers of suitable wavelength. Datafrom Innsbruck, at low J values, extend up to 12,600cm−1 above the minimum of the X state. However, be-cause data in this region was very limited, we were notable to extend the least squares fits to the data beyonda reduced energy Ered = E − 0.0091J(J + 1) of 12,400cm−1.When working with data from different sources, there
is always a question of relative calibration errors. Theaverage residuals (shown in Table I below) indicate thatin this case differential calibration errors are smaller thanthe rms residuals from the fitting process. There werefew cases of overlapping data to pose a more severe testfor calibration differentials. Six term values measuredby LAC and Tsinghua displayed an average difference of0.0025 cm−1.
III. ANALYSIS OF THE DATA
Because the data are relatively sparse in certain re-gions, the analysis has required special procedures and
FIG. 4. Term value data used for this study. (a) Higherresolution FTS, OODR and cold molecule spectroscopy termvalues. (b) and (c) display lower resolution (monochromator)data from Tsinghua University, on e and f parity levels, re-spectively. Energies in this plot are relative to the minimumof the X1Σ+
g ground state. The Innsbruck data above 12,500cm−1 were actually not used in the fit. However, all other datashown here fall within the limit Ered = E− 0.0091J(J +1) <12400 cm−1, and are included in the least squares fit. Pleasesee Fig. 10 for a clearer picture of the extent of data near theminimum of the A state, for example.
furthermore the quality of the fit is not quite comparableto that of Ref. [25], for example. Many of the methodsare similar to those used in previous studies [25, 48], andtherefore will be summarized briefly, with attention tothe special procedures mandated by the available dataset. It is important to note also that for this relativelyheavy alkali dimer, the second-order spin-orbit (SO2) ef-fects become significant, and will require special atten-tion below.Hamiltonian elements. The molecular Hamiltonian
[69]
H = HBO +HK +HSO +Hrot, (1)
includes the Born-Oppenheimer potentials HBO, radialkinetic energy HK , nuclear rotation Hrot, and spin-orbitinteraction HSO. Hyperfine structure has not yet beenobserved, but in Sec. VI, we attempt to estimate themagnitude of the hyperfine structure in the relevantstates of Cs2.The observed term values consist of levels of b3Π±
0u
below v=0 of the A1Σ+u state, together with many levels
that can be identified as mixtures of A1Σ+u levels and
b3Π+0u levels. In the first category are levels of both parity
7
(−1)J (e symmetry) and parity −(−1)J (f symmetry).Overall, only a few levels were found to have significant3Π1 character and no levels with significant 3Π2 characterwere identified. In view of the very limited informationon the 3Π1 levels, our 3Π0 potential contains the spin-orbit function implicitly. When 3Π1 and 3Π2 levels areconsidered, the matrix elements of HBO +HSO +Hrot +HSO2 are [69]:
〈1Σ+u |H |1Σ+
u 〉 = UA + (x+ 2)B + Uso2A
〈3Π+0u|H |3Π+
0u〉 = U+b0 + (x+ 2)B + Uso2
b0e
〈3Π−0u|H |3Π−
0u〉 = U−b0 + (x+ 2)B + Uso2
b0f
〈3Π1u|H |3Π1u〉 = U+b0 + (x+ 2)B + ξsob10
〈3Π2u|H |3Π2u〉 = U+b0 + (x− 2)B + ξsob10 + ξsob21
〈1Σ+u |H |3Π+
0u〉 = −√2ξsoAb0 (2)
〈3Π0u|H |3Π1u〉 = −√2xB
〈3Π1u|H |3Π2u〉 = −√
2(x− 2)B
〈1Σ+u |H |3Π1u〉 = −
√2xBη
where x = J(J+1), andHT = H , whereHT is the trans-pose of H . In the above, the potentials, UA, and U±
b0, aswell as the spin-orbit functions, ξsoAb0 (off-diagonal) and
ξsob10, ξsob21 (on-diagonal); and also B ≡ h2/2µr2 are func-
tions of internuclear distance r (µ is the reduced mass).ξsob10 is the Ω = 1 − 0+ interval of the b state, and ξsob21is the Ω = 2 − 1 interval. Both ξsob10 and ξsob21 functionsinclude the SO2 effect implicitly. The parameter η arisesfrom second-order spin-orbit and electronic-rotational ef-fects, as discussed in [24].The second-order spin-orbit (SO2) terms in the above
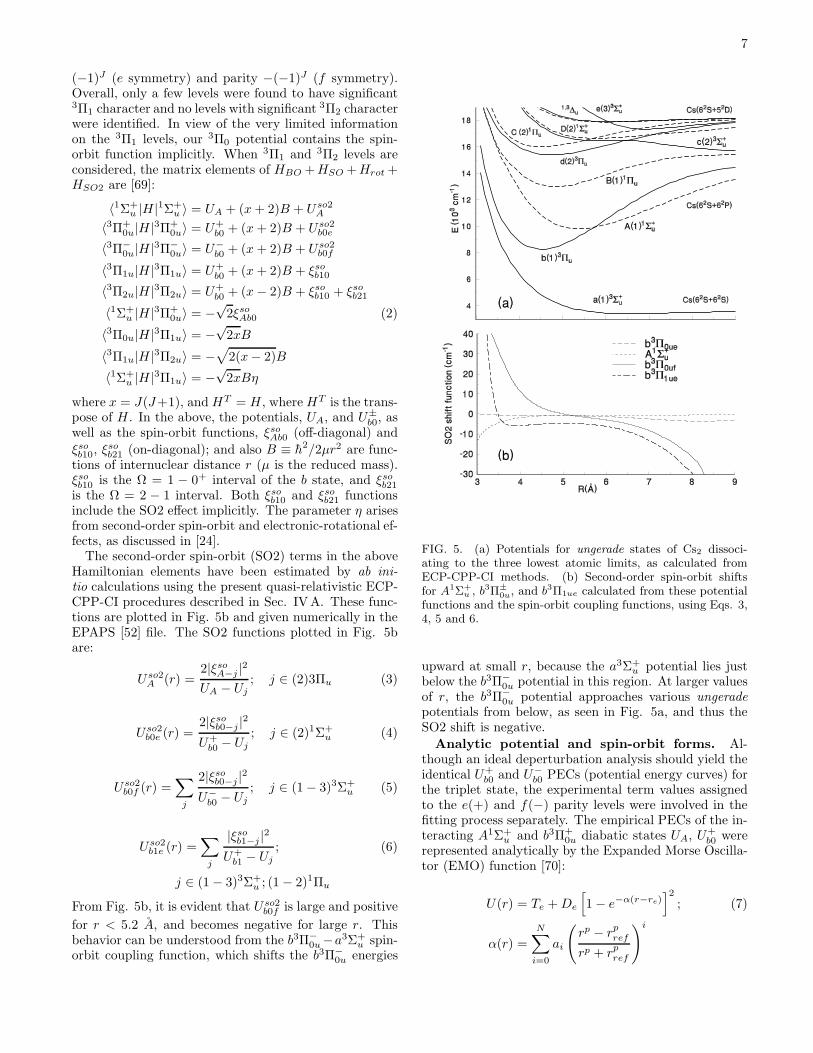
Hamiltonian elements have been estimated by ab ini-tio calculations using the present quasi-relativistic ECP-CPP-CI procedures described in Sec. IVA. These func-tions are plotted in Fig. 5b and given numerically in theEPAPS [52] file. The SO2 functions plotted in Fig. 5bare:
Uso2A (r) =
2|ξsoA−j |2UA − Uj
; j ∈ (2)3Πu (3)
Uso2b0e (r) =
2|ξsob0−j |2
U+b0 − Uj
; j ∈ (2)1Σ+u (4)
Uso2b0f (r) =
∑
j
2|ξsob0−j |2
U−b0 − Uj
; j ∈ (1− 3)3Σ+u (5)
Uso2b1e (r) =
∑
j
|ξsob1−j |2
U+b1 − Uj
; (6)
j ∈ (1− 3)3Σ+u ; (1− 2)1Πu
From Fig. 5b, it is evident that Uso2b0f is large and positive
for r < 5.2 A, and becomes negative for large r. Thisbehavior can be understood from the b3Π−
0u−a3Σ+u spin-
orbit coupling function, which shifts the b3Π−0u energies
FIG. 5. (a) Potentials for ungerade states of Cs2 dissoci-ating to the three lowest atomic limits, as calculated fromECP-CPP-CI methods. (b) Second-order spin-orbit shiftsfor A1Σ+
u , b3Π±
0u, and b3Π1ue calculated from these potentialfunctions and the spin-orbit coupling functions, using Eqs. 3,4, 5 and 6.
upward at small r, because the a3Σ+u potential lies just
below the b3Π−0u potential in this region. At larger values
of r, the b3Π−0u potential approaches various ungerade
potentials from below, as seen in Fig. 5a, and thus theSO2 shift is negative.
Analytic potential and spin-orbit forms. Al-though an ideal deperturbation analysis should yield theidentical U+
b0 and U−b0 PECs (potential energy curves) for
the triplet state, the experimental term values assignedto the e(+) and f(−) parity levels were involved in thefitting process separately. The empirical PECs of the in-teracting A1Σ+
u and b3Π+0u diabatic states UA, U
+b0 were
represented analytically by the Expanded Morse Oscilla-tor (EMO) function [70]:
U(r) = Te +De
[
1− e−α(r−re)]2
; (7)
α(r) =
N∑
i=0
ai
(
rp − rprefrp + rpref
)i
8
converging to the appropriate dissociation limit, namely:TAe = Tdis − DA
e for the the singlet A-state and T b0e =
Tdis − ξsoCs −Db0e for the Ω = 0 sub-state of the triplet b-
state. Here ξsoCs ≡ [E62P3/2−E62P1/2
]/3 = 184.6797 cm−1
is the empirical spin-orbit constant of the Cs atom in the62P state [72] while Tdis = DX
e +E62P−E62S is the energyof the center of gravity of the Cs(62P) doublet (withouthfs splitting) relative to the minimum of the X state po-tential. From [72] E62P −E62S = 11547.6275 cm−1. Thedissociation energy of the ground state (for the hfs center-of-gravity)DX
e = 3650.0299(14) cm−1 from Ref.[11], tak-ing into account a correction of -0.0022 cm−1 for the en-ergies of X(v = 71− 73) levels, following [53]. Thus Tdis
= 15197.6574 cm−1. Note that because of the Uso2A and
Uso2b0 terms, the effective potential minima differ from the
fitted Te values.Both off-diagonal ξsoAb0 and on-diagonal ξsob10, ξ
sob21 em-
pirical spin-orbit coupling functions were approximatedby the Hulburt-Hirschfelder (HH) potential [73]
ξso(r) = ξsoCs −Dsoe
[
2e−x − e−2x[1 + cx3(1 + bx)]]
;(8)
x = a (r/rsoe − 1)
determined by the five fitted parameters Dsoe , rsoe , a, b
and c.The initial EMO and HH parameters of the relevant
PECs and SO functions were estimated using the presentquasi-relativistic ECP-CPP-CI electronic structure cal-culation. The refined parameters of the PECs and SOcoupling functions ξsoAb0 and ξsob10 were determined iter-atively using a weighted nonlinear least-square fitting(NLSF) procedure. As there were not data on b3Π2u,the initial ab initio estimate for ξsob21 was used in the leastsquares fits.Fitting procedures. The spin-orbit coupling func-
tion between the A1Σ+u and b3Π+
0u states of Cs2 is largerthan the vibrational intervals, thus requiring carefultreatment of perturbative interactions. Initially, the leastsquares fitting was performed with a 2×2 Hamiltonianmatrix, including simply the Ω = 0+ manifolds and theoff-diagonal spin-orbit coupling term, ξsoAb0. The 2 chan-nel fit was crucial in determining nearly final potentials.The details of the robust fitting procedure used are givenelsewhere [24, 25]. Next a 3 × 3 Hamiltonian included3Π1 levels and ξsob10. Final fits were made with a 4 channelHamiltonian and ξsob21. Although 3Π2 components werenot directly observed, they affected the fitted parame-ters through the terms coupling with 3Π1 and thus indi-rectly to 3Π+
0 . These multi-channel calculations utilizedboth finite-difference (FD) and discrete variable repre-sentation (DVR) approaches. For additional details onthe FD and DVR numerical methods, please see [24] and[48], respectively. It was determined that if identical po-tential and spin-orbit functions are used, the eigenvaluesobtained from the FD and DVR methods are in excellentagreement.Fitted parameters, potentials, spin-orbit func-
tions, and term values. The e parity term value datawas fit with 12(8) potential parameters, ai in Eq. 7, for
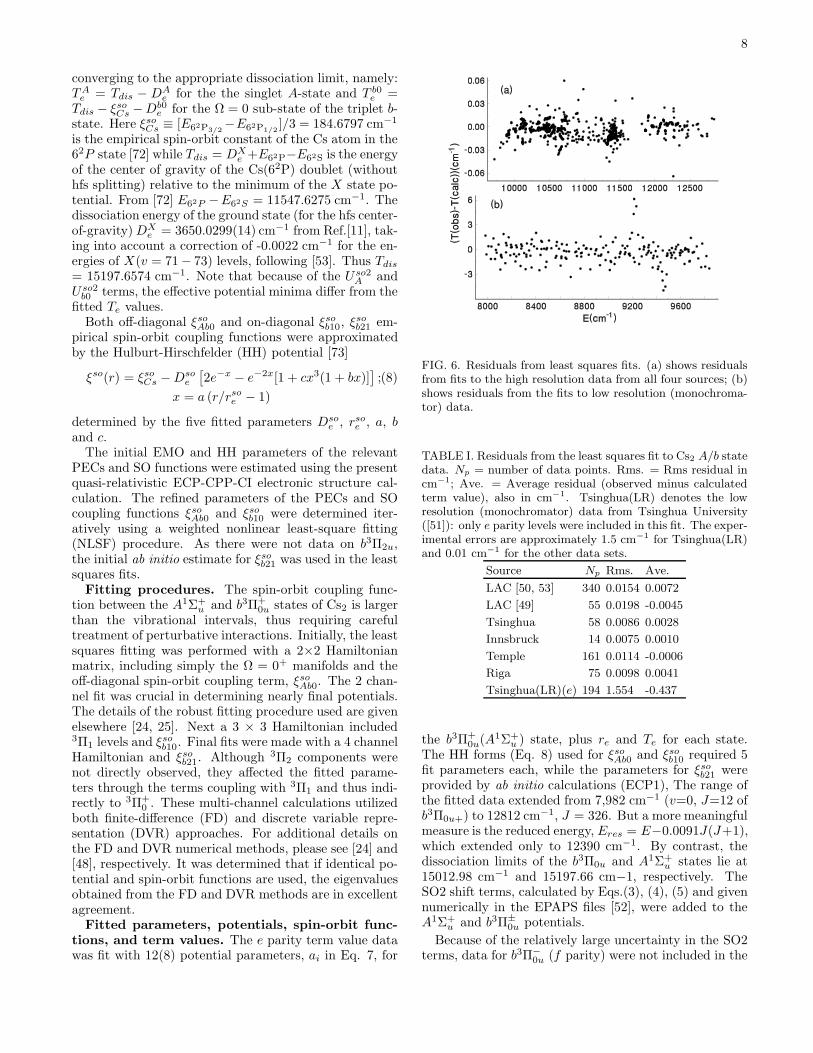
FIG. 6. Residuals from least squares fits. (a) shows residualsfrom fits to the high resolution data from all four sources; (b)shows residuals from the fits to low resolution (monochroma-tor) data.
TABLE I. Residuals from the least squares fit to Cs2 A/b statedata. Np = number of data points. Rms. = Rms residual incm−1; Ave. = Average residual (observed minus calculatedterm value), also in cm−1. Tsinghua(LR) denotes the lowresolution (monochromator) data from Tsinghua University([51]): only e parity levels were included in this fit. The exper-imental errors are approximately 1.5 cm−1 for Tsinghua(LR)and 0.01 cm−1 for the other data sets.
Source Np Rms. Ave.
LAC [50, 53] 340 0.0154 0.0072
LAC [49] 55 0.0198 -0.0045
Tsinghua 58 0.0086 0.0028
Innsbruck 14 0.0075 0.0010
Temple 161 0.0114 -0.0006
Riga 75 0.0098 0.0041
Tsinghua(LR)(e) 194 1.554 -0.437
the b3Π+0u(A
1Σ+u ) state, plus re and Te for each state.
The HH forms (Eq. 8) used for ξsoAb0 and ξsob10 required 5fit parameters each, while the parameters for ξsob21 wereprovided by ab initio calculations (ECP1), The range ofthe fitted data extended from 7,982 cm−1 (v=0, J=12 ofb3Π0u+) to 12812 cm
−1, J = 326. But a more meaningfulmeasure is the reduced energy, Eres = E−0.0091J(J+1),which extended only to 12390 cm−1. By contrast, thedissociation limits of the b3Π0u and A1Σ+
u states lie at15012.98 cm−1 and 15197.66 cm−1, respectively. TheSO2 shift terms, calculated by Eqs.(3), (4), (5) and givennumerically in the EPAPS files [52], were added to theA1Σ+
u and b3Π±0u potentials.
Because of the relatively large uncertainty in the SO2terms, data for b3Π−
0u (f parity) were not included in the
9
fit.
The quality of the final fit to the e parity data is in-dicated by the plotted residuals in Fig. 6, and displayedfor the individual data sets in Table I. Table II gives thefitted potential parameters together with results from abinitio ECP-CPP-CI calculations. Table III gives parame-ters for the empirical off-diagonal and diagonal spin-orbitfunctions. Figure 7 displays the empirical potentials forthe A1Σ+
u and b3Π+0u states over the range of the data,
namely up to 12,400 cm−1 above the minimum of the Xstate.
Numerical values for the potentials and spin-orbit func-tions, parameter listings, calculated term values andcomparisons between calculated and observed term val-ues, and several plots of calculated and observed termvalues are all given in the EPAPS files [52].
It should be noted that in fitting the data for +(e) par-ity levels from the Tsinghua monochromator (low resolu-tion) data, it was found that assigning certain terms to3Π2u rather than 3Π+
0u reduced the residuals. Ultimately,such assignments were not accepted because they violateknown selection rules for pure (a) Hund’s coupling case.The larger residuals obtained when these levels were as-signed to 3Π+
0u may be associated with the low intensitiesof some of the lines as noted in Ref. [51], or they maybe associated with breakdown of Hund’s case a selectionrules due to spin-orbit effects.
The off-diagonal spin-orbit function ξsoAb0 connectingA1Σ+
u and b3Π+0u states is determined empirically from
the perturbation crossings. The fitted parameters aregiven in Table III, and the fitted function is plotted inFig.8, together with ab initio functions for which the com-putational methods are discussed below. The fitted ξsoAb0function is primarily determined by its value at the po-tential crossing point, denoted rx in this figure. It issatisfying that at rx, the fitted function is indeed closeto all three ab initio functions plotted also in this figure.For other values of r, there are significant differences.
The fine structure splitting between the b3Π0 and b3Π1
potentials could be deduced from the presently availabledata only from a few regions of avoided crossings in therotational progressions. We have found four such cases,three of which are shown in Fig. 9. From these deviationsin the rotational level energies, we have fit the parameters(see Table III) that characterize the fine structure inter-val. The fitted ξsob10 function and an ab initio result areplotted in Fig. 8. The minimum of this empirical fine-structure splitting function is approximately 139 cm−1,as compared with the minima of the analogous functionsfor RbCs and KCs, reported to be 71.4 cm−1 [27] and78.26 cm−1 [25], respectively, both based on more com-plete b3Π1 data than is presently available for Cs2. TheECP-CPP-CI ab initio spin-orbit functions happen to bein good agreement with the empirical function. It shouldbe noted that fits of comparable quality were obtainedwith an empirical ξsob10 function exhibiting a minimumof ≈ 120 cm−1, hence with a different vibrational num-bering for the b3Π1u manifold. The preference for the
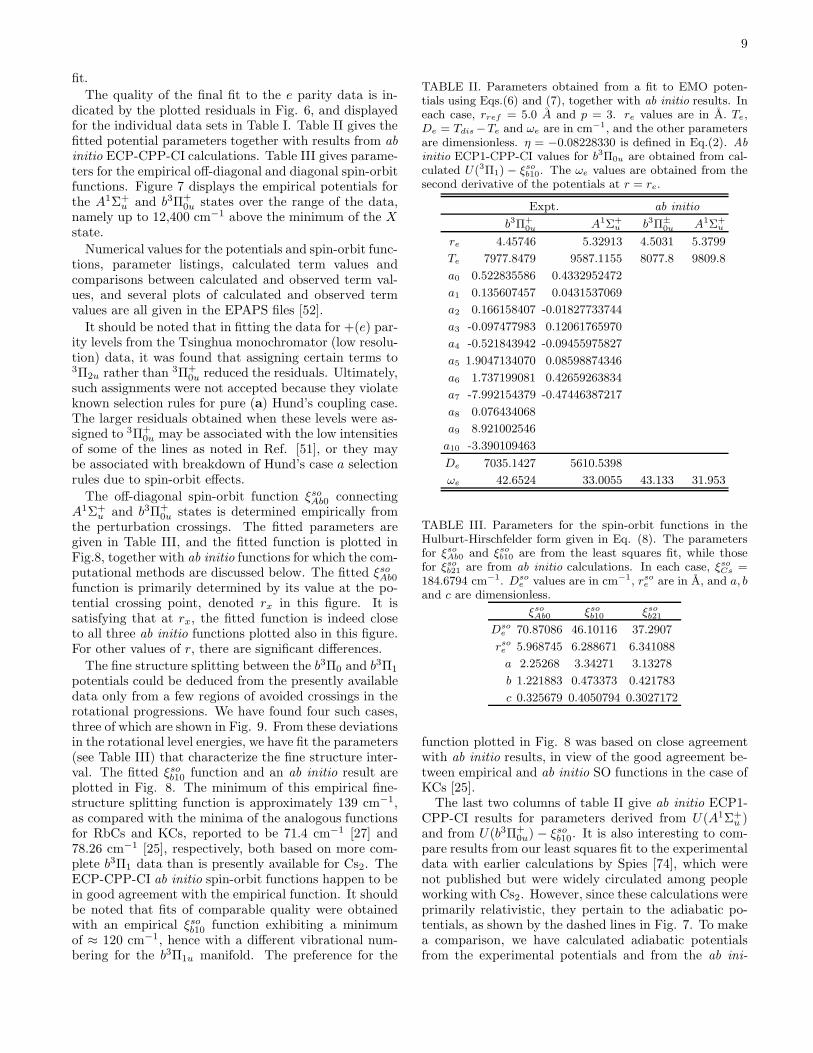
TABLE II. Parameters obtained from a fit to EMO poten-tials using Eqs.(6) and (7), together with ab initio results. Ineach case, rref = 5.0 A and p = 3. re values are in A. Te,De = Tdis−Te and ωe are in cm−1, and the other parametersare dimensionless. η = −0.08228330 is defined in Eq.(2). Abinitio ECP1-CPP-CI values for b3Π0u are obtained from cal-culated U(3Π1) − ξsob10. The ωe values are obtained from thesecond derivative of the potentials at r = re.
Expt. ab initio
b3Π+
0u A1Σ+u b3Π±
0u A1Σ+u
re 4.45746 5.32913 4.5031 5.3799
Te 7977.8479 9587.1155 8077.8 9809.8
a0 0.522835586 0.4332952472
a1 0.135607457 0.0431537069
a2 0.166158407 -0.01827733744
a3 -0.097477983 0.12061765970
a4 -0.521843942 -0.09455975827
a5 1.9047134070 0.08598874346
a6 1.737199081 0.42659263834
a7 -7.992154379 -0.47446387217
a8 0.076434068
a9 8.921002546
a10 -3.390109463
De 7035.1427 5610.5398
ωe 42.6524 33.0055 43.133 31.953
TABLE III. Parameters for the spin-orbit functions in theHulburt-Hirschfelder form given in Eq. (8). The parametersfor ξsoAb0 and ξsob10 are from the least squares fit, while thosefor ξsob21 are from ab initio calculations. In each case, ξsoCs =184.6794 cm−1. Dso
e values are in cm−1, rsoe are in A, and a, band c are dimensionless.
ξsoAb0 ξsob10 ξsob21Dso
e 70.87086 46.10116 37.2907
rsoe 5.968745 6.288671 6.341088
a 2.25268 3.34271 3.13278
b 1.221883 0.473373 0.421783
c 0.325679 0.4050794 0.3027172
function plotted in Fig. 8 was based on close agreementwith ab initio results, in view of the good agreement be-tween empirical and ab initio SO functions in the case ofKCs [25].The last two columns of table II give ab initio ECP1-
CPP-CI results for parameters derived from U(A1Σ+u )
and from U(b3Π+0u) − ξsob10. It is also interesting to com-
pare results from our least squares fit to the experimentaldata with earlier calculations by Spies [74], which werenot published but were widely circulated among peopleworking with Cs2. However, since these calculations wereprimarily relativistic, they pertain to the adiabatic po-tentials, as shown by the dashed lines in Fig. 7. To makea comparison, we have calculated adiabatic potentialsfrom the experimental potentials and from the ab ini-
10
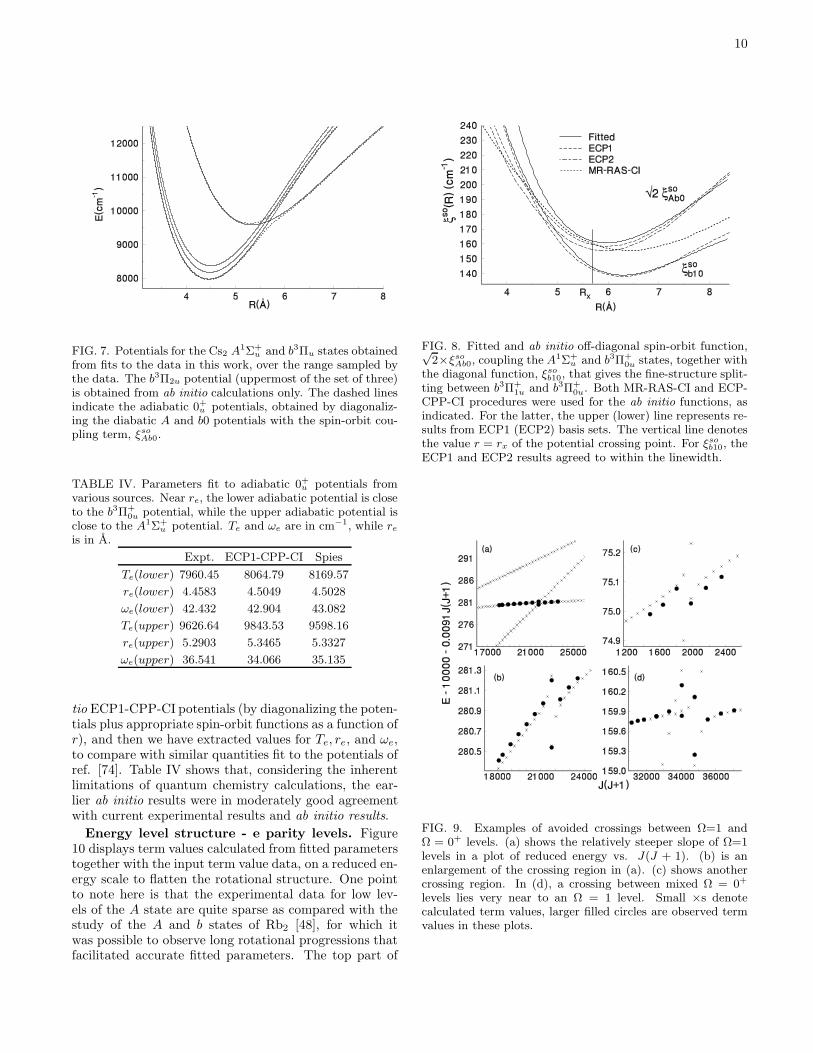
FIG. 7. Potentials for the Cs2 A1Σ+u and b3Πu states obtained
from fits to the data in this work, over the range sampled bythe data. The b3Π2u potential (uppermost of the set of three)is obtained from ab initio calculations only. The dashed linesindicate the adiabatic 0+u potentials, obtained by diagonaliz-ing the diabatic A and b0 potentials with the spin-orbit cou-pling term, ξsoAb0.
TABLE IV. Parameters fit to adiabatic 0+u potentials fromvarious sources. Near re, the lower adiabatic potential is closeto the b3Π+
0u potential, while the upper adiabatic potential isclose to the A1Σ+
u potential. Te and ωe are in cm−1, while reis in A.
Expt. ECP1-CPP-CI Spies
Te(lower) 7960.45 8064.79 8169.57
re(lower) 4.4583 4.5049 4.5028
ωe(lower) 42.432 42.904 43.082
Te(upper) 9626.64 9843.53 9598.16
re(upper) 5.2903 5.3465 5.3327
ωe(upper) 36.541 34.066 35.135
tio ECP1-CPP-CI potentials (by diagonalizing the poten-tials plus appropriate spin-orbit functions as a function ofr), and then we have extracted values for Te, re, and ωe,to compare with similar quantities fit to the potentials ofref. [74]. Table IV shows that, considering the inherentlimitations of quantum chemistry calculations, the ear-lier ab initio results were in moderately good agreementwith current experimental results and ab initio results.
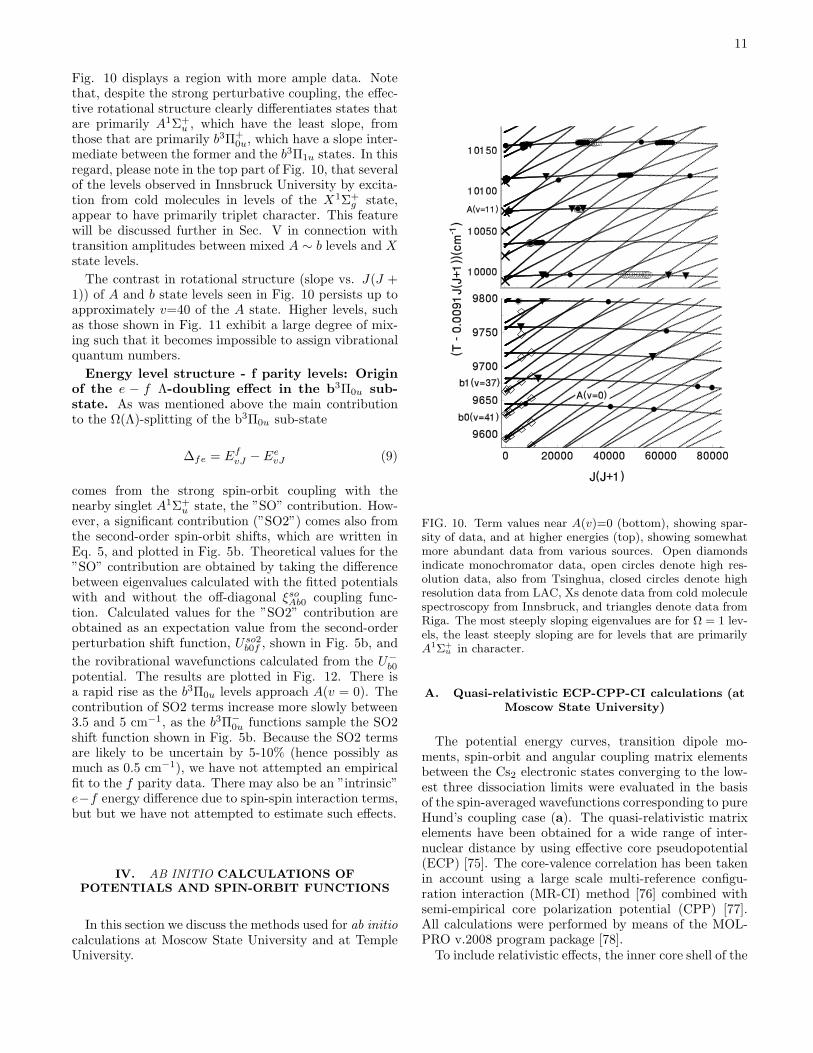
Energy level structure - e parity levels. Figure10 displays term values calculated from fitted parameterstogether with the input term value data, on a reduced en-ergy scale to flatten the rotational structure. One pointto note here is that the experimental data for low lev-els of the A state are quite sparse as compared with thestudy of the A and b states of Rb2 [48], for which itwas possible to observe long rotational progressions thatfacilitated accurate fitted parameters. The top part of
FIG. 8. Fitted and ab initio off-diagonal spin-orbit function,√2×ξsoAb0, coupling the A1Σ+
u and b3Π+
0u states, together withthe diagonal function, ξsob10, that gives the fine-structure split-ting between b3Π+
1u and b3Π+
0u. Both MR-RAS-CI and ECP-CPP-CI procedures were used for the ab initio functions, asindicated. For the latter, the upper (lower) line represents re-sults from ECP1 (ECP2) basis sets. The vertical line denotesthe value r = rx of the potential crossing point. For ξsob10, theECP1 and ECP2 results agreed to within the linewidth.
FIG. 9. Examples of avoided crossings between Ω=1 andΩ = 0+ levels. (a) shows the relatively steeper slope of Ω=1levels in a plot of reduced energy vs. J(J + 1). (b) is anenlargement of the crossing region in (a). (c) shows anothercrossing region. In (d), a crossing between mixed Ω = 0+
levels lies very near to an Ω = 1 level. Small ×s denotecalculated term values, larger filled circles are observed termvalues in these plots.
11
Fig. 10 displays a region with more ample data. Notethat, despite the strong perturbative coupling, the effec-tive rotational structure clearly differentiates states thatare primarily A1Σ+
u , which have the least slope, fromthose that are primarily b3Π+
0u, which have a slope inter-mediate between the former and the b3Π1u states. In thisregard, please note in the top part of Fig. 10, that severalof the levels observed in Innsbruck University by excita-tion from cold molecules in levels of the X1Σ+
g state,appear to have primarily triplet character. This featurewill be discussed further in Sec. V in connection withtransition amplitudes between mixed A ∼ b levels and Xstate levels.
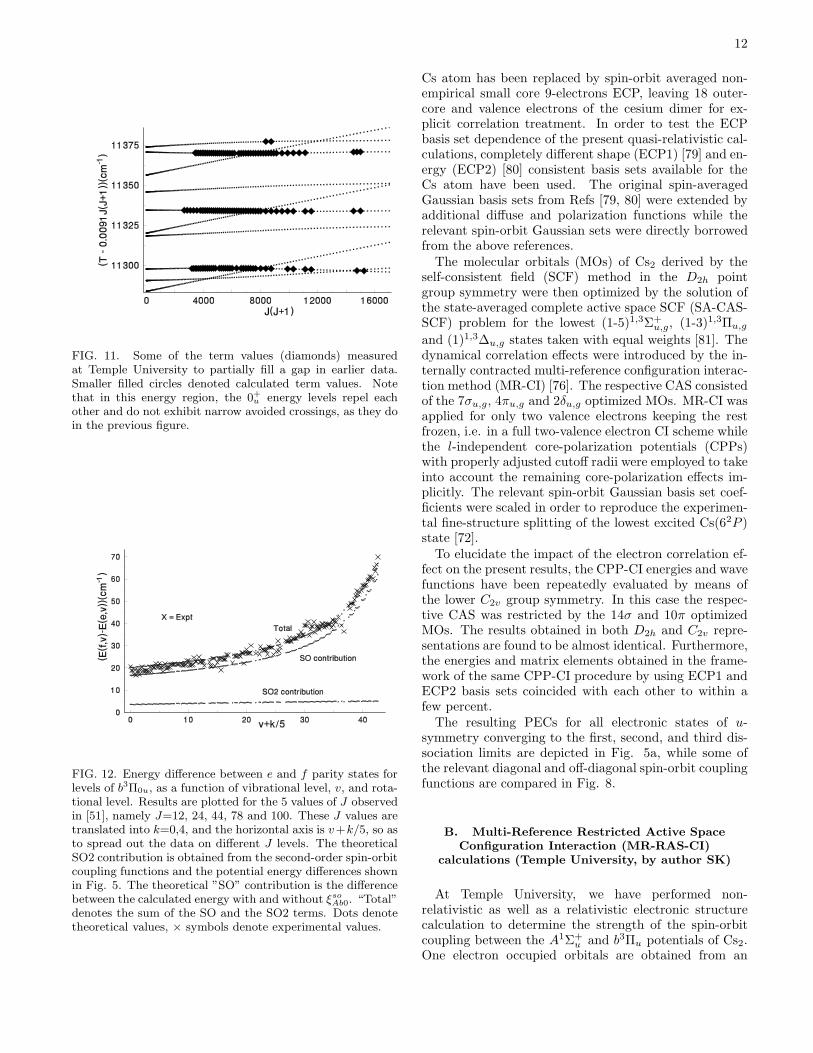
The contrast in rotational structure (slope vs. J(J +1)) of A and b state levels seen in Fig. 10 persists up toapproximately v=40 of the A state. Higher levels, suchas those shown in Fig. 11 exhibit a large degree of mix-ing such that it becomes impossible to assign vibrationalquantum numbers.
Energy level structure - f parity levels: Origin
of the e − f Λ-doubling effect in the b3Π0u sub-
state. As was mentioned above the main contributionto the Ω(Λ)-splitting of the b3Π0u sub-state
∆fe = EfvJ − Ee
vJ (9)
comes from the strong spin-orbit coupling with thenearby singlet A1Σ+
u state, the ”SO” contribution. How-ever, a significant contribution (”SO2”) comes also fromthe second-order spin-orbit shifts, which are written inEq. 5, and plotted in Fig. 5b. Theoretical values for the”SO” contribution are obtained by taking the differencebetween eigenvalues calculated with the fitted potentialswith and without the off-diagonal ξsoAb0 coupling func-tion. Calculated values for the ”SO2” contribution areobtained as an expectation value from the second-orderperturbation shift function, Uso2
b0f , shown in Fig. 5b, and
the rovibrational wavefunctions calculated from the U−b0
potential. The results are plotted in Fig. 12. There isa rapid rise as the b3Π0u levels approach A(v = 0). Thecontribution of SO2 terms increase more slowly between3.5 and 5 cm−1, as the b3Π−
0u functions sample the SO2shift function shown in Fig. 5b. Because the SO2 termsare likely to be uncertain by 5-10% (hence possibly asmuch as 0.5 cm−1), we have not attempted an empiricalfit to the f parity data. There may also be an ”intrinsic”e−f energy difference due to spin-spin interaction terms,but but we have not attempted to estimate such effects.
IV. AB INITIO CALCULATIONS OFPOTENTIALS AND SPIN-ORBIT FUNCTIONS
In this section we discuss the methods used for ab initiocalculations at Moscow State University and at TempleUniversity.
FIG. 10. Term values near A(v)=0 (bottom), showing spar-sity of data, and at higher energies (top), showing somewhatmore abundant data from various sources. Open diamondsindicate monochromator data, open circles denote high res-olution data, also from Tsinghua, closed circles denote highresolution data from LAC, Xs denote data from cold moleculespectroscopy from Innsbruck, and triangles denote data fromRiga. The most steeply sloping eigenvalues are for Ω = 1 lev-els, the least steeply sloping are for levels that are primarilyA1Σ+
u in character.
A. Quasi-relativistic ECP-CPP-CI calculations (atMoscow State University)
The potential energy curves, transition dipole mo-ments, spin-orbit and angular coupling matrix elementsbetween the Cs2 electronic states converging to the low-est three dissociation limits were evaluated in the basisof the spin-averaged wavefunctions corresponding to pureHund’s coupling case (a). The quasi-relativistic matrixelements have been obtained for a wide range of inter-nuclear distance by using effective core pseudopotential(ECP) [75]. The core-valence correlation has been takenin account using a large scale multi-reference configu-ration interaction (MR-CI) method [76] combined withsemi-empirical core polarization potential (CPP) [77].All calculations were performed by means of the MOL-PRO v.2008 program package [78].To include relativistic effects, the inner core shell of the
12
FIG. 11. Some of the term values (diamonds) measuredat Temple University to partially fill a gap in earlier data.Smaller filled circles denoted calculated term values. Notethat in this energy region, the 0+u energy levels repel eachother and do not exhibit narrow avoided crossings, as they doin the previous figure.
FIG. 12. Energy difference between e and f parity states forlevels of b3Π0u, as a function of vibrational level, v, and rota-tional level. Results are plotted for the 5 values of J observedin [51], namely J=12, 24, 44, 78 and 100. These J values aretranslated into k=0,4, and the horizontal axis is v+k/5, so asto spread out the data on different J levels. The theoreticalSO2 contribution is obtained from the second-order spin-orbitcoupling functions and the potential energy differences shownin Fig. 5. The theoretical ”SO” contribution is the differencebetween the calculated energy with and without ξsoAb0. “Total”denotes the sum of the SO and the SO2 terms. Dots denotetheoretical values, × symbols denote experimental values.
Cs atom has been replaced by spin-orbit averaged non-empirical small core 9-electrons ECP, leaving 18 outer-core and valence electrons of the cesium dimer for ex-plicit correlation treatment. In order to test the ECPbasis set dependence of the present quasi-relativistic cal-culations, completely different shape (ECP1) [79] and en-ergy (ECP2) [80] consistent basis sets available for theCs atom have been used. The original spin-averagedGaussian basis sets from Refs [79, 80] were extended byadditional diffuse and polarization functions while therelevant spin-orbit Gaussian sets were directly borrowedfrom the above references.The molecular orbitals (MOs) of Cs2 derived by the
self-consistent field (SCF) method in the D2h pointgroup symmetry were then optimized by the solution ofthe state-averaged complete active space SCF (SA-CAS-SCF) problem for the lowest (1-5)1,3Σ+
u,g, (1-3)1,3Πu,g
and (1)1,3∆u,g states taken with equal weights [81]. Thedynamical correlation effects were introduced by the in-ternally contracted multi-reference configuration interac-tion method (MR-CI) [76]. The respective CAS consistedof the 7σu,g, 4πu,g and 2δu,g optimized MOs. MR-CI wasapplied for only two valence electrons keeping the restfrozen, i.e. in a full two-valence electron CI scheme whilethe l-independent core-polarization potentials (CPPs)with properly adjusted cutoff radii were employed to takeinto account the remaining core-polarization effects im-plicitly. The relevant spin-orbit Gaussian basis set coef-ficients were scaled in order to reproduce the experimen-tal fine-structure splitting of the lowest excited Cs(62P )state [72].To elucidate the impact of the electron correlation ef-
fect on the present results, the CPP-CI energies and wavefunctions have been repeatedly evaluated by means ofthe lower C2v group symmetry. In this case the respec-tive CAS was restricted by the 14σ and 10π optimizedMOs. The results obtained in both D2h and C2v repre-sentations are found to be almost identical. Furthermore,the energies and matrix elements obtained in the frame-work of the same CPP-CI procedure by using ECP1 andECP2 basis sets coincided with each other to within afew percent.The resulting PECs for all electronic states of u-
symmetry converging to the first, second, and third dis-sociation limits are depicted in Fig. 5a, while some ofthe relevant diagonal and off-diagonal spin-orbit couplingfunctions are compared in Fig. 8.
B. Multi-Reference Restricted Active SpaceConfiguration Interaction (MR-RAS-CI)
calculations (Temple University, by author SK)
At Temple University, we have performed non-relativistic as well as a relativistic electronic structurecalculation to determine the strength of the spin-orbitcoupling between the A1Σ+
u and b3Πu potentials of Cs2.One electron occupied orbitals are obtained from an
13
atomic Hartree-Fock or Dirac-Fock calculation, respec-tively. Virtual, highly-excited orbitals are Sturm-typefunctions. The orbitals are labeled 1s, 2s, 2p . . . etc inanalogy with the principal quantum number and orbitalangular momentum of the hydrogen atom. A configu-ration interaction based on molecular determinants se-lected by a multi-reference restricted active space (MR-RAS-CI) method is used [82]. Details on the implemen-tation of this method in our calculations of heavy di-atomic molecules are given in Ref. [83]. Finally, for thenon-relativistic CI calculation we have evaluated matrixelements of the spin-orbit operator
HSO =α2
2
∑
N
∑
i
ZN
r3iN~li · ~si
− α2
2
∑
i6=j
1
r3ij[~rij × ~pi] · (~si + 2~sj) , (10)
where α is the fine structure constant and ~si is the spin ofelectron i. The first term of Eq. (10) is an one-electronoperator that describes spin-orbit interactions betweenone nucleus and one electron. Here riN is the separationbetween the i-th electron and nucleus N with charge ZN
and ~li is the electron orbital angular momentum rela-tive to nucleus N . The second term of Eq. (10) is atwo-electron operator describing the spin-orbit interac-tion between electrons. Here ~rij is the separation be-tween electrons i and j and ~pi is the momentum of elec-tron i.
The closed or filled orbitals up to the 4d shell of Csform the core orbitals of the molecular determinants usedin the CI for both the non-relativistic and relativisticcalculation. No excitations are allowed from these shells.The 5s2 and 5p6 shells are core-valence orbitals and are inthe active space from which single and double excitationsare allowed. The 6s and 6p orbitals are also added to theactive space and single, double, and triple occupancy isallowed. Finally, we use four each of the s, p, d, and fvirtual Sturm orbitals to complete the active space. Upto double occupancy is allowed for these virtual orbitals.
The off-diagonal spin-orbit matrix elements of the non-relativistic calculation is shown in Fig. 8. We find thatthe one-electron spin-orbit operator of Eq. (10) provides∼ 99 % of the total value of the spin-orbit coupling.
The relativistic potential calculations give an avoidedcrossing between A and b potentials. The smallest en-ergy difference ∆E is evaluated at r =5.5 A and equals326 cm−1. According to degenerate perturbtion theory,half of this value is equal to the off-diagonal ξs0Ab0 spin-orbit function at the same internuclear distance. Com-parison of ξsoAb0 at r =5.5 A obtained by non-relativisticand relativistic calculations shows a good agreement. Tobe precise, ξsoAb0(5.5 A) = 163.0, 161.6, 158.2 and 164.4cm−1, from MR-RAS-CI, ECP1, ECP2 and experiment,respectively.
V. TRANSITION AMPLITUDES TO X STATELEVELS
The distribution of intensities for transitions from orto the X1Σ+
g state is important in testing model poten-tials and wavefunctions, for designing data acquisitionprocedures, and is also important for designing transi-tion sequences to produce cold Cs2 molecules from coldCs atoms or from Cs Feshbach resonance states. Transi-tion intensities can be evaluated by using non-adiabaticwavefunctions of the A ∼ b complex calculated by FD orby DVR methods, and this section will present examplesof each.Radiative properties of the A ∼ b complex. To
test the reliability of the deperturbation analysis de-scribed above, we have evaluated the A ∼ b → X tran-sition probabilities, I, and radiative lifetimes τ of theA ∼ b complex according to the relations
IA∼b→X ∝ ν4A∼b→X |〈φA|dAX |vX〉|2 (11)
1
τA∼b=
8π2
2hc
∑
vX
ν3A∼b→X |〈φA|dAX |vX〉|2
where νA∼b→X = Ecalc(J ′) − EX(vX ; JX) is thewavenumber of the rovibronic A1Σ+
u ∼ b3Π+u → X1Σ+
g
transition. dAX(r) is the ab initio spin-allowed A1Σ+u −
X1Σ+g transition dipole moment calculated in the present
work by the ECP-CPP-CI method. Ecalc(J ′) is theenergy and |φA〉 is the non-adiabatic wave-function ofthe A-state component which were obtained by the FDmethod from numerical solution of close coupled radialequations with the present empirical PECs and SO func-tions. The rovibronic eigenvalues EX and eigenfunctionsof the X1Σ+
g state were obtained by solving the sin-gle channel radial equation using the empirical potentialfrom [53].The Riga group obtained FTS LIF fluorescence inten-
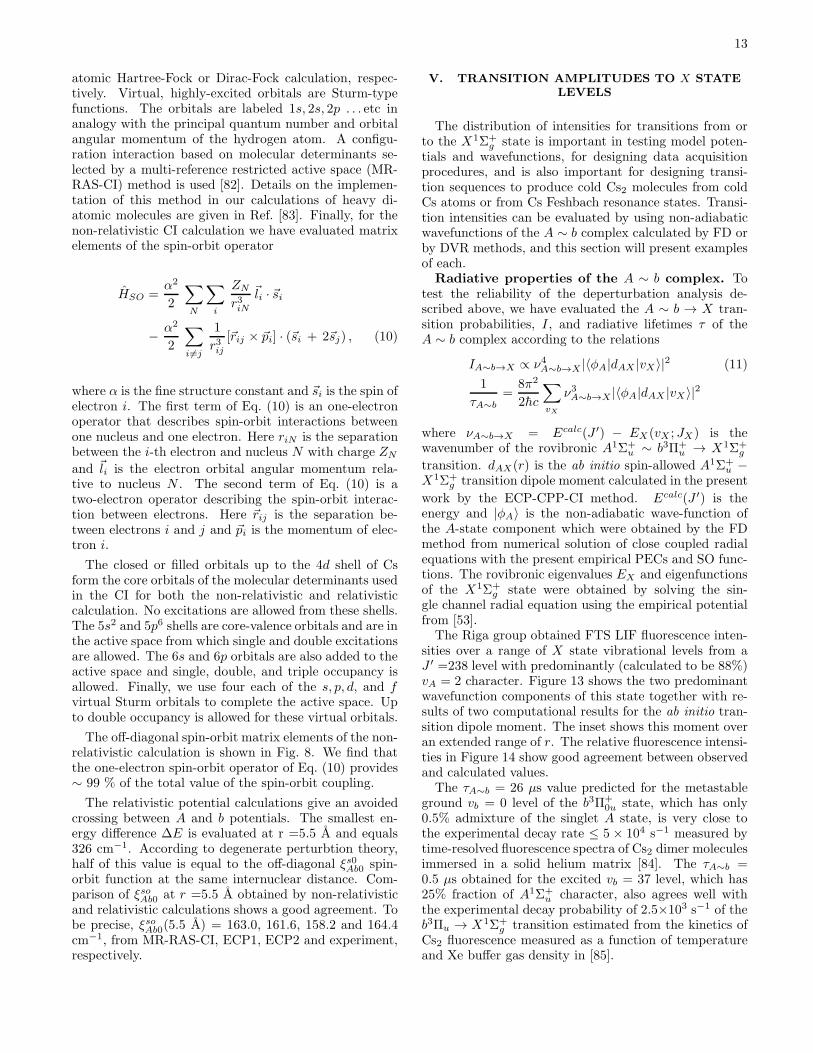
sities over a range of X state vibrational levels from aJ ′ =238 level with predominantly (calculated to be 88%)vA = 2 character. Figure 13 shows the two predominantwavefunction components of this state together with re-sults of two computational results for the ab initio tran-sition dipole moment. The inset shows this moment overan extended range of r. The relative fluorescence intensi-ties in Figure 14 show good agreement between observedand calculated values.The τA∼b = 26 µs value predicted for the metastable
ground vb = 0 level of the b3Π+0u state, which has only
0.5% admixture of the singlet A state, is very close tothe experimental decay rate ≤ 5 × 10⁴ s−1 measured bytime-resolved fluorescence spectra of Cs2 dimer moleculesimmersed in a solid helium matrix [84]. The τA∼b =0.5 µs obtained for the excited vb = 37 level, which has25% fraction of A1Σ+
u character, also agrees well withthe experimental decay probability of 2.5×10³ s−1 of theb3Πu → X1Σ+
g transition estimated from the kinetics ofCs2 fluorescence measured as a function of temperatureand Xe buffer gas density in [85].
14
FIG. 13. (Left axis)Wavefunction components for an excitedstate level of J=238, which consists mostly of A1Σ+
u (v = 2),but also with a b3Π+
0u component that is shown with dashedlines, indicated by two arrows. (right axis) Calculated tran-sition dipole moment between the A1Σ+
u and X1Σ+g state,
in a.u. The ECP1 and ECP2 results from the ECP-CPP-CImethod are shown as discussed in the text. The inset showstheoretical predictions for the transition dipole moment outto larger values of r.
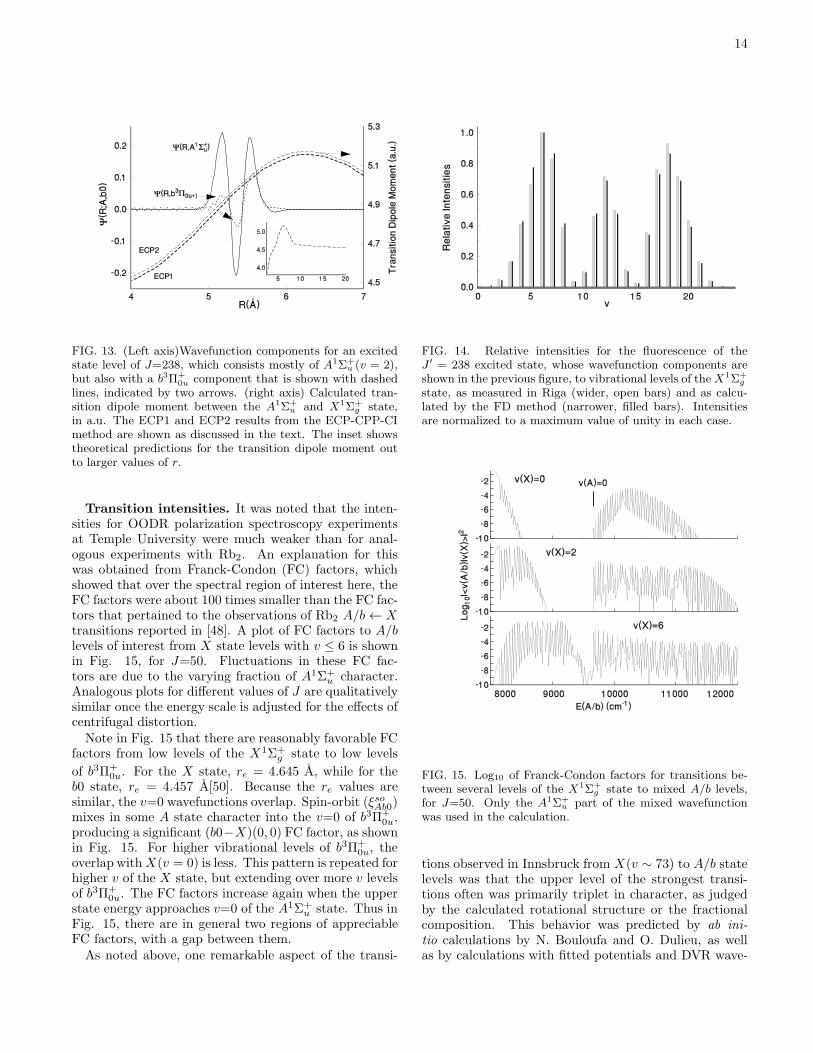
Transition intensities. It was noted that the inten-sities for OODR polarization spectroscopy experimentsat Temple University were much weaker than for anal-ogous experiments with Rb2. An explanation for thiswas obtained from Franck-Condon (FC) factors, whichshowed that over the spectral region of interest here, theFC factors were about 100 times smaller than the FC fac-tors that pertained to the observations of Rb2 A/b← Xtransitions reported in [48]. A plot of FC factors to A/blevels of interest from X state levels with v ≤ 6 is shownin Fig. 15, for J=50. Fluctuations in these FC fac-tors are due to the varying fraction of A1Σ+
u character.Analogous plots for different values of J are qualitativelysimilar once the energy scale is adjusted for the effects ofcentrifugal distortion.Note in Fig. 15 that there are reasonably favorable FC
factors from low levels of the X1Σ+g state to low levels
of b3Π+0u. For the X state, re = 4.645 A, while for the
b0 state, re = 4.457 A[50]. Because the re values aresimilar, the v=0 wavefunctions overlap. Spin-orbit (ξsoAb0)mixes in some A state character into the v=0 of b3Π+
0u,producing a significant (b0−X)(0, 0) FC factor, as shownin Fig. 15. For higher vibrational levels of b3Π+
0u, theoverlap withX(v = 0) is less. This pattern is repeated forhigher v of the X state, but extending over more v levelsof b3Π+
0u. The FC factors increase again when the upperstate energy approaches v=0 of the A1Σ+
u state. Thus inFig. 15, there are in general two regions of appreciableFC factors, with a gap between them.As noted above, one remarkable aspect of the transi-
FIG. 14. Relative intensities for the fluorescence of theJ ′ = 238 excited state, whose wavefunction components areshown in the previous figure, to vibrational levels of theX1Σ+
g
state, as measured in Riga (wider, open bars) and as calcu-lated by the FD method (narrower, filled bars). Intensitiesare normalized to a maximum value of unity in each case.
FIG. 15. Log10 of Franck-Condon factors for transitions be-tween several levels of the X1Σ+
g state to mixed A/b levels,for J=50. Only the A1Σ+
u part of the mixed wavefunctionwas used in the calculation.
tions observed in Innsbruck from X(v ∼ 73) to A/b statelevels was that the upper level of the strongest transi-tions often was primarily triplet in character, as judgedby the calculated rotational structure or the fractionalcomposition. This behavior was predicted by ab ini-tio calculations by N. Bouloufa and O. Dulieu, as wellas by calculations with fitted potentials and DVR wave-
15
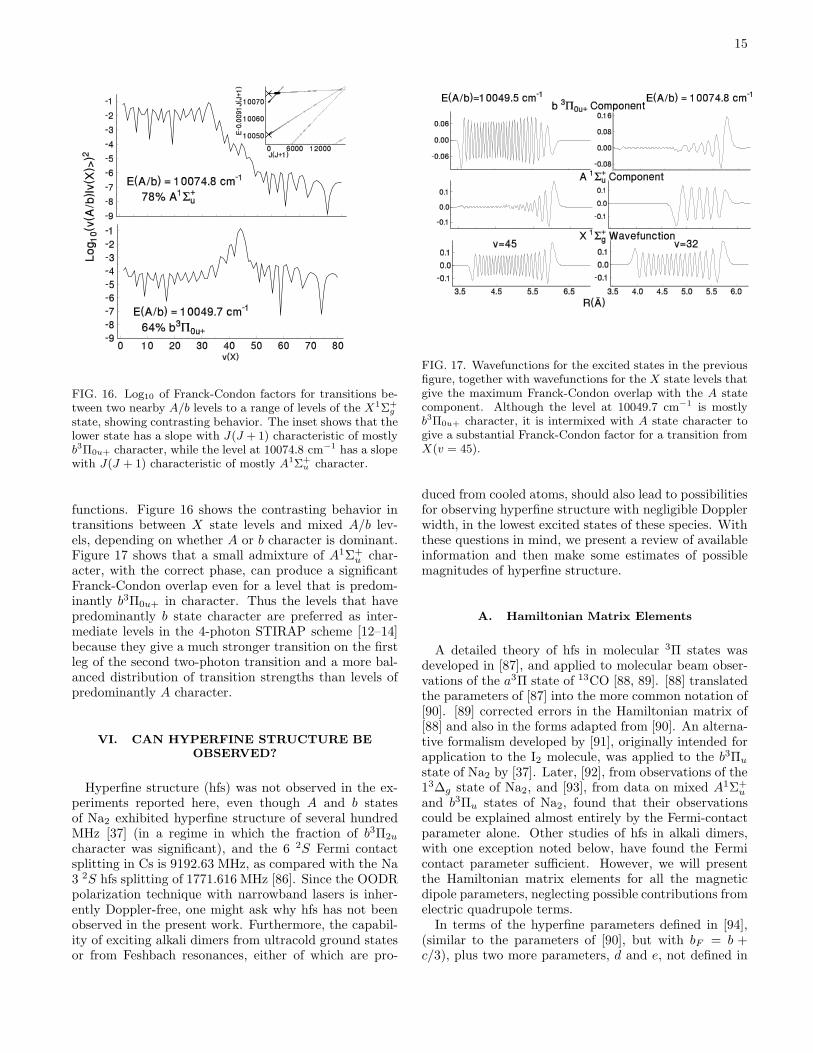
FIG. 16. Log10 of Franck-Condon factors for transitions be-tween two nearby A/b levels to a range of levels of the X1Σ+
g
state, showing contrasting behavior. The inset shows that thelower state has a slope with J(J +1) characteristic of mostlyb3Π0u+ character, while the level at 10074.8 cm−1 has a slopewith J(J + 1) characteristic of mostly A1Σ+
u character.
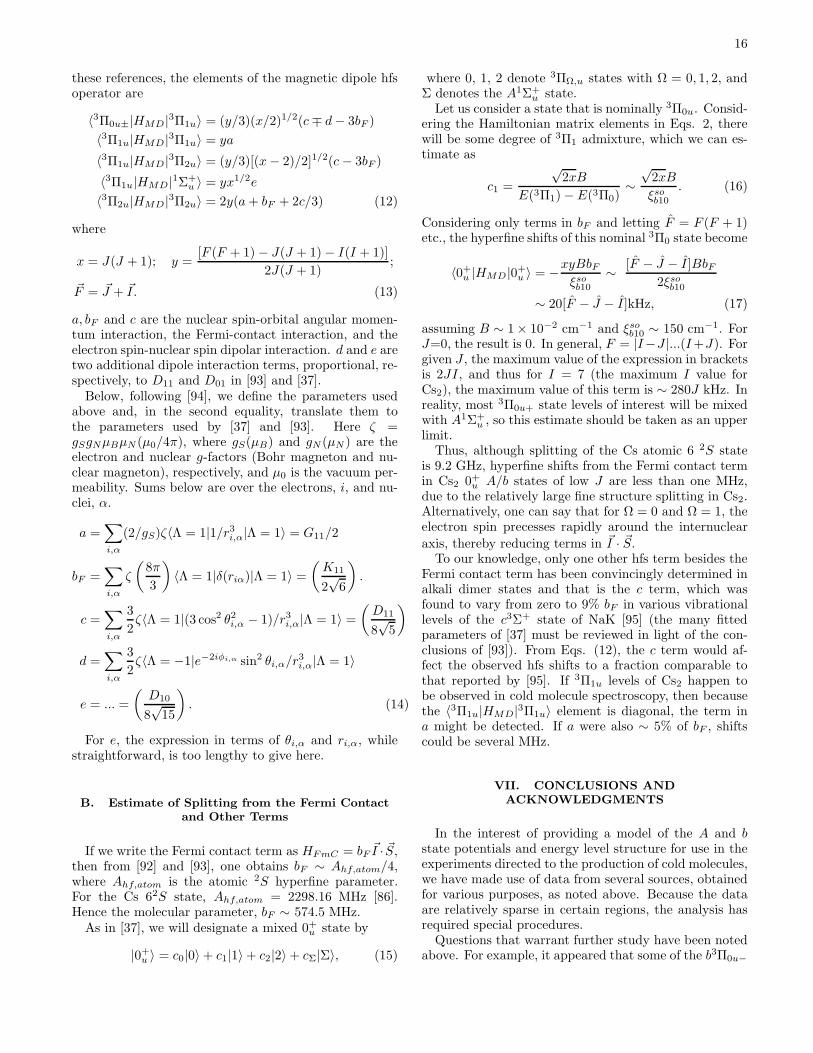
functions. Figure 16 shows the contrasting behavior intransitions between X state levels and mixed A/b lev-els, depending on whether A or b character is dominant.Figure 17 shows that a small admixture of A1Σ+
u char-acter, with the correct phase, can produce a significantFranck-Condon overlap even for a level that is predom-inantly b3Π0u+ in character. Thus the levels that havepredominantly b state character are preferred as inter-mediate levels in the 4-photon STIRAP scheme [12–14]because they give a much stronger transition on the firstleg of the second two-photon transition and a more bal-anced distribution of transition strengths than levels ofpredominantly A character.
VI. CAN HYPERFINE STRUCTURE BEOBSERVED?
Hyperfine structure (hfs) was not observed in the ex-periments reported here, even though A and b statesof Na2 exhibited hyperfine structure of several hundredMHz [37] (in a regime in which the fraction of b3Π2u
character was significant), and the 6 2S Fermi contactsplitting in Cs is 9192.63 MHz, as compared with the Na3 2S hfs splitting of 1771.616 MHz [86]. Since the OODRpolarization technique with narrowband lasers is inher-ently Doppler-free, one might ask why hfs has not beenobserved in the present work. Furthermore, the capabil-ity of exciting alkali dimers from ultracold ground statesor from Feshbach resonances, either of which are pro-
FIG. 17. Wavefunctions for the excited states in the previousfigure, together with wavefunctions for the X state levels thatgive the maximum Franck-Condon overlap with the A statecomponent. Although the level at 10049.7 cm−1 is mostlyb3Π0u+ character, it is intermixed with A state character togive a substantial Franck-Condon factor for a transition fromX(v = 45).
duced from cooled atoms, should also lead to possibilitiesfor observing hyperfine structure with negligible Dopplerwidth, in the lowest excited states of these species. Withthese questions in mind, we present a review of availableinformation and then make some estimates of possiblemagnitudes of hyperfine structure.
A. Hamiltonian Matrix Elements
A detailed theory of hfs in molecular 3Π states wasdeveloped in [87], and applied to molecular beam obser-vations of the a3Π state of 13CO [88, 89]. [88] translatedthe parameters of [87] into the more common notation of[90]. [89] corrected errors in the Hamiltonian matrix of[88] and also in the forms adapted from [90]. An alterna-tive formalism developed by [91], originally intended forapplication to the I2 molecule, was applied to the b3Πu
state of Na2 by [37]. Later, [92], from observations of the13∆g state of Na2, and [93], from data on mixed A1Σ+
u
and b3Πu states of Na2, found that their observationscould be explained almost entirely by the Fermi-contactparameter alone. Other studies of hfs in alkali dimers,with one exception noted below, have found the Fermicontact parameter sufficient. However, we will presentthe Hamiltonian matrix elements for all the magneticdipole parameters, neglecting possible contributions fromelectric quadrupole terms.In terms of the hyperfine parameters defined in [94],
(similar to the parameters of [90], but with bF = b +c/3), plus two more parameters, d and e, not defined in
16
these references, the elements of the magnetic dipole hfsoperator are
〈3Π0u±|HMD|3Π1u〉 = (y/3)(x/2)1/2(c∓ d− 3bF )
〈3Π1u|HMD|3Π1u〉 = ya
〈3Π1u|HMD|3Π2u〉 = (y/3)[(x− 2)/2]1/2(c− 3bF )
〈3Π1u|HMD|1Σ+u 〉 = yx1/2e
〈3Π2u|HMD|3Π2u〉 = 2y(a+ bF + 2c/3) (12)
where
x = J(J + 1); y =[F (F + 1)− J(J + 1)− I(I + 1)]
2J(J + 1);
~F = ~J + ~I. (13)
a, bF and c are the nuclear spin-orbital angular momen-tum interaction, the Fermi-contact interaction, and theelectron spin-nuclear spin dipolar interaction. d and e aretwo additional dipole interaction terms, proportional, re-spectively, to D11 and D01 in [93] and [37].Below, following [94], we define the parameters used
above and, in the second equality, translate them tothe parameters used by [37] and [93]. Here ζ =gSgNµBµN (µ0/4π), where gS(µB) and gN (µN ) are theelectron and nuclear g-factors (Bohr magneton and nu-clear magneton), respectively, and µ0 is the vacuum per-meability. Sums below are over the electrons, i, and nu-clei, α.
a =∑
i,α
(2/gS)ζ〈Λ = 1|1/r3i,α|Λ = 1〉 = G11/2
bF =∑
i,α
ζ
(
8π
3
)
〈Λ = 1|δ(riα)|Λ = 1〉 =(
K11
2√6
)
.
c =∑
i,α
3
2ζ〈Λ = 1|(3 cos2 θ2i,α − 1)/r3i,α|Λ = 1〉 =
(
D11
8√5
)
d =∑
i,α
3
2ζ〈Λ = −1|e−2iφi,α sin2 θi,α/r
3i,α|Λ = 1〉
e = ... =
(
D10
8√15
)
. (14)
For e, the expression in terms of θi,α and ri,α, whilestraightforward, is too lengthy to give here.
B. Estimate of Splitting from the Fermi Contactand Other Terms
If we write the Fermi contact term as HFmC = bF ~I · ~S,then from [92] and [93], one obtains bF ∼ Ahf,atom/4,where Ahf,atom is the atomic 2S hyperfine parameter.For the Cs 62S state, Ahf,atom = 2298.16 MHz [86].Hence the molecular parameter, bF ∼ 574.5 MHz.As in [37], we will designate a mixed 0+u state by
|0+u 〉 = c0|0〉+ c1|1〉+ c2|2〉+ cΣ|Σ〉, (15)
where 0, 1, 2 denote 3ΠΩ,u states with Ω = 0, 1, 2, andΣ denotes the A1Σ+
u state.Let us consider a state that is nominally 3Π0u. Consid-
ering the Hamiltonian matrix elements in Eqs. 2, therewill be some degree of 3Π1 admixture, which we can es-timate as
c1 =
√2xB
E(3Π1)− E(3Π0)∼√2xB
ξsob10. (16)
Considering only terms in bF and letting F = F (F + 1)etc., the hyperfine shifts of this nominal 3Π0 state become
〈0+u |HMD|0+u 〉 = −xyBbFξsob10
∼ [F − J − I]BbF2ξsob10
∼ 20[F − J − I]kHz, (17)
assuming B ∼ 1× 10⁻² cm−1 and ξsob10 ∼ 150 cm−1. ForJ=0, the result is 0. In general, F = |I−J |...(I+J). Forgiven J , the maximum value of the expression in bracketsis 2JI, and thus for I = 7 (the maximum I value forCs2), the maximum value of this term is ∼ 280J kHz. Inreality, most 3Π0u+ state levels of interest will be mixedwith A1Σ+
u , so this estimate should be taken as an upperlimit.Thus, although splitting of the Cs atomic 6 2S state
is 9.2 GHz, hyperfine shifts from the Fermi contact termin Cs2 0+u A/b states of low J are less than one MHz,due to the relatively large fine structure splitting in Cs2.Alternatively, one can say that for Ω = 0 and Ω = 1, theelectron spin precesses rapidly around the internuclear
axis, thereby reducing terms in ~I · ~S.To our knowledge, only one other hfs term besides the
Fermi contact term has been convincingly determined inalkali dimer states and that is the c term, which wasfound to vary from zero to 9% bF in various vibrationallevels of the c3Σ+ state of NaK [95] (the many fittedparameters of [37] must be reviewed in light of the con-clusions of [93]). From Eqs. (12), the c term would af-fect the observed hfs shifts to a fraction comparable tothat reported by [95]. If 3Π1u levels of Cs2 happen tobe observed in cold molecule spectroscopy, then becausethe 〈3Π1u|HMD|3Π1u〉 element is diagonal, the term ina might be detected. If a were also ∼ 5% of bF , shiftscould be several MHz.
VII. CONCLUSIONS ANDACKNOWLEDGMENTS
In the interest of providing a model of the A and bstate potentials and energy level structure for use in theexperiments directed to the production of cold molecules,we have made use of data from several sources, obtainedfor various purposes, as noted above. Because the dataare relatively sparse in certain regions, the analysis hasrequired special procedures.Questions that warrant further study have been noted
above. For example, it appeared that some of the b3Π0u−
17
(f parity) low vibrational levels, from the data of [51],could better be assigned to 3Π2u. As laser techniques im-prove, it would be interesting to attempt to access theselevels with high resolution techniques. Secondly, thesecond-order spin-orbit (SO2) corrections to the b3Π1u
potential are quite large, and sensitively dependent onthe relative potentials of perturbing states, as shown inFig. 5. More extensive data on b3Π1u levels might shedlight on these SO2 corrections. And finally, as discussedin Sec. VI, it remains a challenge to observe hyperfinestructure in levels with substantial b3Π2u character. Thisalso would require enhanced laser techniques, such asused recently to study B1Πu → X1Σ+
g transitions in Cs2[57].
Acknowledgments. The work in Temple Universitywas supported by NSF grant PHY 0855502. SK ac-knowledges support from AFOSR and from NSF grantPHY-1005453. S.A., C.M. and J. H. were supportedby NSF grants PHY-0652938 and PHY-0968898. Thework at Stony Brook was supported by NSF grantsPHY0652459 and PHY0968905. The work in TsinghuaUniversity was supported by NSFC of China, undergrant number 20773072. The Moscow team thanksthe Russian Foundation for Basic Researches by thegrant Nr. 10-03-00195 and MSU Priority Direction 2.3.M.T. and R.F. are grateful to Ilze Klincare, Olga Niko-layeva and Artis Kruzins for their help in spectra anal-ysis, as well as appreciate the support from the ESF2009/0223/1DP/1.1.1.2.0/09/APIA/VIAA/008 project.
[1] See, for example, L. Li and A. M. Lyyra, Spectrochim.Acta A 55, 2147 (1999) on the use of window states toexcite higher triplet states of Li2 and Na2.
[2] J. M. Sage, S. Sainis, T. Bergeman and D. DeMille, Phys.Rev. Lett. 94, 203001 (2005).
[3] J. Deiglmayr, A. Grochola, M. Repp, K. Mortlbauer,C. Gluck, J. Lange, O. Dulieu, R. Wester and M. Wei-demuller, Phys. Rev. Lett. 101, 133004 (2008).
[4] S. Ospelkaus, A. Pe’er, K.-K. Ni, J. J. Zirbel, B. Neyen-huis, S. Kotochigova, P. S. Julienne, J. Ye and D. S. Jin,Nature Physics, 4, 622 (2008).
[5] K.-K. Ni, S. Ospelkaus, M. H. G. de Miranda, A Pe’er,B. Neyenhuis, J. J. Zirbel, S. Kotochigova, P. S. Julienne,D. S. Jin, and J. Ye, Science 322, 231 (2008).
[6] K. Aikawa, D. Akamatsu, M. Hayashi, K. Oasa, J.Kobayashi, P. Naidon, T. Kishimoto, M. Ueda and S.Inouye, Phys. Rev. Lett. 105, 203001 (2010).
[7] C. Haimberger, J. Kleinert, P. Zabawa, A. Wakim andN. P. Bigelow, New J. Phys. 11, 055042 (2009).
[8] F. Lang, K. Winkler, C. Strauss, R. Grimm, and J.Hecker Denschlag, Phys. Rev. Lett. 101, 133005 (2008).
[9] C. M. Dion, C. Drag, O. Dulieu, B. LaburtheTolra, F.Masnou-Seeuws and P. Pillet, Phys. Rev. Lett. 86, 2253(2001).
[10] M. Viteau, A. Chotia, M. Allegrini, N. Bouloufa, O.Dulieu, D. Comparat, and P. Pillet, Science 321, 232(2008).
[11] J. G. Danzl, E. Haller, M. Gustavsson, M. J. Mark,R. Hart, N. Bouloufa, O. Dulieu, H. Ritsch and H.-C.Nagerl, Science 321, 1062 (2008).
[12] M. J. Mark, J. G. Danzl, E. Haller, M. Gustavsson, N.Bouloufa, O. Dulieu, H. Salami, T. Bergeman, H. Ritsch,R. Hart and H.-C. Nagerl, Appl. Phys. B 95, 219 (2009).
[13] J. G. Danzl, M. J. Mark. E. Haller, M. Gustavsson,N. Bouloufa, O. Dulieu, H. Ritsch, R. Hart and H.-C.Nagerl, Faraday Discuss. 142, 283 (2009).
[14] J. G. Danzl, M. J. Mark. E. Haller, M. Gustavsson, R.Hart, J. Aldegunde, J. M. Hutson, H.-C. Nagerl, NaturePhysics 6, 265 (2010).
[15] A. Derevianko, Phys. Rev. A 67, 033607 (2003).[16] D. DeMille, S. Sainis, J. Sage, T. Bergeman, S. Ko-
tochigova, and E. Tiesinga, Phys. Rev. Lett. 100, 043202(2008); see also T. Zelevinsky, S. Kotochigova and J. Ye,
Phys. Rev. Lett. 100, 043201 (2008).[17] W. C. Stwalley, Eur. Phys. J. D 31, 221 (2004).[18] C. Lisdat, O. Dulieu, H. Knockel and E. Tiemann, Eur.
Phys. J. D 17, 319 (2001).[19] M. Tamanis, R. Ferber, A. Zaitsevskii, E. A. Pazyuk,
A. V. Stolyarov, H. Chen, J. Qi, H. Wang and W. C.Stwalley, J. Chem. Phys. 117, 7980 (2002).
[20] M. R. Manaa, A. J. Ross, F. Martin, P. Crozet, A. M.Lyyra, L. Li, C. Amiot and T. Bergeman, J. Chem. Phys.117, 11208 (2002).
[21] T. Bergeman, C. E. Fellows, R. F. Gutterres and C.Amiot, Phys. Rev. A, 67, 050501 (2003).
[22] P. Qi, J. Bai, E. Ahmed, A. M. Lyyra, S. Kotochigova,A. J. Ross, C. Effantin, P. Zalicki, J. Vigue, G. Chawla,R. W. Field, T.-J. Whang, W. C. Stwalley, H. Knockel,E. Tiemann, J. Shang, L. Li, and T. Bergeman, J. Chem.Phys. 127, 044301 (2007).
[23] O. Docenko, M. Tamanis, R. Ferber, E. A. Pazyuk, A.Zaitsevskii, A. V. Stolyarov, A. Pashov, H. Knockel andE. Tiemann, Phys. Rev. A 75, 042503 (2007).
[24] J. Zaharova, M. Tamanis, R. Ferber, A. N. Drozdova, E.A. Pazyuk, and A. V. Stolyarov, Phys. Rev. A 79, 012508(2009).
[25] A. Kruzins, I. Klincare, O. Nikolayeva, M. Tamanis, R.Ferber, E. A. Pazyuk, and A. V. Stolyarov, Phys. Rev.A 81, 042509 (2010).
[26] M. Tamanis, I. Klincare, A. Kruzins, O. Nikolayeva, R.Ferber, E. A. Pazyuk, and A. V. Stolyarov, Phys. Rev.A 82, 032506 (2010).
[27] O. Docenko, M. Tamanis, R. Ferber, T. Bergeman, S.Kotochigova, A. V. Stolyarov, A. deFaria Nogueira andC. B. Fellows, Phys. Rev. A 81, 042511 (2010).
[28] A.J. Ross, C. Effantin, J. d’Incan and R. F. Barrow, Mol.Phys. 56, 903 (1985).
[29] A. J. Ross, C. Effantin, J. d’Incan and R. F. Barrow, J.Phys. B 19, 1449 (1986).
[30] A. J. Ross, R. M. Clements, and R. F. Barrow, J. Mol.Spectrosc. 127, 546 (1988).
[31] H. Sun and J. Huennekens, J. Chem. Phys. 97, 4714(1992).
[32] R. Ferber, E. A. Pazyuk, A. J. Stolyarov, A. Zaitsevskii,H. Chen, H. Wang and W. C. Stwalley, J. Chem. Phys.112, 5740 (2000).
18
[33] X. Xie and R. W. Field, Chem. Phys. 99, 337 (1985).[34] X. Xie and R. W. Field, J. Mol. Spectrosc. 117, 228
(1986).[35] C. Linton, F. Martin, I. Russier, A. J. Ross, P. Crozet,
S. Churassy and R. Bacis, J. Mol. Spectrosc. 175, 340(1996).
[36] K. Urbanski, S. Antonova, A. M. Lyyra, A.Yiannopoulou and W. C. Stwalley, J. Chem. Phys. 104,2813 (1996).
[37] J. B. Atkinson, J. Becker and W. Demtroder, Chem.Phys. Lett. 87, 92 (1982).
[38] C. Effantin, O. Babaky, K. Hussein, J. d’Incan and R. F.Barrow, J. Phys. B 4077 (1985).
[39] H. Kato, M. Otani and M. Baba, J. Chem. Phys. 89, 653(1988).
[40] A. M. Lyyra, H. Wang, T.-J. Whang, W. C. Stwalley andL. Li, Phys. Rev. Lett. 66, 2724 (1991).
[41] T.-J. Whang, W. C. Stwalley, L. Li and A. M. Lyyra, J.Chem. Phys 97, 7211 (1992).
[42] A. J. Ross, P. Crozet, C. Effantin, J. d’Incan and R. F.Barrow, J. Phys. B 20, 6225 (1987).
[43] A. M. Lyyra, W. T. Luh, L. Li, H. Wang and W. C.Stwalley, J. Chem. Phys. 92, 43 (1990).
[44] G. Jong, Ph. D. Thesis, University of Iowa, 1991 (unpub-lished).
[45] G. Jong, L. Li, T.-J. Whang, A. M. Lyyra, W. C. Stwal-ley, M. Li and J. Coxon, J. Mol. Spectrosc. 155, 115(1992).
[46] J. T. Kim, H. Wang, C. C. Tsai, J. T. Bahns, W. C.Stwalley, G. Jong and A. M. Lyyra, J. Chem. Phys. 102,6646 (1995).
[47] C. Amiot, O. Dulieu and J. Verges, Phys. Rev. Lett. 83,2316 (1999).
[48] H. Salami, T. Bergeman, B. Beser, J. Bai, E. H. Ahmed,S. Kotochigova, A. M. Lyyra, J. Huennekens, C. Lisdat,A. V. Stolyarov, O. Dulieu, P. Crozet and A. J. Ross,Phys. Rev. A 80, 022515 (2009).
[49] J. Verges and C. Amiot, J. Mol. Spectrosc. 126, 393(1987).
[50] C. Amiot and O.Dulieu, J. Chem. Phys. 117, 5155(2002).
[51] F. Xie, D. Li, L. Tyree, L. Li, V. B. Sovkov, V. S. Ivanov,S. Magnier and A. M. Lyyra, J. Chem. Phys 128, 204313(2008).
[52] Reference to the EPAPS supplementary file.[53] J. A. Coxon and P. G. Hajigeorgiou, J. Chem. Phys. 132,
094105 (2010).[54] R. Teets, R. Feinberg, T. W. Hansch and A. L. Schawlow,
Phys. Rev. Lett. 37, 683 (1976).[55] M. Raab, G. Honing, W. Demtroder and C. R. Vidal, J.
Chem. Phys. 76, 4370 (1982).[56] X. Wang, J. Magnes, A. M. Lyyra, A. J. Ross, F. Martin,
P. M.Dove and R. J. Le Roy, J. Chem. Phys. 117, 9339(2002.
[57] N. Nishimiya, Y. Yasuda, T. Yukiya and M. Suzuki, J.Mol. Spectrosc. 255, 194 (2009).
[58] C. Wolfe, Ph. D. Thesis, Lehigh University (2010) (un-published).
[59] C. Wolfe, S. Ashman, B. Beser, E. H. Ahmed, J. Bai, M.Lyyra and J. Huennekens, in preparation (2010).
[60] J. Derouard, Chem. Phys. 84, 181 (1984). We thank D.Pritchard and R. W. Field for alerting us to this refer-ence.
[61] W. Demtroder, Laser Spectroscopy, Vol. 2 Springer,
Berlin (2008).[62] S. Kasahara, Y. Hasui, K. Otsuka, M. Baba, W.
Demtroder, and H. Kato, J. Chem. Phys. 106, 4869(1997).
[63] Karl Lambrecht Corporation, Chicago, Il.[64] D. Skinner and R. Whitcher, J. Phys. E 5, 237 (1972).[65] The Aime Cotton Iodine Atlas, S. Gerstenkorn and
P. Luc, Atlas du Spectre d’Absorption de la Moleculed’Iode, Editions du CNRS, Paris, 1978, was recalibratedin 1979 by S. Gerstenkorn and P. Luc, Rev. Phys. Appl.14, 791 1979.
[66] H. Salami, A. J. Ross, J. Mol. Spectrosc. 223, 157 (2005).[67] B. A. Palmer, R. A. Keller, and R. Engleman, Jr., ”An
atlas of uranium emission intensities in a hollow cathodedischarge,” LASL Rep. LA-8251-MS (Los Alamos Scien-tific Laboratory, Los Alamos, N. M., 1980)
[68] J. Y. Seto, R. Le Roy, J. Verges, C. Amiot, J. Chem.Phys. 113, 3067 (2000).
[69] R. W. Field and H. Lefebvre-Brion. The Spectra andDynamics of Diatomic Molecules, Elsevier, Amsterdam,2004.
[70] E. G. Lee, J. Y. Seto, T. Hirao, P. F. Bernath, and R. J.Le Roy, J. Mol. Spectrosc. 194, 197 (1999).
[71] R. J. Le Roy, Y. Huang and C. Jary, J. Chem. Phys. 125,164310 (2006); R. J. Le Roy and R. D. E. Henderson,Mol. Phys. 105, 663 (2007).
[72] D. A. Steck, Cesium D Line Data (2009),http://steck.us.alkalidata.
[73] H. M. Hulburt and J. O. Hirschfelder, J. Chem. Phys. 9,61 (1941).
[74] N. Spies, Ph. D. Thesis, Fachbereich Chemie, UniversitatKaiserslautern.
[75] M.Dolg, Effective Core Potentials, published in ModernMethods and Algorithms of Quantum Chemistry, J. Gro-tendorst (Ed.), John von Neumann Institute for Com-puting, Julich, NIC Series, Vol. 1, pp.479-508, (2000);http://www.fz-juelich.de/nic-series/
[76] P. J. Knowles and H.-J. Werner, Theor. Chim. Acta, 84,95 (1992).
[77] W.Muller, J.Flesch, and W.Meyer, J. Chem. Phys., 80,3257 (1984).
[78] H. -J. Werner, P. J. Knowles, R. Lindh, F. R. Manby, M.Schutz, P. Celani, T. Korona, G. Rauhut, R. D. Amos, A.Bernhardsson, A. Berning, D. L. Cooper, M. J. O. Dee-gan, A. J. Dobbyn, F. Eckert, C. Hampel, G. Hetzer, A.W. Lloyd, S. J. McNicholas, W. Meyer, M. E. Mura, A.Nicklass, P. Palmieri, U. Schumann, H. Stoll, A. J. Stone,R. Tarroni, T. Thosteinsson, MOLPRO, Version 2008.1,a package of ab initio programs. See www.MOLPRO.net.
[79] A. Zaitsevskii, E. A. Pazyuk, A. V. Stolyarov, O. Do-cenko, I. Klincare, O. Nikolayeva, M. Auzinsh, M. Tama-nis and R. Ferber, Phys. Rev. A, 71, 012510 (2005).
[80] I. S. Lim, P. Schwerdtfeger, B. Metz, and H. Stoll, J.Chem. Phys., 122, 104103 (2005).
[81] H.-J. Werner and P. J. Knowles, J. Chem. Phys. 82, 5053(1985).
[82] P. A. Malmqvist, A. Rendell, and B. Roos, J. Phys.Chem. 94, 5477 (1990).
[83] S. Kotochigova and E. Tiesinga, J. Chem. Phys. 123,174304 (2005).
[84] P. Moroshkin, A. Hofer, V. Lebedev and A. Weis, J.Chem. Phys. 133, 174510 (2010).
[85] R. P. Benedict, D. L. Drummond and L. A. Schlie, J.Chem. Phys. 70, 3155 (1979).

19
[86] E. Arimondo, M. Inguscio and P. Violino, Rev. Mod.Phys. 49, 31 (1977).
[87] K. Freed, J. Chem. Phys. 43, 4214 (1966).[88] R. Gammon, R. Stern, M. Lesk, B. Wicke and W. Klem-
perer, J. Chem. Phys. 54, 2136 (1971).[89] R. Saykally, T. Dixon, T. Anderson, P. Szanto and R. C.
Woods, J. Chem. Phys. 87, 6423 (1987).[90] R. A. Frosch and H. M. Foley, Phys. Rev. 88, 1337 (1952).[91] M. Broyer, J. Vigue and J. C. Lehmann, J. de Physique
39, 591 (1978).
[92] L. Li, Q. Zhu and R. W. Field, J. Mol. Spectrosc. 134,50-62 (1989).
[93] H. Kato, M. Otani and M. Baba, J. Chem. Phys. 91,5124 (1989).
[94] J. Brown and A. Carrington, Rotational Spectroscopy ofDiatomic Molecules, Cambridge U. Press, Cambridge,UK, 2003.
[95] P. Kowalczyk, J. Chem. Phys. 91, 2779 (1989).