Geochemistry Characteristic Monitoring at LHD-α, a …...Wahyu Firmansyah, Teguh Prabowo,...
8
Proceedings World Geothermal Congress 2020 Reykjavik, Iceland, April 26 – May 2, 2020 1 Geochemistry Characteristic Monitoring at LHD-α, a Cyclic Geothermal Well in Lahendong Geothermal Field, Indonesia Wahyu Firmansyah, Teguh Prabowo, Mulyanto, Benedict A. Hananto, Fernando Pasaribu, and Marihot SP Silaban PT. PERTAMINA GEOTHERMAL ENERGY Skyline Building 19th Floor Jl. MH. Thamrin no. 9 Jakarta 10340 Indonesia [email protected] Keywords: Geochemistry, Cyclic, and Steam flow rate. ABSTRACT LHD-α is one of the latest drilled wells in Lahendong Field. A cyclical in production flow rate was observed during production test. The well has a sinusoidal trend in flow rate and enthalpy. At the top of the cycle, the well can deliver fluid with 47% of dryness and 1609 KJ/Kg enthalpy. Meanwhile, at the bottom of the cycle, the well only produces of fluid with 41% dryness and 1486 KJ/Kg enthalpy. Spinner result of this well implied that well is supported by multiple feed zones. Static temperature profile showed the differences temperature profile in each feed zone. The deeper feed zone is known as a cyclic liquid reservoir with temperature 250- 260 o C, and upper feed zone is a steam reservoir with temperature 310-320 o C. In order to detailed characteristics of the well, flow measurement and complete geochemical sampling were carried out on the well in various production parameters. The chloride and silica content of the produced brine increased when the cyclic reservoir contributes. The concentration of total NCG decreased, which indicates the steam reservoir is diluted by low NCG liquid. That is also shown on CH4-H2-H2S diagram where the sample dragged to CH4 apex. The result of these observations is expected to investigate the causes of cyclic production of this well. Moreover, the optimization strategy to utilize this well can be carried out. 1. INTRODUCTION The Lahendong Geothermal field is located in North Sulawesi Province, 25 km northwest from Manado City. In regional geology, Lahendong and surrounding area are on a plateau depression of Tondano caldera. The basement is known to be Miocene that composed of old volcanic products with sedimentary rock inserts. After a major eruption that formed the Tondano caldera at the beginning of the Pleistocene, subsequent volcanic episodes of the Quaternary age emerged. Some Quaternary volcanic appear in the middle and edge of the caldera. The Lahendong Field is situated in the Linau-Lengkoan-Kasuratan-Pangolombian volcanic product. Figure 1: Lahendong Geothermal Field, Wells Location, and Structural Geology Map. LHD-α
Transcript of Geochemistry Characteristic Monitoring at LHD-α, a …...Wahyu Firmansyah, Teguh Prabowo,...
Proceedings World Geothermal Congress 2020
Reykjavik, Iceland, April 26 – May 2, 2020
1
Geochemistry Characteristic Monitoring at LHD-α, a Cyclic Geothermal Well in Lahendong
Geothermal Field, Indonesia
Wahyu Firmansyah, Teguh Prabowo, Mulyanto, Benedict A. Hananto, Fernando Pasaribu, and Marihot SP Silaban
PT. PERTAMINA GEOTHERMAL ENERGY
Skyline Building 19th Floor Jl. MH. Thamrin no. 9 Jakarta 10340 Indonesia
Keywords: Geochemistry, Cyclic, and Steam flow rate.
ABSTRACT
LHD-α is one of the latest drilled wells in Lahendong Field. A cyclical in production flow rate was observed during production test.
The well has a sinusoidal trend in flow rate and enthalpy. At the top of the cycle, the well can deliver fluid with 47% of dryness and
1609 KJ/Kg enthalpy. Meanwhile, at the bottom of the cycle, the well only produces of fluid with 41% dryness and 1486 KJ/Kg
enthalpy. Spinner result of this well implied that well is supported by multiple feed zones. Static temperature profile showed the
differences temperature profile in each feed zone. The deeper feed zone is known as a cyclic liquid reservoir with temperature 250-
260oC, and upper feed zone is a steam reservoir with temperature 310-320oC. In order to detailed characteristics of the well, flow
measurement and complete geochemical sampling were carried out on the well in various production parameters. The chloride and
silica content of the produced brine increased when the cyclic reservoir contributes. The concentration of total NCG decreased, which
indicates the steam reservoir is diluted by low NCG liquid. That is also shown on CH4-H2-H2S diagram where the sample dragged to
CH4 apex. The result of these observations is expected to investigate the causes of cyclic production of this well. Moreover, the
optimization strategy to utilize this well can be carried out.
1. INTRODUCTION
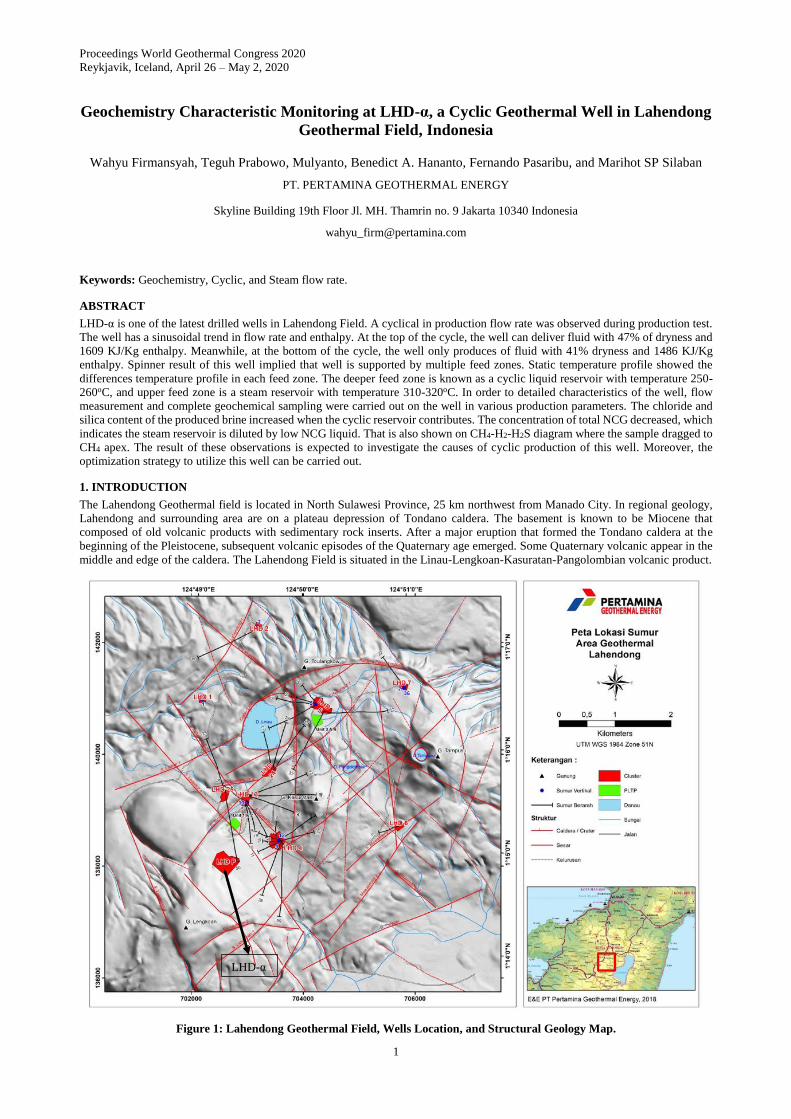
The Lahendong Geothermal field is located in North Sulawesi Province, 25 km northwest from Manado City. In regional geology,
Lahendong and surrounding area are on a plateau depression of Tondano caldera. The basement is known to be Miocene that
composed of old volcanic products with sedimentary rock inserts. After a major eruption that formed the Tondano caldera at the
beginning of the Pleistocene, subsequent volcanic episodes of the Quaternary age emerged. Some Quaternary volcanic appear in the
middle and edge of the caldera. The Lahendong Field is situated in the Linau-Lengkoan-Kasuratan-Pangolombian volcanic product.
Figure 1: Lahendong Geothermal Field, Wells Location, and Structural Geology Map.
LHD-α
Wahyu Firmansyah, Teguh Prabowo, Mulyanto, Benedict A. Hananto, Fernando Pasaribu, and Marihot SP Silaban
2
Lahendong geothermal field has been operating for 18 years since Unit 1 in 2001 with 1x20 MW. The current capacity generation of
Lahendong is 80 MW from 4 power plant. For generating 80 MW, 14 production wells are utilized to supply the steam, and six
injection wells are occupied to dump brine and condensate waste. Lahendong Field is a two-phase geothermal reservoir characteristic
with two different part of reservoir zone. The Southern reservoir has temperatures of 300 to 350oC with dryness about 80%, and the
northern reservoir has lower temperatures between 250 to 280oC with dryness around 30% (Koestono, 2010). The total production
rate from the 14 production wells is about 1,306 t/h, consisting of 631 t/h of steam and 675 t/h of brine. For injection purposes, there
are five injection wells, LHD-7, LHD-22, and LHD-36 located in cluster 7, LHD-29 in cluster 24, LHD-50 located in cluster 25 and
LHD-51 located in cluster 37. The total of injection capacity for all wells is 2943 t/h. However, the field only has total mass injected
835 t/h from brine and condensate of condensing power plant.
LHD-α is the lastest well drilled in Lahendong field. This well is drilled to confirm the existence of the possible prospect under G.
Lengkoan. The map of the Lahendong geological structure (Figure 1) shows that there are NE-SW and NW – SE faults located on
the south and east of Mount Lengkoan, continuing to the eastern part of Lahendong Field. In the beginning, the goal of LHD-α drilling
was to prove the spread of heat in Lahendong southern part, especially under Mount Lengkoang. Furthermore, because of the lack of
steam availability in this field, the result was also expected to fulfill the steam demand for Lahendong Unit 1-4 operations.
2. GEOTHERMAL CONCEPTUAL MODEL
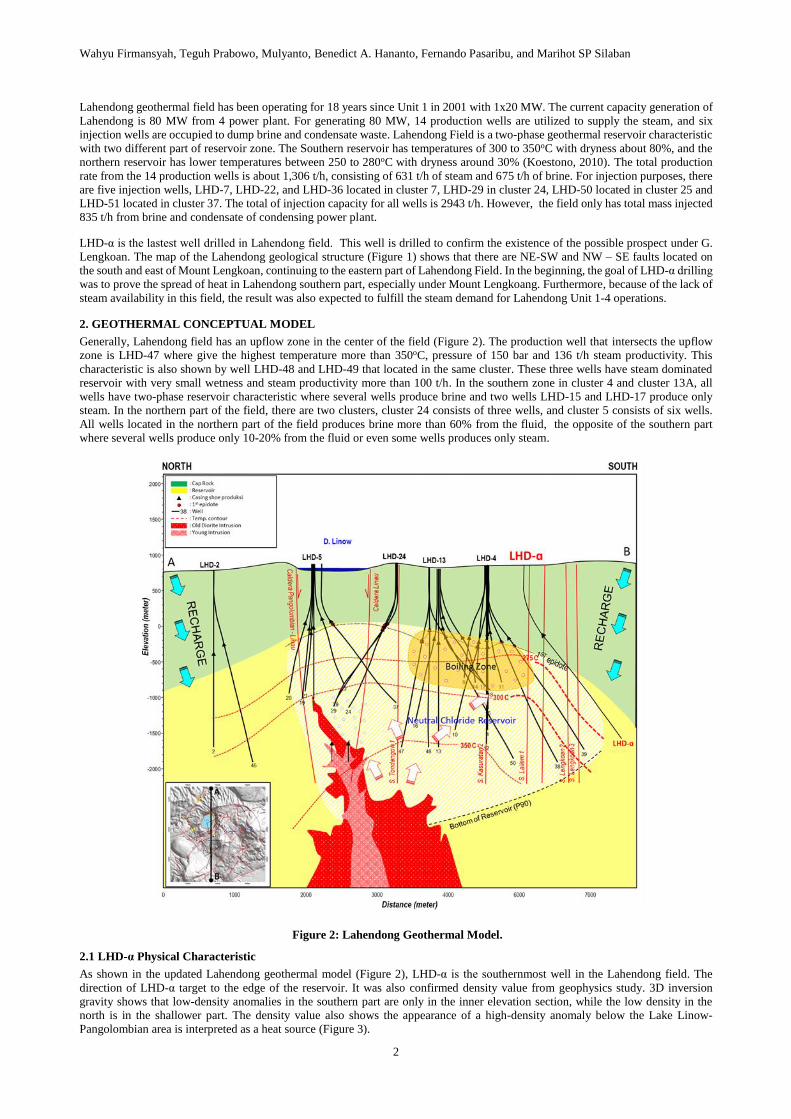
Generally, Lahendong field has an upflow zone in the center of the field (Figure 2). The production well that intersects the upflow
zone is LHD-47 where give the highest temperature more than 350oC, pressure of 150 bar and 136 t/h steam productivity. This
characteristic is also shown by well LHD-48 and LHD-49 that located in the same cluster. These three wells have steam dominated
reservoir with very small wetness and steam productivity more than 100 t/h. In the southern zone in cluster 4 and cluster 13A, all
wells have two-phase reservoir characteristic where several wells produce brine and two wells LHD-15 and LHD-17 produce only
steam. In the northern part of the field, there are two clusters, cluster 24 consists of three wells, and cluster 5 consists of six wells.
All wells located in the northern part of the field produces brine more than 60% from the fluid, the opposite of the southern part
where several wells produce only 10-20% from the fluid or even some wells produces only steam.
Figure 2: Lahendong Geothermal Model.
2.1 LHD-α Physical Characteristic
As shown in the updated Lahendong geothermal model (Figure 2), LHD-α is the southernmost well in the Lahendong field. The
direction of LHD-α target to the edge of the reservoir. It was also confirmed density value from geophysics study. 3D inversion
gravity shows that low-density anomalies in the southern part are only in the inner elevation section, while the low density in the
north is in the shallower part. The density value also shows the appearance of a high-density anomaly below the Lake Linow-
Pangolombian area is interpreted as a heat source (Figure 3).

Wahyu Firmansyah, Teguh Prabowo, Mulyanto, Benedict A. Hananto, Fernando Pasaribu, and Marihot SP Silaban
3
Figure 3: Lahendong Model based on Geophysic Density Value .
2.1.1 LHD-α Well Testing
The production test method used on LHD-α was horizontal lip pressure. In this method, two-phase fluids are flashed on the silencer.
The silencer functions to muffle the sound and flashing the bursts of two-phase geothermal fluid. At the silencer, there is a weir box
equipped with a V-Notch which functions to calculate the brine rate, while the steam and brine are flashed then channeled into the
atmosphere through the silencer chimney. LHD-α was open gradually until it was 100% throttle valve open. Then the wellhead
pressure is set with the variations on throttle valve openings. When the Throttle Valve opening is 20%, the wellhead pressure starts
to fluctuate (Figure 4). This affects the other parameters such as P line, Temp Line, P-lip, and water level in the weirbox. The wellhead
pressure fluctuated between 4.1 - 6.2 bar with a repetitive cycle of about 15 minutes (Figure 4b). When the throttle valve opening
reduced to only 15%, the fluctuations in the wellhead pressure increase in the range between 5.2 - 8.3 bar with a repetitive cycle of
about 20 minutes. The sample of LHD-α fluid was taken in two conditions. The first condition was on the static wellhead pressure
(WHP = 3.6 bar) with a variation on the throttle valve: 100 %, 50%, and 40%. The second condition was on the same throttle valve
(10%) with a variation on WHP: 4.0, 6.0, and 7.8 bar.
Figure 4: Barton Measurement for Different Throttle Valve.
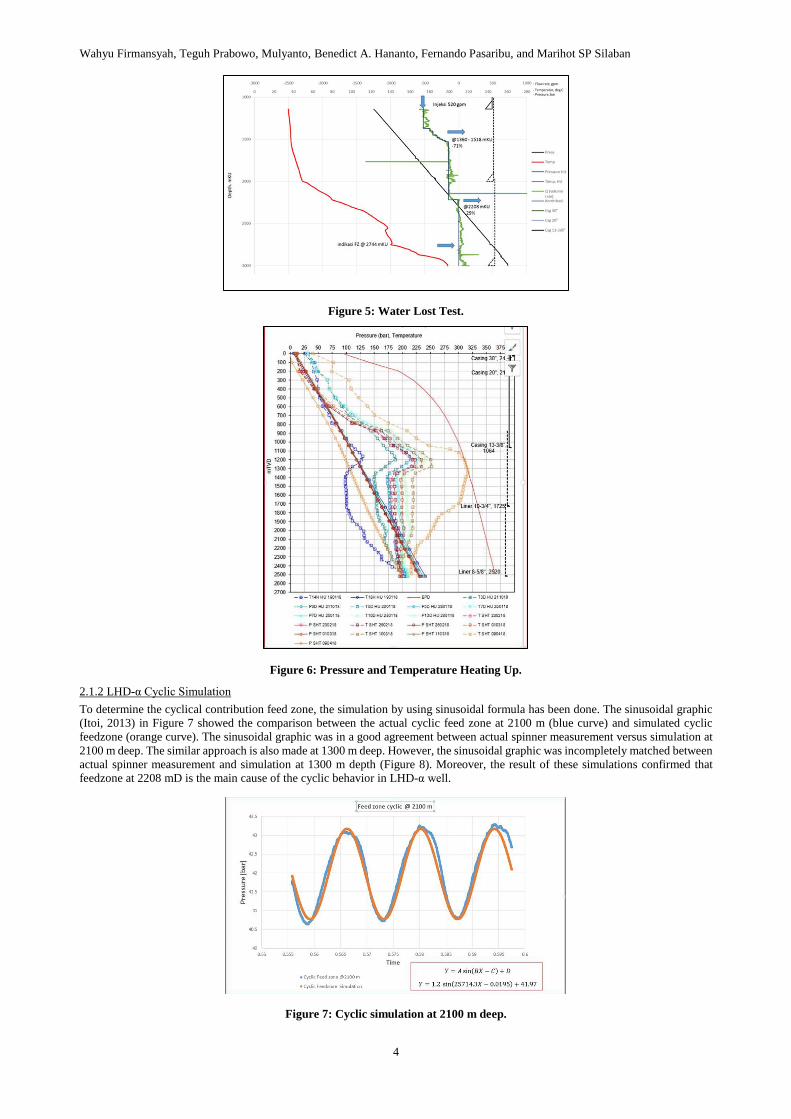
From those conditions was known that LHD-α is cyclic geothermal well. Furthermore, water lost test and PTS injection measurement
were also conducted to the well, respectively. The water test result concluded that there are two feed zones in the well LHD-α, as
seen in Figure 5. The first feed zone is located in 1360-1518 meters depth (mD) that accepts 71% water during water loss test, the
pressure and temperature (PT) measurement (Figure 6) showed that only in 1360-1518 meters depth had high temperature profile.
Wahyu Firmansyah, Teguh Prabowo, Mulyanto, Benedict A. Hananto, Fernando Pasaribu, and Marihot SP Silaban
4
Figure 5: Water Lost Test.
Figure 6: Pressure and Temperature Heating Up.
2.1.2 LHD-α Cyclic Simulation
To determine the cyclical contribution feed zone, the simulation by using sinusoidal formula has been done. The sinusoidal graphic
(Itoi, 2013) in Figure 7 showed the comparison between the actual cyclic feed zone at 2100 m (blue curve) and simulated cyclic
feedzone (orange curve). The sinusoidal graphic was in a good agreement between actual spinner measurement versus simulation at
2100 m deep. The similar approach is also made at 1300 m deep. However, the sinusoidal graphic was incompletely matched between
actual spinner measurement and simulation at 1300 m depth (Figure 8). Moreover, the result of these simulations confirmed that
feedzone at 2208 mD is the main cause of the cyclic behavior in LHD-α well.
Figure 7: Cyclic simulation at 2100 m deep.

Wahyu Firmansyah, Teguh Prabowo, Mulyanto, Benedict A. Hananto, Fernando Pasaribu, and Marihot SP Silaban
5
Figure 8: Cyclic simulation at 1300 m deep.
2.2 LHD-α Chemical Characteristic
2.2.1 LHD-α Liquid Composition and Characteristic
As described priorly, the fluid sample was taken in the two conditions for monitoring purpose. As shown in the Table.1, there are six
complete chemistry samples taken during well production test, including brine, condensate, and non-condensible gas. Last three
samples were taken in the three conditions which represent the crest, middle, and the trough of sinusoidal graphic. The highest WHP
occurred when the cyclic feed zone was contributed. However, the enthalpy of the well decreased due to more water added from this
feedzone.
Table.1. Well parameters during geochemical sampling
The reservoir chemical concentration is obtained by using total discharge calculation (Nicholson, 1993) as shown in Table 2. The
concentration of chloride (Cl) in the reservoir increased about 60 ppm when the cyclic feed zone is contributed, but on the other hand,
anion bicarbonates (HCO3) and Sulfate (SO4) decreased. Increasing of Cl indicates that the liquid reservoir contributed to the
production. This condition also followed by increasing of SiO2. There was a significant positive correlation with decreasing of SO4
and HCO3 concentration where the reservoir liquid has a small amount of these two constituents. Moreover, boron as constituent that
usually occurs in the steam-heated water zone is also decreased.
Table.2. Reservoir Geochemistry Data
The anion Cl-SO4-HCO3 ternary diagram (Figure 9) showed that the contribution of cyclical feedzone did not change not only the
type of water of LHD-α but also the equilibrium condition of Na/K geothermometer. Nevertheless, the change of Na/K
geothermometer was observed where the liquid feed zone contribution had increased the temperature. This is related to the excess of
sodium (Na) from the deeper part of the system.
WHP FCV Enthalpy
(barg) (%) meas. (kJ/kg) Brine Steam Total
LHD-α 3,60 100 1504 33,0 24,2 57,2 42%
LHD-α 3,60 50,0 1487 33,0 23,4 56,4 41%
LHD-α 3,60 40,0 1609 27,2 24,3 51,5 47%
LHD-α 4,00 10,0 1082 9,01 2,75 11,8 23%
LHD-α 6,00 10,0 931 13,3 2,53 15,9 16%
LHD-α 7,80 10,0 763 44,6 2,84 47,4 6%
WellFlowrate
Dryness
WHP FCV
(barg) (%) Na+ K+ Ca++ Mg++ HCO3- Cl- SO4= B SiO2
LHD-α 3,60 100 375 70,4 3,38 0,01 49,3 506 84,5 16,9 619
LHD-α 3,60 50,0 362 61,6 5,33 0,02 29,7 503 73,8 15,2 491
LHD-α 3,60 40,0 320 72,6 4,82 0,01 12,2 489 57,5 12,9 570
LHD-α 4,00 10,0 373 59,4 2,59 0,01 73,7 585 65,8 23,1 609
LHD-α 6,00 10,0 380 74,0 2,50 0,01 80,3 626 57,8 23,8 588
LHD-α 7,80 10,0 387 68,9 2,81 0,01 69,3 642 48,6 16,8 633
Total Discharges Concentration (ppm)Well
Wahyu Firmansyah, Teguh Prabowo, Mulyanto, Benedict A. Hananto, Fernando Pasaribu, and Marihot SP Silaban
6
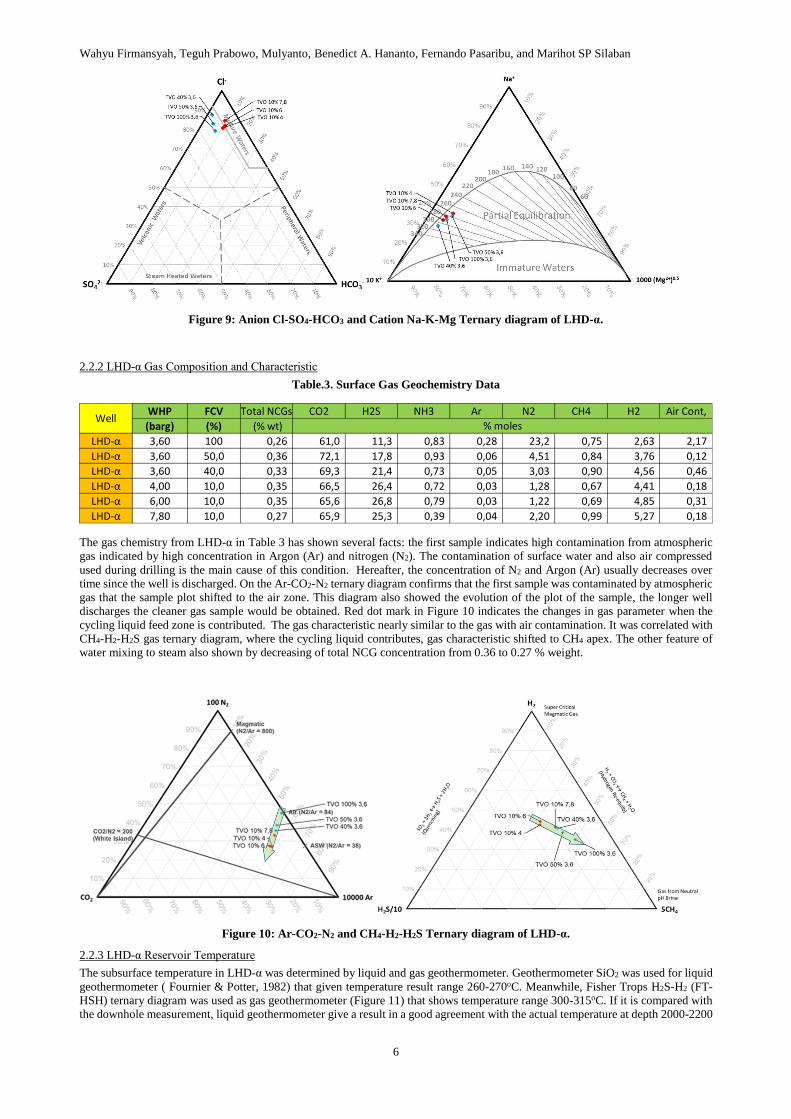
Figure 9: Anion Cl-SO4-HCO3 and Cation Na-K-Mg Ternary diagram of LHD-α.
2.2.2 LHD-α Gas Composition and Characteristic
Table.3. Surface Gas Geochemistry Data
The gas chemistry from LHD-α in Table 3 has shown several facts: the first sample indicates high contamination from atmospheric
gas indicated by high concentration in Argon (Ar) and nitrogen (N2). The contamination of surface water and also air compressed
used during drilling is the main cause of this condition. Hereafter, the concentration of N2 and Argon (Ar) usually decreases over
time since the well is discharged. On the Ar-CO2-N2 ternary diagram confirms that the first sample was contaminated by atmospheric
gas that the sample plot shifted to the air zone. This diagram also showed the evolution of the plot of the sample, the longer well
discharges the cleaner gas sample would be obtained. Red dot mark in Figure 10 indicates the changes in gas parameter when the
cycling liquid feed zone is contributed. The gas characteristic nearly similar to the gas with air contamination. It was correlated with
CH4-H2-H2S gas ternary diagram, where the cycling liquid contributes, gas characteristic shifted to CH4 apex. The other feature of
water mixing to steam also shown by decreasing of total NCG concentration from 0.36 to 0.27 % weight.
Figure 10: Ar-CO2-N2 and CH4-H2-H2S Ternary diagram of LHD-α.
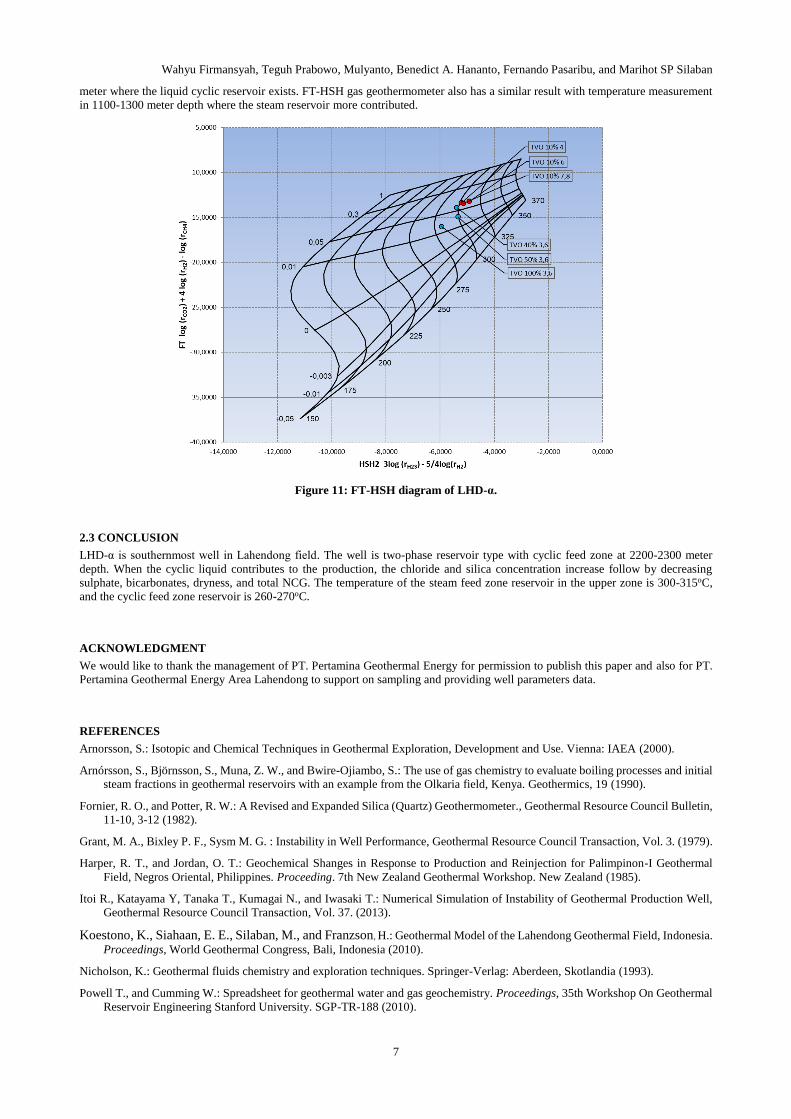
2.2.3 LHD-α Reservoir Temperature
The subsurface temperature in LHD-α was determined by liquid and gas geothermometer. Geothermometer SiO2 was used for liquid
geothermometer ( Fournier & Potter, 1982) that given temperature result range 260-270oC. Meanwhile, Fisher Trops H2S-H2 (FT-
HSH) ternary diagram was used as gas geothermometer (Figure 11) that shows temperature range 300-315oC. If it is compared with
the downhole measurement, liquid geothermometer give a result in a good agreement with the actual temperature at depth 2000-2200
WHP FCV Total NCGs CO2 H2S NH3 Ar N2 CH4 H2 Air Cont,
(barg) (%) (% wt)
LHD-α 3,60 100 0,26 61,0 11,3 0,83 0,28 23,2 0,75 2,63 2,17
LHD-α 3,60 50,0 0,36 72,1 17,8 0,93 0,06 4,51 0,84 3,76 0,12
LHD-α 3,60 40,0 0,33 69,3 21,4 0,73 0,05 3,03 0,90 4,56 0,46
LHD-α 4,00 10,0 0,35 66,5 26,4 0,72 0,03 1,28 0,67 4,41 0,18
LHD-α 6,00 10,0 0,35 65,6 26,8 0,79 0,03 1,22 0,69 4,85 0,31
LHD-α 7,80 10,0 0,27 65,9 25,3 0,39 0,04 2,20 0,99 5,27 0,18
Well% moles
Wahyu Firmansyah, Teguh Prabowo, Mulyanto, Benedict A. Hananto, Fernando Pasaribu, and Marihot SP Silaban
7
meter where the liquid cyclic reservoir exists. FT-HSH gas geothermometer also has a similar result with temperature measurement
in 1100-1300 meter depth where the steam reservoir more contributed.
Figure 11: FT-HSH diagram of LHD-α.
2.3 CONCLUSION
LHD-α is southernmost well in Lahendong field. The well is two-phase reservoir type with cyclic feed zone at 2200-2300 meter
depth. When the cyclic liquid contributes to the production, the chloride and silica concentration increase follow by decreasing
sulphate, bicarbonates, dryness, and total NCG. The temperature of the steam feed zone reservoir in the upper zone is 300-315oC,
and the cyclic feed zone reservoir is 260-270oC.
ACKNOWLEDGMENT
We would like to thank the management of PT. Pertamina Geothermal Energy for permission to publish this paper and also for PT.
Pertamina Geothermal Energy Area Lahendong to support on sampling and providing well parameters data.
REFERENCES
Arnorsson, S.: Isotopic and Chemical Techniques in Geothermal Exploration, Development and Use. Vienna: IAEA (2000).
Arnórsson, S., Björnsson, S., Muna, Z. W., and Bwire-Ojiambo, S.: The use of gas chemistry to evaluate boiling processes and initial
steam fractions in geothermal reservoirs with an example from the Olkaria field, Kenya. Geothermics, 19 (1990).
Fornier, R. O., and Potter, R. W.: A Revised and Expanded Silica (Quartz) Geothermometer., Geothermal Resource Council Bulletin,
11-10, 3-12 (1982).
Grant, M. A., Bixley P. F., Sysm M. G. : Instability in Well Performance, Geothermal Resource Council Transaction, Vol. 3. (1979).
Harper, R. T., and Jordan, O. T.: Geochemical Shanges in Response to Production and Reinjection for Palimpinon-I Geothermal
Field, Negros Oriental, Philippines. Proceeding. 7th New Zealand Geothermal Workshop. New Zealand (1985).
Itoi R., Katayama Y, Tanaka T., Kumagai N., and Iwasaki T.: Numerical Simulation of Instability of Geothermal Production Well,
Geothermal Resource Council Transaction, Vol. 37. (2013).
Koestono, K., Siahaan, E. E., Silaban, M., and Franzson, H.: Geothermal Model of the Lahendong Geothermal Field, Indonesia.
Proceedings, World Geothermal Congress, Bali, Indonesia (2010).
Nicholson, K.: Geothermal fluids chemistry and exploration techniques. Springer-Verlag: Aberdeen, Skotlandia (1993).
Powell T., and Cumming W.: Spreadsheet for geothermal water and gas geochemistry. Proceedings, 35th Workshop On Geothermal
Reservoir Engineering Stanford University. SGP-TR-188 (2010).

Wahyu Firmansyah, Teguh Prabowo, Mulyanto, Benedict A. Hananto, Fernando Pasaribu, and Marihot SP Silaban
8
Prabowo, T., Yuniar, D. M., Suryanto, S., Silaban, M.: Tracer Test Implementation and Analysis in Order to Evaluate Reinjection
Effects in Lahendong Field, Indonesia. Proceeding. World Geothermal Congress, Melbourne. Australia (2015).
Prasetyo, F., O’Sullivan, J., O’Sullivan, M.: Inverse Modelling of Lahendong Geothermal Field., New Zealand Geothermal Workshop
(2016).
Truesdell, A. H., Lippmann, M. J., Quijano, J. L., and D’Amore, F.: Chemical and Physical Indicators of Reservoir Processes in
Exploited High-Temperature, Liquid-Dominated Geothermal Fields. Proceeding. World Geothermal Congress, Florence.
Italy,Vol. 3. (1995).
Utami, P., Widarto D, S., Atmojo J. P., Kamah Y., Browne P., Warmada I. W., Bignall G., and Chambefort I.: Hydrothermal
Alteration and Evolution of the Lahendong Geothermal System, North Sulawesi, Proceedings, World Geothermal Congress,
Melborne, Australia (2015).