New approaches to study historical evolution of mortality (with implications for forecasting)
Genomic Approaches to Translocation Sarcomas
Marc Ladanyi
Memorial Sloan-Kettering Cancer CenterNew York, NY, USA
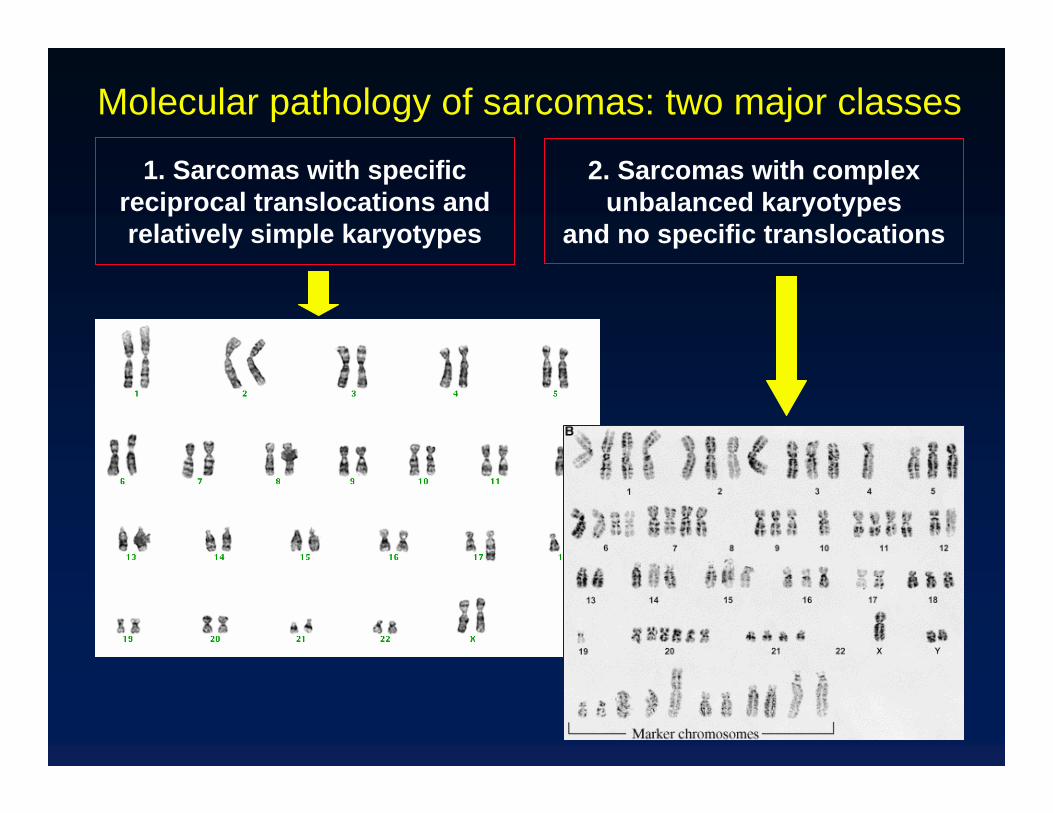
Molecular pathology of sarcomas: two major classes
1. Sarcomas with specific reciprocal translocations and relatively simple karyotypes
2. Sarcomas with complex unbalanced karyotypes
and no specific translocations
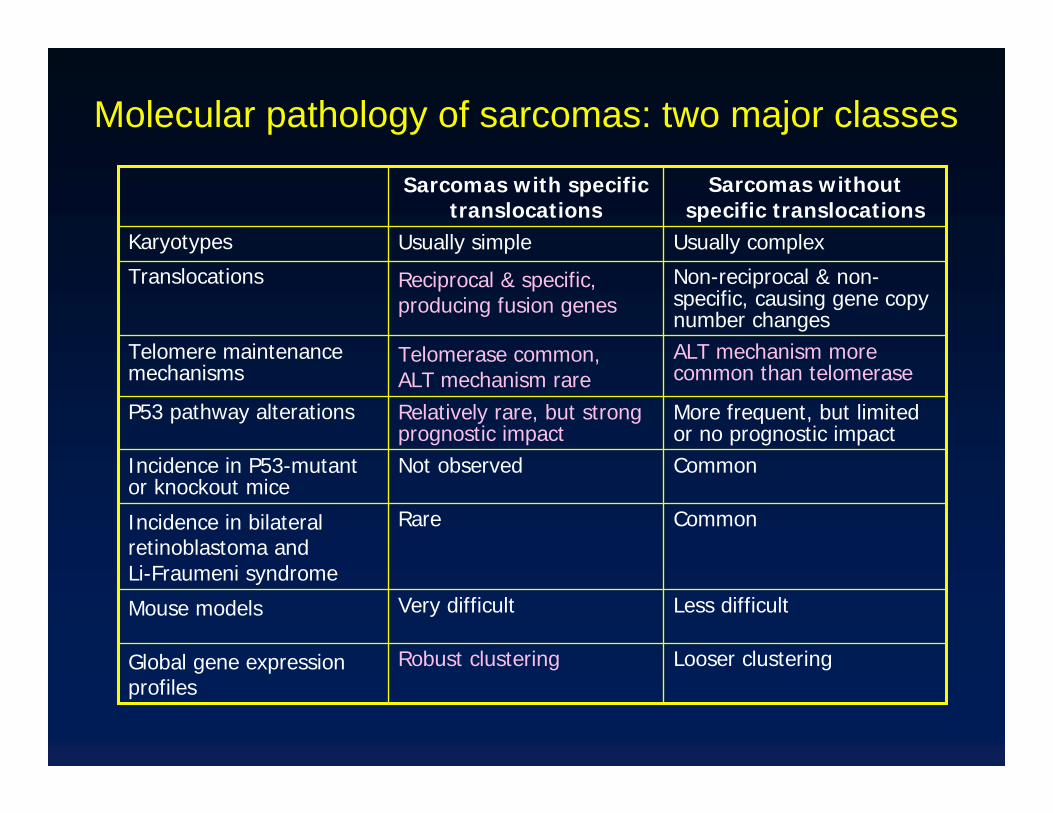
Less difficultVery difficultMouse models
Looser clusteringRobust clusteringGlobal gene expression profiles
CommonRareIncidence in bilateral retinoblastoma and Li-Fraumeni syndrome
CommonNot observedIncidence in P53-mutant or knockout mice
More frequent, but limited or no prognostic impact
Relatively rare, but strong prognostic impact
P53 pathway alterations
ALT mechanism more common than telomerase
Telomerase common, ALT mechanism rare
Telomere maintenance mechanisms
Non-reciprocal & non-specific, causing gene copy number changes
Reciprocal & specific, producing fusion genes
Translocations
Usually complexUsually simpleKaryotypes
Sarcomas without specific translocations
Sarcomas with specific translocations
Molecular pathology of sarcomas: two major classes
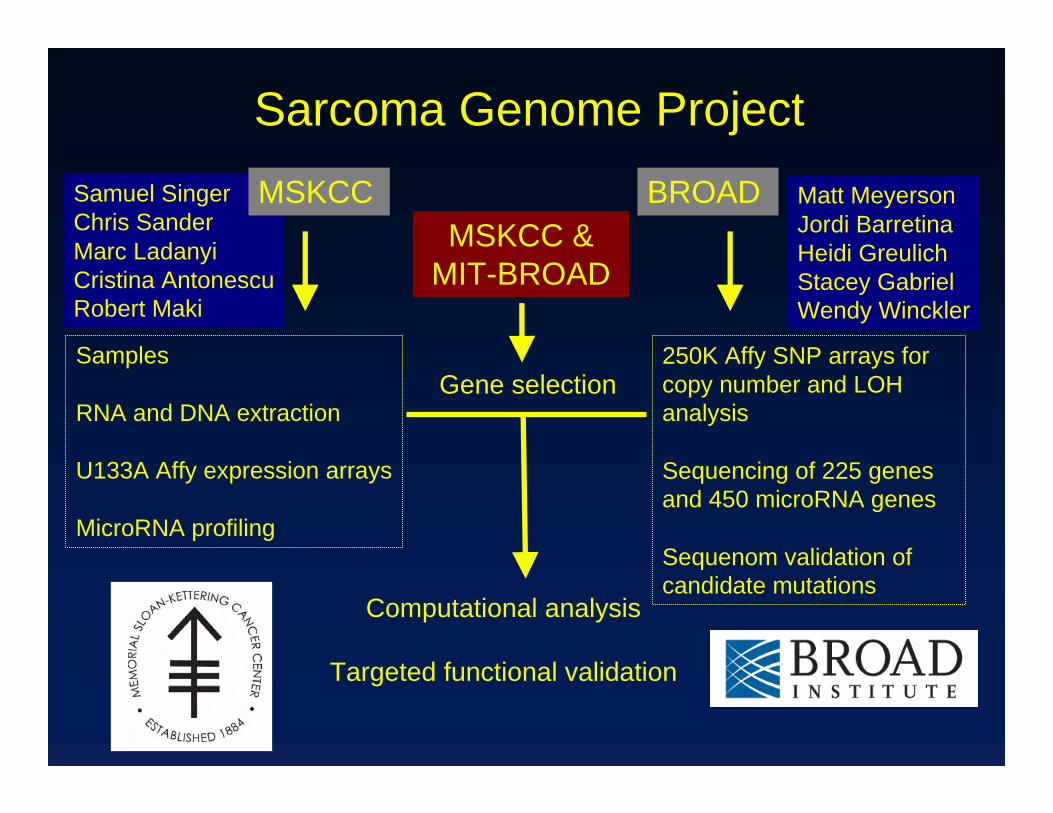
Samuel SingerChris SanderMarc LadanyiCristina AntonescuRobert Maki
MSKCC BROAD Matt MeyersonJordi BarretinaHeidi Greulich Stacey GabrielWendy Winckler
MSKCC & MIT-BROAD
Computational analysis
Targeted functional validation
Samples
RNA and DNA extraction
U133A Affy expression arrays
MicroRNA profiling
250K Affy SNP arrays for copy number and LOH analysis
Sequencing of 225 genes and 450 microRNA genes
Sequenom validation of candidate mutations
Sarcoma Genome Project
Gene selection
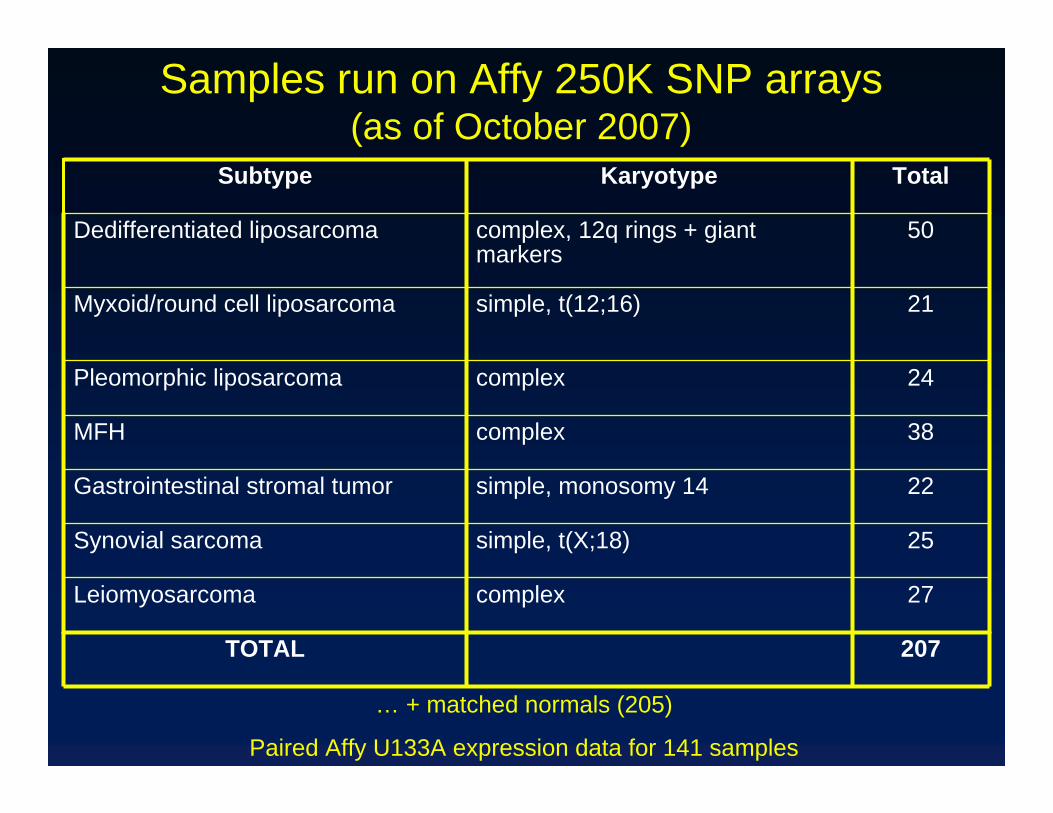
Samples run on Affy 250K SNP arrays (as of October 2007)
50complex, 12q rings + giant markers
Dedifferentiated liposarcoma
207TOTAL
27complexLeiomyosarcoma
25simple, t(X;18)Synovial sarcoma
22simple, monosomy 14Gastrointestinal stromal tumor
38complexMFH
24complexPleomorphic liposarcoma
21simple, t(12;16)Myxoid/round cell liposarcoma
TotalKaryotypeSubtype
… + matched normals (205)
Paired Affy U133A expression data for 141 samples
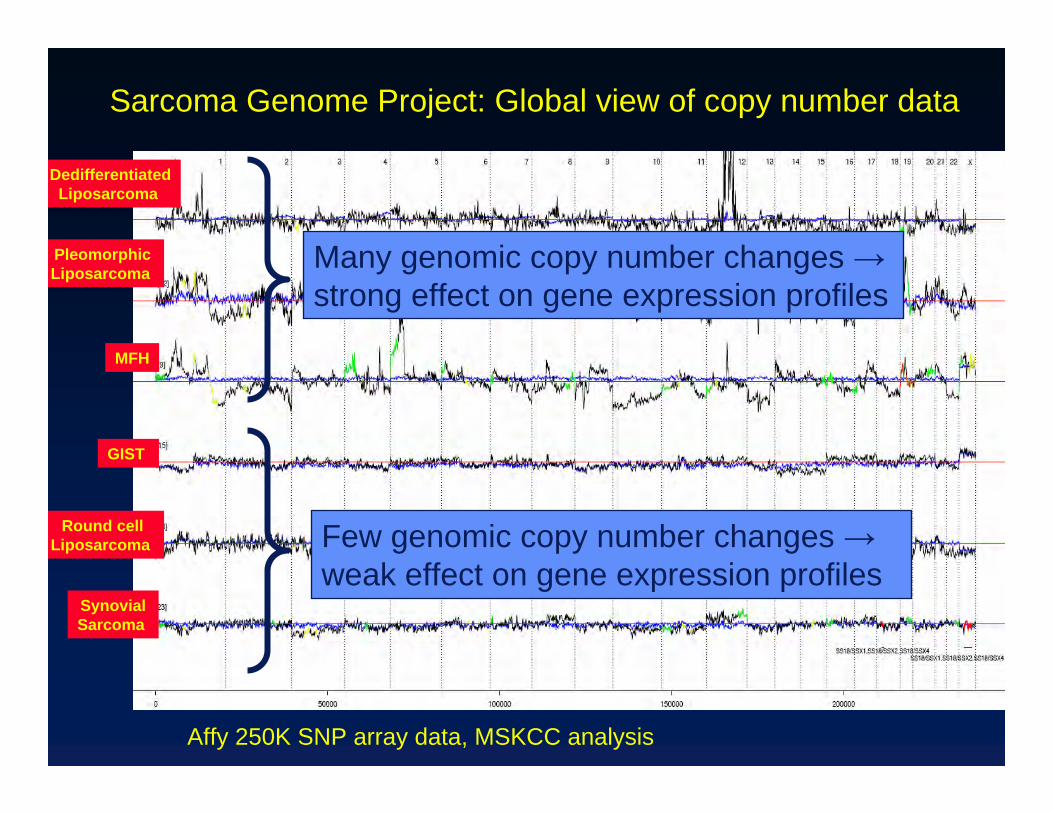
DedifferentiatedLiposarcoma
PleomorphicLiposarcoma
MFH
Round cellLiposarcoma
SynovialSarcoma
GIST
Affy 250K SNP array data, MSKCC analysis
Sarcoma Genome Project: Global view of copy number data
Many genomic copy number changes →strong effect on gene expression profiles
Few genomic copy number changes →weak effect on gene expression profiles
Genomic Approaches to Sarcomas
• Complex karyotype sarcomas will require integration of genomic copy number data with expression profiling data– Expression profiles contain many “passenger genes”
from regions of gains or losses• Translocation sarcomas: expression profiling data
alone more likely to be informative– Reflect lineage + effect of aberrant transcription factor– Probably less biological “noise” than expression profiles
of complex karyotype sarcomas

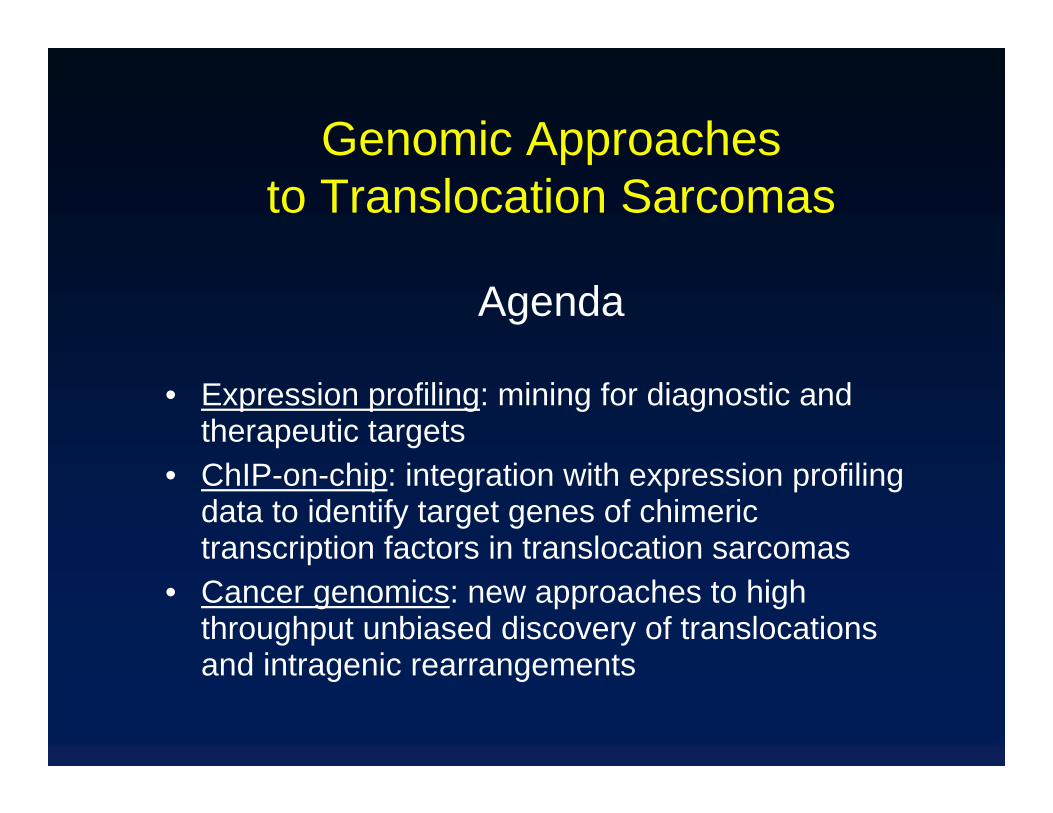
Genomic Approaches to Translocation Sarcomas
Agenda
Expression profiling: mining for diagnostic and therapeutic targets
• ChIP-on-chip: integration with expression profiling data to identify target genes of chimeric transcription factors in translocation sarcomas
• Cancer genomics: new approaches to high throughput unbiased discovery of translocations
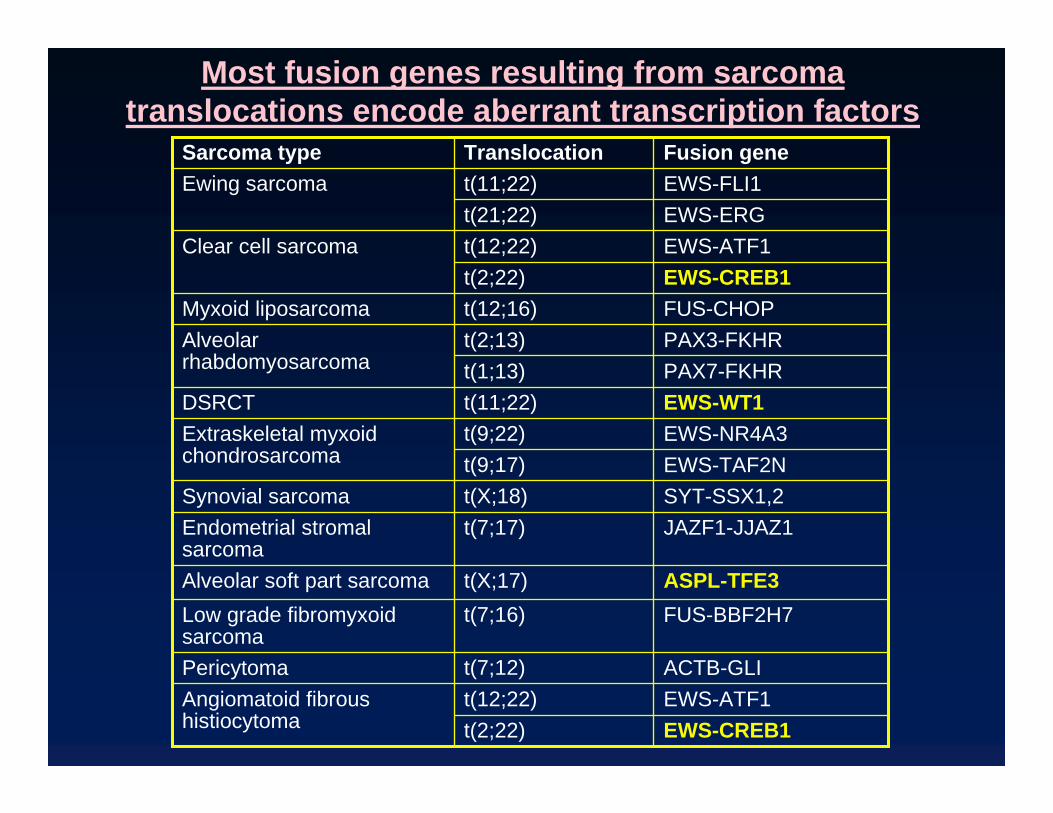
EWS-ATF1t(12;22)
EWS-CREB1t(2;22)
ACTB-GLIt(7;12)Pericytoma
FUS-BBF2H7t(7;16)Low grade fibromyxoid sarcoma
EWS-TAF2Nt(9;17)EWS-NR4A3t(9;22)Extraskeletal myxoid
chondrosarcoma
FUS-CHOPt(12;16)Myxoid liposarcoma
JAZF1-JJAZ1t(7;17) Endometrial stromal sarcoma
EWS-CREB1t(2;22)Angiomatoid fibrous histiocytoma
ASPL-TFE3t(X;17)Alveolar soft part sarcoma
SYT-SSX1,2t(X;18)Synovial sarcoma
EWS-WT1t(11;22)DSRCTPAX7-FKHRt(1;13)PAX3-FKHRt(2;13)Alveolar
rhabdomyosarcoma
EWS-ATF1t(12;22)Clear cell sarcomaEWS-ERGt(21;22)EWS-FLI1t(11;22)Ewing sarcomaFusion gene Translocation Sarcoma type
Most fusion genes resulting from sarcoma translocations encode aberrant transcription factors

Expression profiling dataset on sarcomas with chimeric transcription factors
* all significant at Bonferroni p<0.01 relative to 4 other sarcoma types
294215728ES/PNET
531159012ASPS
554316328DSRCT
282151823ARMS
638681646SS
Subset with≥ 2 fold over-expression*
Genes significantly
over- or under-expressed*
Samples
11 ASPL-TFE3 type 13 ASPL-TFE3 type 2
14Alveolar Soft Part Sarcoma (ASPS)
22 EWS-FLI1 type 111 EWS-FLI1 type 2
5 EWS-ERG
38Ewing Sarcoma/PNET (ES)
25 SYT-SSX121 SYT-SSX2
46Synovial Sarcoma (SS)
32 EWS-WT132Desmoplastic Small Round Cell Tumor (DSRCT)
16 PAX3-FKHR7 PAX7-FKHR
23Alveolar Rhabdo-myosarcoma (ARMS)
• Chip: Affymetrix U133A• Data processing: RMA method• Clustering: Pearson correlation• Data used: all 22215 probe sets• n=137 tumors from MSKCC and U.Penn. (F. Barr)• + 4 xenografts + 12 cell lines = 153 total samples
ASPS ES SS DSRCT ARMS
M. Laé, T. Saito, et al., Ladanyi Lab
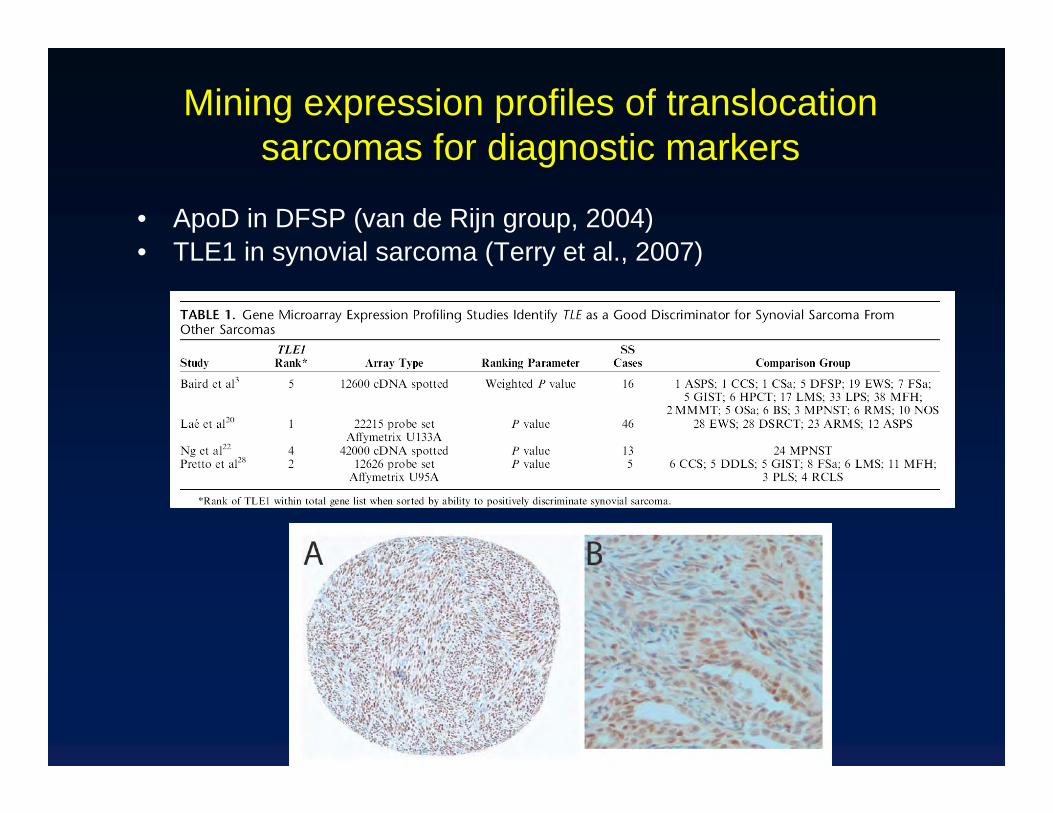
Mining expression profiles of translocation sarcomas for diagnostic markers
• ApoD in DFSP (van de Rijn group, 2004)• TLE1 in synovial sarcoma (Terry et al., 2007)
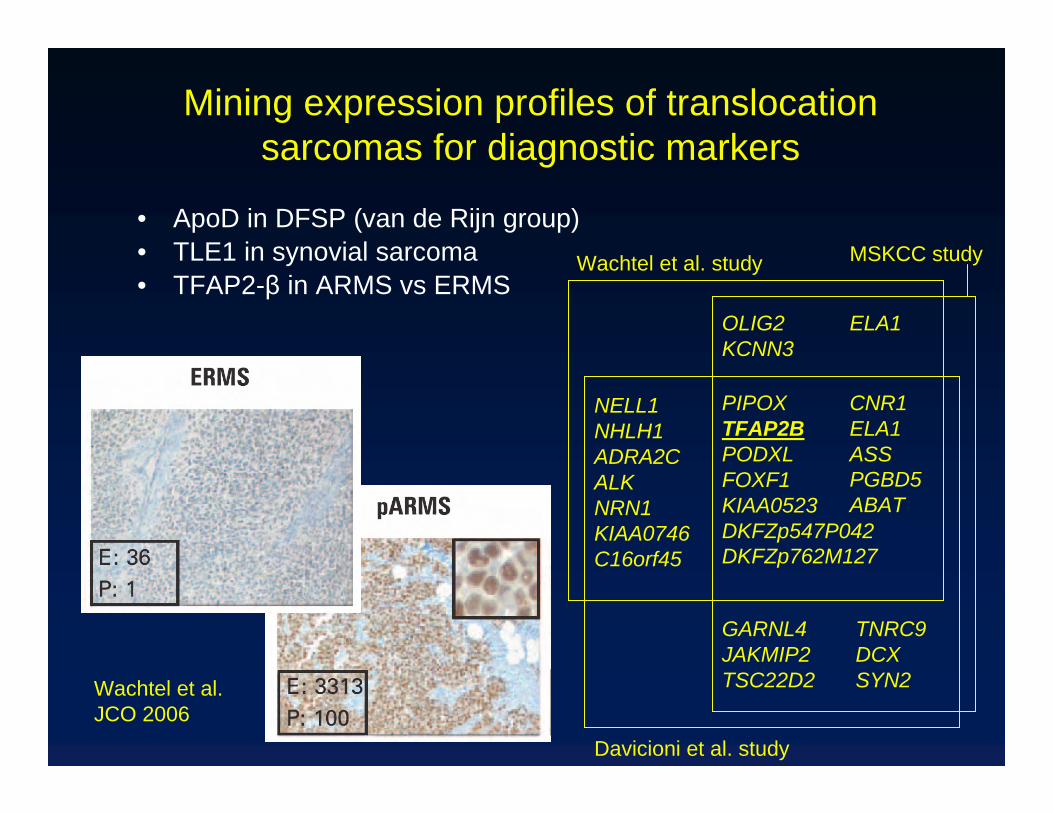
ARMS >> ERMS genes: overlap between 3 microarray studies
Mining expression profiles of translocation sarcomas for diagnostic markers
• ApoD in DFSP (van de Rijn group)• TLE1 in synovial sarcoma • TFAP2-β in ARMS vs ERMS
OLIG2 KCNN3
CNR1ELA1ASSPGBD5 ABAT
Wachtel et al. study MSKCC study
Davicioni et al. study
NELL1NHLH1ADRA2CALKNRN1KIAA0746 C16orf45
GARNL4 JAKMIP2 TSC22D2
TNRC9 DCX SYN2
PIPOX TFAP2BPODXL FOXF1KIAA0523DKFZp547P042DKFZp762M127
ELA1
Wachtel et al. JCO 2006
Mining expression profiles of translocation sarcomas for therapeutic targets
• Kinase genes– Family of genes involved in signaling; rich in drug targets
• Approach: – Identified 739 probe sets on U133A chip corresponding to 432
genes with kinase domains based on searches of the Affymetrix annotation database, published data and genome databases
• 83% of the 518 known protein kinase genes– Performed unsupervised clustering and supervised comparisons
focused on these 739 probe sets
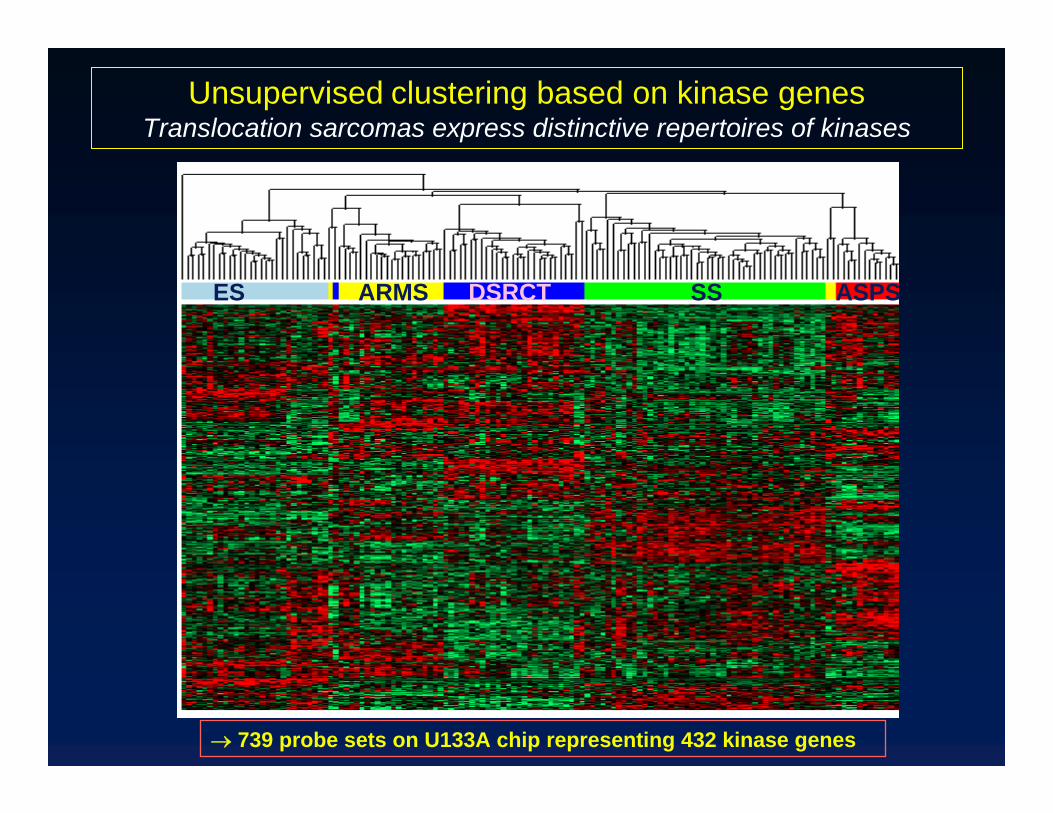
Unsupervised clustering based on kinase genesTranslocation sarcomas express distinctive repertoires of kinases
→ 739 probe sets on U133A chip representing 432 kinase genes
ES ARMS DSRCT SS ASPS
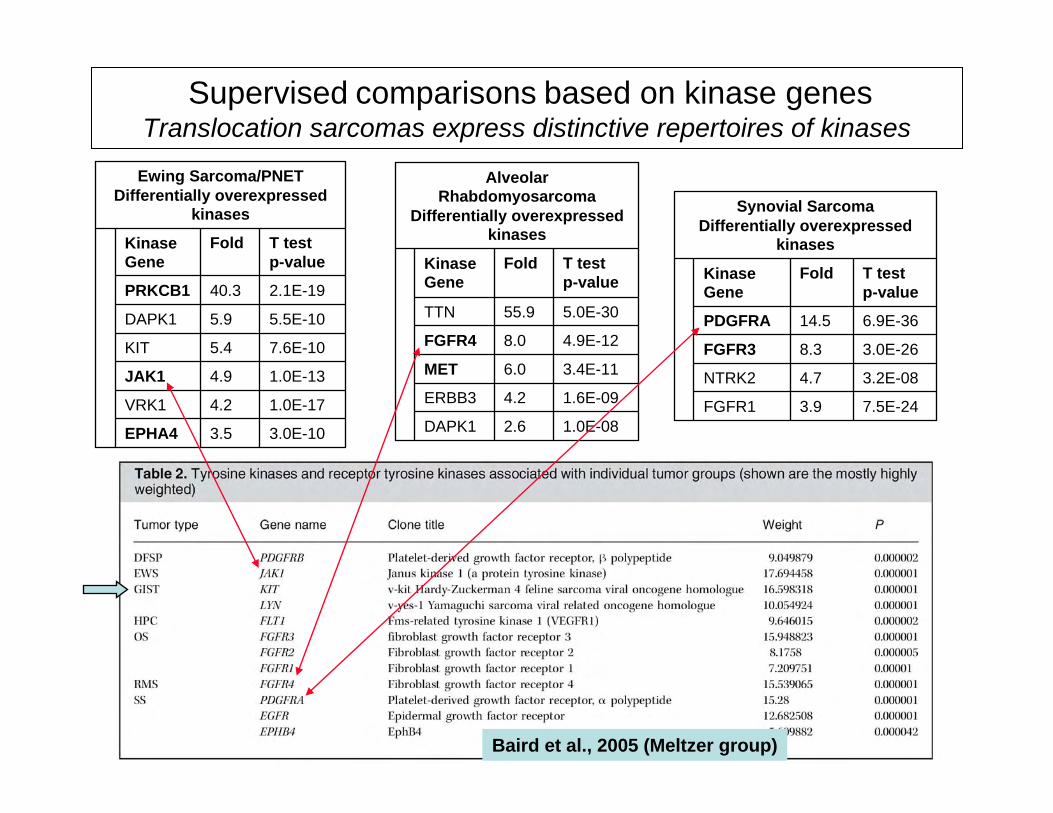
Baird et al., 2005 (Meltzer group)
3.0E-103.5EPHA4
1.0E-174.2VRK1
1.0E-134.9JAK1
7.6E-105.4KIT
5.5E-105.9DAPK1
2.1E-1940.3PRKCB1
T test p-value
Fold Kinase Gene
Ewing Sarcoma/PNETDifferentially overexpressed
kinases
7.5E-243.9FGFR1
3.2E-084.7NTRK2
3.0E-268.3FGFR3
6.9E-3614.5PDGFRA
T test p-value
Fold Kinase Gene
Synovial SarcomaDifferentially overexpressed
kinases
1.0E-082.6DAPK1
1.6E-094.2ERBB3
3.4E-116.0MET
4.9E-128.0FGFR4
5.0E-3055.9TTN
T test p-value
Fold Kinase Gene
Alveolar Rhabdomyosarcoma
Differentially overexpressed kinases
Supervised comparisons based on kinase genesTranslocation sarcomas express distinctive repertoires of kinases
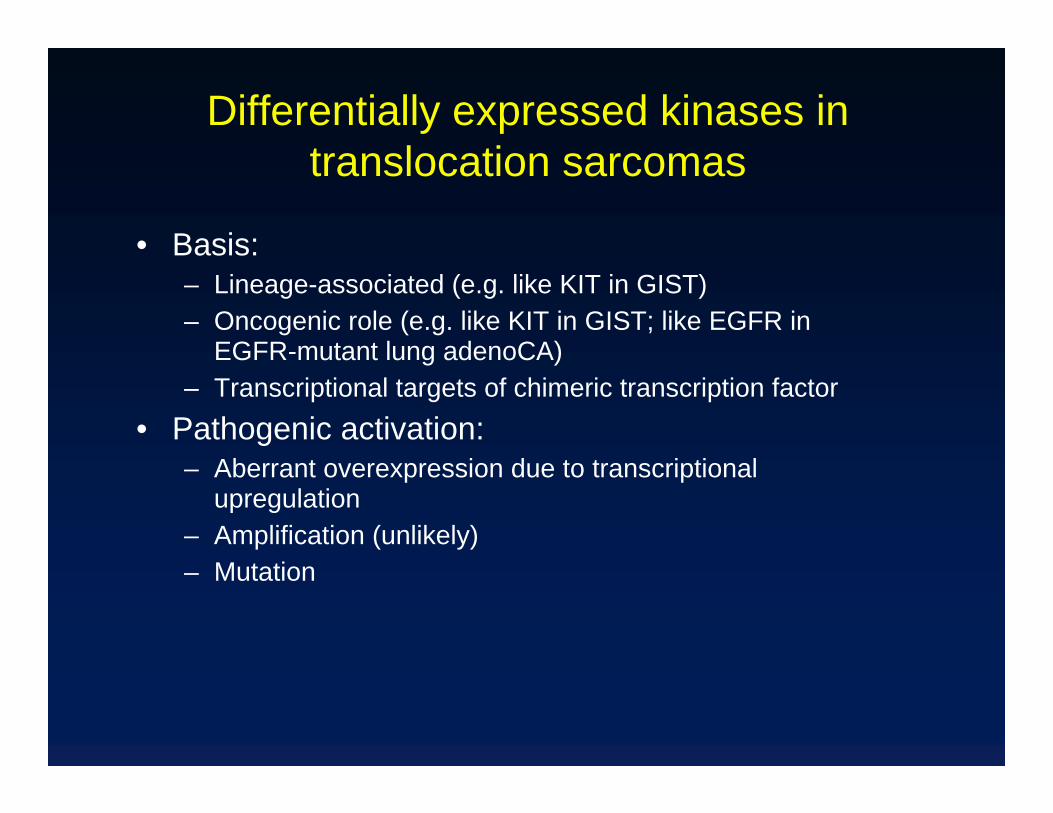
Differentially expressed kinases in translocation sarcomas
• Basis: – Lineage-associated (e.g. like KIT in GIST)– Oncogenic role (e.g. like KIT in GIST; like EGFR in
EGFR-mutant lung adenoCA)– Transcriptional targets of chimeric transcription factor
• Pathogenic activation: – Aberrant overexpression due to transcriptional
upregulation– Amplification (unlikely) – Mutation

3.0E-103.5EPHA4
1.0E-174.2VRK1
1.0E-134.9JAK1
7.6E-105.4KIT
5.5E-105.9DAPK1
2.1E-1940.3PRKCB1
T test p-value
Fold Kinase Gene
Ewing Sarcoma/PNETDifferentially overexpressed
kinases
7.5E-243.9FGFR1
3.2E-084.7NTRK2
3.0E-268.3FGFR3
6.9E-3614.5PDGFRA
T test p-value
Fold Kinase Gene
Synovial SarcomaDifferentially overexpressed
kinases
1.0E-082.6DAPK1
1.6E-094.2ERBB3
3.4E-116.0MET
4.9E-128.0FGFR4
5.0E-3055.9TTN
T test p-value
Fold Kinase Gene
Alveolar Rhabdomyosarcoma
Differentially overexpressed kinases
Sequencing of kinases showing relative overexpression in specific translocation sarcomas
• Mutation screens -> essentially negative– PRKCB1: 0/28 ES/PNET– JAK1: 0/31 ES/PNET– EPHA4: 1/68 ES/PNET– PDGFRA: 0/27 SS (1 reported)– FGFR3: 0/30 SS– Etc…
Neal Shukla, M.D.

Differentially expressed kinases in translocation sarcomas
• Basis: – Lineage-associated (e.g. like KIT in GIST)– Oncogenic role (e.g. like KIT in GIST; like EGFR in
EGFR-mut lung CA)– Transcriptional targets of chimeric transcription factor
• Pathogenic activation: – Aberrant overexpression due to transcriptional
upregulation– Amplification (unlikely) – Mutation

Kinase Fold T-test p-valuePIM1 3.1 6.42E-10MAPK3 1.6 1.28E-09MET 4.9 2.91E-09H11 6.4 9.73E-09MAPKAPK2 1.6 1.68E-08PRKAG2 8.7 2.74E-08MKNK2 2.6 3.16E-08GPRK6 8.1 4.31E-08LYN 2.3 5.69E-08PACSIN2 2.1 1.02E-07FLT1 3.9 8.99E-07MAPKAP1 1.8 2.13E-06
MET is a highly differentially overexpressed kinase in ASPS
Comparison of 16 ASPS samples vs 123 samples of 4 other sarcomas
Masumi Tsuda, Ph.D.
Alveolar Soft Part Sarcoma(ASPS)
soft tissue
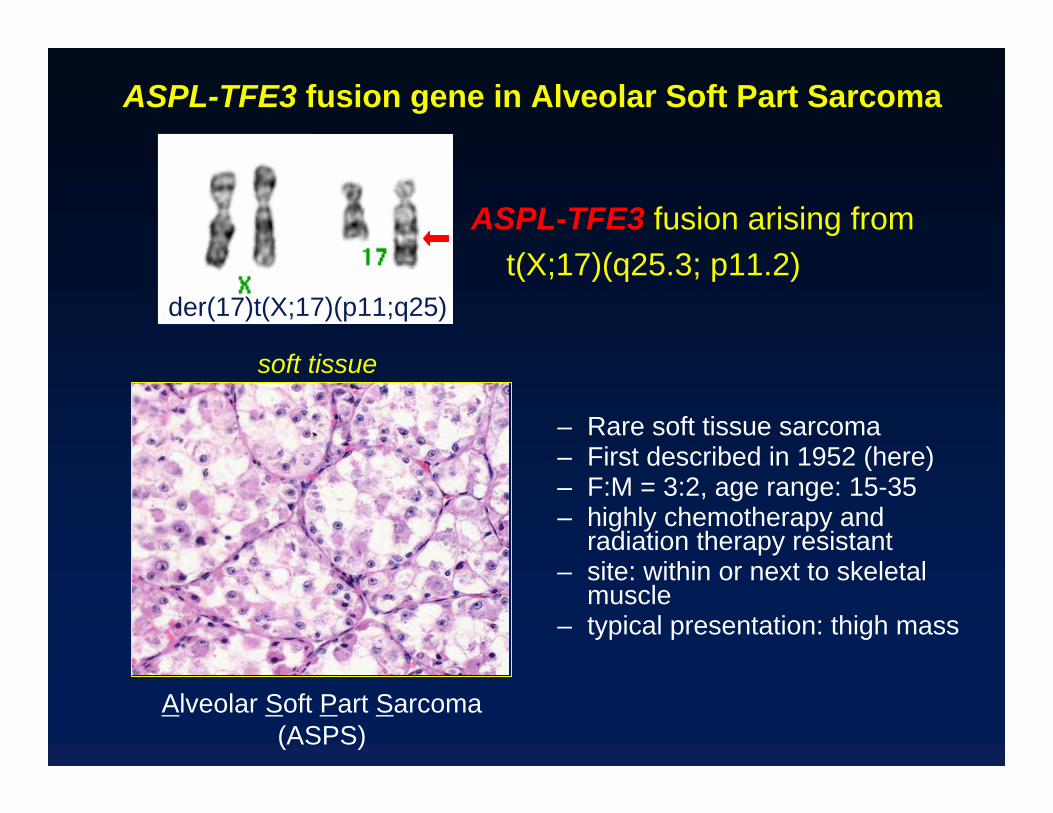
ASPL-TFE3 fusion gene in Alveolar Soft Part Sarcoma
der(17)t(X;17)(p11;q25)
ASPL-TFE3 fusion arising fromt(X;17)(q25.3; p11.2)
– Rare soft tissue sarcoma– First described in 1952 (here)– F:M = 3:2, age range: 15-35– highly chemotherapy and
radiation therapy resistant– site: within or next to skeletal
muscle– typical presentation: thigh mass
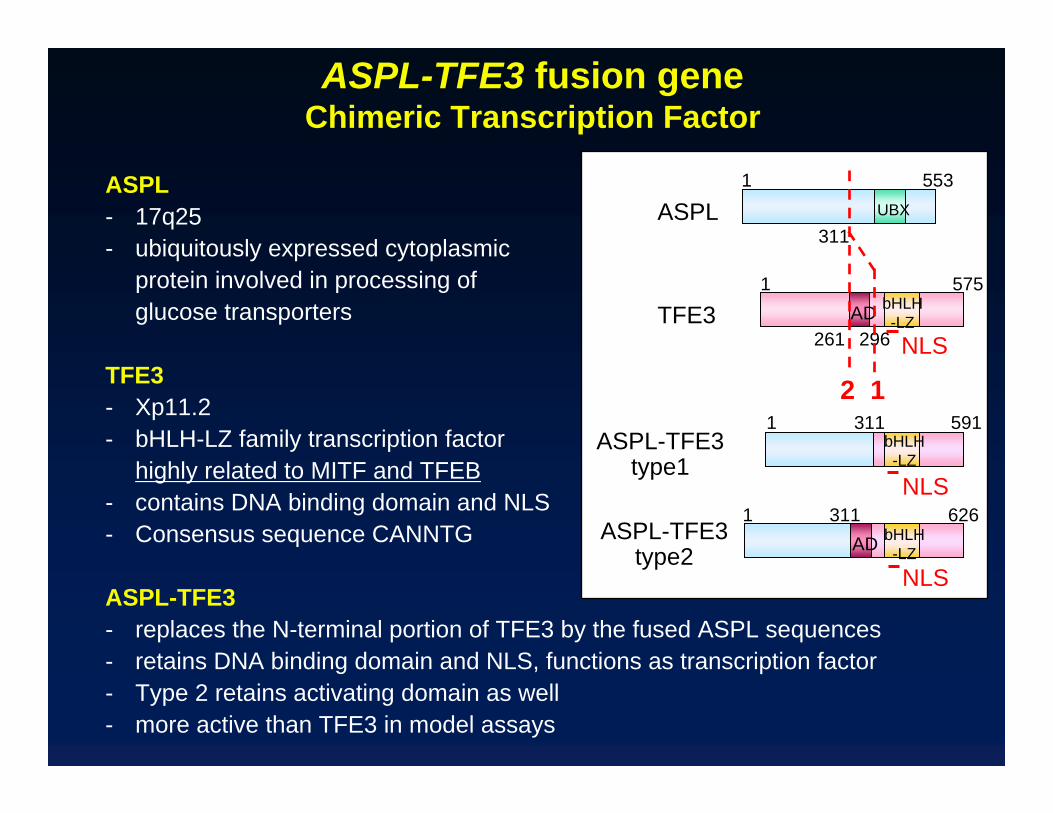
ASPL- 17q25- ubiquitously expressed cytoplasmic
protein involved in processing of glucose transporters
TFE3- Xp11.2- bHLH-LZ family transcription factor
highly related to MITF and TFEB- contains DNA binding domain and NLS- Consensus sequence CANNTG
ASPL-TFE3- replaces the N-terminal portion of TFE3 by the fused ASPL sequences- retains DNA binding domain and NLS, functions as transcription factor- Type 2 retains activating domain as well- more active than TFE3 in model assays
ASPL-TFE3 type1
1
1
311 591
311 626AD
ASPL1 553
311UBX
TFE3 AD bHLH-LZ
1 575
296261
bHLH-LZ
bHLH-LZ
ASPL-TFE3 type2
12NLS
NLS
NLS
ASPL-TFE3 fusion geneChimeric Transcription Factor
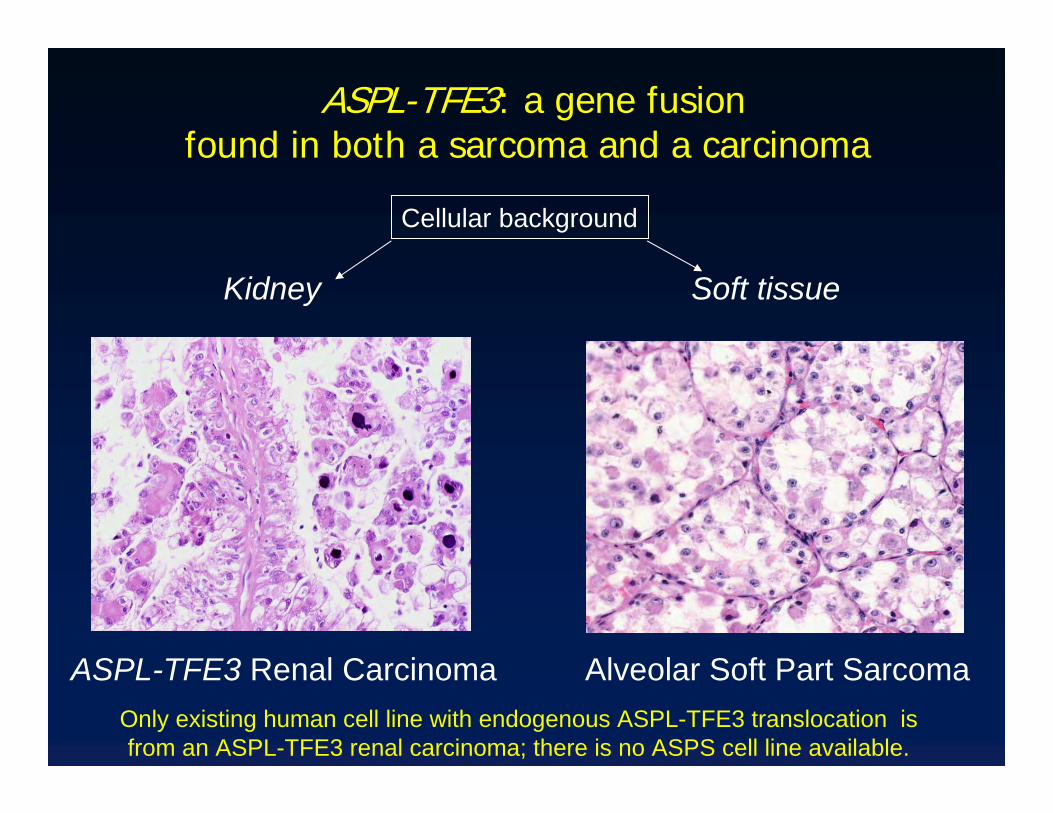
ASPL-TFE3: a gene fusion found in both a sarcoma and a carcinoma
Cellular background
Kidney Soft tissue
ASPL-TFE3 Renal Carcinoma Alveolar Soft Part SarcomaOnly existing human cell line with endogenous ASPL-TFE3 translocation is from an ASPL-TFE3 renal carcinoma; there is no ASPS cell line available.
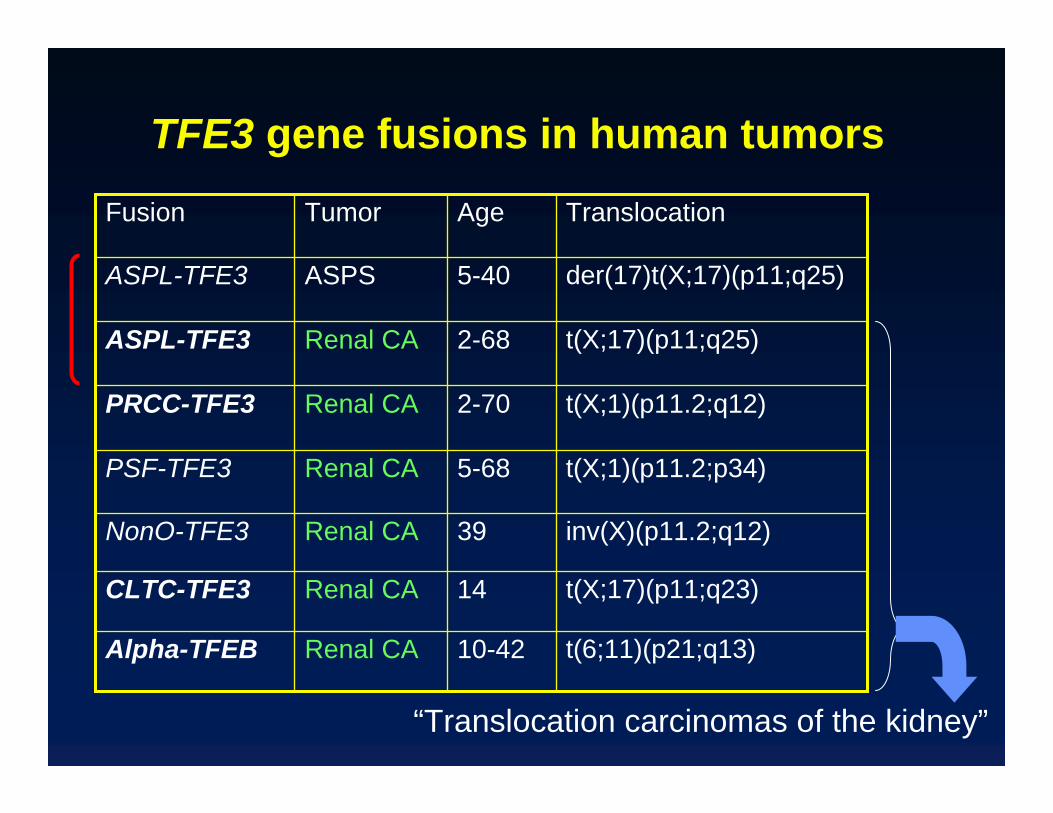
TFE3 gene fusions in human tumors
t(X;17)(p11;q23)14Renal CACLTC-TFE3
inv(X)(p11.2;q12)39Renal CANonO-TFE3
t(6;11)(p21;q13)10-42Renal CAAlpha-TFEB
t(X;1)(p11.2;p34)5-68Renal CAPSF-TFE3
t(X;1)(p11.2;q12)2-70Renal CAPRCC-TFE3
t(X;17)(p11;q25)2-68Renal CAASPL-TFE3
der(17)t(X;17)(p11;q25)5-40ASPSASPL-TFE3
TranslocationAgeTumorFusion
“Translocation carcinomas of the kidney”
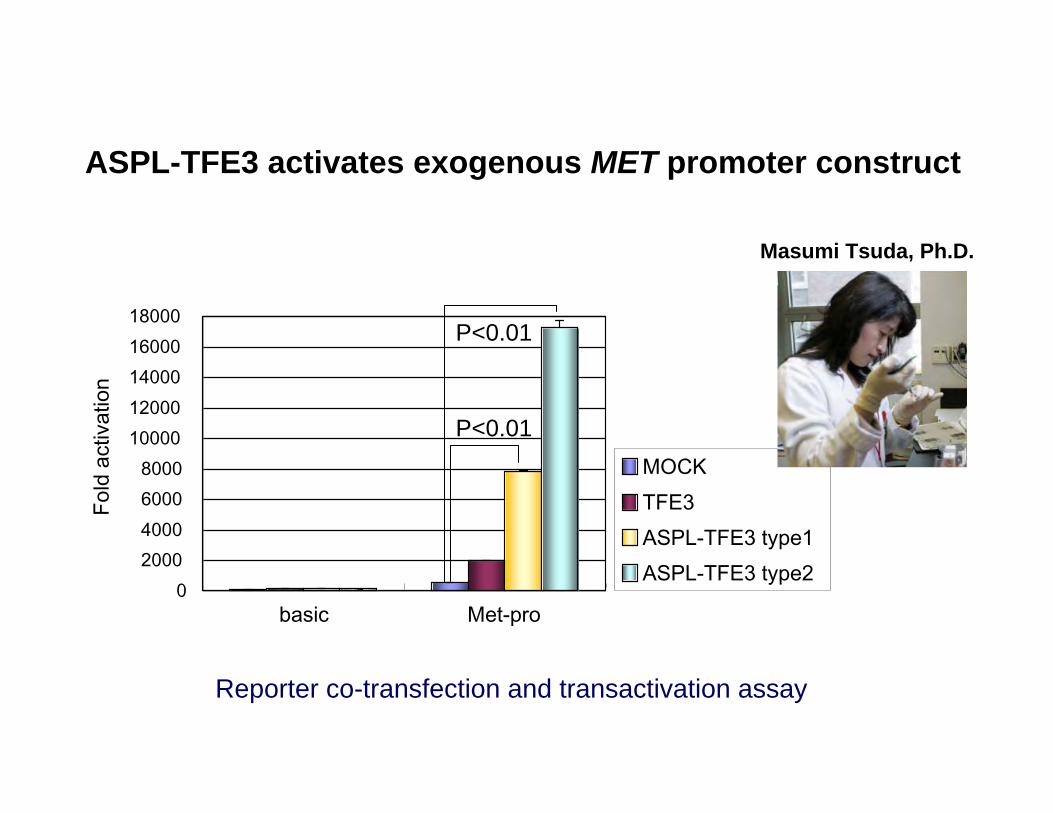
02000400060008000
1000012000140001600018000
basic Met-pro
Fold
act
ivat
ion
MOCKTFE3ASPL-TFE3 type1ASPL-TFE3 type2
P<0.01
P<0.01
ASPL-TFE3 activates exogenous MET promoter construct
Masumi Tsuda, Ph.D.
Reporter co-transfection and transactivation assay

nega
. con
.
posi
. con
.
inpu
t
IgG
anti-
myc
inpu
t
IgG
anti-
myc
inpu
t
IgG
anti-
myc
MOCKASPL-TFE3
type1ASPL-TFE3
type2
100 bp
100 bp
Tet 0 h
Tet 46 h
ASPL-TFE3 is present at the MET promoter
・Chromatin Immunoprecipitation assay (293 cells with inducible ASPL-TFE3)
-2000 bp -200bp-1340bp
-1310 ↓
Transcription Start Site
CANNTG(consensus binding
sequences for native TFE3 and ASPL-TFE3)
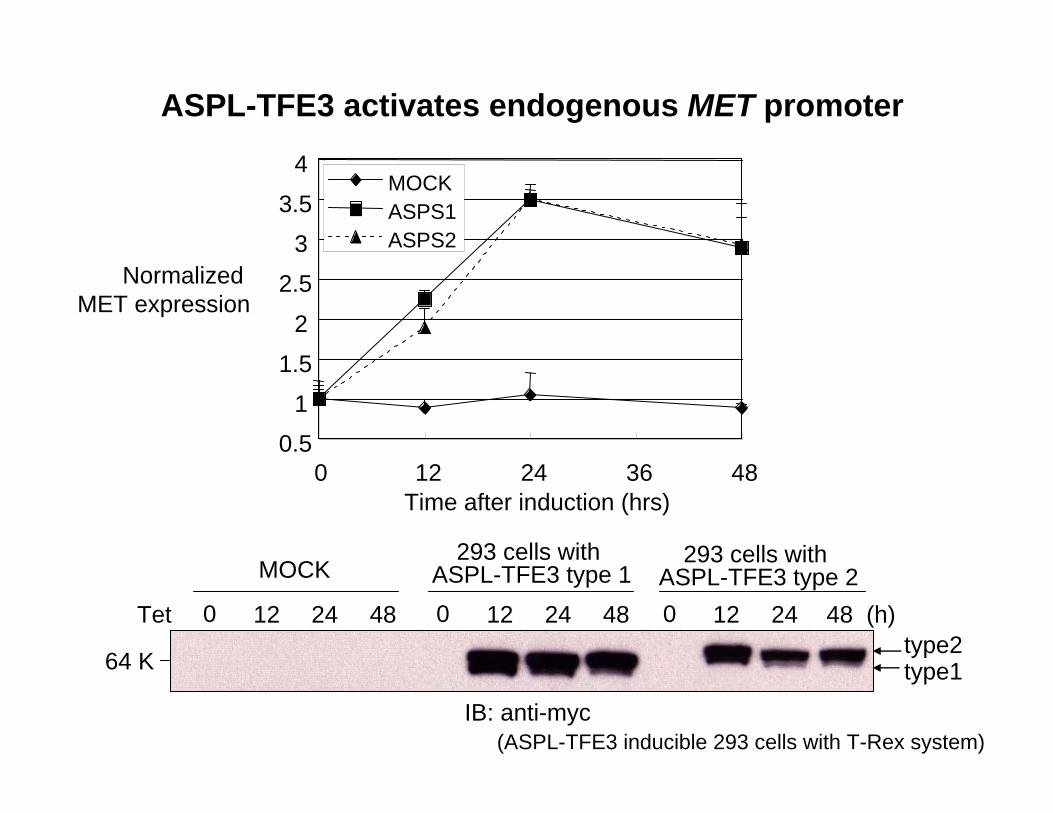
Time after induction (hrs)
0.51
1.5
2
2.5
33.5
4
0 12 24 36 48
MOCKASPS1ASPS2
Normalized MET expression
IB: anti-myc
64 Ktype2type1
0 48Tet 2412 0 482412 0 48 (h)2412
MOCK293 cells with
ASPL-TFE3 type 1
ASPL-TFE3 activates endogenous MET promoter
(ASPL-TFE3 inducible 293 cells with T-Rex system)
293 cells with ASPL-TFE3 type 2
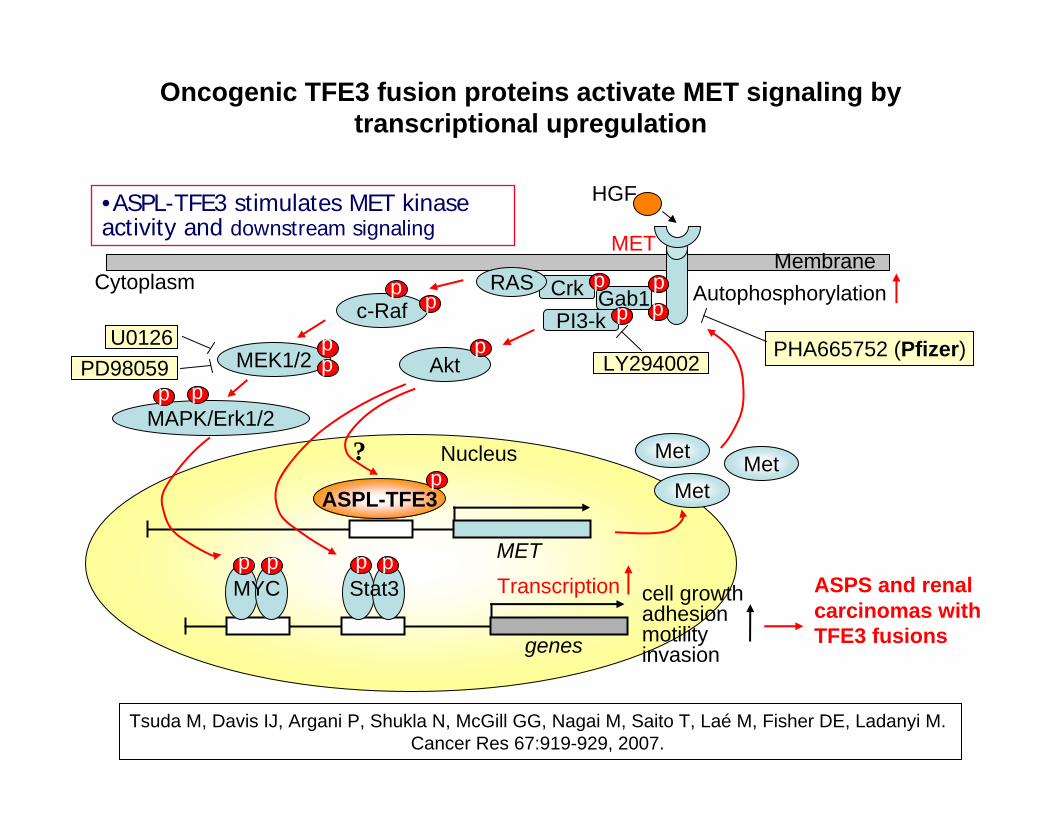
Membrane
ASPL-TFE3 Met
Transcription cell growthadhesionmotilityinvasion
ASPS and renal carcinomas with TFE3 fusions
AutophosphorylationCytoplasm
Nucleus
p
MET
HGF
Gab1CrkRASc-Raf
MEK1/2
MAPK/Erk1/2
p
pp
p
p p
MYCp p
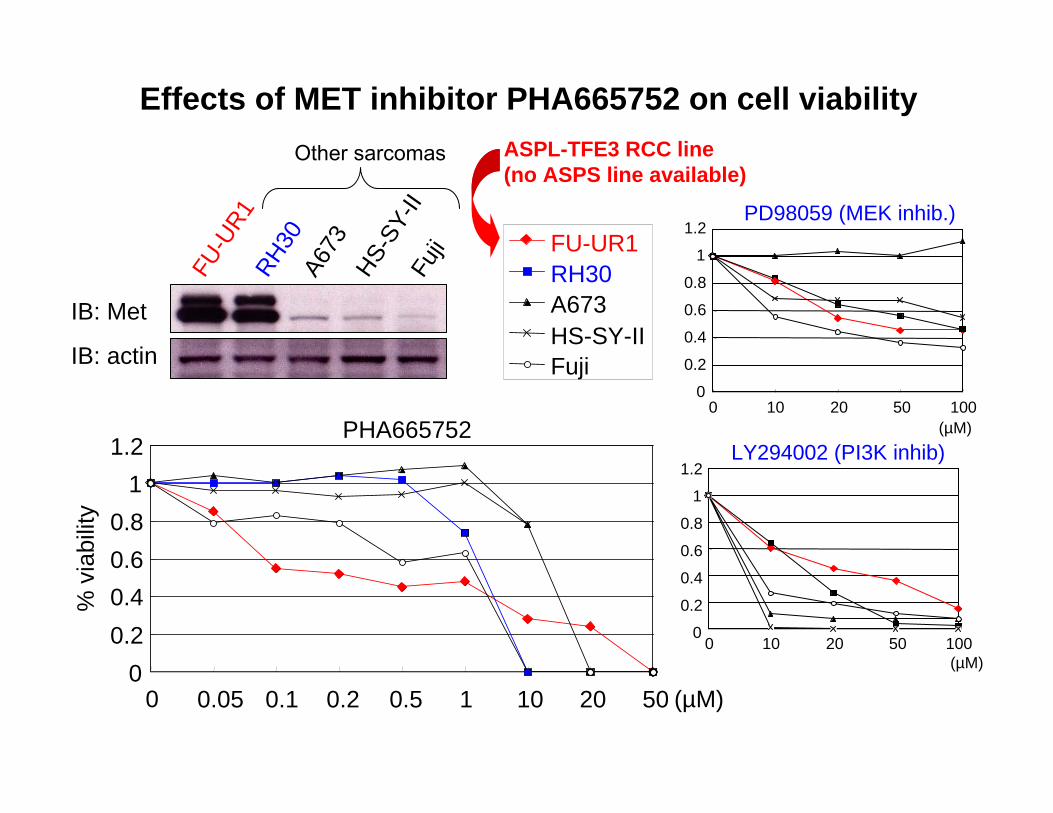
PD98059U0126
p
MET
MetMet
genes
p
p pStat3
PI3-k p
Aktp
LY294002PHA665752 (Pfizer)
Oncogenic TFE3 fusion proteins activate MET signaling by transcriptional upregulation
p?
Tsuda M, Davis IJ, Argani P, Shukla N, McGill GG, Nagai M, Saito T, Laé M, Fisher DE, Ladanyi M. Cancer Res 67:919-929, 2007.
•ASPL-TFE3 stimulates MET kinase activity and downstream signaling
FU-U
R1RH3
0A6
73HS-
SY-II
Fuji
IB: Met
IB: actin
00.20.40.60.8
11.2
0 0.05 0.1 0.2 0.5 1 10 20 50
% v
iabi
lity
(µM)
PHA665752
PHA665752
FU-UR1RH30A673HS-SY-IIFuji
Effects of MET inhibitor PHA665752 on cell viability
0
0.2
0.4
0.6
0.8
1
1.2
0 10 20 50 100
PD98059 (MEK inhib.)
(µM)LY294002 (PI3K inhib)
00
0.2
0.4
0.6
0.8
1
1.2
10 20 50 100(µM)
Other sarcomas ASPL-TFE3 RCC line (no ASPS line available)
#1 #2 #2-2
#9 #12
#15
#18
#18-
2
ASPS
#14
#17
#20
#31
#31-
2
ASPL-TFE3
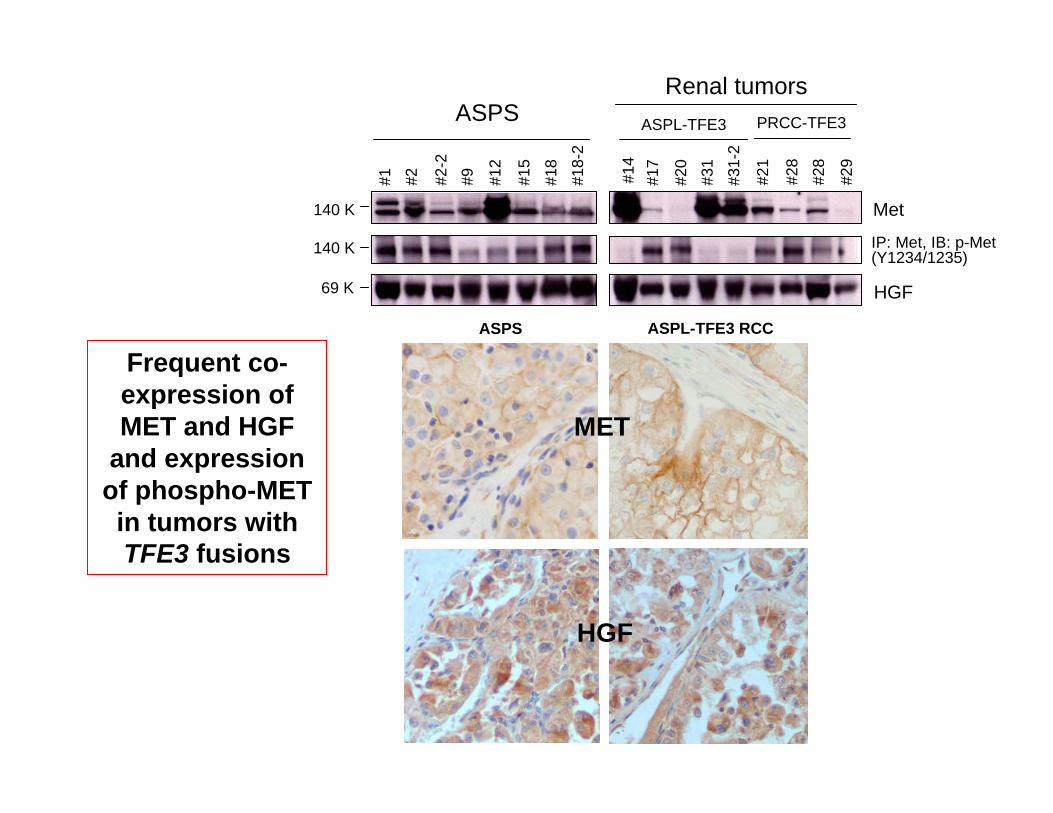
Met
#21
#28
#28
#29
PRCC-TFE3
IP: Met, IB: p-Met(Y1234/1235)
140 K
140 K
HGF69 K
Renal tumors
ASPS ASPL-TFE3 RCC
MET
Frequent co-expression of MET and HGF
and expression of phospho-MET in tumors with TFE3 fusions
HGF

Oncogenic activation of MET signaling• Kinase domain missense mutations (activating)
– Familial and sporadic (15%) papillary renal cell carcinomas– rare in other cancers
• MET fusion protein (constitutively activated)– TPR-MET (only in carcinogen-treated cell line MNNG-HOS)
• Autocrine signaling – MET and HGF co-expression
• MET amplification – Gastric cancer (10-20%)– EGFR-mut lung adenocarcinomas resistant to EGFR TKIs
• Aberrant transcriptional upregulation of MET– by amplified MITF in some melanomas (MET is a direct target of MITF)– by TFE3 fusion proteins in ASPS and renal carcinomas with TFE3
fusions

• Translocation sarcomas are usually highly dependent on their specific CTF• Deregulation of gene expression by these CTFs is a major part of the
biology of these sarcomas • Transcription factors = poor therapeutic targets
– Need to identify critical downstream transcriptional targets for which drugs exist or are in development
• Slow progress in identifying genuine biologically critical CTF target genes• Approach: obtain a more comprehensive view of genuine in vivo direct
targets of CTFs through the integration of ChIP-on-chip data with:– expression profiling data from tumors– expression profiling data from homologous or heterologous cell lines in which
CTF levels are modulated
Target Genes of Chimeric Transcription Factors (CTFs) in Sarcomas

Genomic Approaches to Translocation Sarcomas
Agenda
• Expression profiling: mining for diagnostic and therapeutic targetsChIP-on-chip: integration with expression profiling data to identify target genes of chimeric transcription factors in translocation sarcomas
• Cancer genomics: new approaches to high throughput unbiased discovery of translocations
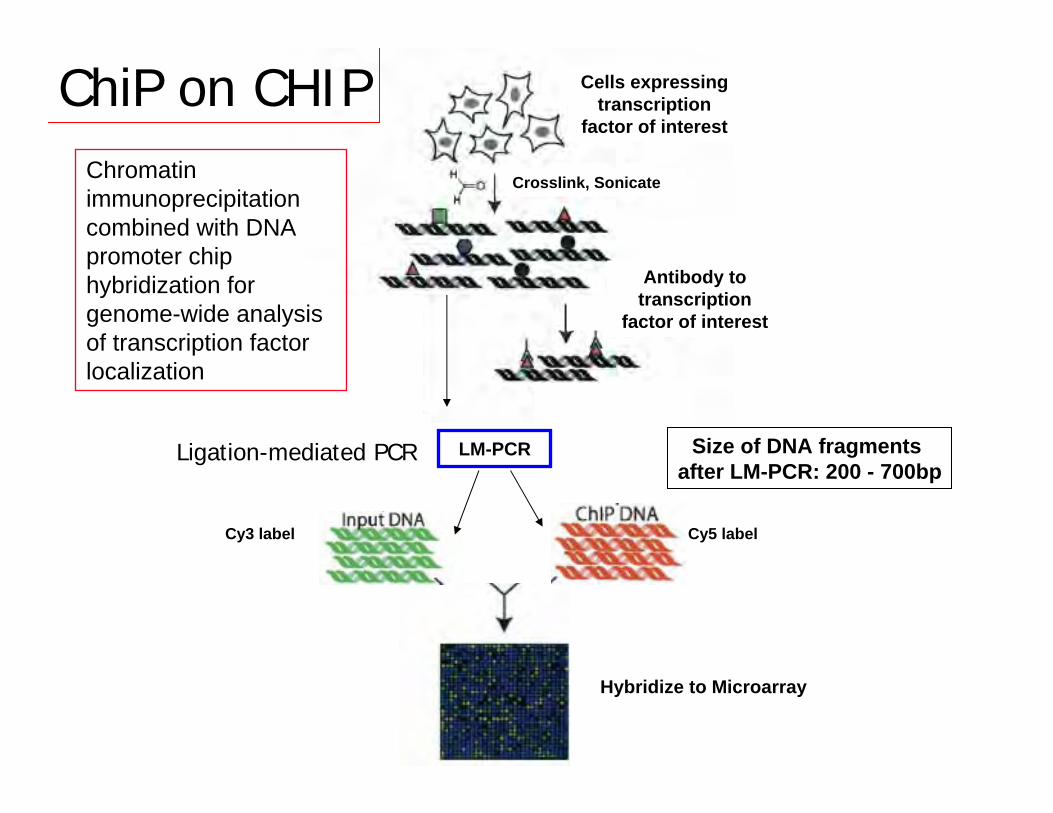
LM-PCR
Cells expressing transcription
factor of interest
Antibody to transcription
factor of interest
Cy3 label Cy5 label
Crosslink, Sonicate
Hybridize to Microarray
ChiP on CHIP
Ligation-mediated PCR
Chromatin immunoprecipitation combined with DNA promoter chip hybridization for genome-wide analysis of transcription factor localization
Size of DNA fragments after LM-PCR: 200 - 700bp
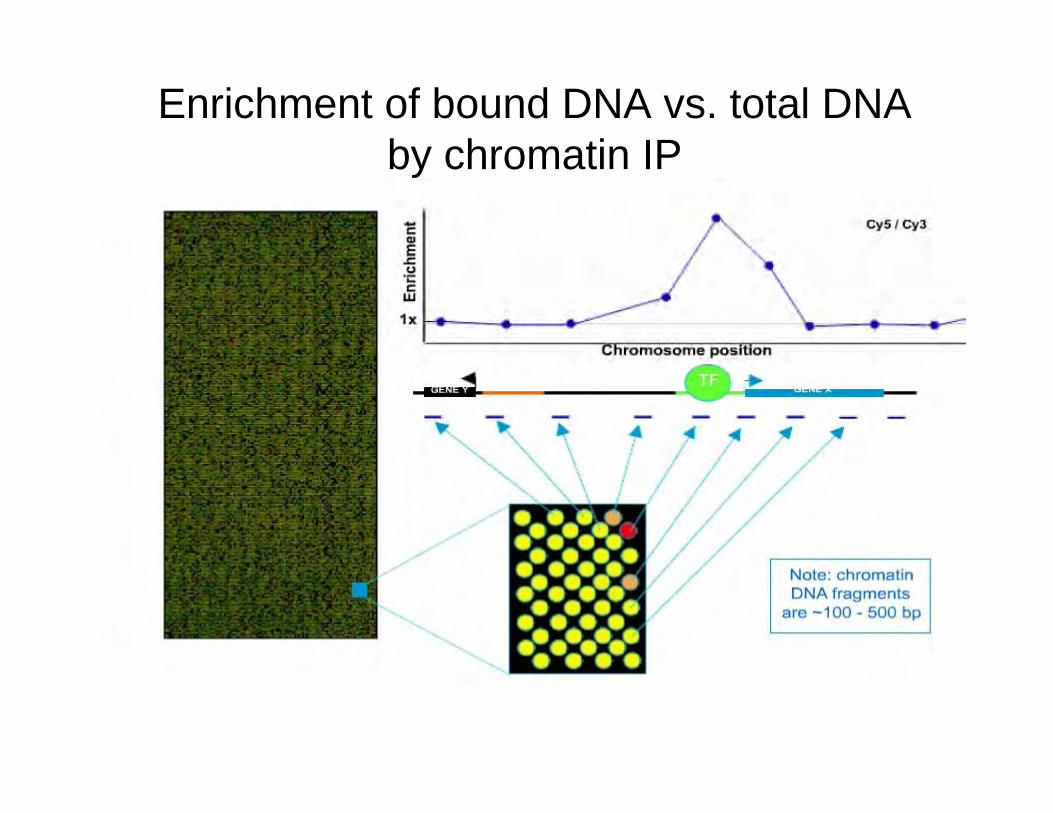
Enrichment of bound DNA vs. total DNA by chromatin IP

Agilent Human Promoter Microarray
• 2 x 244K arrays– Promoters of ~19,143 genes– 25 probes/promoter– Probes ~ 60nt oligomers
• Spaced every ~ 200 bp– Location of Probes within Promoter Region
• 5500 bp upstream from transcriptional start site• 2500 bp downstream from transcriptional start site
– Genome version: UCSC May 2004 Build 34
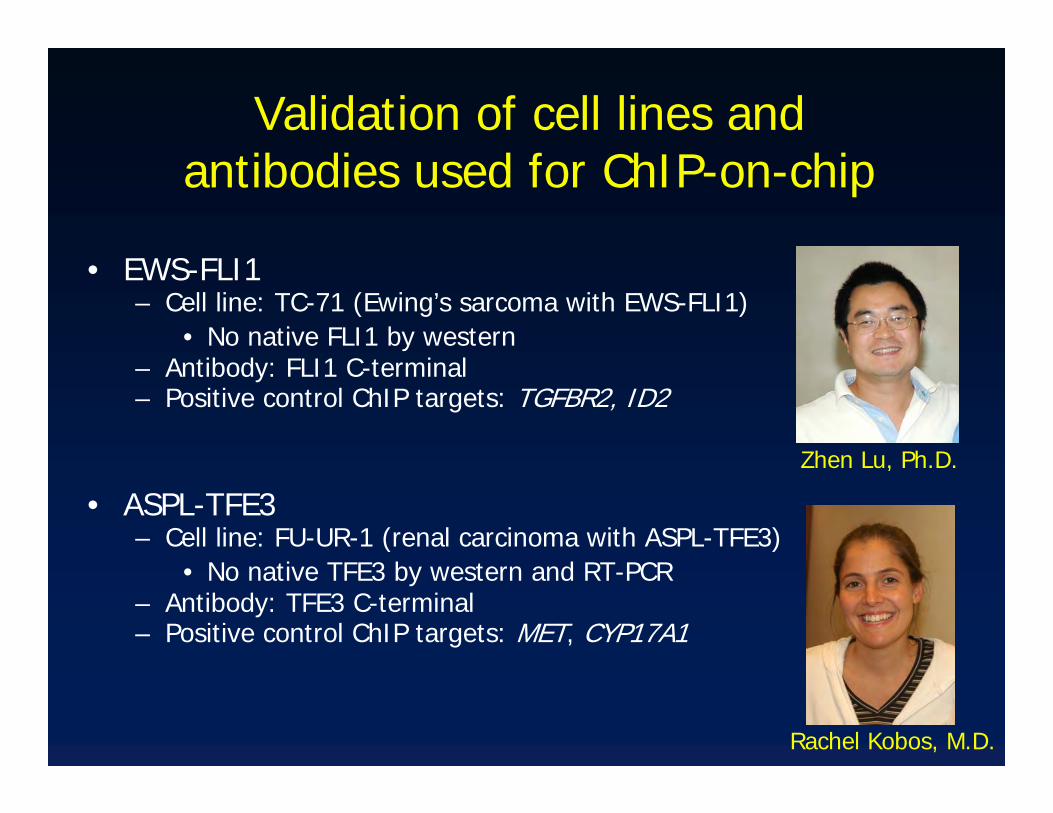
Validation of cell lines and antibodies used for ChIP-on-chip
• EWS-FLI1– Cell line: TC-71 (Ewing’s sarcoma with EWS-FLI1)
• No native FLI1 by western– Antibody: FLI1 C-terminal– Positive control ChIP targets: TGFBR2, ID2
• ASPL-TFE3– Cell line: FU-UR-1 (renal carcinoma with ASPL-TFE3)
• No native TFE3 by western and RT-PCR– Antibody: TFE3 C-terminal– Positive control ChIP targets: MET, CYP17A1
Zhen Lu, Ph.D.
Rachel Kobos, M.D.
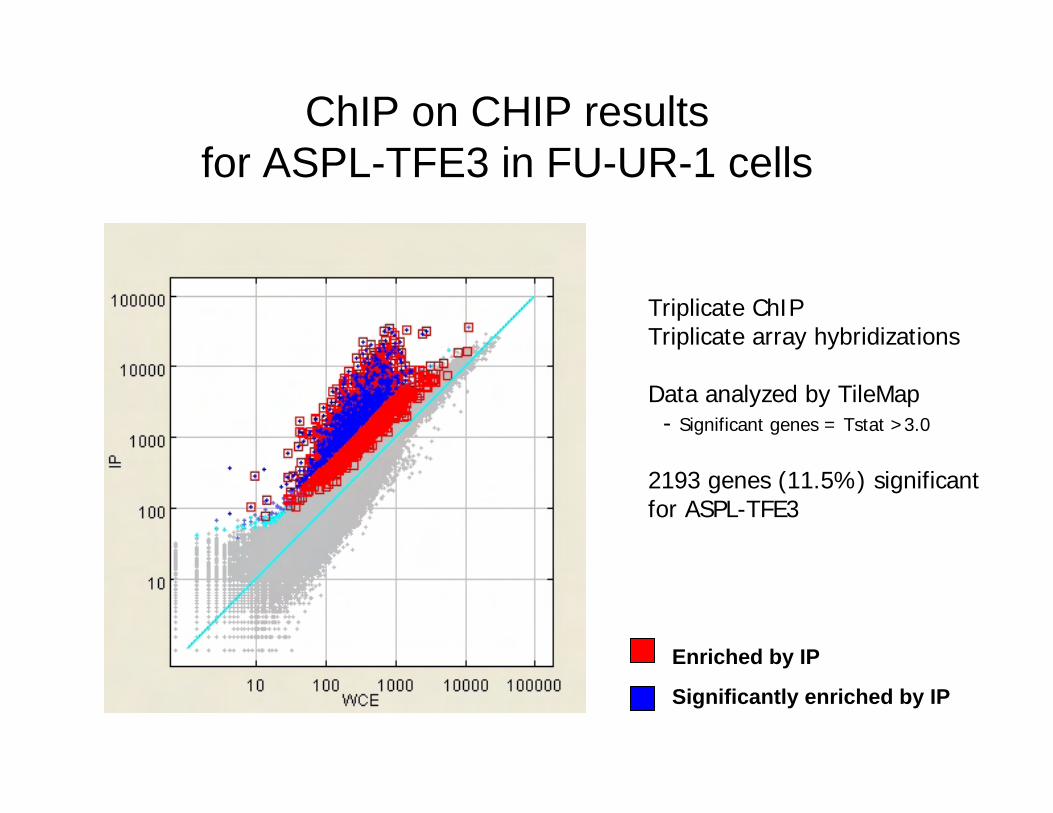
ChIP on CHIP resultsfor ASPL-TFE3 in FU-UR-1 cells
Enriched by IP
Significantly enriched by IP
Triplicate ChIPTriplicate array hybridizations
Data analyzed by TileMap- Significant genes = Tstat >3.0
2193 genes (11.5%) significant for ASPL-TFE3
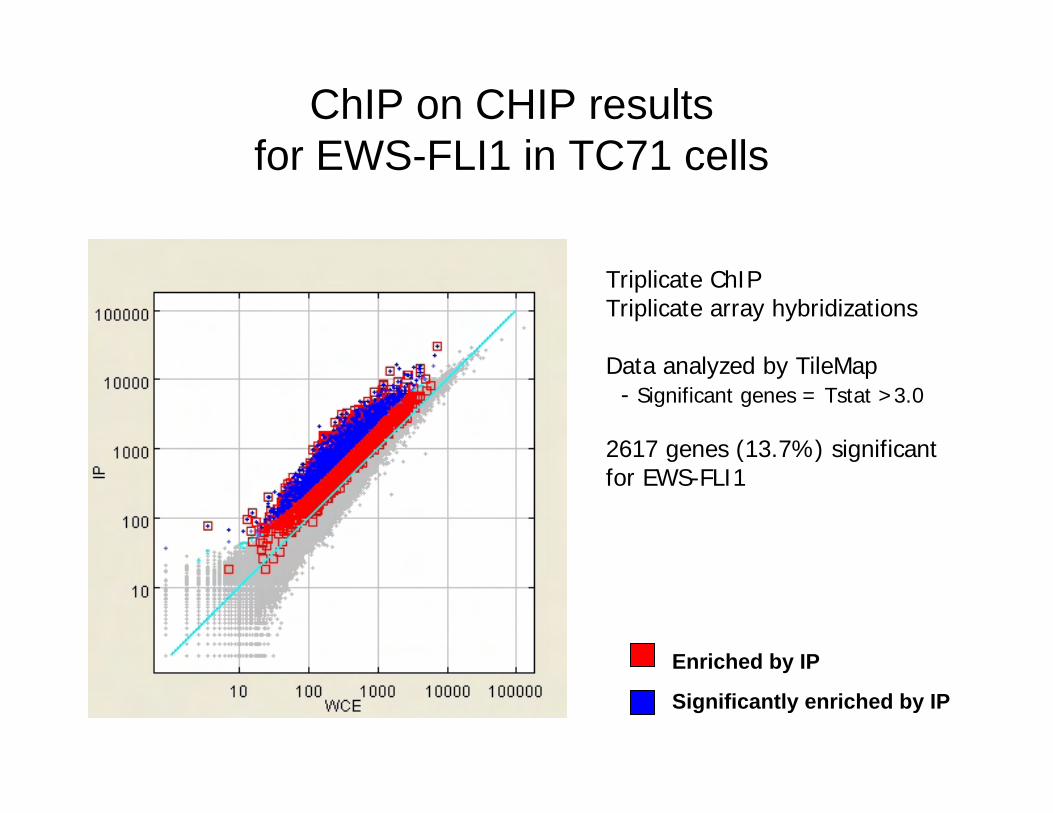
ChIP on CHIP resultsfor EWS-FLI1 in TC71 cells
Enriched by IP
Significantly enriched by IP
Triplicate ChIPTriplicate array hybridizations
Data analyzed by TileMap- Significant genes = Tstat >3.0
2617 genes (13.7%) significant for EWS-FLI1
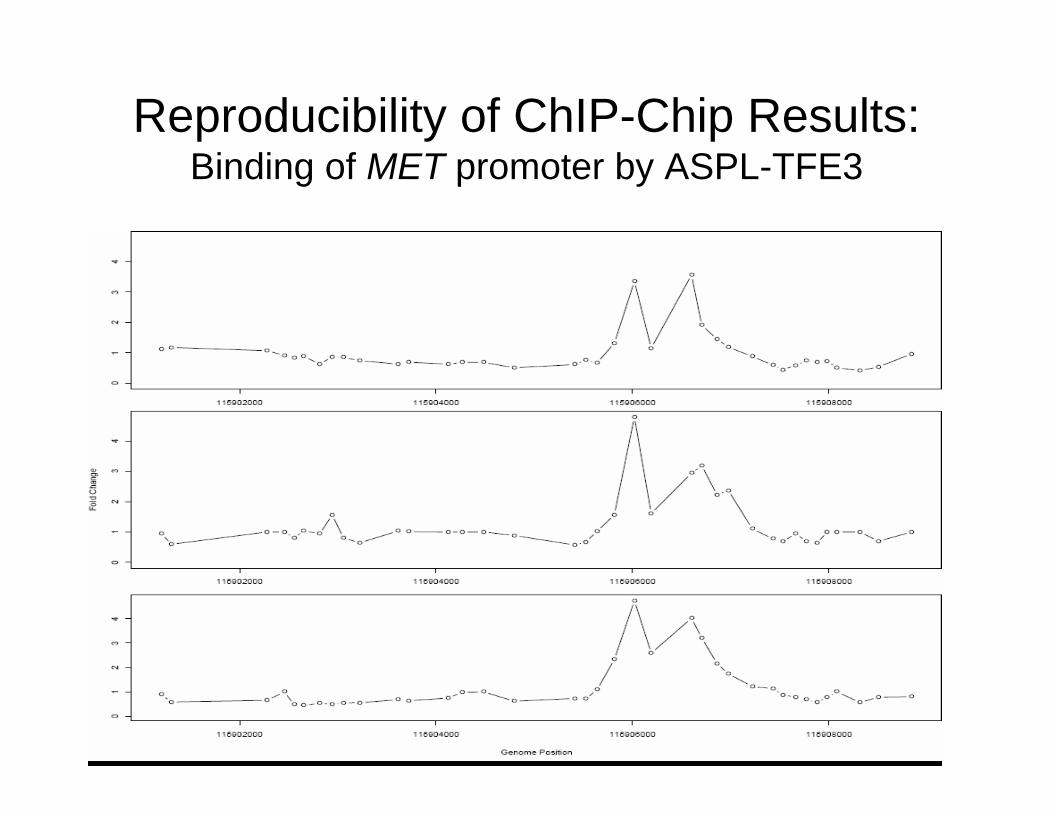
Reproducibility of ChIP-Chip Results:Binding of MET promoter by ASPL-TFE3
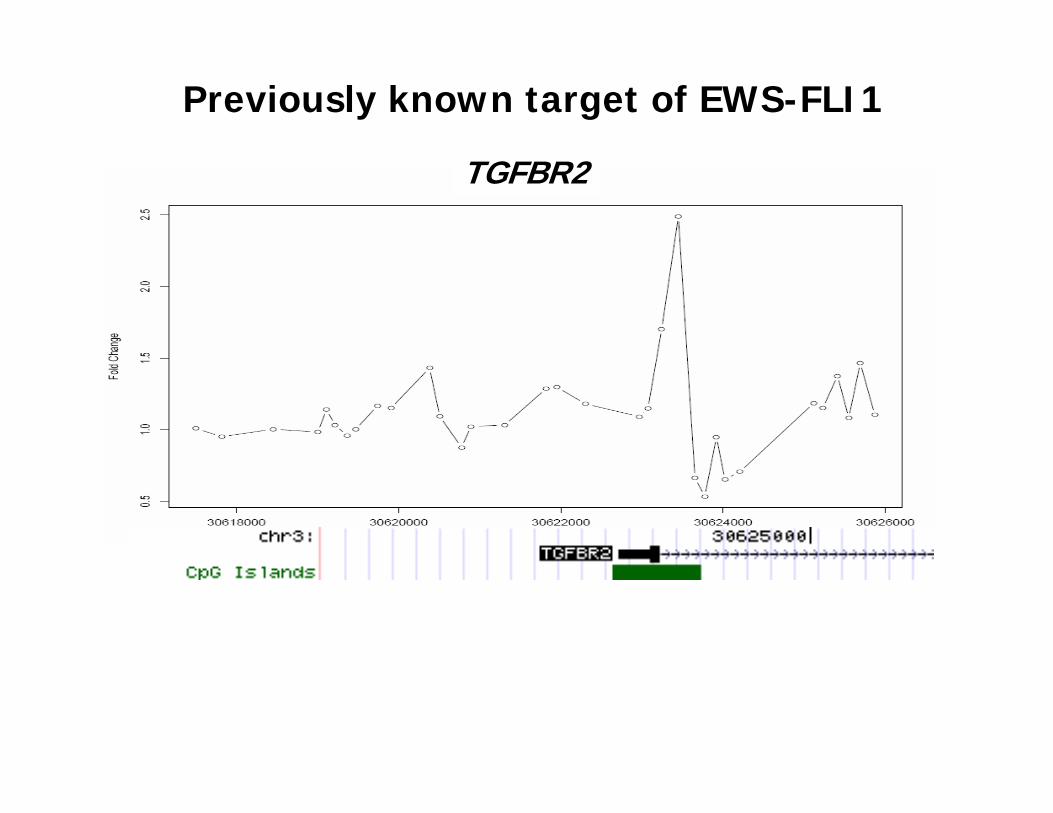
TGFBR2
Previously known target of EWS-FLI1
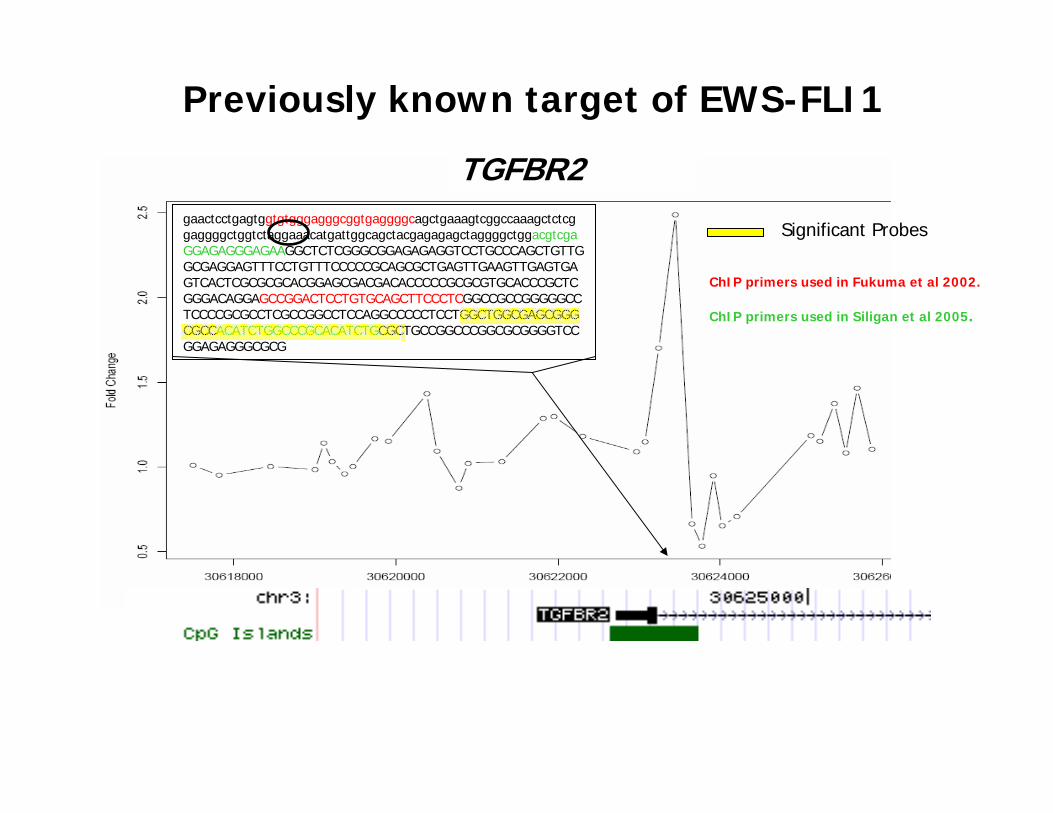
gaactcctgagtggtgtgggagggcggtgaggggcagctgaaagtcggccaaagctctcggaggggctggtctaggaaacatgattggcagctacgagagagctaggggctggacgtcgaGGAGAGGGAGAAGGCTCTCGGGCGGAGAGAGGTCCTGCCCAGCTGTTGGCGAGGAGTTTCCTGTTTCCCCCGCAGCGCTGAGTTGAAGTTGAGTGAGTCACTCGCGCGCACGGAGCGACGACACCCCCGCGCGTGCACCCGCTCGGGACAGGAGCCGGACTCCTGTGCAGCTTCCCTCGGCCGCCGGGGGCCTCCCCGCGCCTCGCCGGCCTCCAGGCCCCCTCCTGGCTGGCGAGCGGGCGCCACATCTGGCCCGCACATCTGCGCTGCCGGCCCGGCGCGGGGTCCGGAGAGGGCGCG
Significant Probes
ChIP primers used in Fukuma et al 2002.
ChIP primers used in Siligan et al 2005.
TGFBR2
Previously known target of EWS-FLI1
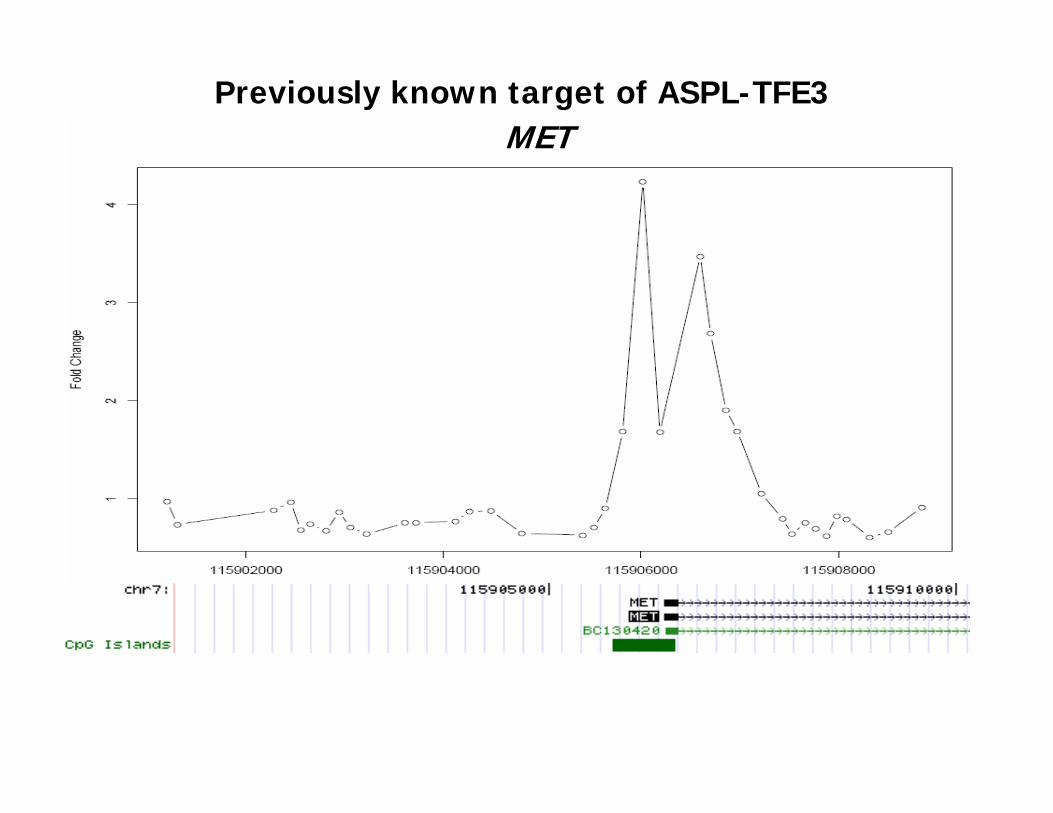
Previously known target of ASPL-TFE3MET
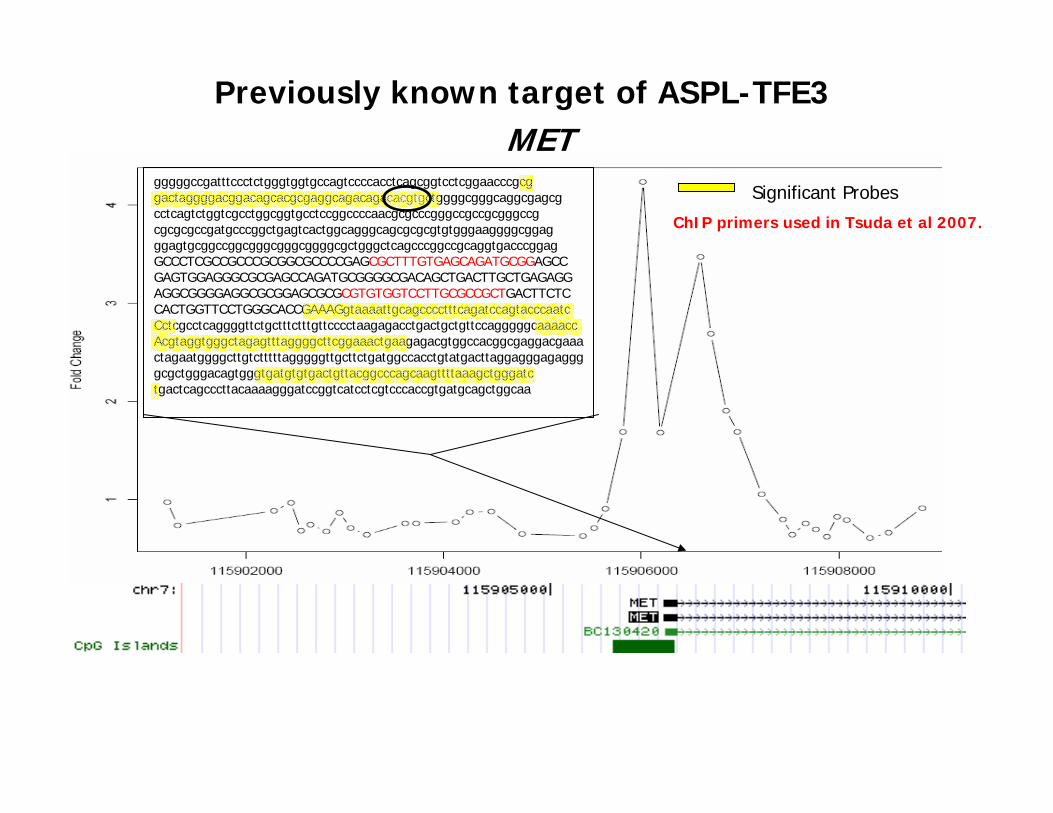
gggggccgatttccctctgggtggtgccagtccccacctcagcggtcctcggaacccgcggactaggggacggacagcacgcgaggcagacagacacgtgctggggcgggcaggcgagcgcctcagtctggtcgcctggcggtgcctccggccccaacgcgcccgggccgccgcgggccgcgcgcgccgatgcccggctgagtcactggcagggcagcgcgcgtgtgggaaggggcggagggagtgcggccggcgggcgggcggggcgctgggctcagcccggccgcaggtgacccggagGCCCTCGCCGCCCGCGGCGCCCCGAGCGCTTTGTGAGCAGATGCGGAGCCGAGTGGAGGGCGCGAGCCAGATGCGGGGCGACAGCTGACTTGCTGAGAGGAGGCGGGGAGGCGCGGAGCGCGCGTGTGGTCCTTGCGCCGCTGACTTCTCCACTGGTTCCTGGGCACCGAAAGgtaaaattgcagcccctttcagatccagtacccaatcCctcgcctcaggggttctgctttctttgttcccctaagagacctgactgctgttccagggggcaaaaccAcgtaggtgggctagagtttaggggcttcggaaactgaagagacgtggccacggcgaggacgaaactagaatggggcttgtctttttagggggttgcttctgatggccacctgtatgacttaggagggagaggggcgctgggacagtgggtgatgtgtgactgttacggcccagcaagttttaaagctgggatctgactcagcccttacaaaagggatccggtcatcctcgtcccaccgtgatgcagctggcaa
ChIP primers used in Tsuda et al 2007.
Significant Probes
METPreviously known target of ASPL-TFE3
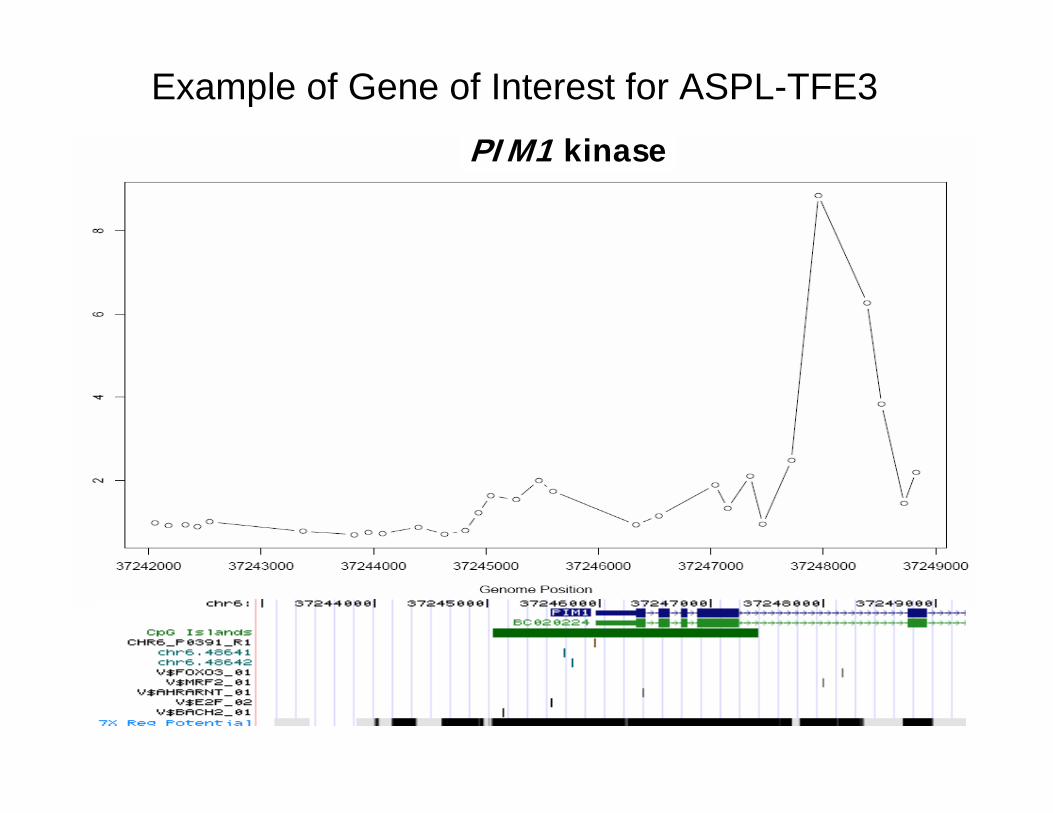
Example of Gene of Interest for ASPL-TFE3
PIM1 kinase
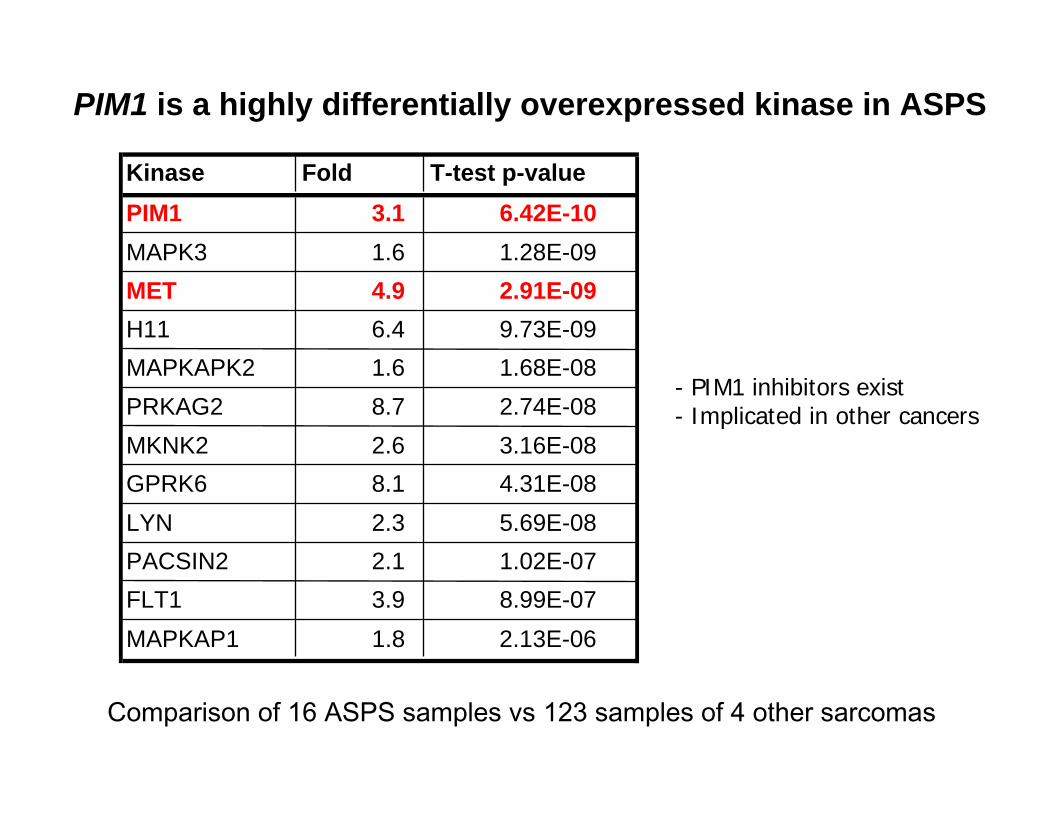
Kinase Fold T-test p-valuePIM1 3.1 6.42E-10MAPK3 1.6 1.28E-09MET 4.9 2.91E-09H11 6.4 9.73E-09MAPKAPK2 1.6 1.68E-08PRKAG2 8.7 2.74E-08MKNK2 2.6 3.16E-08GPRK6 8.1 4.31E-08LYN 2.3 5.69E-08PACSIN2 2.1 1.02E-07FLT1 3.9 8.99E-07MAPKAP1 1.8 2.13E-06
PIM1 is a highly differentially overexpressed kinase in ASPS
Comparison of 16 ASPS samples vs 123 samples of 4 other sarcomas
- PIM1 inhibitors exist- Implicated in other cancers
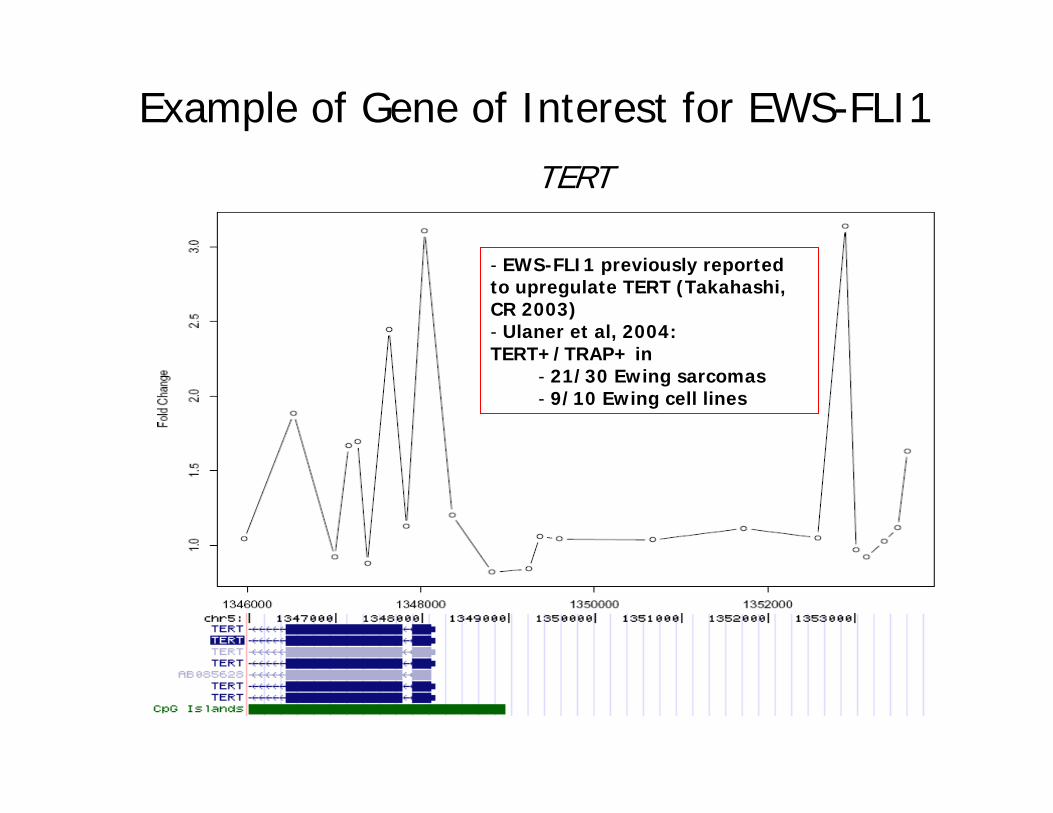
Example of Gene of Interest for EWS-FLI1TERT
- EWS-FLI1 previously reported to upregulate TERT (Takahashi, CR 2003)- Ulaner et al, 2004: TERT+/TRAP+ in
- 21/30 Ewing sarcomas- 9/10 Ewing cell lines
Relationship of ChIP-on-chip bound genes to differentially expressed genes in tumor expression profiles
• Unsupervised clustering of 137 sarcoma samples based on genes bound in the ChIP-chip analysis
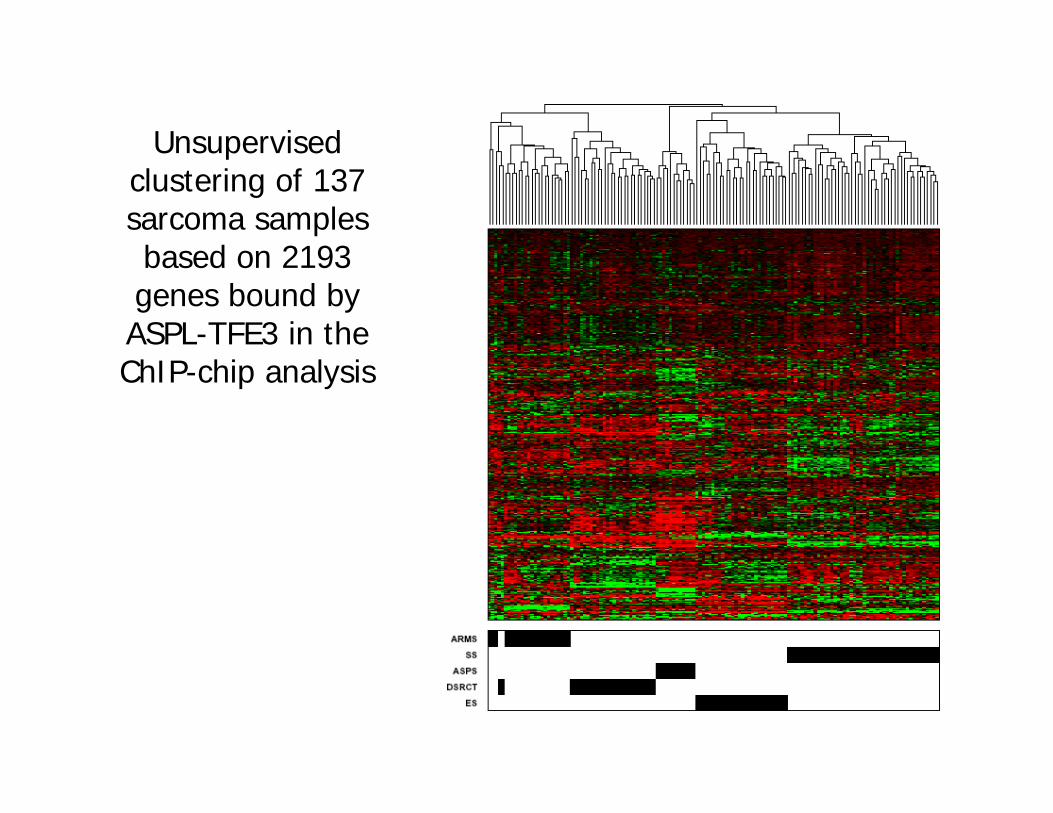
Unsupervised clustering of 137 sarcoma samples based on 2193 genes bound by ASPL-TFE3 in theChIP-chip analysis
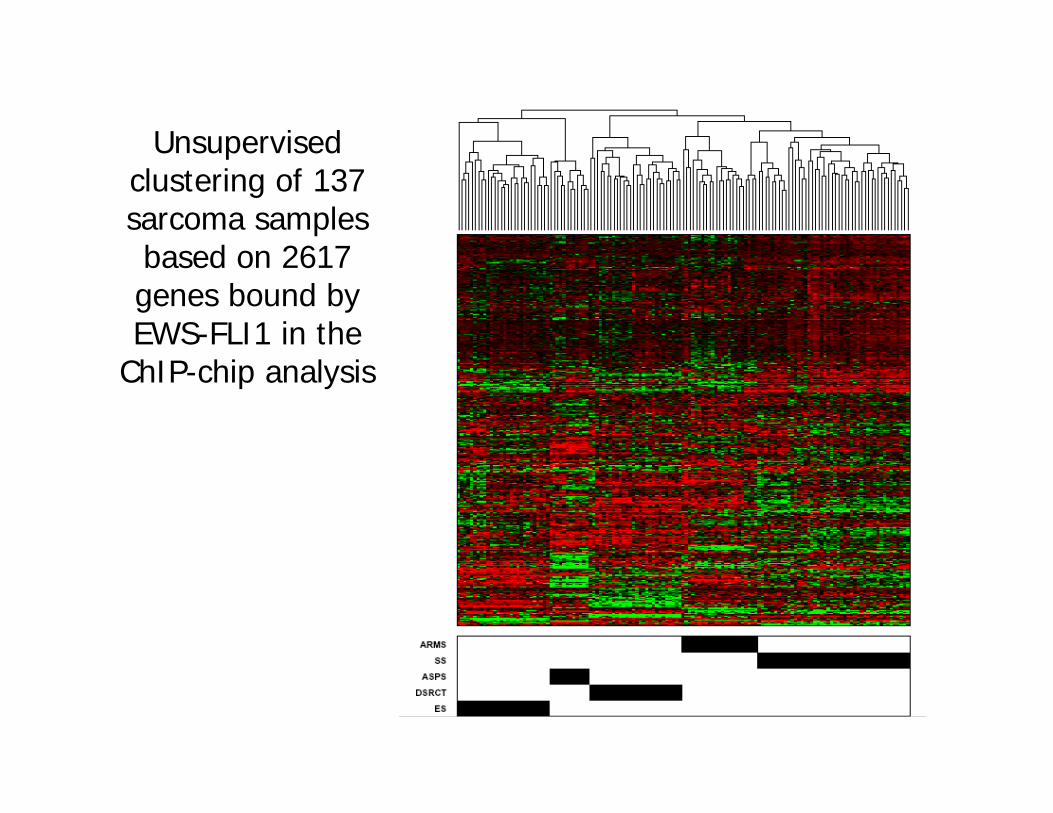
Unsupervised clustering of 137 sarcoma samples based on 2617 genes bound by EWS-FLI1 in the
ChIP-chip analysis
Relationship of ChIP-on-chip bound genes to differentially expressed genes in tumor expression profiles
• Unsupervised clustering of 137 sarcoma samples based on genes bound in the ChIP-chip analysis
• Comparison of ChIP-chip bound genes to genes significantly differentially expressed in tumor expression profiles
– Subset comparisons (stringently defined subsets of over- or under-expressed genes)
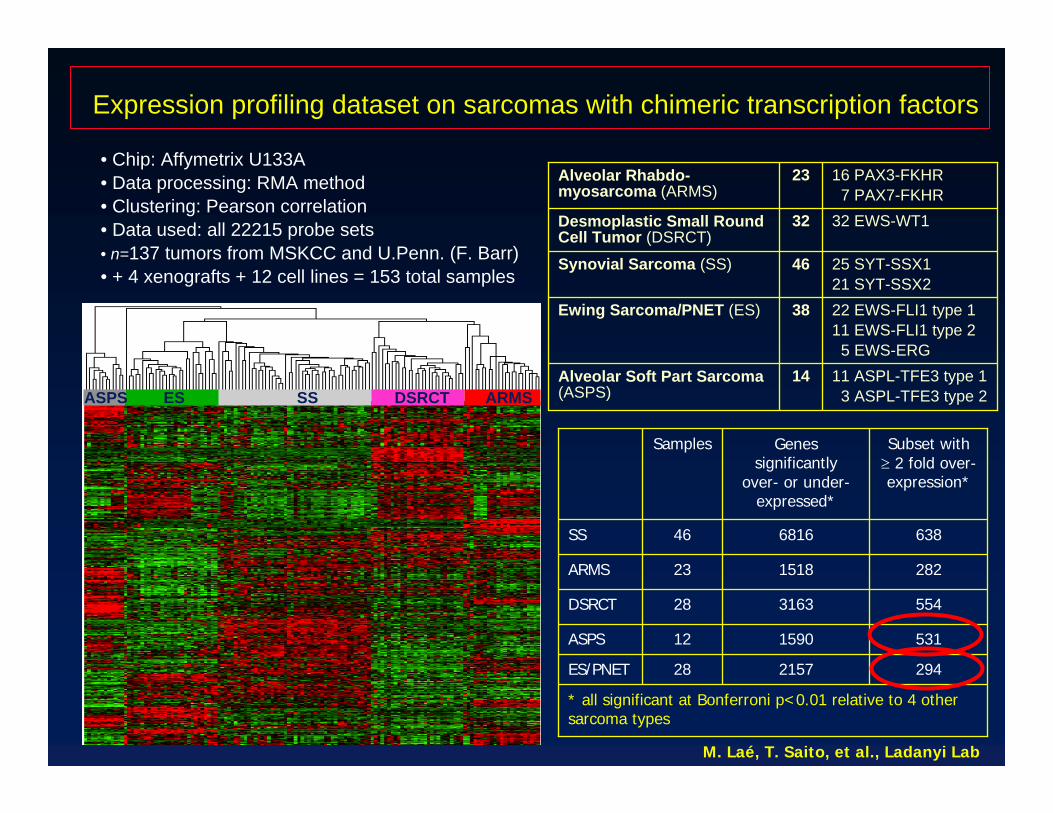
Expression profiling dataset on sarcomas with chimeric transcription factors
* all significant at Bonferroni p<0.01 relative to 4 other sarcoma types
294215728ES/PNET
531159012ASPS
554316328DSRCT
282151823ARMS
638681646SS
Subset with≥ 2 fold over-expression*
Genes significantly
over- or under-expressed*
Samples
11 ASPL-TFE3 type 13 ASPL-TFE3 type 2
14Alveolar Soft Part Sarcoma (ASPS)
22 EWS-FLI1 type 111 EWS-FLI1 type 2
5 EWS-ERG
38Ewing Sarcoma/PNET (ES)
25 SYT-SSX121 SYT-SSX2
46Synovial Sarcoma (SS)
32 EWS-WT132Desmoplastic Small Round Cell Tumor (DSRCT)
16 PAX3-FKHR7 PAX7-FKHR
23Alveolar Rhabdo-myosarcoma (ARMS)
• Chip: Affymetrix U133A• Data processing: RMA method• Clustering: Pearson correlation• Data used: all 22215 probe sets• n=137 tumors from MSKCC and U.Penn. (F. Barr)• + 4 xenografts + 12 cell lines = 153 total samples
ASPS ES SS DSRCT ARMS
M. Laé, T. Saito, et al., Ladanyi Lab
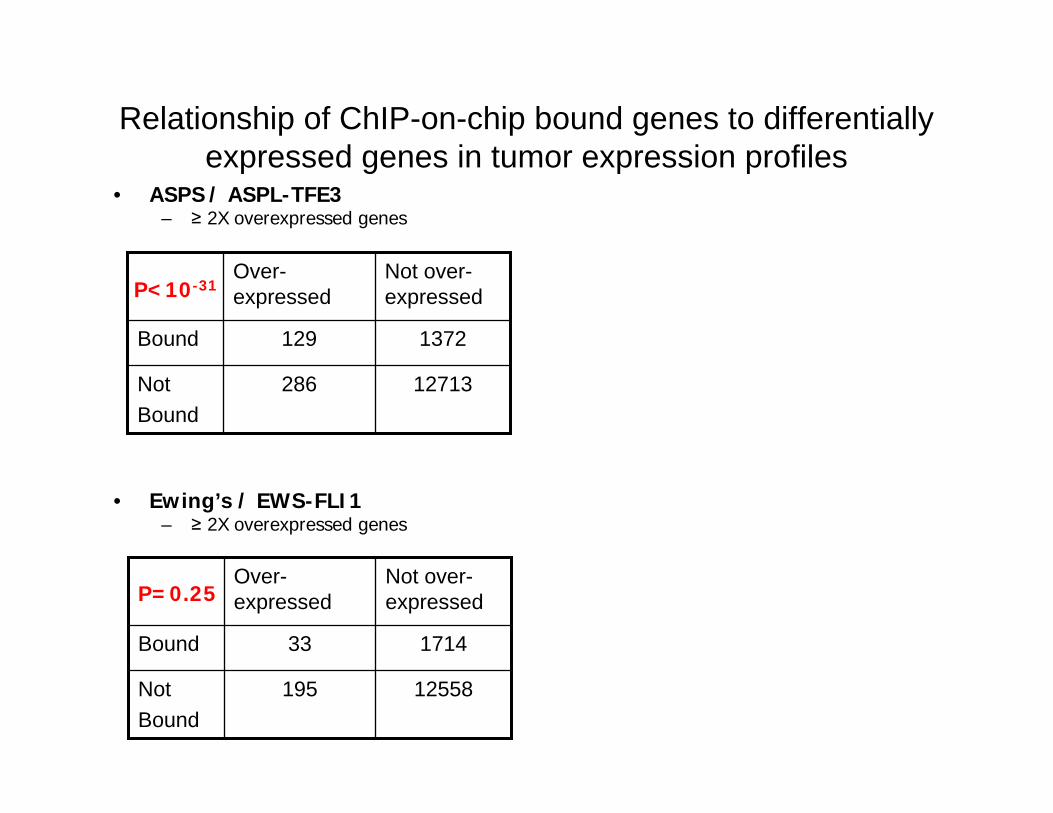
Relationship of ChIP-on-chip bound genes to differentially expressed genes in tumor expression profiles
• ASPS / ASPL-TFE3– ≥ 2X overexpressed genes
• Ewing’s / EWS-FLI1– ≥ 2X overexpressed genes
12713286NotBound
1372129Bound
Not over-expressed
Over-expressedP<10-31
12558195NotBound
171433Bound
Not over-expressed
Over-expressedP=0.25
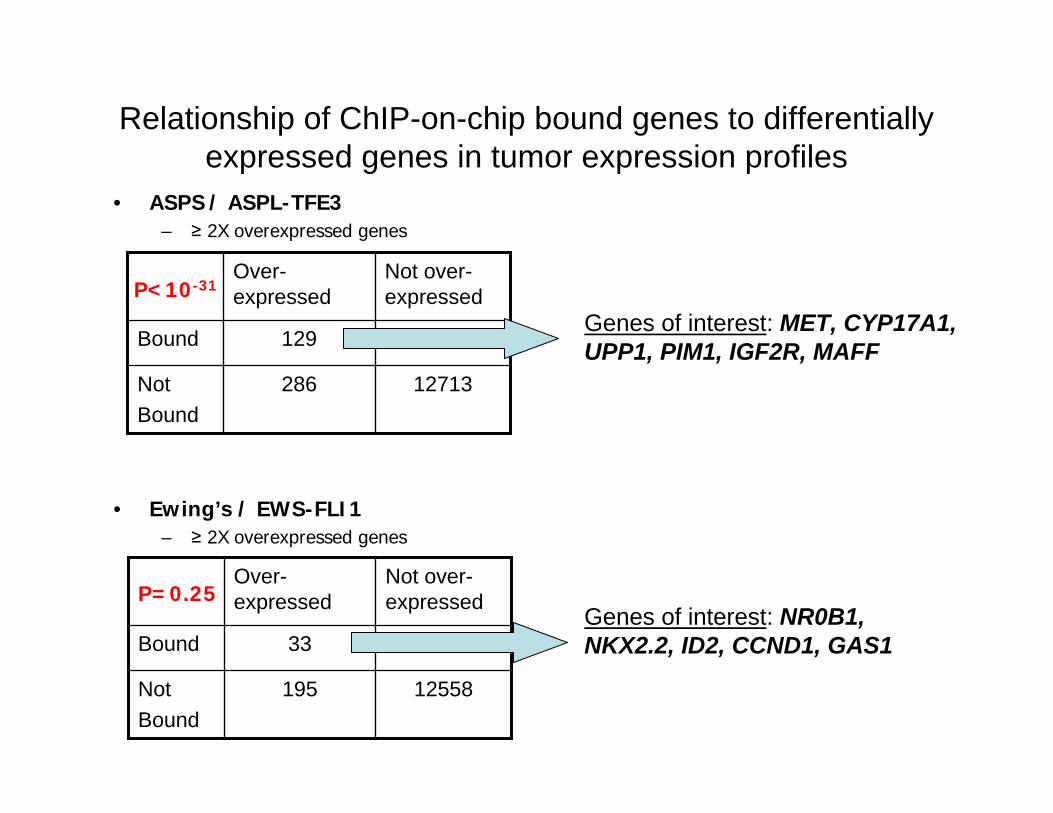
Genes of interest: MET, CYP17A1, UPP1, PIM1, IGF2R, MAFF
Genes of interest: NR0B1, NKX2.2, ID2, CCND1, GAS1
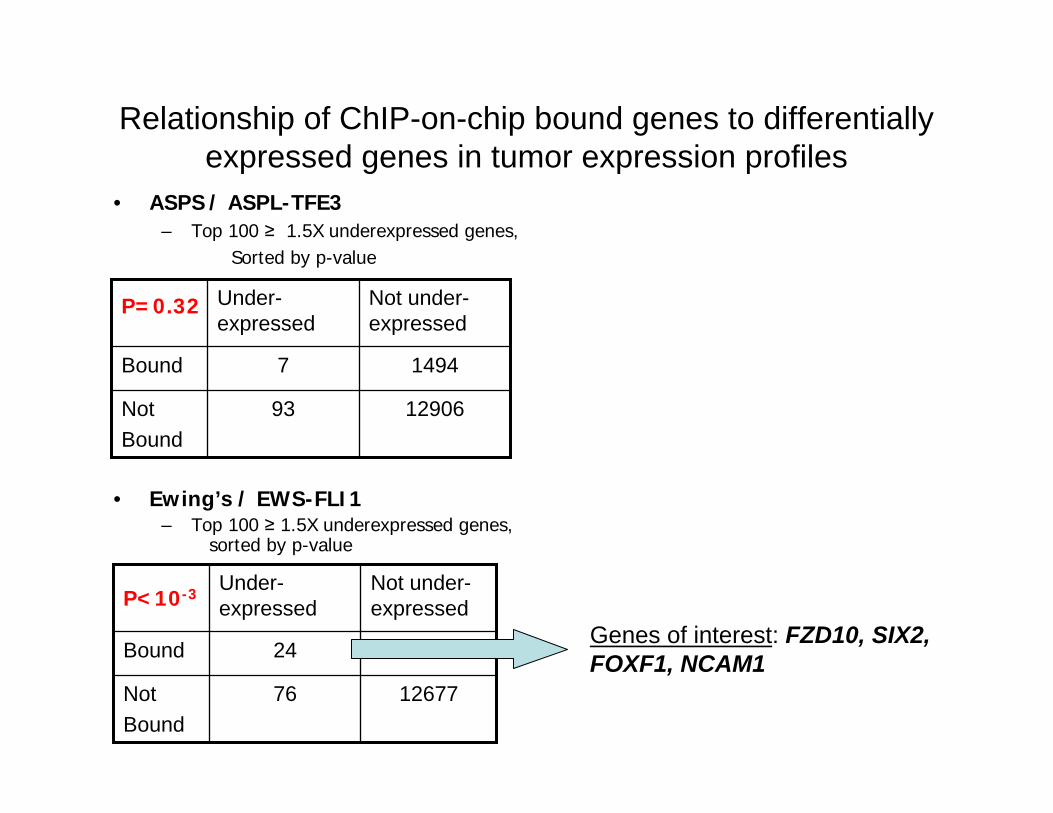
Relationship of ChIP-on-chip bound genes to differentially expressed genes in tumor expression profiles
• ASPS / ASPL-TFE3– Top 100 ≥ 1.5X underexpressed genes,
Sorted by p-value
• Ewing’s / EWS-FLI1– Top 100 ≥ 1.5X underexpressed genes,
sorted by p-value
1290693NotBound
14947Bound
Not under-expressed
Under-expressed
P=0.32
1267776NotBound
172324Bound
Not under-expressed
Under-expressedP<10-3
Genes of interest: FZD10, SIX2, FOXF1, NCAM1
12880119NotBound
147229Bound
Not down-regulated
Down-regulated
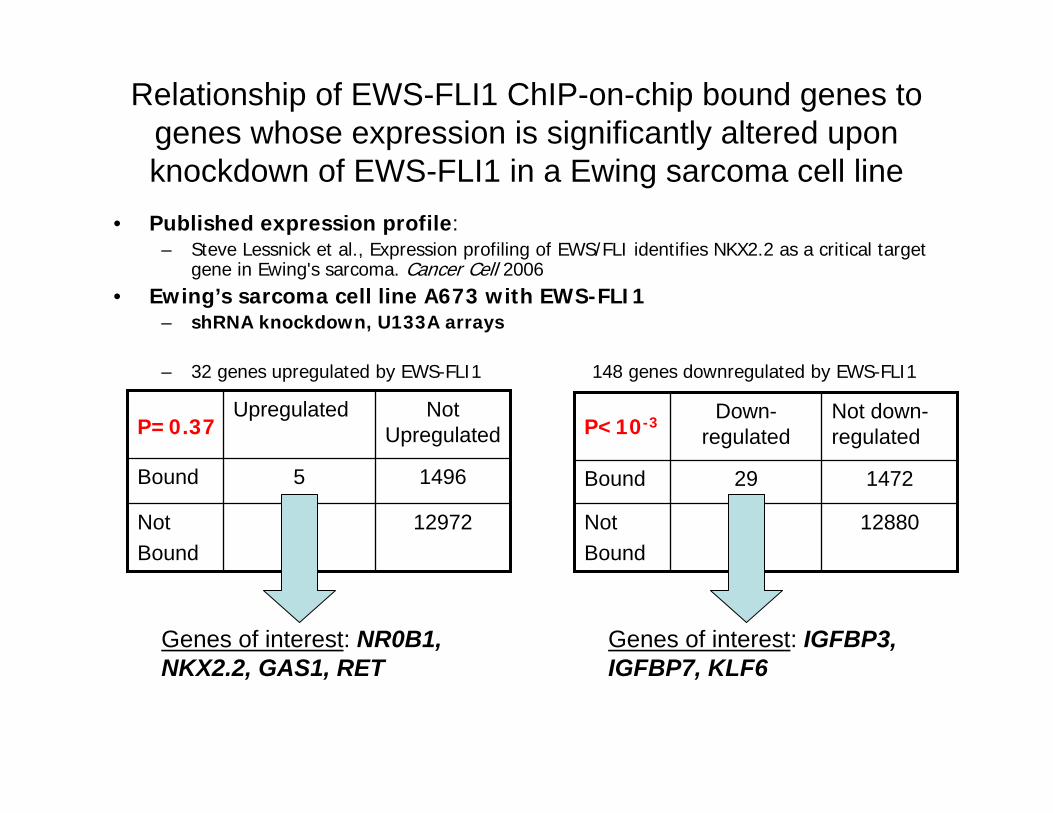
Relationship of EWS-FLI1 ChIP-on-chip bound genes to genes whose expression is significantly altered upon knockdown of EWS-FLI1 in a Ewing sarcoma cell line
• Published expression profile: – Steve Lessnick et al., Expression profiling of EWS/FLI identifies NKX2.2 as a critical target
gene in Ewing's sarcoma. Cancer Cell 2006 • Ewing’s sarcoma cell line A673 with EWS-FLI1
– shRNA knockdown, U133A arrays
– 32 genes upregulated by EWS-FLI1 148 genes downregulated by EWS-FLI1
1297227NotBound
14965Bound
Not Upregulated
UpregulatedP=0.37 P<10-3
12880119NotBound
147229Bound
Not down-regulated
Down-regulated
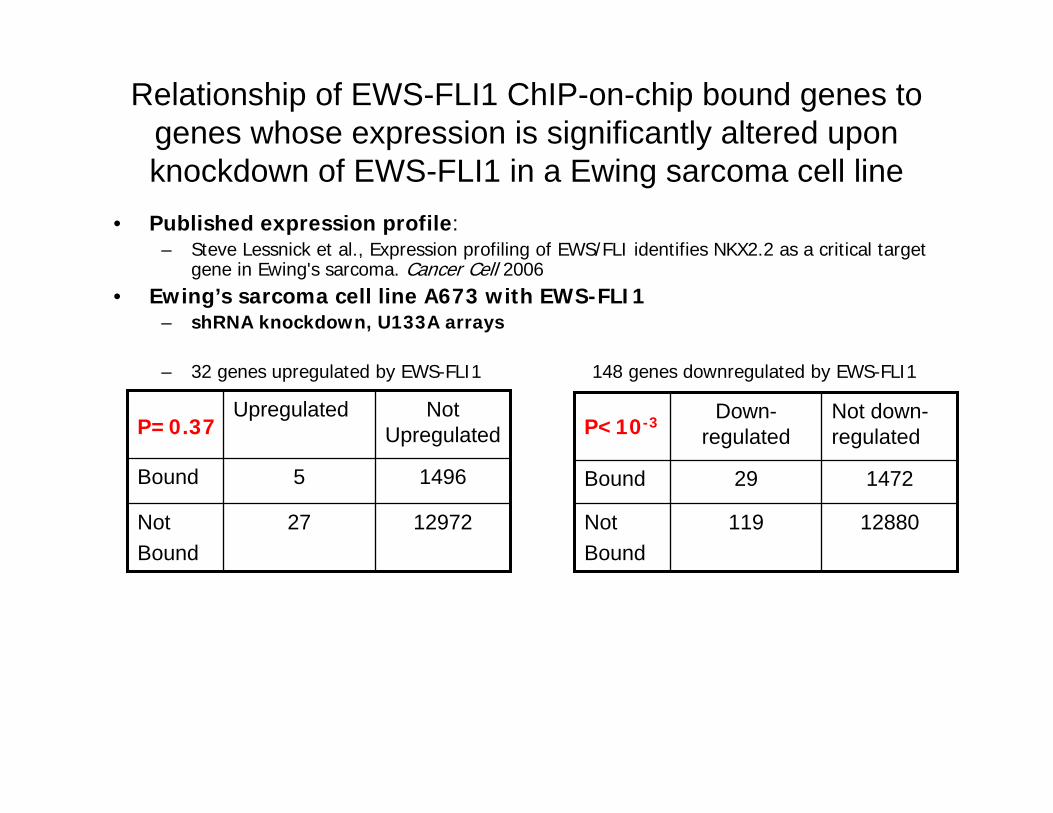
Relationship of EWS-FLI1 ChIP-on-chip bound genes to genes whose expression is significantly altered upon knockdown of EWS-FLI1 in a Ewing sarcoma cell line
• Published expression profile: – Steve Lessnick et al., Expression profiling of EWS/FLI identifies NKX2.2 as a critical target
gene in Ewing's sarcoma. Cancer Cell 2006 • Ewing’s sarcoma cell line A673 with EWS-FLI1
– shRNA knockdown, U133A arrays
– 32 genes upregulated by EWS-FLI1 148 genes downregulated by EWS-FLI1
1297227NotBound
14965Bound
Not Upregulated
UpregulatedP=0.37 P<10-3
Genes of interest: NR0B1, NKX2.2, GAS1, RET
Genes of interest: IGFBP3, IGFBP7, KLF6
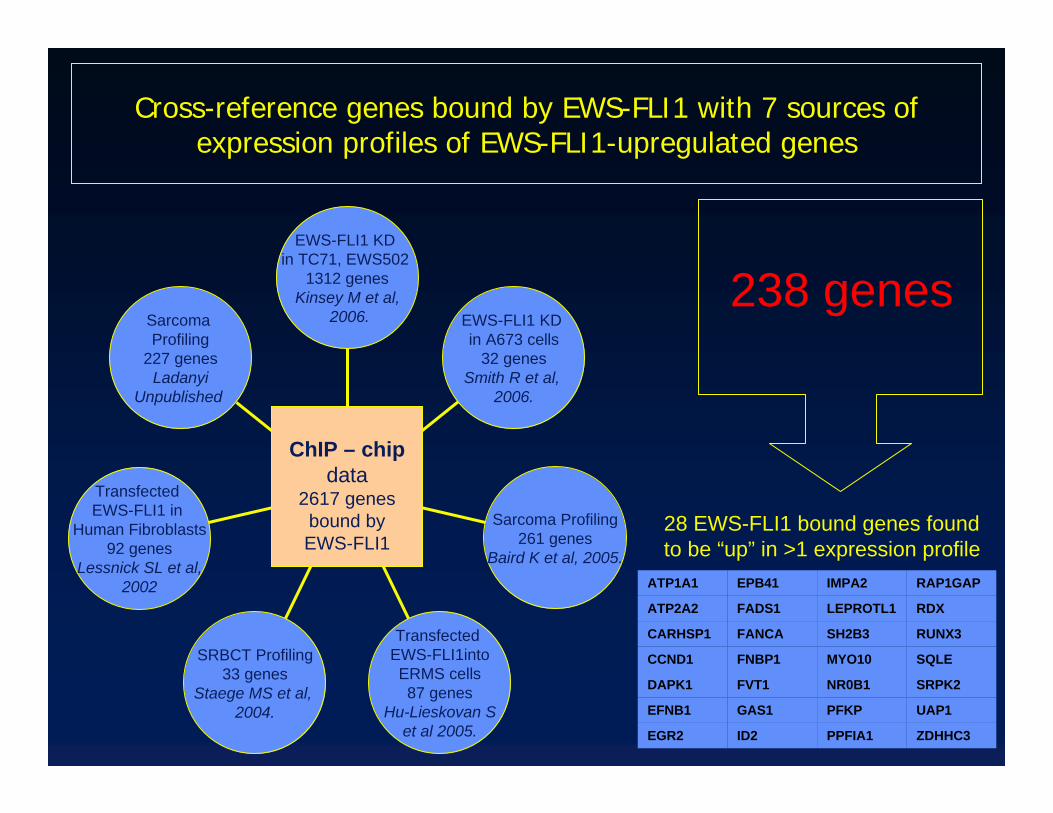
Cross-reference genes bound by EWS-FLI1 with 7 sources of expression profiles of EWS-FLI1-upregulated genes
238 genesSarcoma Profiling
227 genesLadanyi
Unpublished
Transfected EWS-FLI1 in
Human Fibroblasts92 genes
Lessnick SL et al,2002
SRBCT Profiling33 genes
Staege MS et al, 2004.
Transfected EWS-FLI1intoERMS cells87 genes
Hu-Lieskovan Set al 2005.
Sarcoma Profiling261 genes
Baird K et al, 2005.
EWS-FLI1 KD in A673 cells
32 genesSmith R et al,
2006.
EWS-FLI1 KD in TC71, EWS502
1312 genesKinsey M et al,
2006.
ChIP – chipdata
2617 genes bound by EWS-FLI1
ZDHHC3 PPFIA1 ID2 EGR2
UAP1 PFKP GAS1EFNB1
SRPK2 NR0B1FVT1 DAPK1
SQLE MYO10 FNBP1 CCND1
RUNX3 SH2B3 FANCACARHSP1
RDX LEPROTL1 FADS1 ATP2A2
RAP1GAP IMPA2 EPB41 ATP1A1
28 EWS-FLI1 bound genes found to be “up” in >1 expression profile
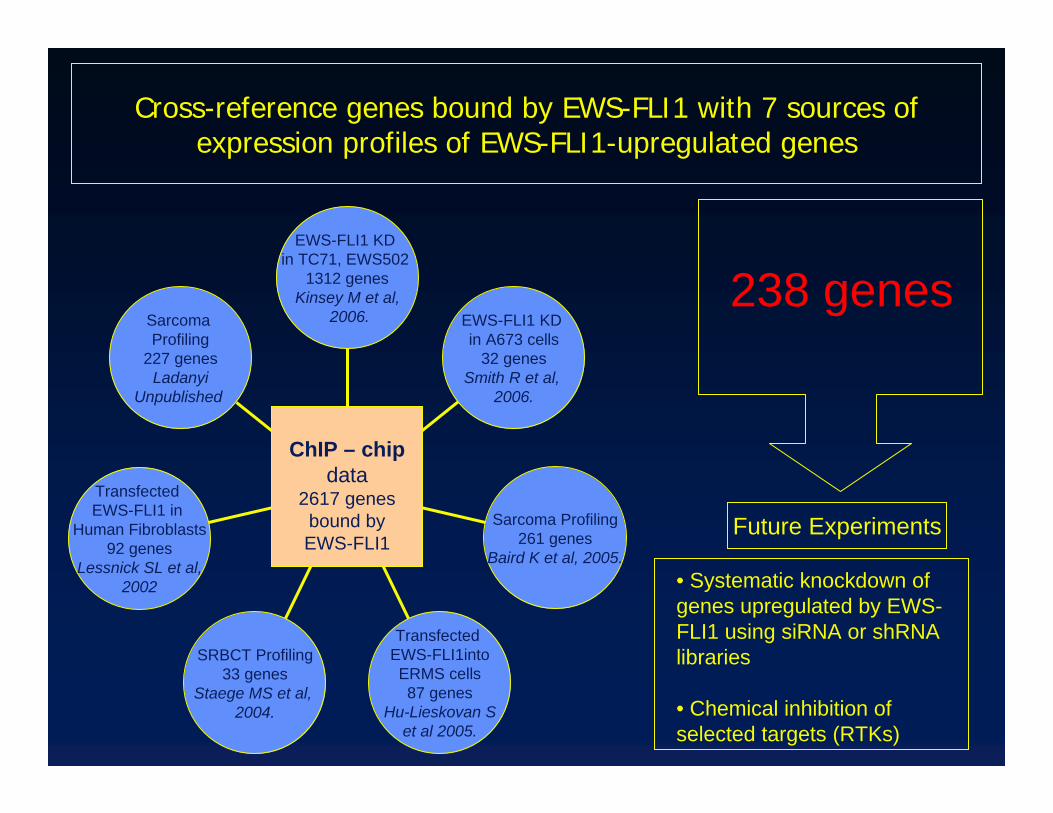
Cross-reference genes bound by EWS-FLI1 with 7 sources of expression profiles of EWS-FLI1-upregulated genes
238 genesSarcoma Profiling
227 genesLadanyi
Unpublished
Transfected EWS-FLI1 in
Human Fibroblasts92 genes
Lessnick SL et al,2002
SRBCT Profiling33 genes
Staege MS et al, 2004.
Transfected EWS-FLI1intoERMS cells87 genes
Hu-Lieskovan Set al 2005.
Sarcoma Profiling261 genes
Baird K et al, 2005.
EWS-FLI1 KD in A673 cells
32 genesSmith R et al,
2006.
EWS-FLI1 KD in TC71, EWS502
1312 genesKinsey M et al,
2006.
ChIP – chipdata
2617 genes bound by EWS-FLI1
Future Experiments
• Systematic knockdown of genes upregulated by EWS-FLI1 using siRNA or shRNA libraries
• Chemical inhibition of selected targets (RTKs)
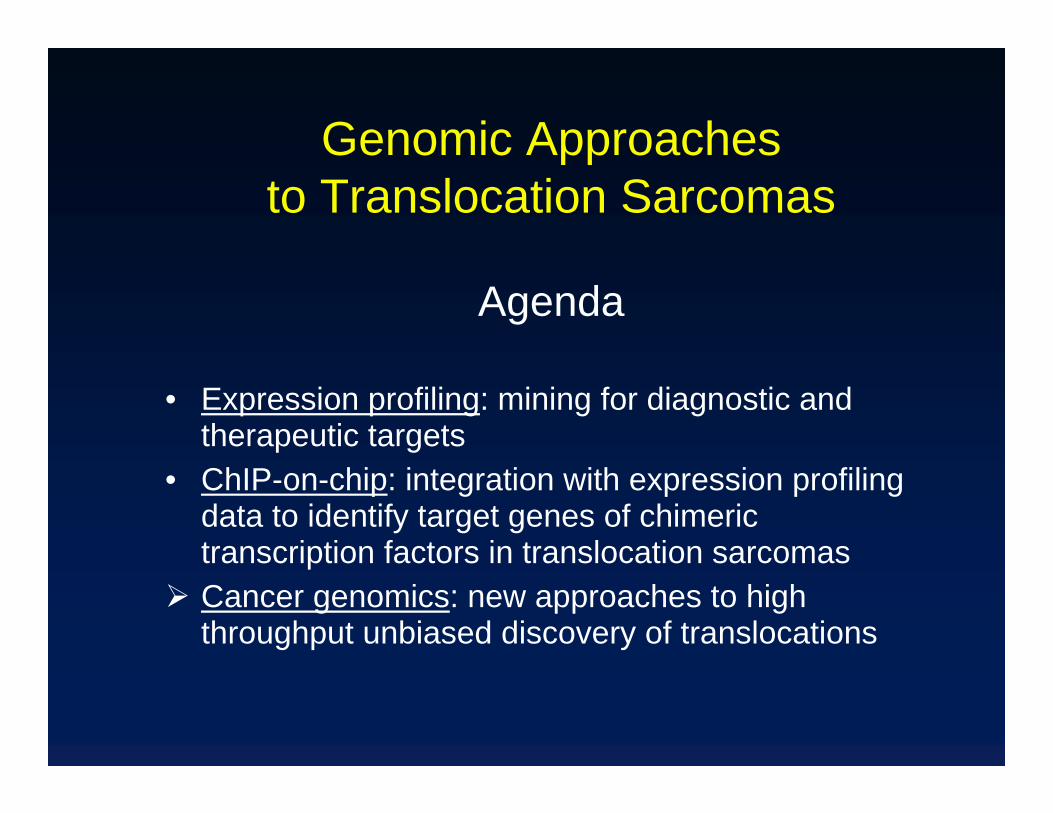
Genomic Approaches to Translocation Sarcomas
Agenda
• Expression profiling: mining for diagnostic and therapeutic targets
• ChIP-on-chip: integration with expression profiling data to identify target genes of chimeric transcription factors in translocation sarcomasCancer genomics: new approaches to high throughput unbiased discovery of translocations
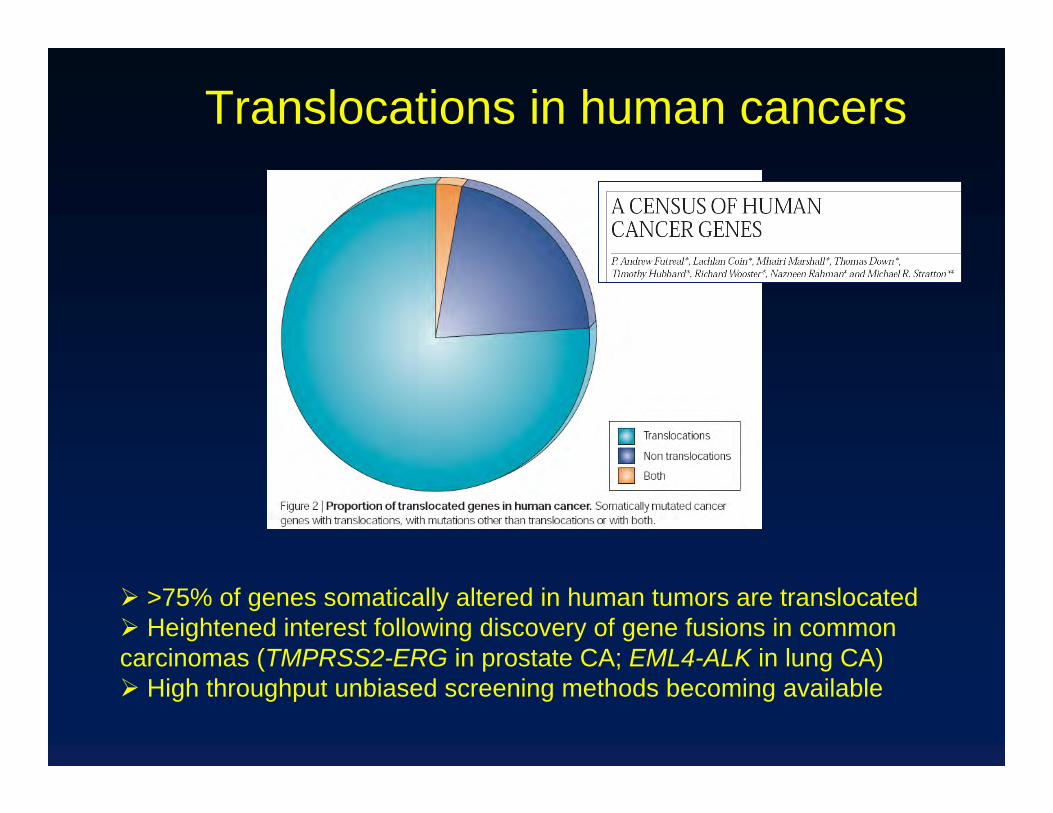
>75% of genes somatically altered in human tumors are translocatedHeightened interest following discovery of gene fusions in common
carcinomas (TMPRSS2-ERG in prostate CA; EML4-ALK in lung CA)High throughput unbiased screening methods becoming available
Translocations in human cancers
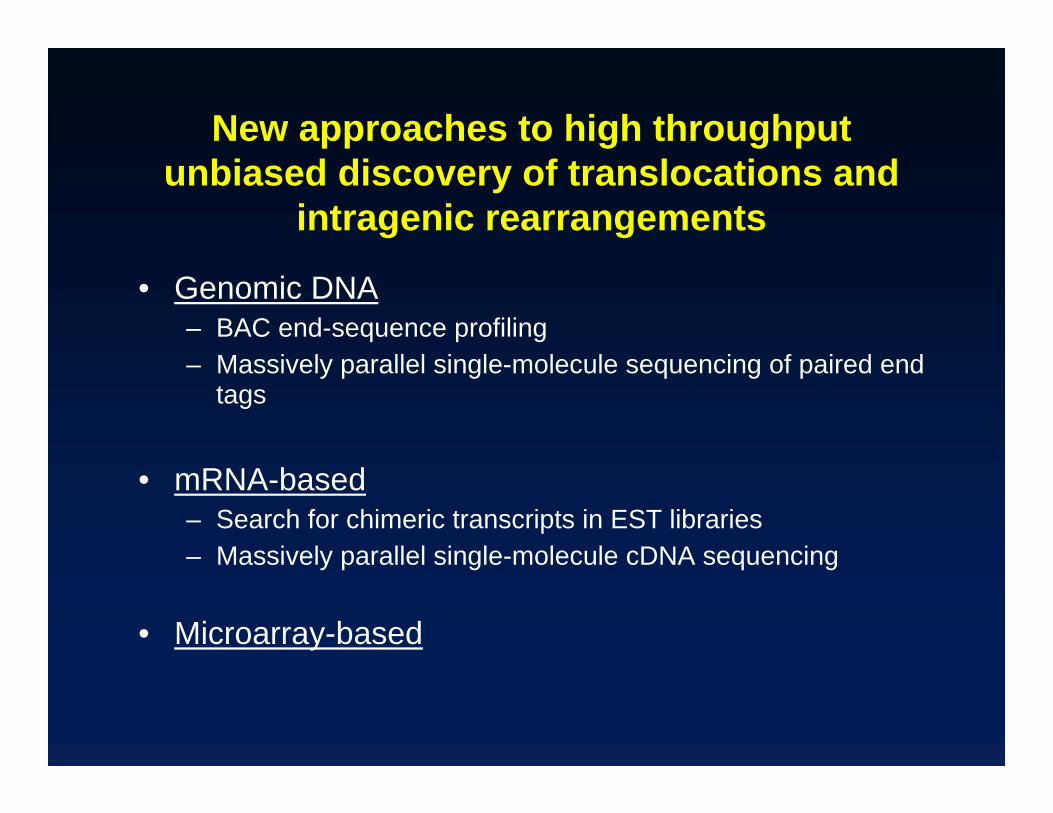
New approaches to high throughput unbiased discovery of translocations and
intragenic rearrangements
• Genomic DNA– BAC end-sequence profiling– Massively parallel single-molecule sequencing of paired end
tags
• mRNA-based– Search for chimeric transcripts in EST libraries – Massively parallel single-molecule cDNA sequencing
• Microarray-based
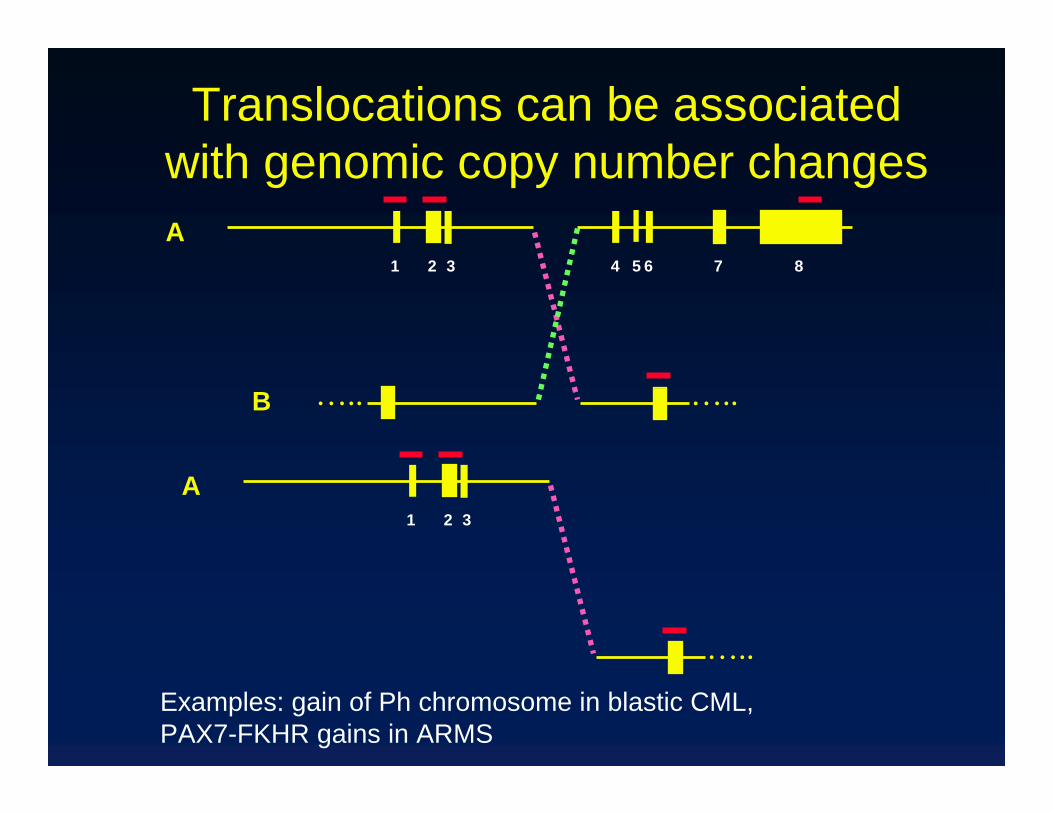
Translocations can be associated with genomic copy number changes
1 2 3 4 5 6 7 8
…..…..
A
B
Examples: gain of Ph chromosome in blastic CML, PAX7-FKHR gains in ARMS
1 2 3
…..
A
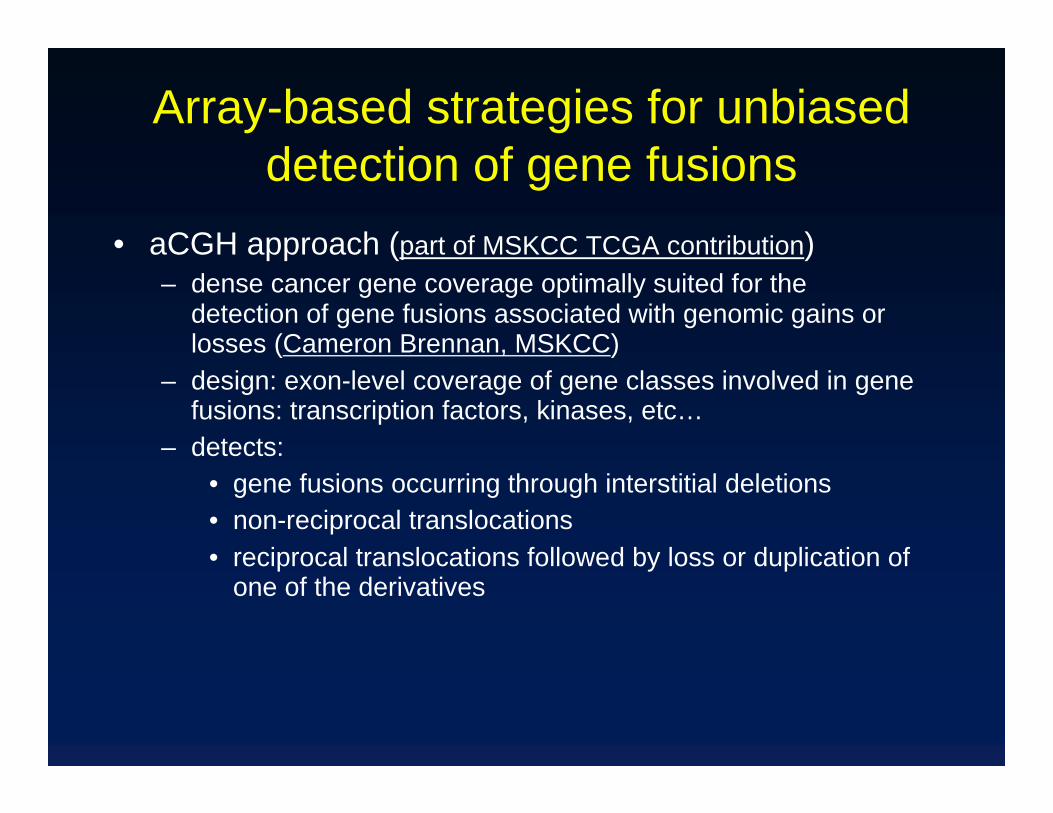
Array-based strategies for unbiased detection of gene fusions
• aCGH approach (part of MSKCC TCGA contribution)– dense cancer gene coverage optimally suited for the
detection of gene fusions associated with genomic gains or losses (Cameron Brennan, MSKCC)
– design: exon-level coverage of gene classes involved in gene fusions: transcription factors, kinases, etc…
– detects: • gene fusions occurring through interstitial deletions • non-reciprocal translocations• reciprocal translocations followed by loss or duplication of
one of the derivatives
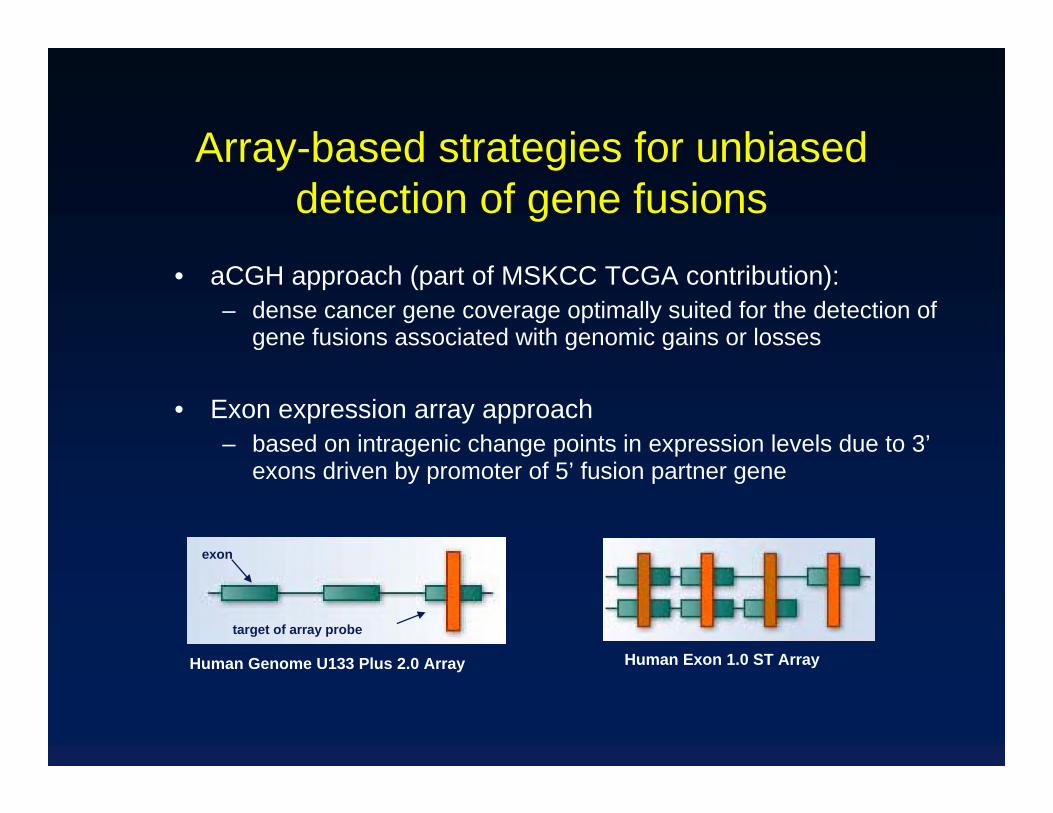
Array-based strategies for unbiased detection of gene fusions
• aCGH approach (part of MSKCC TCGA contribution):– dense cancer gene coverage optimally suited for the detection of
gene fusions associated with genomic gains or losses
• Exon expression array approach – based on intragenic change points in expression levels due to 3’
exons driven by promoter of 5’ fusion partner gene
Human Exon 1.0 ST ArrayHuman Genome U133 Plus 2.0 Array
exon
target of array probe
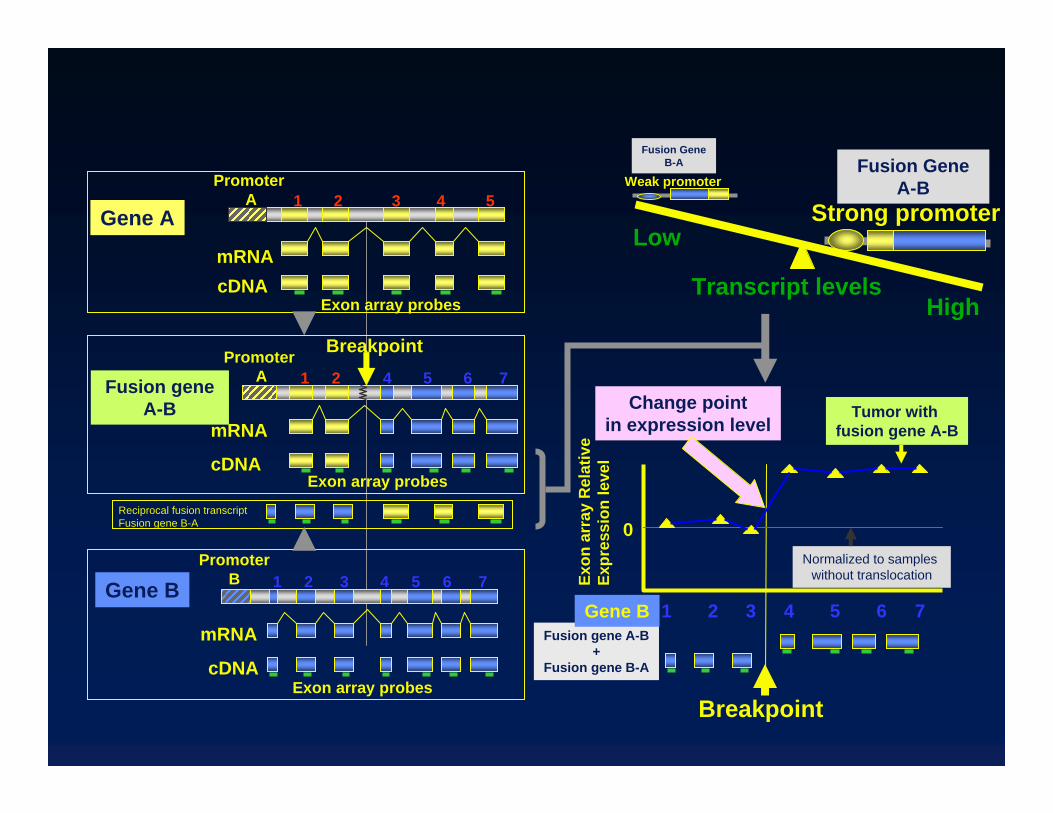
Fusion gene A-B+
Fusion gene B-A
Breakpoint
Exon
arr
ayR
elat
ive
Expr
essi
on le
vel
1 2 3 4 5 6 7Gene B
Normalized to samples without translocation
Tumor with fusion gene A-B
0
Change pointin expression level
Reciprocal fusion transcriptFusion gene B-A
Gene A
Exon array probes
PromoterA
mRNAcDNA
1 2 3 4 5
Gene BPromoter
B
Exon array probescDNA
mRNA
1 2 3 4 5 6 7
Fusion gene A-B
Promoter A
mRNA
cDNA
Breakpoint
Exon array probes
1 2 4 5 6 7
Weak promoter
Low
High
Strong promoter
Transcript levels
Fusion GeneA-B
Fusion GeneB-A
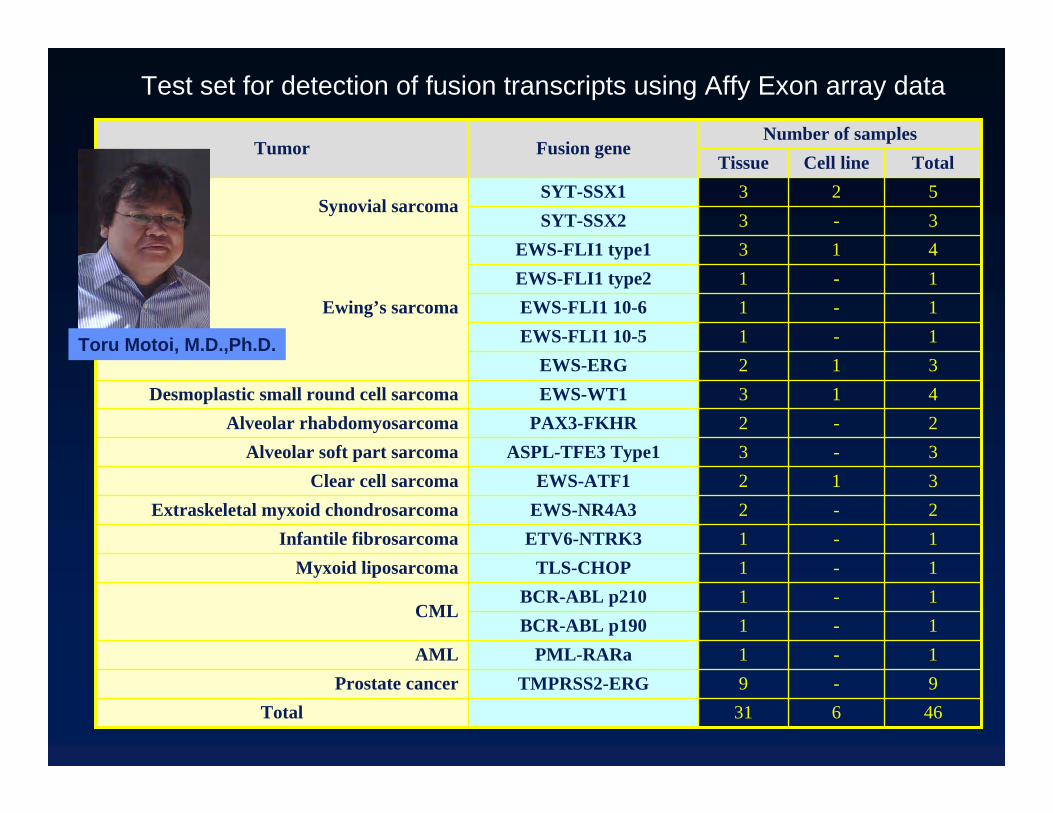
9-9TMPRSS2-ERGProstate cancer1-1PML-RARaAML
1-1EWS-FLI1 10-61-1EWS-FLI1 10-5
31
1111223232
1333
TissueNumber of samples
6
-----1--11
-1-2
Cell line
1BCR-ABL p210
1EWS-FLI1 type24EWS-FLI1 type1
3EWS-ERG
5SYT-SSX1
1ETV6-NTRK3Infantile fibrosarcoma
1BCR-ABL p190CML
2EWS-NR4A3Extraskeletal myxoid chondrosarcoma3EWS-ATF1Clear cell sarcoma
1TLS-CHOPMyxoid liposarcoma
Ewing’s sarcoma
3SYT-SSX2Synovial sarcoma
TotalFusion geneTumor
4EWS-WT1Desmoplastic small round cell sarcoma
46Total
3ASPL-TFE3 Type1Alveolar soft part sarcoma2PAX3-FKHRAlveolar rhabdomyosarcoma
Test set for detection of fusion transcripts using Affy Exon array data
Toru Motoi, M.D.,Ph.D.
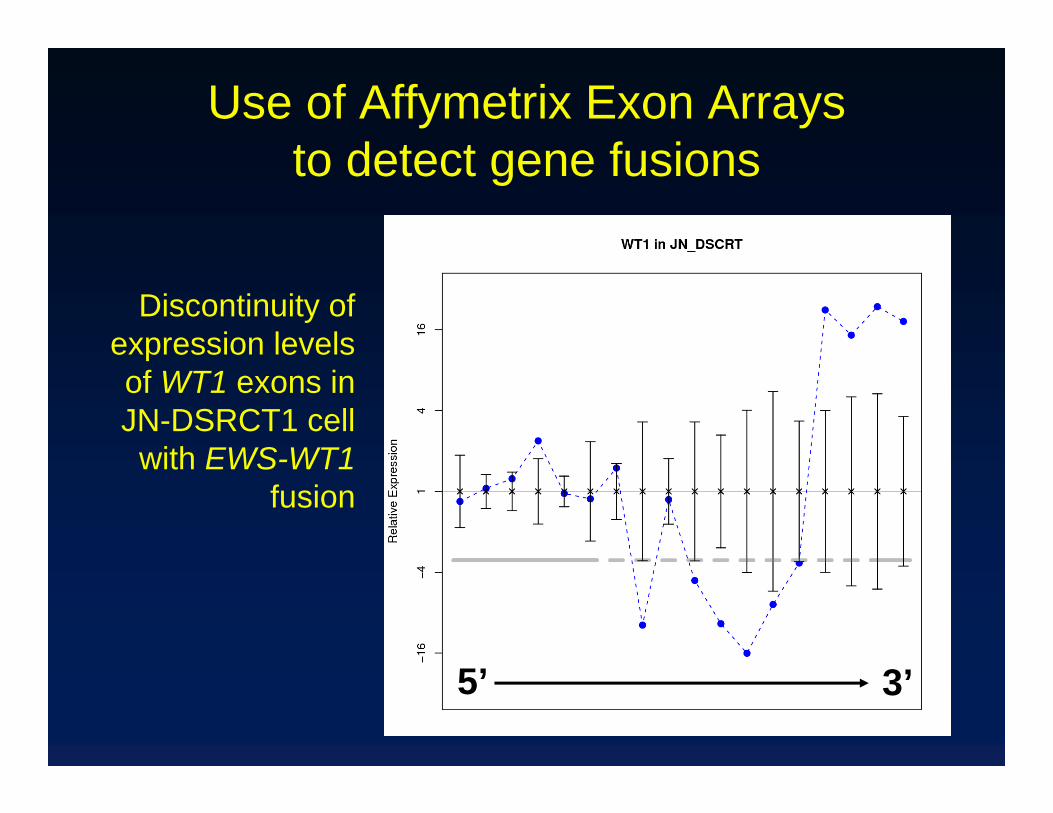
Use of Affymetrix Exon Arrays to detect gene fusions
5’ 3’
Discontinuity of expression levels of WT1 exons in JN-DSRCT1 cell
with EWS-WT1fusion
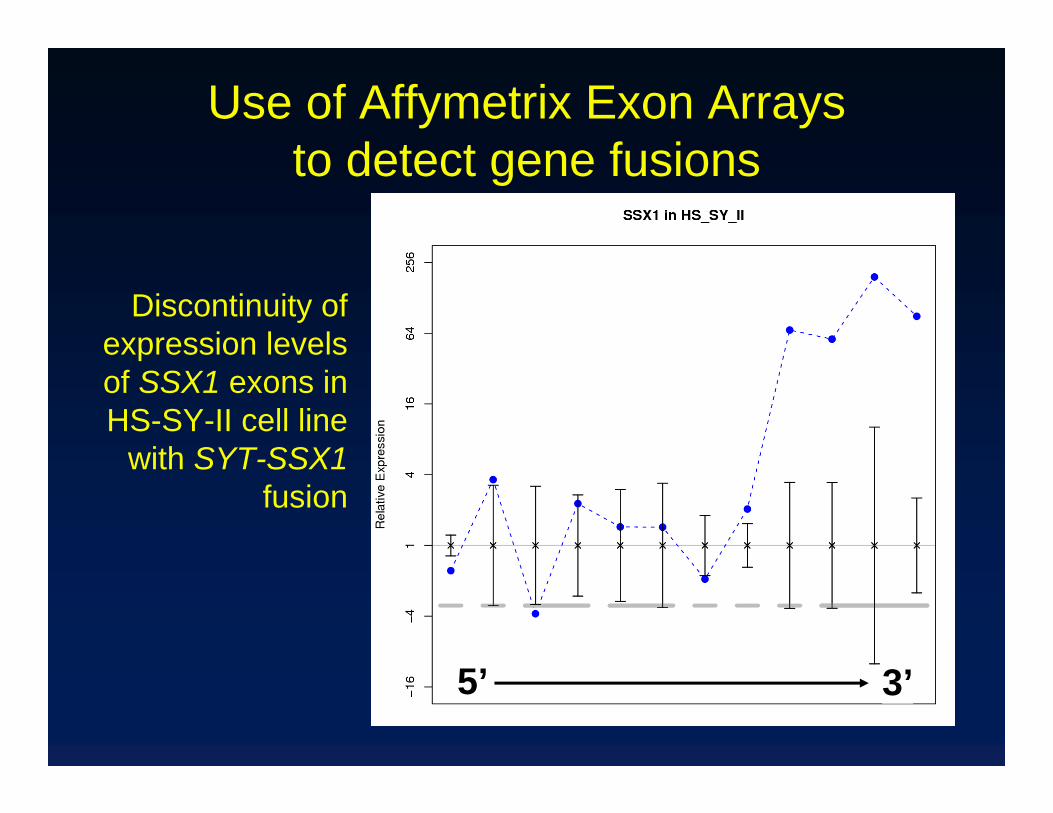
Use of Affymetrix Exon Arrays to detect gene fusions
5’ 3’
Discontinuity of expression levels of SSX1 exons in HS-SY-II cell line
with SYT-SSX1fusion
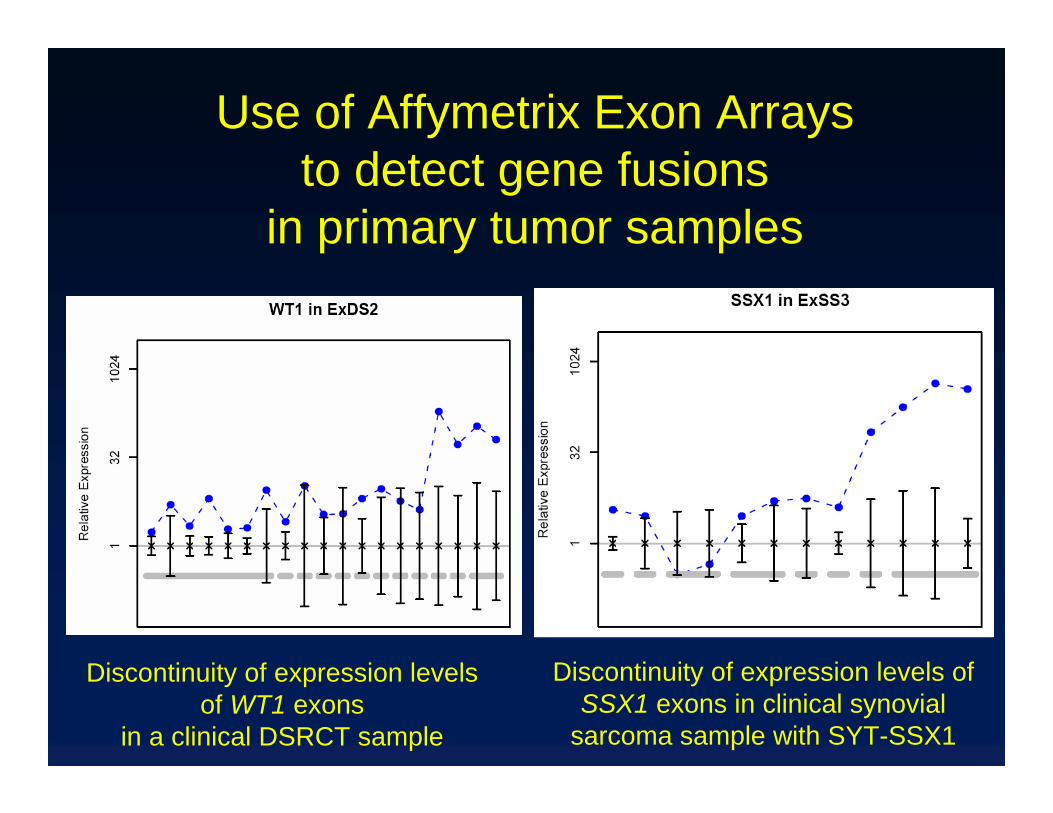
Use of Affymetrix Exon Arrays to detect gene fusions
in primary tumor samples
Discontinuity of expression levels of WT1 exons
in a clinical DSRCT sample
Discontinuity of expression levels ofSSX1 exons in clinical synovial
sarcoma sample with SYT-SSX1
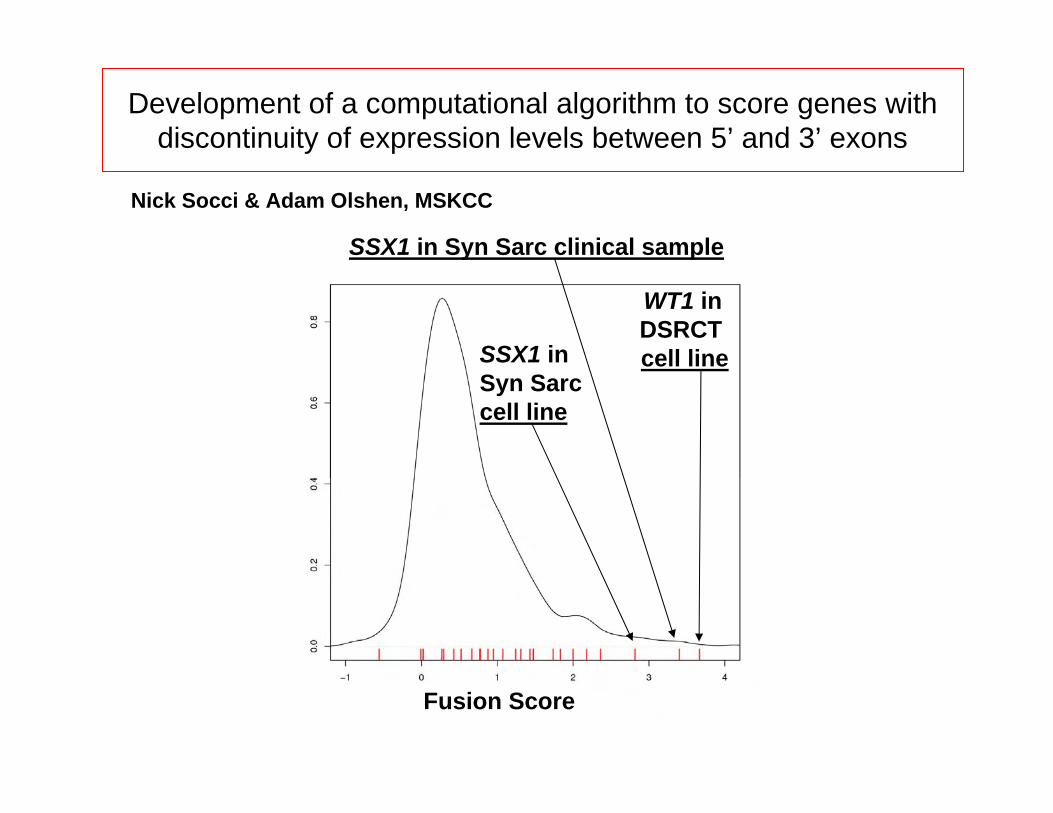
Development of a computational algorithm to score genes with discontinuity of expression levels between 5’ and 3’ exons
SSX1 in Syn Sarccell line
WT1 in DSRCTcell line
Fusion Score
SSX1 in Syn Sarc clinical sample
Nick Socci & Adam Olshen, MSKCC
Genomic Approaches to Translocation Sarcomas
Agenda
• Expression profiling: mining for diagnostic and therapeutic targets
• ChIP-on-chip: integration with expression profiling data to identify target genes of chimeric transcription factors in translocation sarcomas
• Cancer genomics: new approaches to high throughput unbiased discovery of translocations and intragenic rearrangements