Fuel Cell & Heat Engine Hybrid Systems System...EPA Catalog of CHP Technologies, March2015. 2. CA...
33
Fuel Cell & Heat Engine Hybrid Systems Workshop Introduction January 26-27, 2017
Transcript of Fuel Cell & Heat Engine Hybrid Systems System...EPA Catalog of CHP Technologies, March2015. 2. CA...
Fuel Cell & Heat Engine Hybrid Systems
Workshop Introduction
January 26-27, 2017
Objective
2
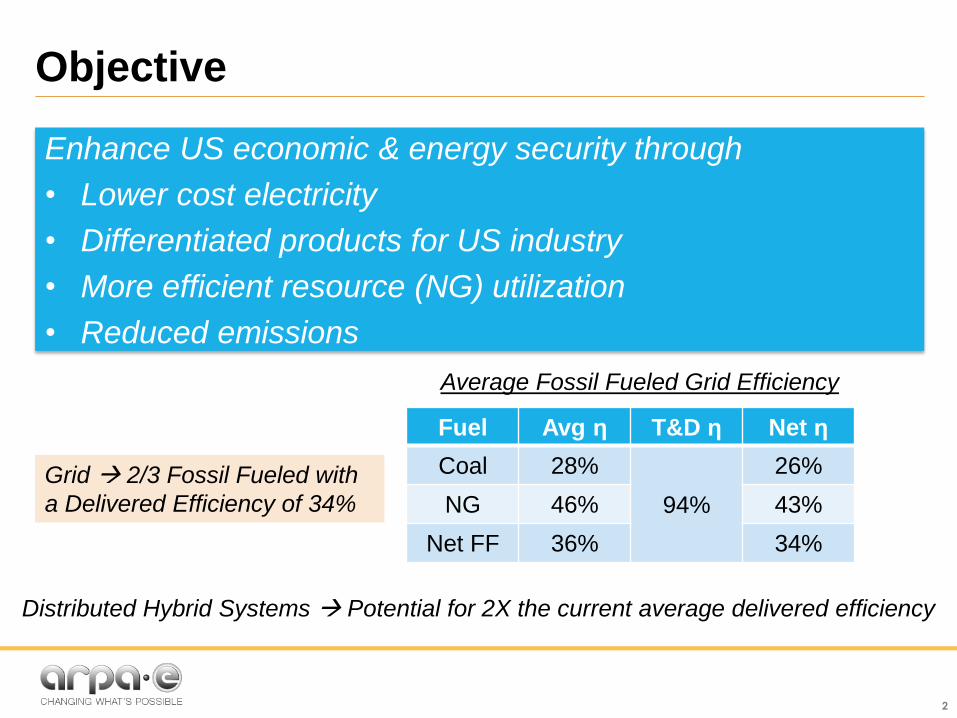
Enhance US economic & energy security through
• Lower cost electricity
• Differentiated products for US industry
• More efficient resource (NG) utilization
• Reduced emissions
Fuel Avg η T&D η Net η
Coal 28%
94%
26%
NG 46% 43%
Net FF 36% 34%
Grid 2/3 Fossil Fueled with
a Delivered Efficiency of 34%
Average Fossil Fueled Grid Efficiency
Distributed Hybrid Systems Potential for 2X the current average delivered efficiency
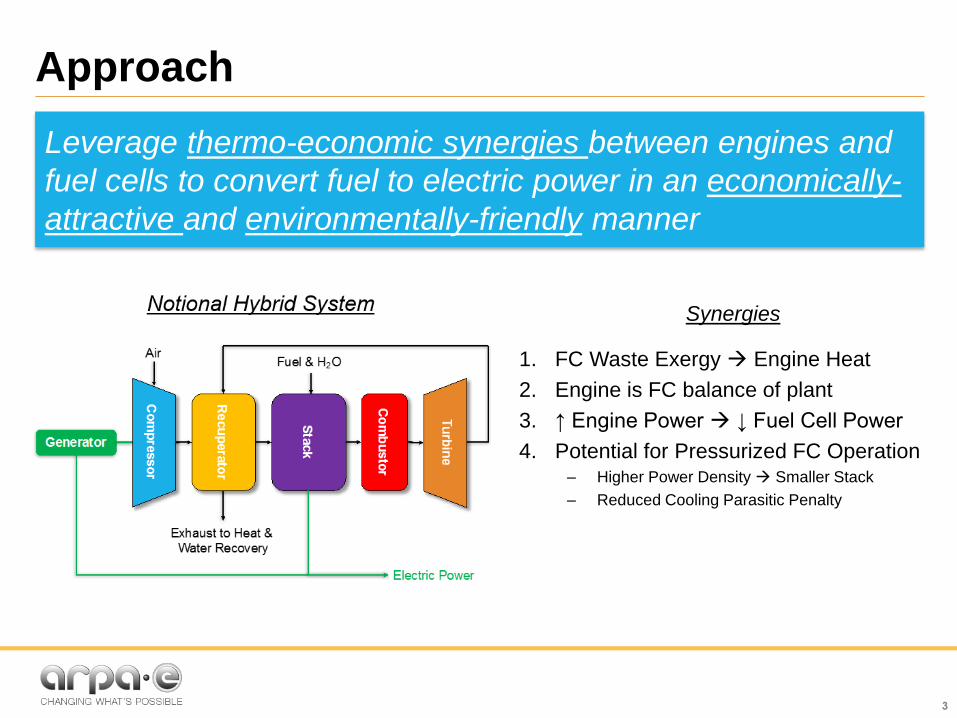
Approach
3
Leverage thermo-economic synergies between engines and
fuel cells to convert fuel to electric power in an economically-
attractive and environmentally-friendly manner
Synergies
1. FC Waste Exergy Engine Heat
2. Engine is FC balance of plant
3. ↑ Engine Power ↓ Fuel Cell Power
4. Potential for Pressurized FC Operation– Higher Power Density Smaller Stack
– Reduced Cooling Parasitic Penalty
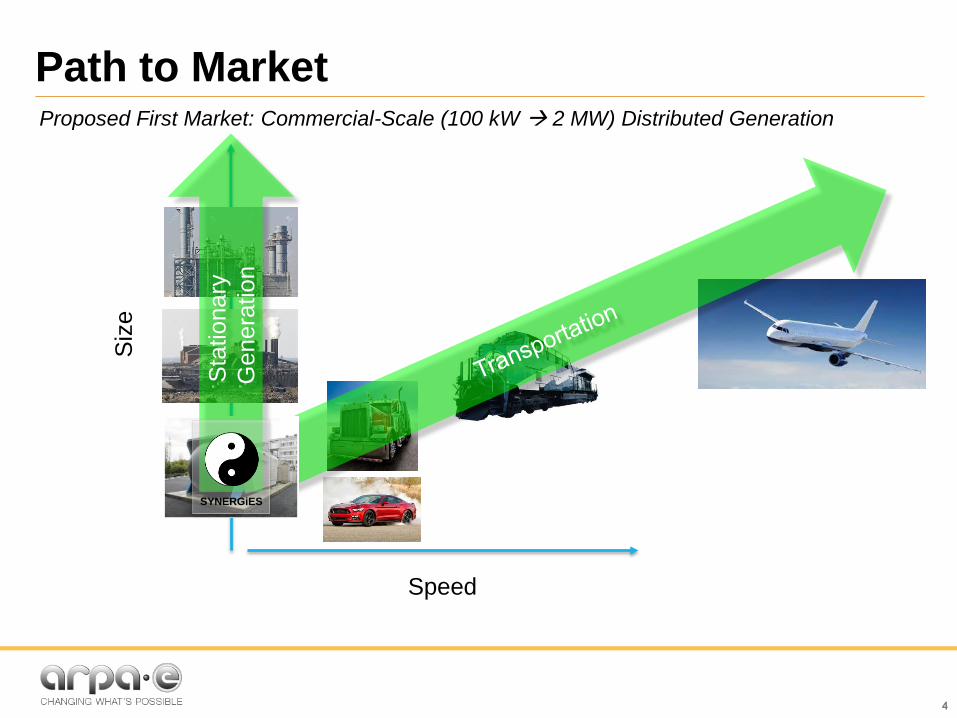
Path to Market
4
Siz
e
Speed
Proposed First Market: Commercial-Scale (100 kW 2 MW) Distributed Generation
Sta
tionary
Genera
tion
SYNERGiES
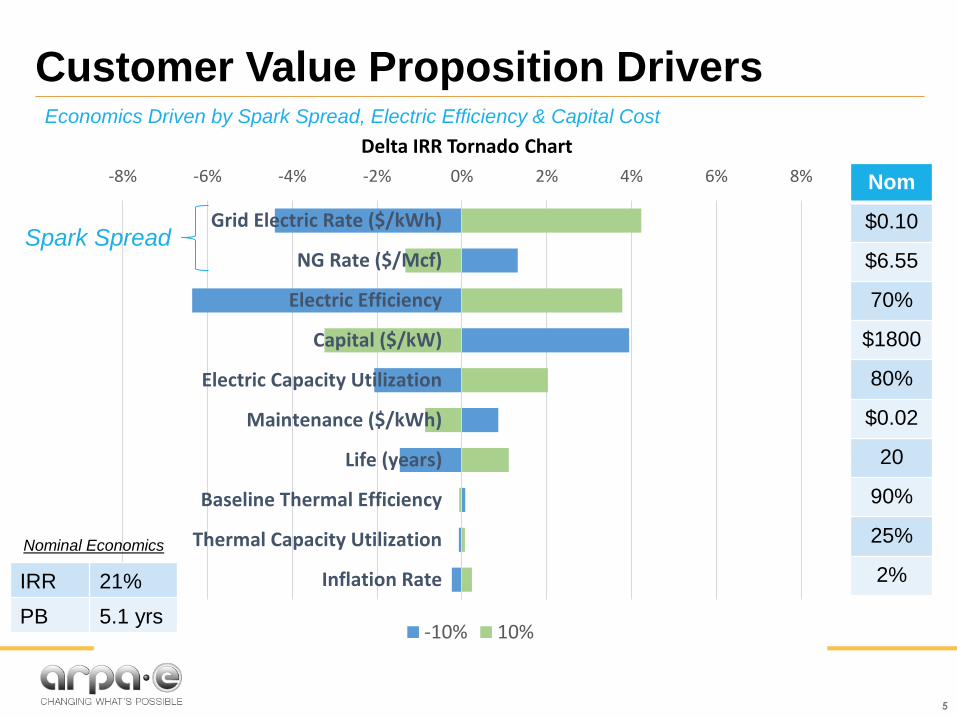
-8% -6% -4% -2% 0% 2% 4% 6% 8%
Grid Electric Rate ($/kWh)
NG Rate ($/Mcf)
Electric Efficiency
Capital ($/kW)
Electric Capacity Utilization
Maintenance ($/kWh)
Life (years)
Baseline Thermal Efficiency
Thermal Capacity Utilization
Inflation Rate
Delta IRR ($/kWh) Tornado Chart
-10% 10%
Customer Value Proposition DriversEconomics Driven by Spark Spread, Electric Efficiency & Capital Cost
5
Nom
$0.10
$6.55
70%
$1800
80%
$0.02
20
90%
25%
2%
Spark Spread
IRR 21%
PB 5.1 yrs
Nominal Economics
Delta IRR Tornado Chart
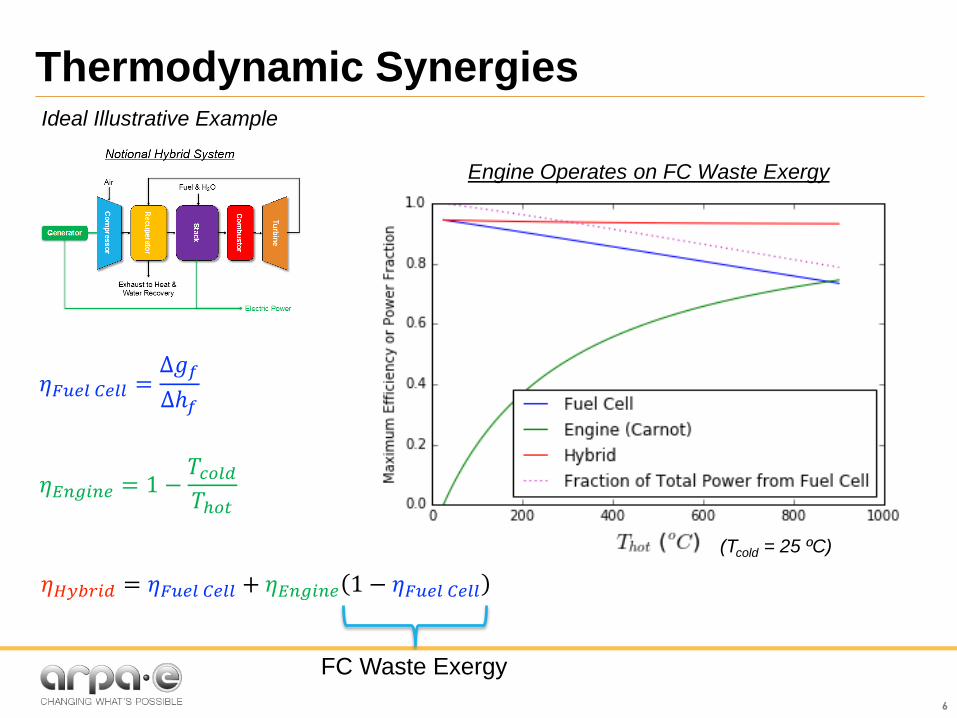
Thermodynamic Synergies
6
(Tcold = 25 ºC)
Ideal Illustrative Example
Engine Operates on FC Waste Exergy
FC Waste Exergy
𝜂𝐹𝑢𝑒𝑙 𝐶𝑒𝑙𝑙 =Δ𝑔𝑓
Δℎ𝑓
𝜂𝐸𝑛𝑔𝑖𝑛𝑒 = 1 −𝑇𝑐𝑜𝑙𝑑𝑇ℎ𝑜𝑡
𝜂𝐻𝑦𝑏𝑟𝑖𝑑 = 𝜂𝐹𝑢𝑒𝑙 𝐶𝑒𝑙𝑙 + 𝜂𝐸𝑛𝑔𝑖𝑛𝑒 1 − 𝜂𝐹𝑢𝑒𝑙 𝐶𝑒𝑙𝑙
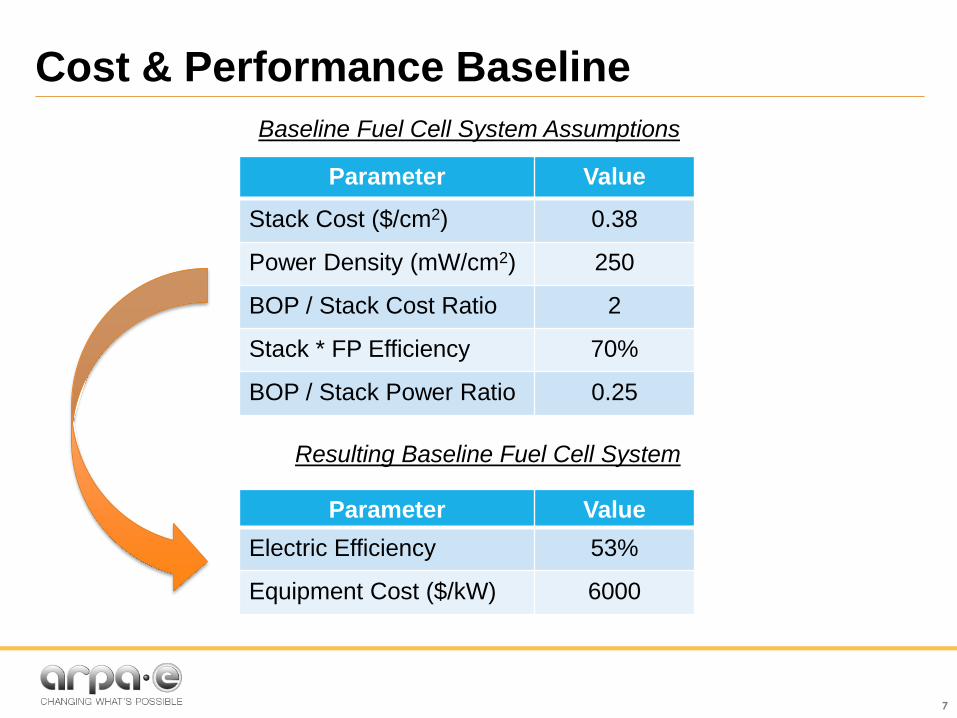
Cost & Performance Baseline
7
Parameter Value
Stack Cost ($/cm2) 0.38
Power Density (mW/cm2) 250
BOP / Stack Cost Ratio 2
Stack * FP Efficiency 70%
BOP / Stack Power Ratio 0.25
Baseline Fuel Cell System Assumptions
Parameter Value
Electric Efficiency 53%
Equipment Cost ($/kW) 6000
Resulting Baseline Fuel Cell System
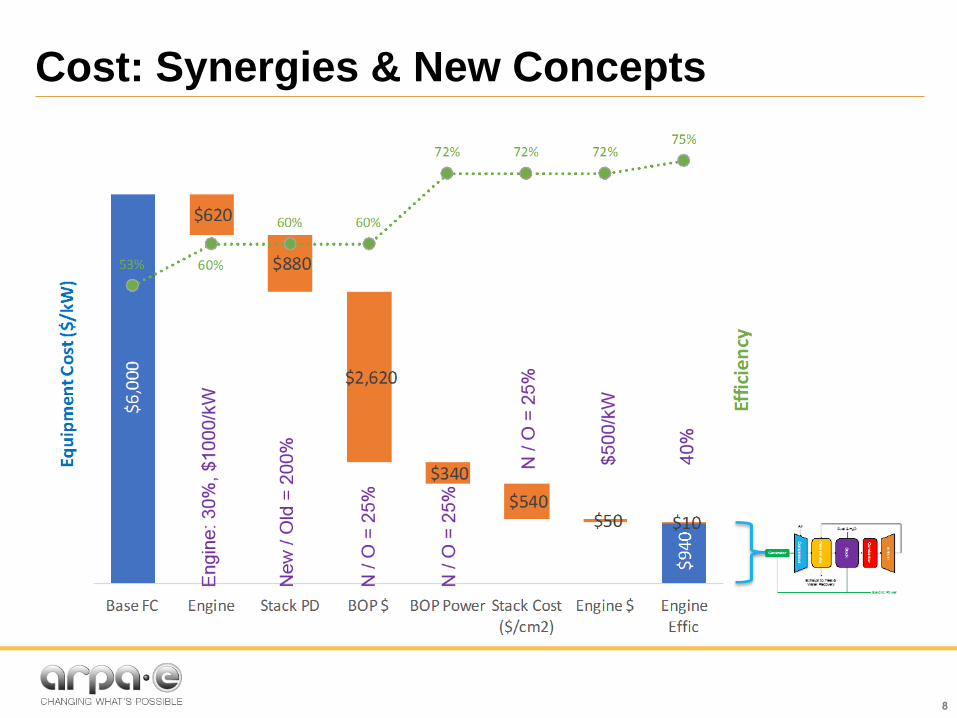
Cost: Synergies & New Concepts
8
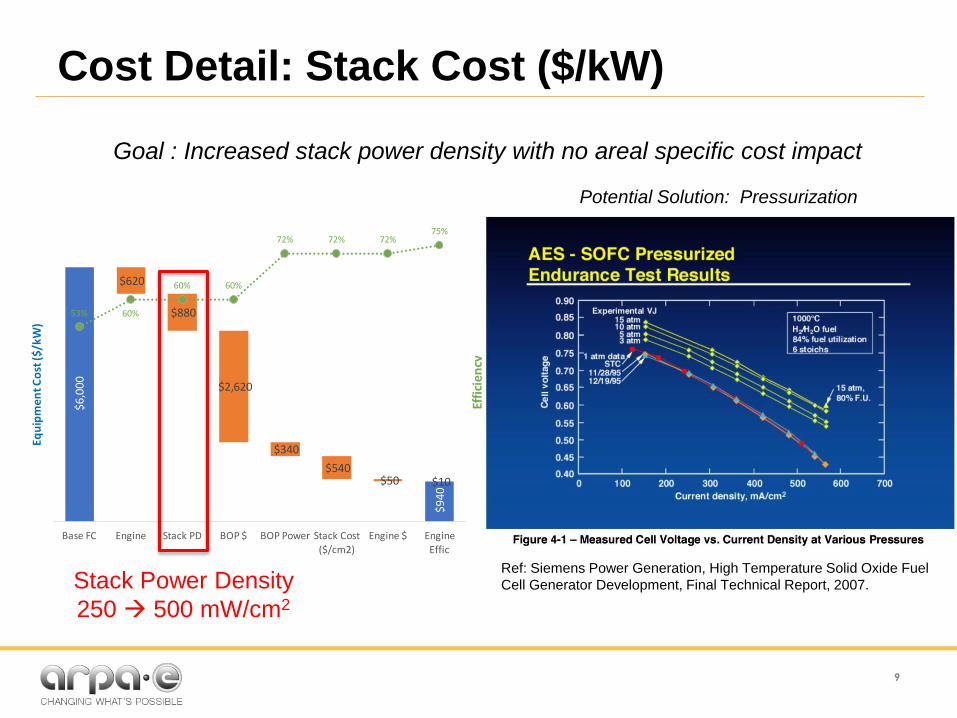
Cost Detail: Stack Cost ($/kW)
9
$6,000
$940
$620
$880
$2,620
$340
$540$50 $10
53% 60%
60% 60%
72% 72% 72%75%
0
0.1
0.2
0.3
0.4
0.5
0.6
0.7
0.8
$0
$1,000
$2,000
$3,000
$4,000
$5,000
$6,000
$7,000
BaseFC Engine StackPD BOP$ BOPPower StackCost
($/cm2)
Engine$ Engine
Effic
Efficien
cy
EquipmentCost($/kW)
Goal : Increased stack power density with no areal specific cost impact
Stack Power Density
250 500 mW/cm2
Ref: Siemens Power Generation, High Temperature Solid Oxide Fuel
Cell Generator Development, Final Technical Report, 2007.
Potential Solution: Pressurization
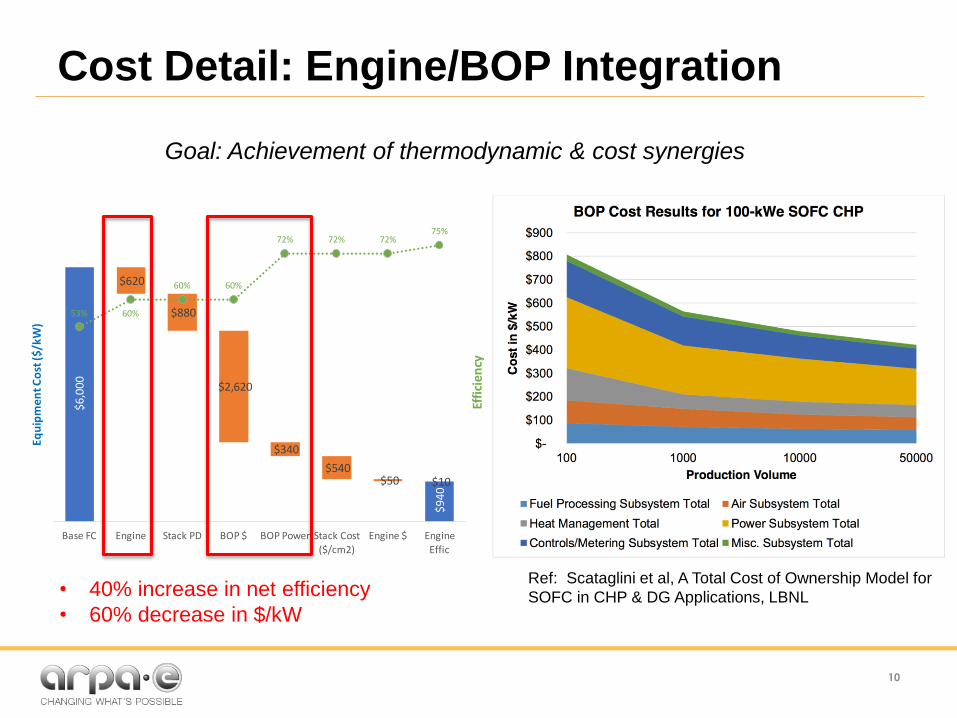
Cost Detail: Engine/BOP Integration
10
$6,000
$940
$620
$880
$2,620
$340
$540$50 $10
53% 60%
60% 60%
72% 72% 72%75%
0
0.1
0.2
0.3
0.4
0.5
0.6
0.7
0.8
$0
$1,000
$2,000
$3,000
$4,000
$5,000
$6,000
$7,000
BaseFC Engine StackPD BOP$ BOPPower StackCost
($/cm2)
Engine$ Engine
Effic
Efficien
cy
EquipmentCost($/kW)
Goal: Achievement of thermodynamic & cost synergies
• 40% increase in net efficiency
• 60% decrease in $/kW
Ref: Scataglini et al, A Total Cost of Ownership Model for
SOFC in CHP & DG Applications, LBNL
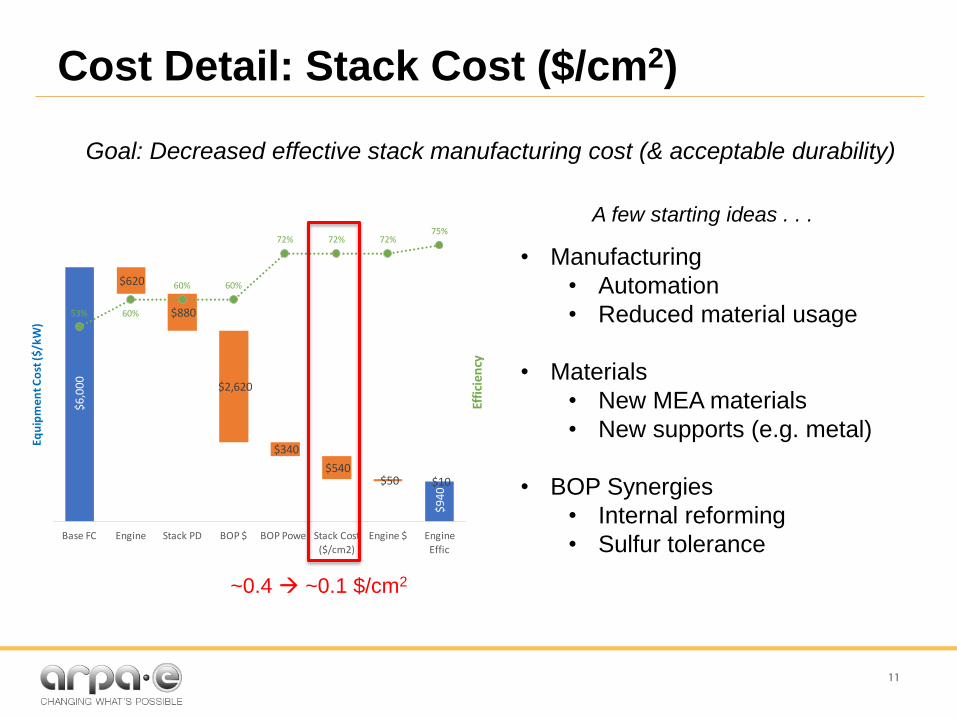
Cost Detail: Stack Cost ($/cm2)
11
$6,000
$940
$620
$880
$2,620
$340
$540$50 $10
53% 60%
60% 60%
72% 72% 72%75%
0
0.1
0.2
0.3
0.4
0.5
0.6
0.7
0.8
$0
$1,000
$2,000
$3,000
$4,000
$5,000
$6,000
$7,000
BaseFC Engine StackPD BOP$ BOPPower StackCost
($/cm2)
Engine$ Engine
Effic
Efficien
cy
EquipmentCost($/kW)
Goal: Decreased effective stack manufacturing cost (& acceptable durability)
~0.4 ~0.1 $/cm2
• Manufacturing
• Automation
• Reduced material usage
• Materials
• New MEA materials
• New supports (e.g. metal)
• BOP Synergies
• Internal reforming
• Sulfur tolerance
A few starting ideas . . .
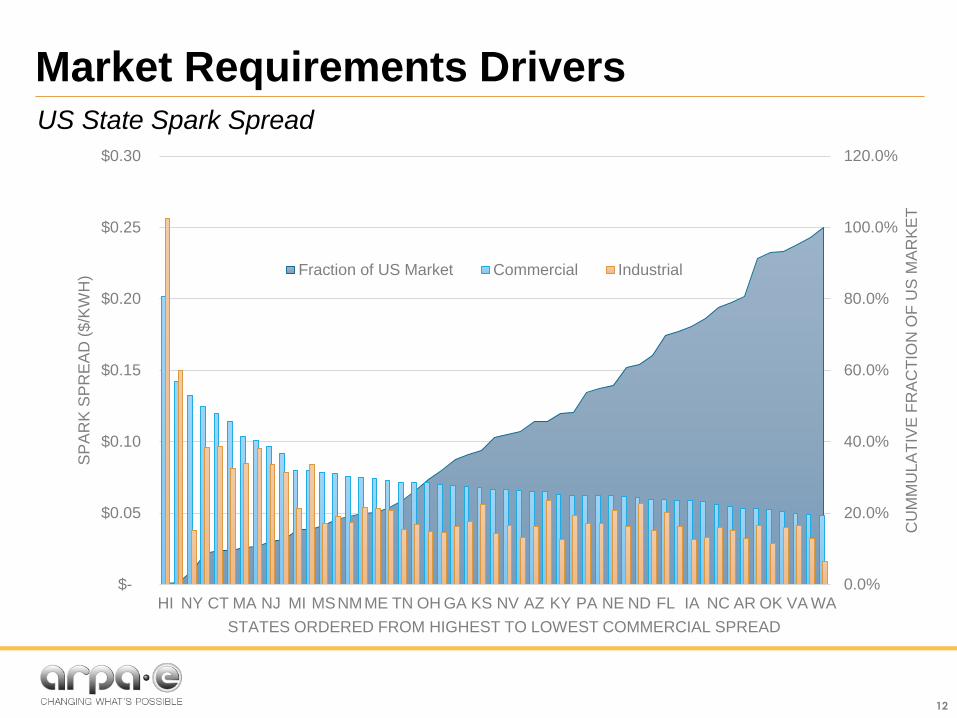
Market Requirements DriversUS State Spark Spread
12
0.0%
20.0%
40.0%
60.0%
80.0%
100.0%
120.0%
$-
$0.05
$0.10
$0.15
$0.20
$0.25
$0.30
HI NY CT MA NJ MI MSNMME TN OH GA KS NV AZ KY PA NE ND FL IA NC AR OK VA WA
CU
MM
ULA
TIV
E F
RA
CT
ION
OF
US
MA
RK
ET
SP
AR
K S
PR
EA
D (
$/K
WH
)
STATES ORDERED FROM HIGHEST TO LOWEST COMMERCIAL SPREAD
Fraction of US Market Commercial Industrial
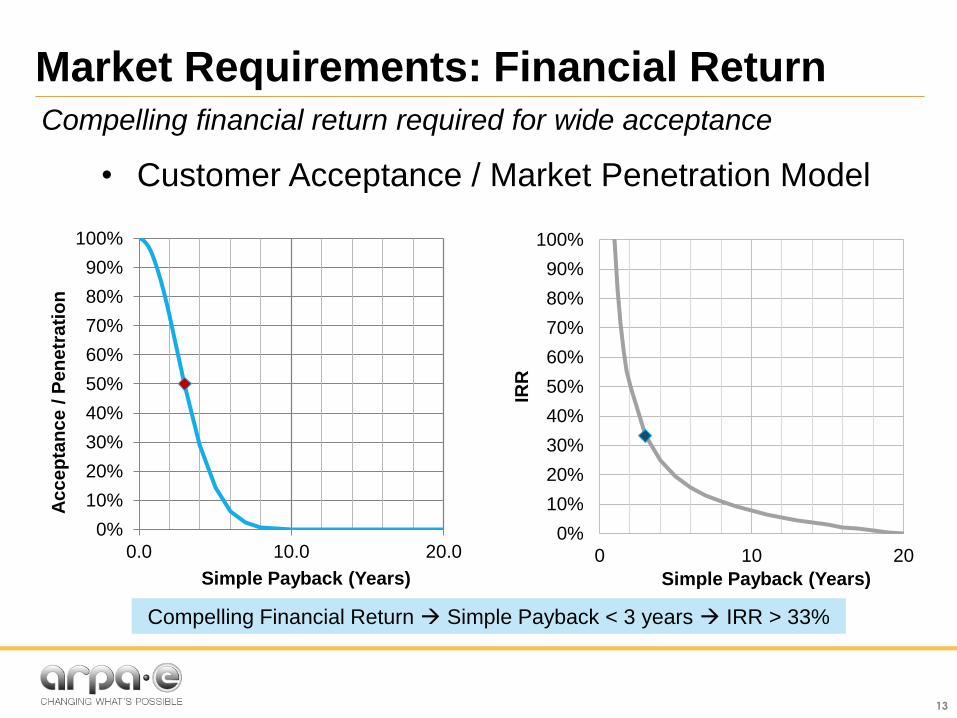
Market Requirements: Financial Return
13
• Customer Acceptance / Market Penetration Model
Compelling financial return required for wide acceptance
0%
10%
20%
30%
40%
50%
60%
70%
80%
90%
100%
0.0 10.0 20.0
Ac
ce
pta
nc
e /
Pe
ne
tra
tio
n
Simple Payback (Years)
0%
10%
20%
30%
40%
50%
60%
70%
80%
90%
100%
0 10 20
IRR
Simple Payback (Years)
Compelling Financial Return Simple Payback < 3 years IRR > 33%
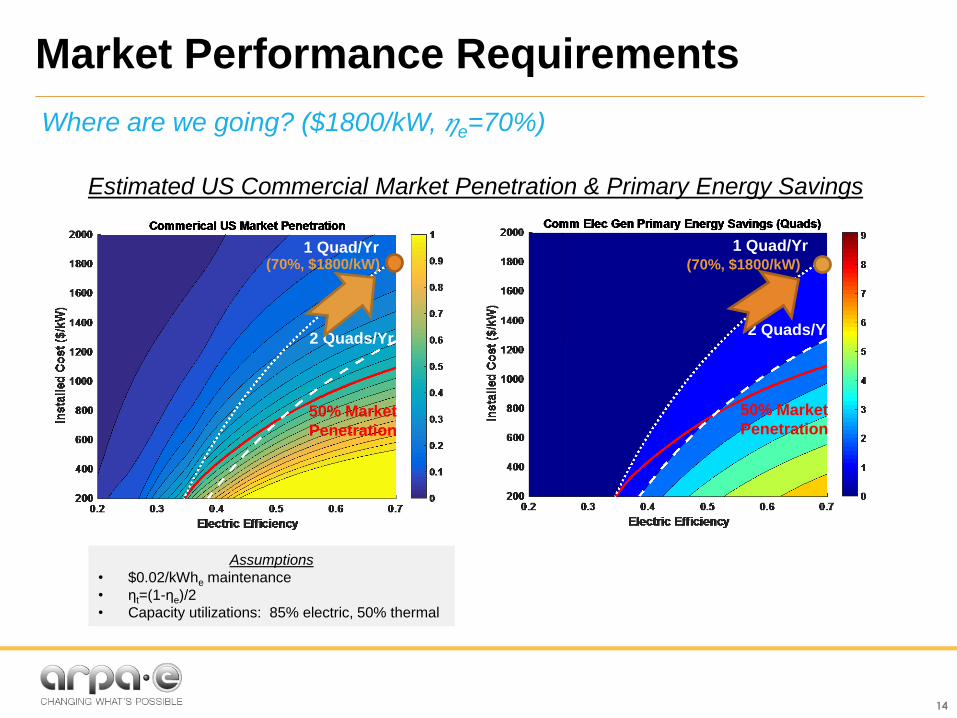
Market Performance Requirements
Where are we going? ($1800/kW, 𝜂e=70%)
14
50% Market
Penetration
Assumptions
• $0.02/kWhe maintenance
• ηt=(1-ηe)/2
• Capacity utilizations: 85% electric, 50% thermal
Estimated US Commercial Market Penetration & Primary Energy Savings
50% Market
Penetration
2 Quads/Yr2 Quads/Yr
1 Quad/Yr 1 Quad/Yr(70%, $1800/kW) (70%, $1800/kW)
Program Concept Synopsis
15
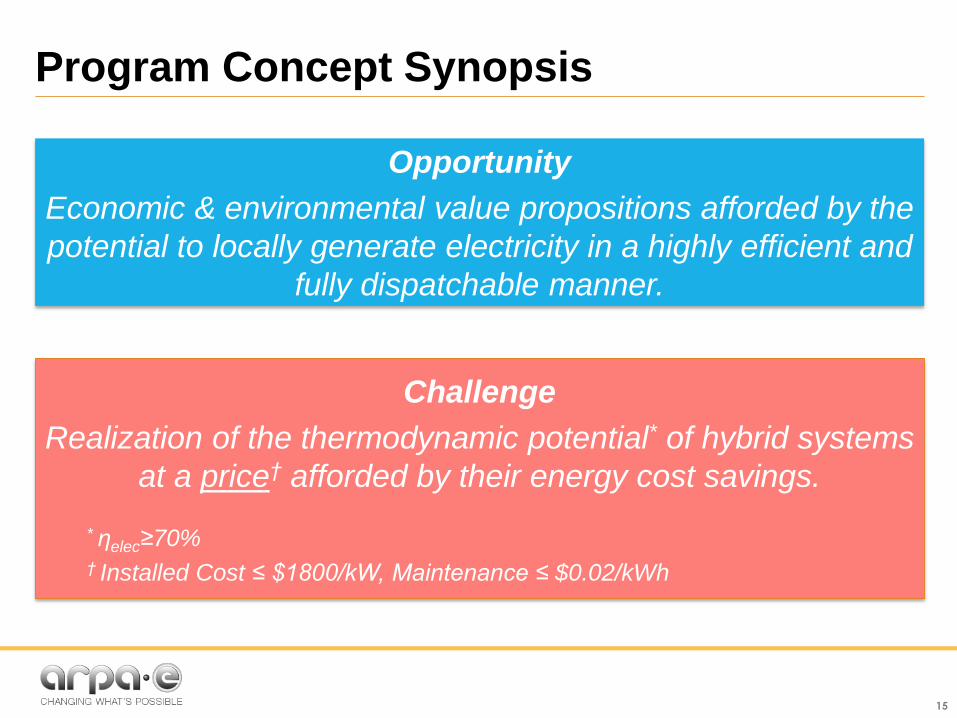
Opportunity
Economic & environmental value propositions afforded by the
potential to locally generate electricity in a highly efficient and
fully dispatchable manner.
Challenge
Realization of the thermodynamic potential* of hybrid systems
at a price† afforded by their energy cost savings.
* ηelec≥70%† Installed Cost ≤ $1800/kW, Maintenance ≤ $0.02/kWh
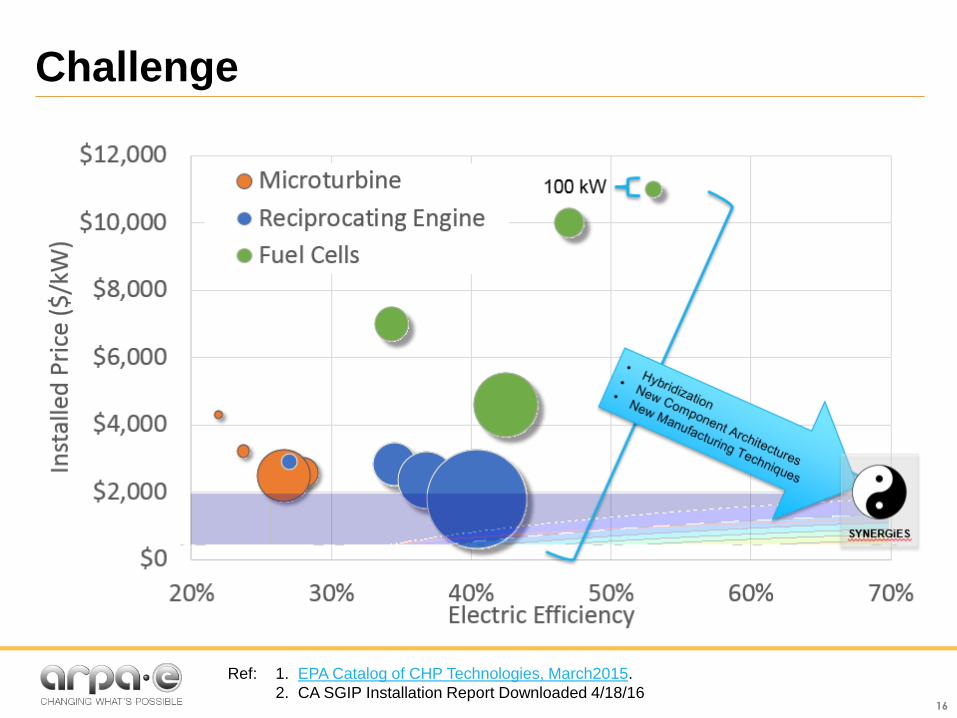
Challenge
16
Ref: 1. EPA Catalog of CHP Technologies, March2015.
2. CA SGIP Installation Report Downloaded 4/18/16
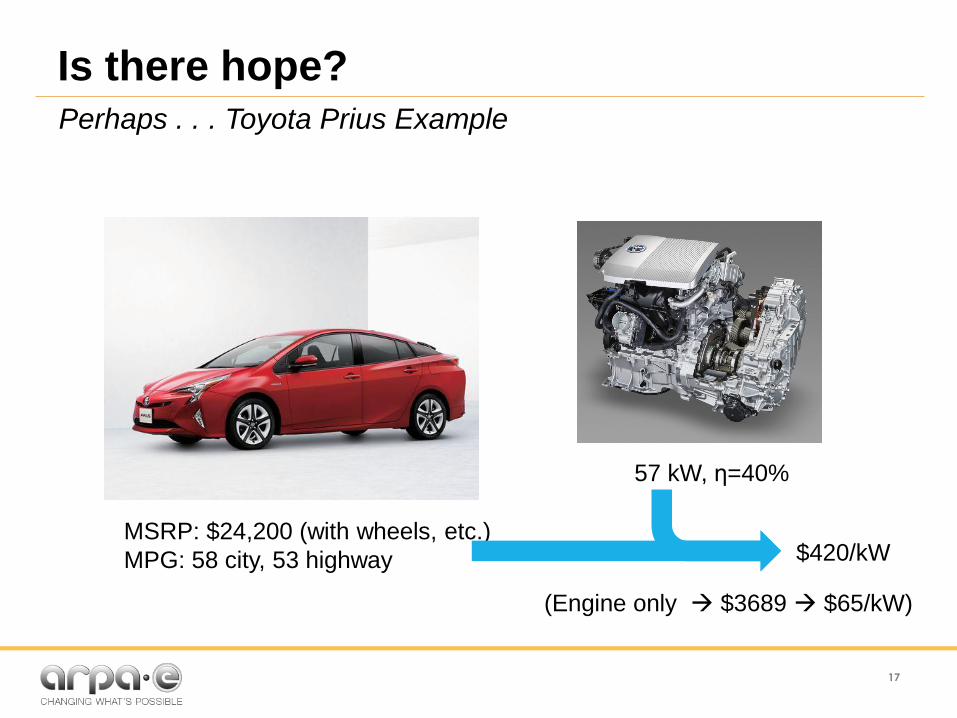
Is there hope?
17
MSRP: $24,200 (with wheels, etc.)
MPG: 58 city, 53 highway
57 kW, η=40%
$420/kW
(Engine only $3689 $65/kW)
Perhaps . . . Toyota Prius Example
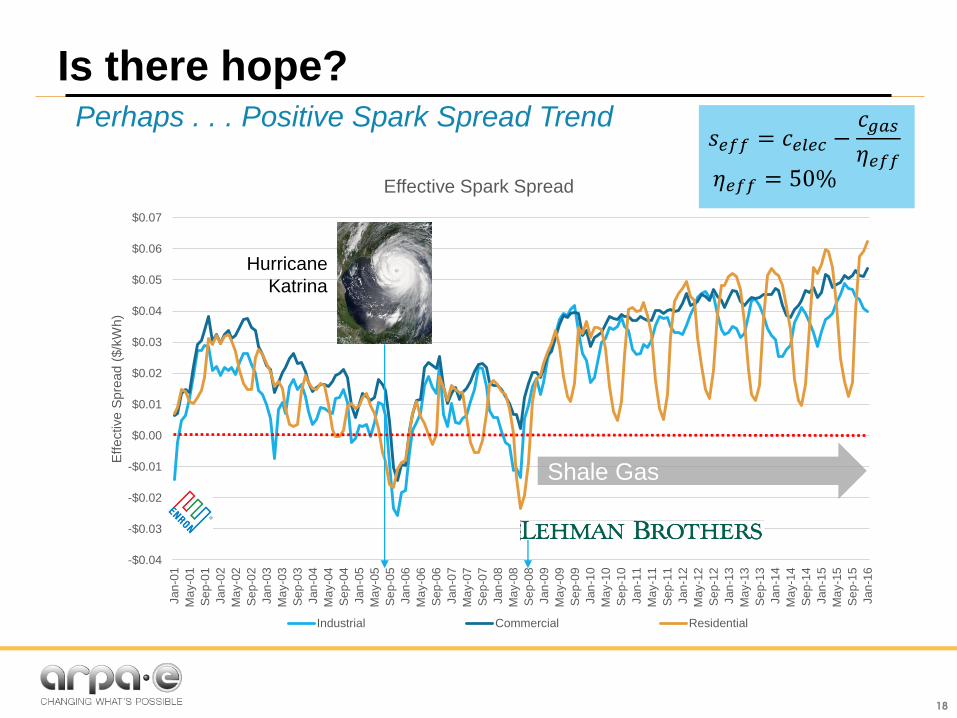
Is there hope?
18
Perhaps . . . Positive Spark Spread Trend
-$0.04
-$0.03
-$0.02
-$0.01
$0.00
$0.01
$0.02
$0.03
$0.04
$0.05
$0.06
$0.07
Jan
-01
Ma
y-0
1
Se
p-0
1
Jan
-02
Ma
y-0
2
Se
p-0
2
Jan
-03
Ma
y-0
3
Se
p-0
3
Jan
-04
Ma
y-0
4
Se
p-0
4
Jan
-05
Ma
y-0
5
Se
p-0
5
Jan
-06
Ma
y-0
6
Se
p-0
6
Jan
-07
Ma
y-0
7
Se
p-0
7
Jan
-08
Ma
y-0
8
Se
p-0
8
Jan
-09
Ma
y-0
9
Se
p-0
9
Jan
-10
Ma
y-1
0
Se
p-1
0
Jan
-11
Ma
y-1
1
Se
p-1
1
Jan
-12
Ma
y-1
2
Se
p-1
2
Jan
-13
Ma
y-1
3
Se
p-1
3
Jan
-14
Ma
y-1
4
Se
p-1
4
Jan
-15
Ma
y-1
5
Se
p-1
5
Jan
-16
Eff
ective S
pre
ad (
$/k
Wh)
Effective Spark Spread
Industrial Commercial Residential
𝑠𝑒𝑓𝑓 = 𝑐𝑒𝑙𝑒𝑐 −𝑐𝑔𝑎𝑠
𝜂𝑒𝑓𝑓𝜂𝑒𝑓𝑓 = 50%
Hurricane
Katrina
Shale Gas
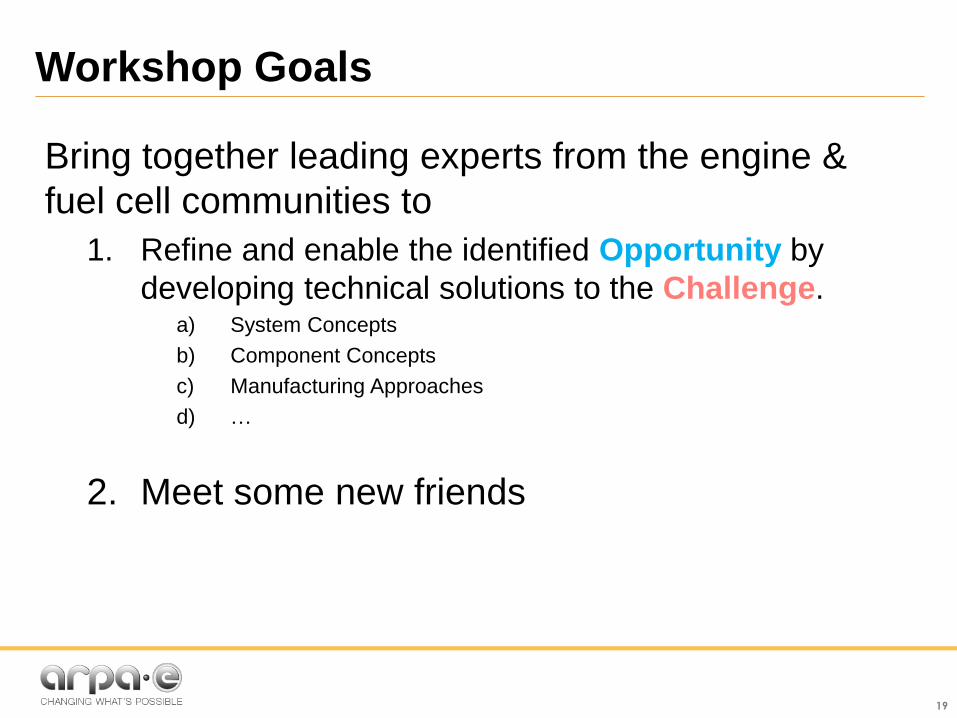
Workshop Goals
19
Bring together leading experts from the engine &
fuel cell communities to
1. Refine and enable the identified Opportunity by
developing technical solutions to the Challenge.a) System Concepts
b) Component Concepts
c) Manufacturing Approaches
d) …
2. Meet some new friends
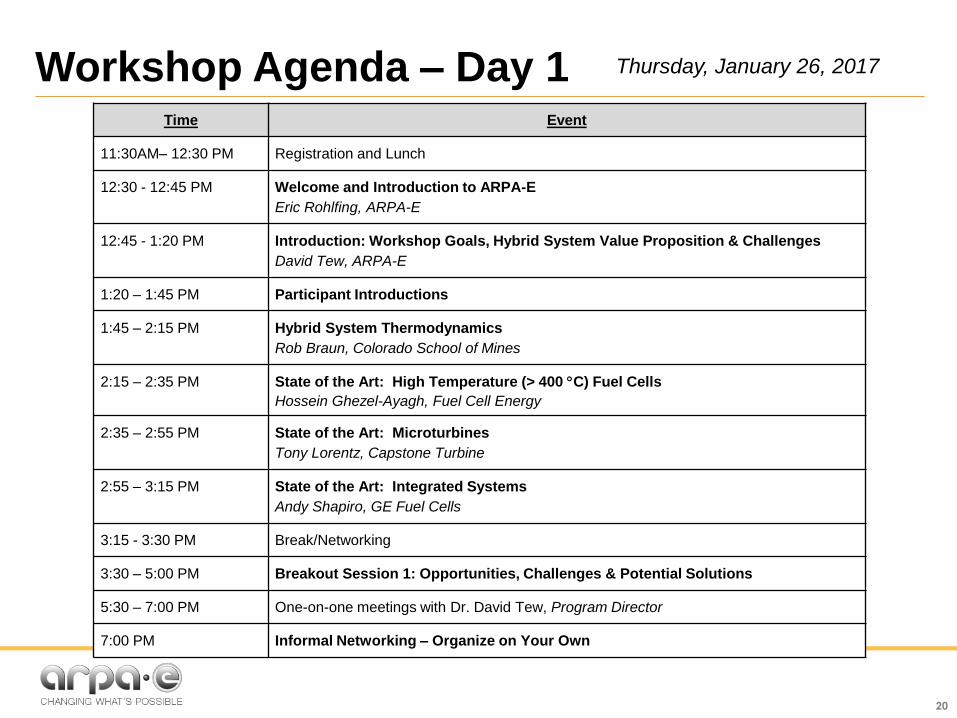
Workshop Agenda – Day 1
20
Time Event
11:30AM– 12:30 PM Registration and Lunch
12:30 - 12:45 PM Welcome and Introduction to ARPA-E
Eric Rohlfing, ARPA-E
12:45 - 1:20 PM Introduction: Workshop Goals, Hybrid System Value Proposition & Challenges
David Tew, ARPA-E
1:20 – 1:45 PM Participant Introductions
1:45 – 2:15 PM Hybrid System Thermodynamics
Rob Braun, Colorado School of Mines
2:15 – 2:35 PM State of the Art: High Temperature (> 400 C) Fuel Cells
Hossein Ghezel-Ayagh, Fuel Cell Energy
2:35 – 2:55 PM State of the Art: Microturbines
Tony Lorentz, Capstone Turbine
2:55 – 3:15 PM State of the Art: Integrated Systems
Andy Shapiro, GE Fuel Cells
3:15 - 3:30 PM Break/Networking
3:30 – 5:00 PM Breakout Session 1: Opportunities, Challenges & Potential Solutions
5:30 – 7:00 PM One-on-one meetings with Dr. David Tew, Program Director
7:00 PM Informal Networking – Organize on Your Own
Thursday, January 26, 2017
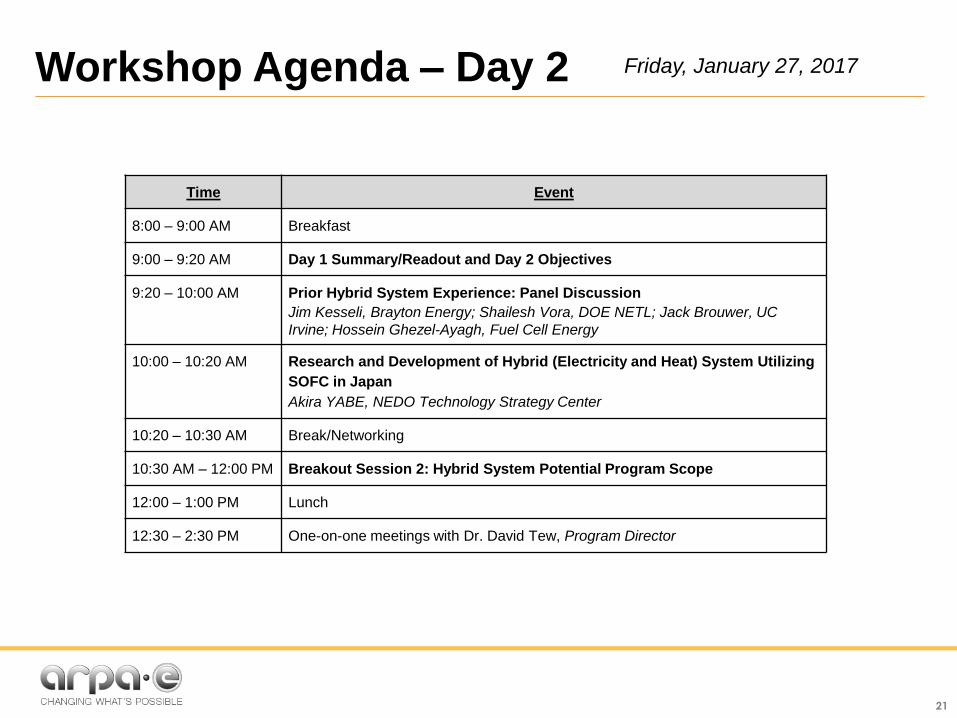
Workshop Agenda – Day 2
21
Time Event
8:00 – 9:00 AM Breakfast
9:00 – 9:20 AM Day 1 Summary/Readout and Day 2 Objectives
9:20 – 10:00 AM Prior Hybrid System Experience: Panel Discussion
Jim Kesseli, Brayton Energy; Shailesh Vora, DOE NETL; Jack Brouwer, UC
Irvine; Hossein Ghezel-Ayagh, Fuel Cell Energy
10:00 – 10:20 AM Research and Development of Hybrid (Electricity and Heat) System Utilizing
SOFC in Japan
Akira YABE, NEDO Technology Strategy Center
10:20 – 10:30 AM Break/Networking
10:30 AM – 12:00 PM Breakout Session 2: Hybrid System Potential Program Scope
12:00 – 1:00 PM Lunch
12:30 – 2:30 PM One-on-one meetings with Dr. David Tew, Program Director
Friday, January 27, 2017

BACKUP
22
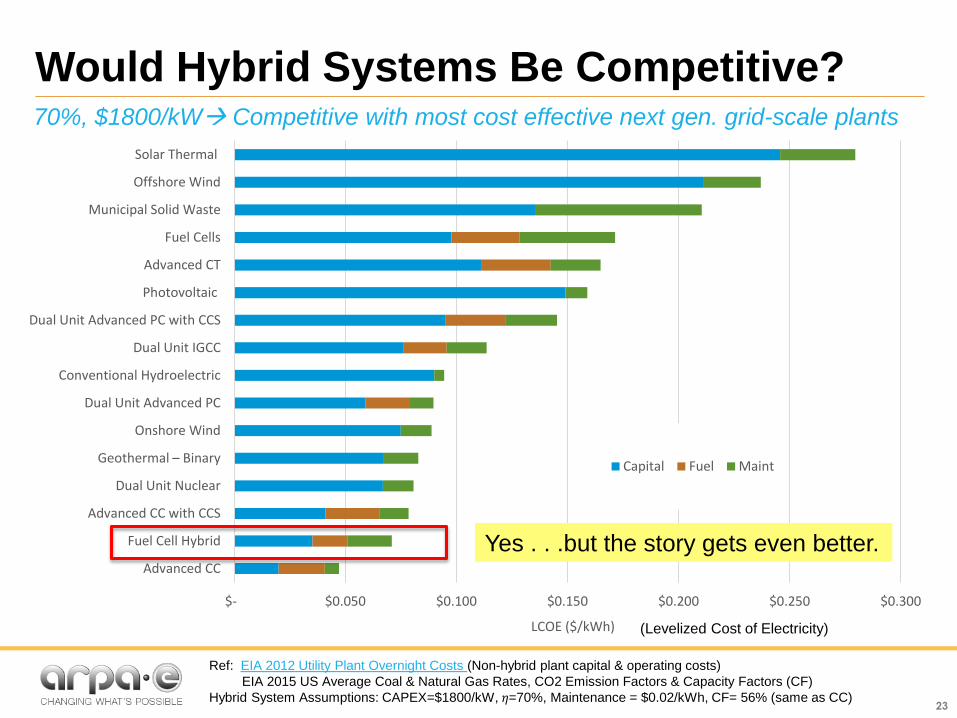
Would Hybrid Systems Be Competitive?
23
Ref: EIA 2012 Utility Plant Overnight Costs (Non-hybrid plant capital & operating costs)
EIA 2015 US Average Coal & Natural Gas Rates, CO2 Emission Factors & Capacity Factors (CF)
Hybrid System Assumptions: CAPEX=$1800/kW, 𝜂=70%, Maintenance = $0.02/kWh, CF= 56% (same as CC)
$- $0.050 $0.100 $0.150 $0.200 $0.250 $0.300
Advanced CC
Fuel Cell Hybrid
Advanced CC with CCS
Dual Unit Nuclear
Geothermal – Binary
Onshore Wind
Dual Unit Advanced PC
Conventional Hydroelectric
Dual Unit IGCC
Dual Unit Advanced PC with CCS
Photovoltaic
Advanced CT
Fuel Cells
Municipal Solid Waste
Offshore Wind
Solar Thermal
LCOE ($/kWh)
Capital Fuel Maint
70%, $1800/kW Competitive with most cost effective next gen. grid-scale plants
(Levelized Cost of Electricity)
Yes . . .but the story gets even better.
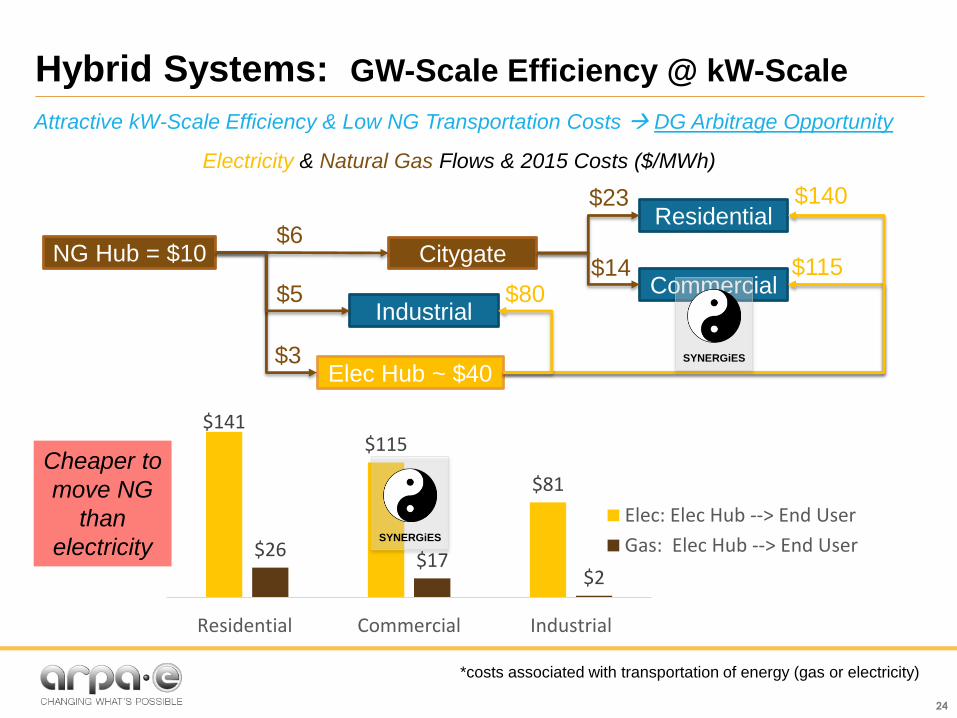
Hybrid Systems: GW-Scale Efficiency @ kW-Scale
24
Electricity & Natural Gas Flows & 2015 Costs ($/MWh)
Residential
CommercialIndustrial
NG Hub = $10 Citygate
Elec Hub ~ $40
$6
$3
$5
$23
$14
$140
$115$80
$141$115
$81
$26$17
$2
Residential Commercial Industrial
Elec: Elec Hub --> End User
Gas: Elec Hub --> End User
Cheaper to
move NG
than
electricity
*costs associated with transportation of energy (gas or electricity)
Attractive kW-Scale Efficiency & Low NG Transportation Costs DG Arbitrage Opportunity
SYNERGiES
SYNERGiES
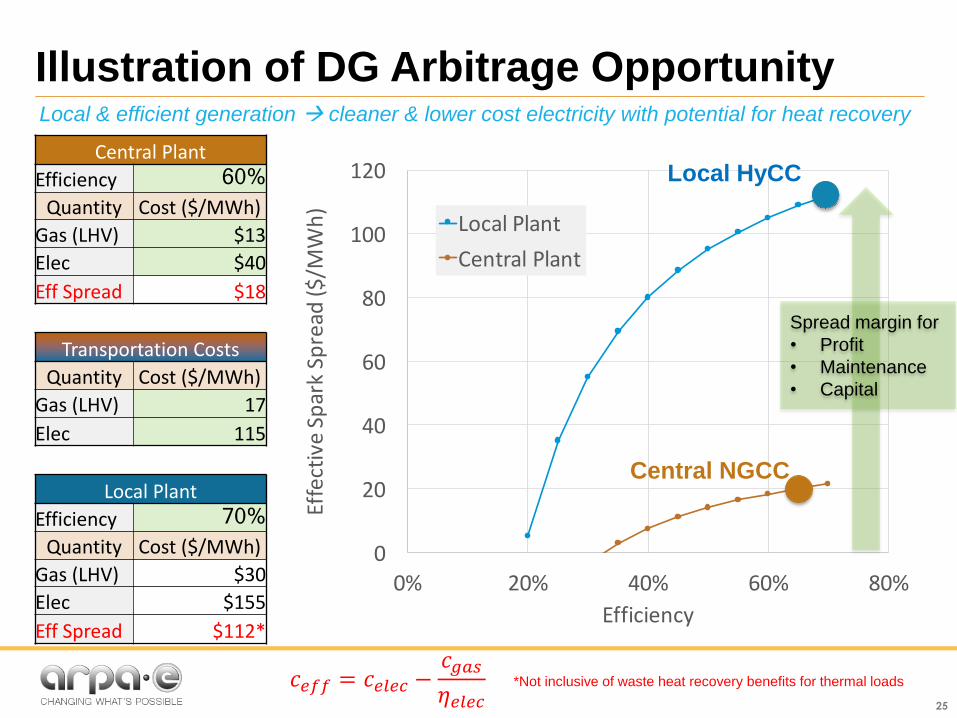
Illustration of DG Arbitrage Opportunity
25
0
20
40
60
80
100
120
0% 20% 40% 60% 80%
EffectiveSparkSpread($/M
Wh)
Efficiency
LocalPlant
CentralPlant
Spread margin for
• Profit
• Maintenance
• Capital
Central Plant
Efficiency 60%Quantity Cost ($/MWh)
Gas (LHV) $13
Elec $40
Eff Spread $18
Transportation Costs
Quantity Cost ($/MWh)
Gas (LHV) 17
Elec 115
Local Plant
Efficiency 70%Quantity Cost ($/MWh)
Gas (LHV) $30
Elec $155
Eff Spread $112*
Local & efficient generation cleaner & lower cost electricity with potential for heat recovery
*Not inclusive of waste heat recovery benefits for thermal loads
Central NGCC
Local HyCC
𝑐𝑒𝑓𝑓 = 𝑐𝑒𝑙𝑒𝑐 −𝑐𝑔𝑎𝑠
𝜂𝑒𝑙𝑒𝑐
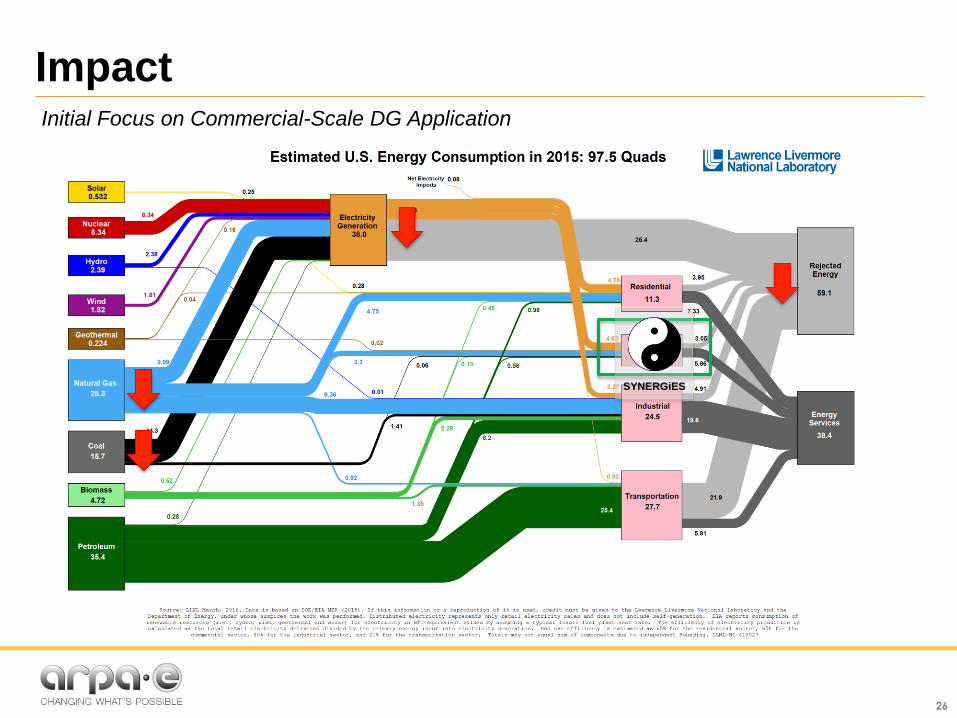
Impact
26
Initial Focus on Commercial-Scale DG Application
SYNERGiES
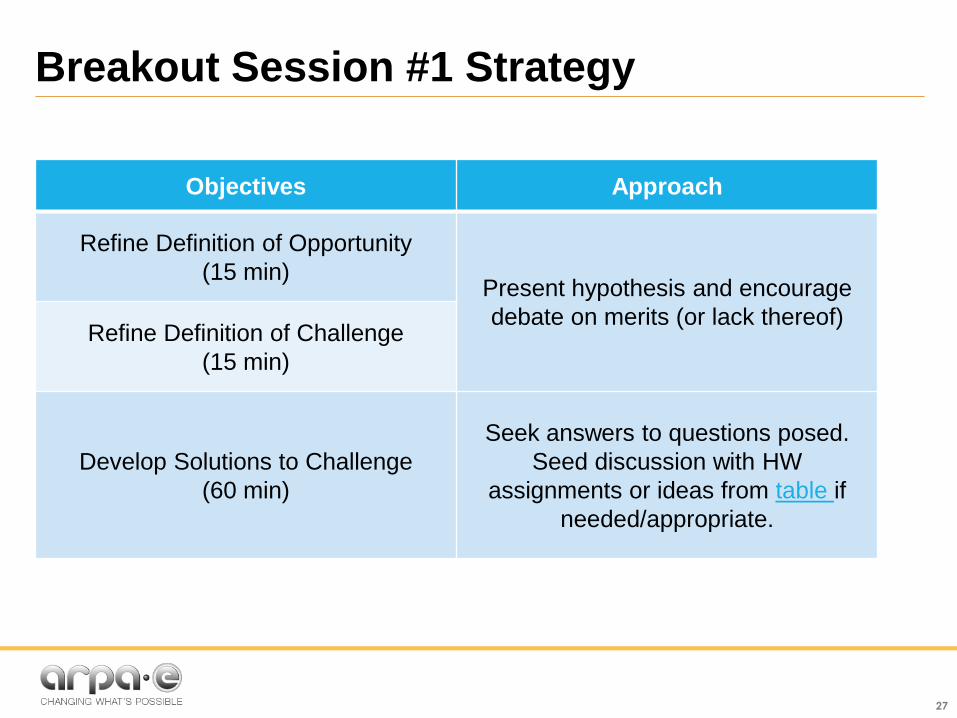
Breakout Session #1 Strategy
27
Objectives Approach
Refine Definition of Opportunity
(15 min)Present hypothesis and encourage
debate on merits (or lack thereof)Refine Definition of Challenge
(15 min)
Develop Solutions to Challenge
(60 min)
Seek answers to questions posed.
Seed discussion with HW
assignments or ideas from table if
needed/appropriate.
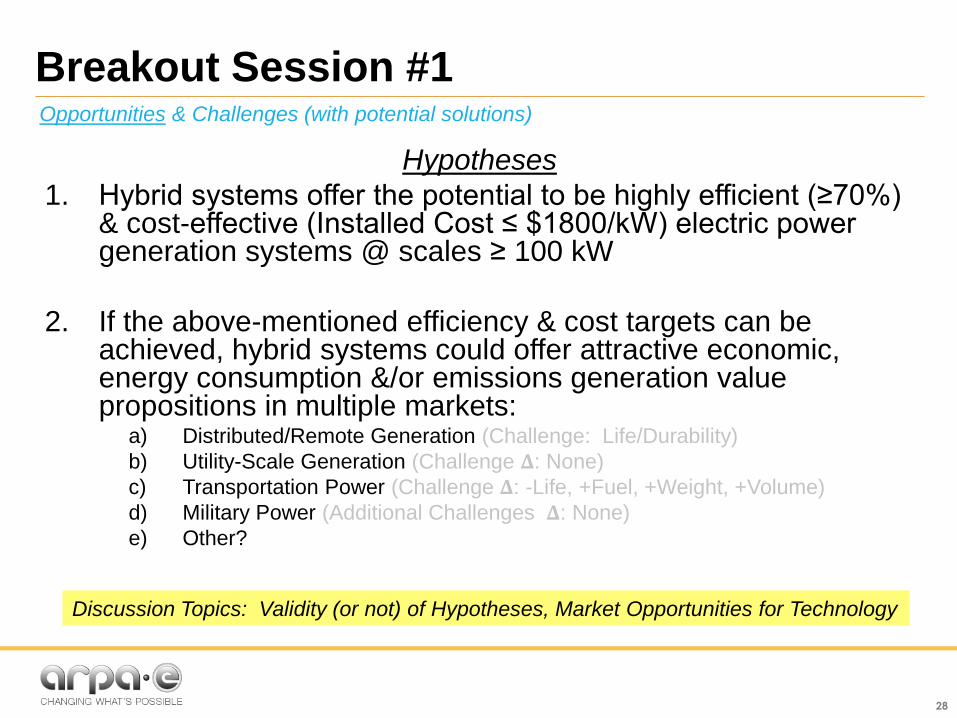
Breakout Session #1
28
Hypotheses
1. Hybrid systems offer the potential to be highly efficient (≥70%) & cost-effective (Installed Cost ≤ $1800/kW) electric power generation systems @ scales ≥ 100 kW
2. If the above-mentioned efficiency & cost targets can be achieved, hybrid systems could offer attractive economic, energy consumption &/or emissions generation value propositions in multiple markets:
a) Distributed/Remote Generation (Challenge: Life/Durability)
b) Utility-Scale Generation (Challenge 𝚫: None)
c) Transportation Power (Challenge 𝚫: -Life, +Fuel, +Weight, +Volume)
d) Military Power (Additional Challenges 𝚫: None)
e) Other?
Opportunities & Challenges (with potential solutions)
Discussion Topics: Validity (or not) of Hypotheses, Market Opportunities for Technology
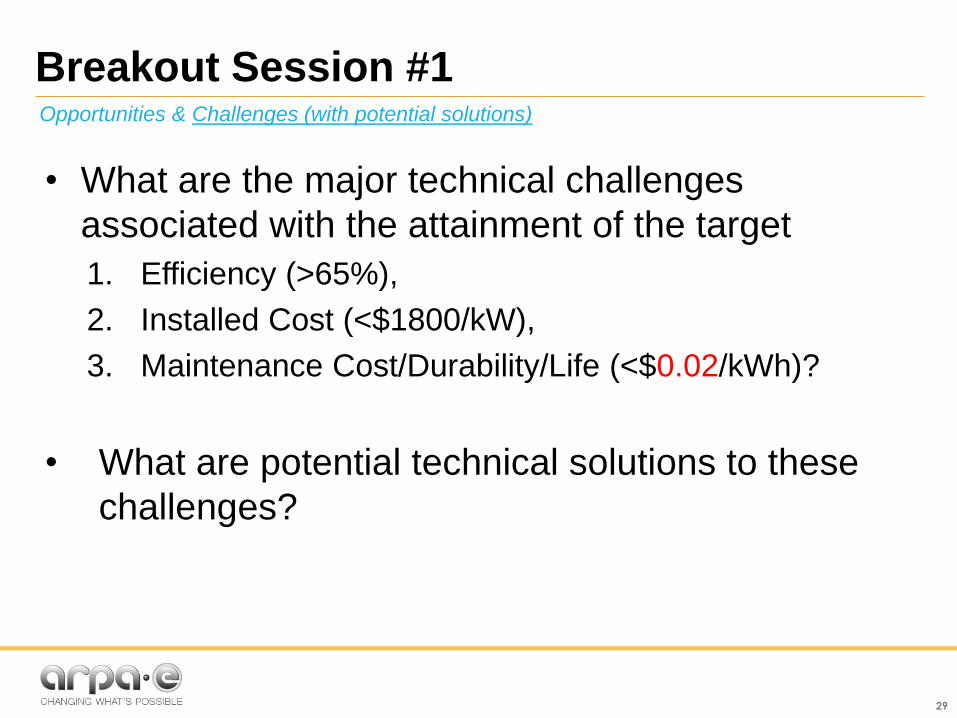
Breakout Session #1
29
Opportunities & Challenges (with potential solutions)
• What are the major technical challenges
associated with the attainment of the target
1. Efficiency (>65%),
2. Installed Cost (<$1800/kW),
3. Maintenance Cost/Durability/Life (<$0.02/kWh)?
• What are potential technical solutions to these
challenges?
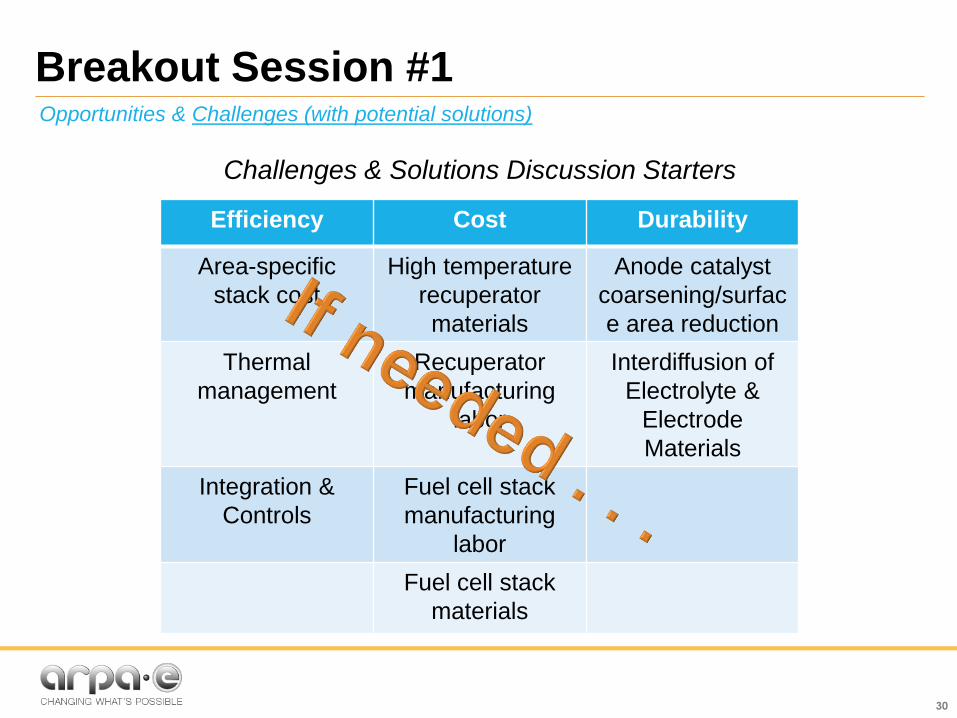
Breakout Session #1
30
Opportunities & Challenges (with potential solutions)
Challenges & Solutions Discussion Starters
Efficiency Cost Durability
Area-specific
stack cost
High temperature
recuperator
materials
Anode catalyst
coarsening/surfac
e area reduction
Thermal
management
Recuperator
manufacturing
labor
Interdiffusion of
Electrolyte &
Electrode
Materials
Integration &
Controls
Fuel cell stack
manufacturing
labor
Fuel cell stack
materials
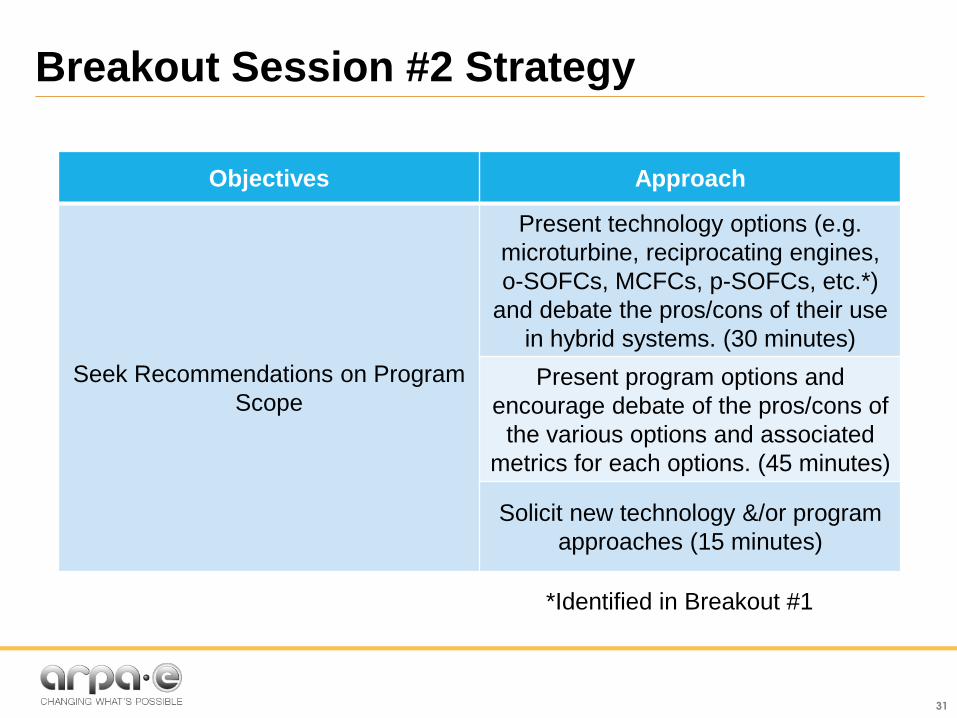
Breakout Session #2 Strategy
31
Objectives Approach
Seek Recommendations on Program
Scope
Present technology options (e.g.
microturbine, reciprocating engines,
o-SOFCs, MCFCs, p-SOFCs, etc.*)
and debate the pros/cons of their use
in hybrid systems. (30 minutes)
Present program options and
encourage debate of the pros/cons of
the various options and associated
metrics for each options. (45 minutes)
Solicit new technology &/or program
approaches (15 minutes)
*Identified in Breakout #1
Market Approach
32
• What are the pros/cons of the proposed
“Market Approach”?
– Are there ”easier” first markets than DG?
– What are the major barriers to a “successful”
(Market Penetration > 25%) commercial DG
product?
– If a 70% electric efficiency can be achieved, is
heat recovery likely to be worth the additional
capital investment?
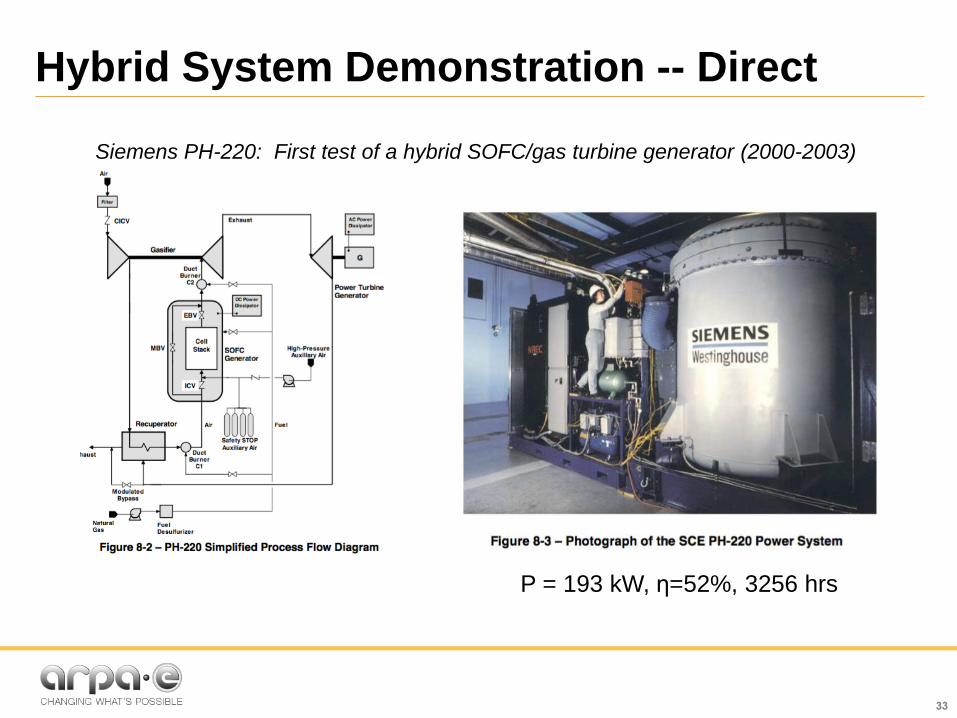
Hybrid System Demonstration -- Direct
33
P = 193 kW, η=52%, 3256 hrs
Siemens PH-220: First test of a hybrid SOFC/gas turbine generator (2000-2003)