From the Greece partner - “Statistical data on Immigrants in GREECE”
80
STATISTICAL DATA ON IMMIGRANTS IN GREECE: AN ANALYTIC STUDY OF AVAILABLE DATA AND RECOMMENDATIONS FOR CONFORMITY WITH EUROPEAN UNION STANDARDS A study conducted for ΙΜΕΠΟ [Migration Policy Institute], Greece by Mediterranean Migration Observatory UEHR, Panteion University Scientific Director: Research Assistant: Cartography: Martin Baldwin-Edwards Giannis Kyriakou, PhD Panagiota Kakalika and Giannis Katsios FINAL REPORT revised version, 15 November 2004
description
Transcript of From the Greece partner - “Statistical data on Immigrants in GREECE”
STATISTICAL DATA ON IMMIGRANTS IN GREECE:
AN ANALYTIC STUDY OF AVAILABLE DATA AND RECOMMENDATIONS FOR
CONFORMITY WITH EUROPEAN UNION STANDARDS
A study conducted for ΙΜΕΠΟ [Migration Policy Institute], Greece by
Mediterranean Migration Observatory UEHR, Panteion University
Scientific Director:
Research Assistant:
Cartography:
Martin Baldwin-Edwards
Giannis Kyriakou, PhD
Panagiota Kakalika and Giannis Katsios
FINAL REPORT
revised version, 15 November 2004
© 2004, Mediterranean Migration Observatory Mediterranean Migration Observatory University Research Institute for Urban Environment and Human Resources Panteion University Aristotelous 14 Kalithea Athens 176-71 Greece Tel: +30 210 924 9883 Email: [email protected] and [email protected] Website: http://www.mmo.gr
CONTENTS Acknowledgments Objectives and Methodology PART A An analytical study of statistical data on immigration into Greece, 1990-2004 Introduction Trends in Immigration into Greece Profile of immigrants in Greece: information from the 2001 Census Characteristics of the immigrant population from residence permit data, 2003-4 Immigrants in the Greek Labour Market Immigrant children in Greek state schools Inflows and outflows of non-EU nationals Glossary PART B Greek government datasets on immigration: Compliance with the draft EU Regulation on Community Statistics on International Migration, Citizenship, Residence Permits and Asylum
Ministry contacts and responses Conformity with the draft EU Regulation Recommendations for data collection, collation and compilation of migration statistics APPENDIX A Draft proposal, Version 19/05/04, for a Regulation of the European Parliament and of the Council,
on Community Statistics on International Migration, Citizenship, Residence Permits and Asylum Explanatory Notes APPENDIX B Response from the Ministry of Public Order APPENDIX C Electronic datasets, from the 2001 Census
i ii
1 3 5 8
13 18 20 23
24 31 35
i
Acknowledgments
We would like to thank the many people in various ministries and state agencies who
unstintingly gave up their time in assisting us with this project. In particular, we are
grateful to all of the personnel with whom we came into contact in the Ministry of
Interior, without whose considerable contribution this research would not have been
possible. We are also indebted to the staff of the Statistical Service of Greece for their
help in compiling data and assisting us in many other ways.
ii
OBJECTIVES OF THE STUDY
The purposes of this scientific study are basically twofold:
to prepare the first-ever authoritative analytical report on immigrants in Greece,
using all possible datasources;
to map Ministry and other statistical datasets relating to immigration and
immigrants, and to evaluate their potential compliance with the draft EU
Regulation on migration statistics.
The Report is in two sections, with Part A utilising older published data, as well as some
new government data supplied specifically for this project, in order to reach some
conclusions on the immigration phenomenon in Greece. Part B details what is known
about the government datasets, the quality and reliability of the data, and their apparent
compliance with the proposed EU Regulation. The latest draft version of the EU
Regulation on Migration Statistics is attached as Appendix A, and our correspondence
with the Ministry of Public Order is given in Appendix B. Additional detailed electronic
datasets derived from the 2001 Census and provided to us by the National Statistical
Service of Greece are included as Appendix C.
METHODOLOGY
The Mediterranean Migration Observatory was able to build upon five years of research
on immigration into Greece and other southern European countries*, and on this basis to
supplement pre-existing datasets with our specific requests to various state agencies for
new, previously unpublished data. These requests were made in detail, either in writing
* Available at http://www.mmo.gr

iii
or in personal contact and also through extended interviews, as appropriate. The state
agencies approached were:
o Ministry of Interior
o Ministry of Labour
o Ministry of Education
o Ministry of Public Order
o Ministry of Foreign Affairs
o National Statistical Service of Greece
o IKA Foundation
The results of these requests for data are detailed in Part B. In Part A, we merely use
the available data in order to provide as accurate a picture as possible of the patterns
and trends of immigration into Greece since 1990. In particular, the recently-constructed
database of the Ministry of Interior has been invaluable in providing new detailed
information on the immigration phenomenon. The 2001 Census is also a landmark in
such data, although has the usual limitations of any census. IKA data are also proving to
be useful, but still somewhat narrow in scope. Other sources have been used for
analytical purposes here, despite their doubtful reliability. Reservations on accuracy are
expressed, as appropriate, in Part A in order to qualify the reliability of our analysis.

1
PART A
AN ANALYTICAL STUDY OF STATISTICAL DATA ON
IMMIGRATION INTO GREECE, 1990-2004
Introduction Following the beginning of mass illegal immigration into Greece in the early 1990s,
largely as a result of disintegration of the former Communist bloc, Greece has struggled
not only with immigration policy but also with acquiring even approximate data on the
extent and type of immigration into the country.
After several years of mass illegal immigration, accompanied by mass (illegal)
deportations of mainly Albanians, Bulgarians and Romanians, Greece reluctantly initiated
in 1997 its first legalization programme for illegal immigrants. The 6-month White Card
was granted to almost all 372.000 applicants, and at that time yielded the only reliable
data on immigrants. Its successor programme, the 1-3 year Green Card, laid substantial
impediments in the way of applicants, and the number of applicants was only 228.000
with heavily delayed bureaucratic procedures.
The 2001 Census had a total of 762.000 registrants normally resident and without Greek
citizenship, but this figure supposedly included ethnic Greeks [homogeneis], EU
nationals, and children. A dataset compiled for us by the Statistical Service (see Part B,
below) should have revealed more information on the number of homogeneis without
Greek citizenship. According to the Census, there are only six persons with this status:
this conflicts with our understanding of the unknown but large number of persons
awarded the 3-year homogeneis card by the Ministry of Public Order. Unofficial sources
suggest that the number is 150-200.000 such cards awarded.
A new Immigration Law in 2001 was accompanied by another legalisation, which
attracted a total of 368.000 applications, although press reports claim that only 220.000
were eventually accepted. No data on numbers, characteristics of the applicants, or

2
anything at all were ever provided by OAED. Only IKA social insurance contributions –
some 328.000 active registrations in 2002 – provided any indication of immigrants’ role
in the economy and society.
Finally, in 2004, the Ministry of Interior database on residence permits became fully
operational. It is these unpublished data which constitute the most crucial new
information on immigrants in Greece. The results of our analysis of the dataset are
provided below, providing a much clearer picture of the situation than was available
previously. However, there remain some quite serious difficulties with this dataset, which
are discussed in Part B of this Report.
The confused situation regarding ethnic Greeks [palinostoundes or homogeneis]
'Ethnic Greeks' or those claiming Greek descent but without Greek citizenship through
ius sanguinis, are not defined or given rights within Greece under the Greek Constitution,
but are treated preferentially on the basis of political decisions. The Treaties of Lausanne
and of Ankara contain special procedures for the definition of citizenship: these relate
mainly to ‘ethnic minorities’ in Greece and elsewhere in the regions of the former
Ottoman Empire.
A joint Ministerial Decision (Defence and Interior) of 1990 allowed immigrants claiming
Greek descent to remain in Greece without documentation; Law 2130 of 1993 defined
the concept of ‘repatriated Greeks’ and established a rapid process for the granting of
Greek citizenship to claimants. This was supplemented by Law 2790 of 2000 and
Ministerial Decision 4864/8/8γ/2000 which gave special rights, support structures and
another distinct procedure for the rapid granting of Greek citizenship to ethnic Greeks
from the CIS. Ethnic Greeks from elsewhere, or those who fail to get citizenship, are
given special permits by the Ministry of Public Order and are not required to have normal
residence permits. These are defined for nationals of the CIS by the above legislation;
for Albanians (who are generally denied Greek citizenship) the relevant law is Ministerial
Decision 4000/3/10-λέ/2001. The number of both types of these special permits is
suppressed by the Ministry of Public Order for "reasons of national security".

3
The biggest problem with this racially discriminatory approach to the regulation of
immigrants is that the whole picture has been concealed and involves very large
numbers of immigrants. From 1990, immigrants claiming Greek ethnicity were allowed to
remain undocumented in Greece: they were, in effect, indistinguishable from illegal
immigrants. The award of citizenship to CIS nationals has been done surreptitiously, and
there are no proper data: however, it seems that some 150.000 persons have benefited
from it. Finally, the award of homogeneis cards since 2000 with twin statuses attached
to it, has been shrouded in secrecy since its inception. Nevertheless, a reliable source
assures us that the number awarded is currently around 200.000. Thus, from tolerated
illegality in the 1990s, it seems that some 350.000 ethnic Greek immigrants have either
been given Greek citizenship or awarded 3-year homogeneis cards. It is impossible,
without detailed annual data, to distinguish between this transformation of
undocumented ethnic Greek aliens to legal residents and the presence in Greece of non-
Greek undocumented immigrants.
Trends in Immigration into Greece Up until this Report, there has been no attempt to present a quantified picture of
immigration trends into Greece. This deficit has been caused by three distinct problems:
the great extent of illegal (and therefore unmeasurable) immigration; the extreme chaos
surrounding the three legalisation programmes, and a lack of reliable data relating to
these; the holding of discrete datasets by separate Ministries with little or no
communication between them, and in particular, the problem with homogeneis. Figure 1
is the first attempt to show immigration trends into Greece. The diagram has been
constructed with extreme difficulty, using all available published data, plus unpublished
data garnered for this project. As the importance of Figure 1 is high, a detailed
explanation of the methodology of its construction is given here, as Endnote 1.1
As can be seen from Figure 1, the rate of increase of immigration into Greece since 1988
has been phenomenal, multiplying the stock of immigrants fivefold. From 1991 to 1997,
the number of residence permits awarded by the Ministry of Public Order actually
declined in the face of mass immigration. The legalisation programmes (1997, 2001)

FIGURE 1: Evolution of legal and undocumented non-EU immigrant stock [including homogeneis] in Greece, 1988-2004
0
200,000
400,000
600,000
800,000
1,000,000
1,200,000
1988 1991 1992 1993 1994 1995 1996 1997 1998 1999 2000 2001 2002 2003 2004*
schoolchildren [datapoints 1996, 2000, 2003;otherwise interpolated]Ministry of Public Order "homogeneis cards"[estimate]undocumented, tolerated "homogeneis" (until2001) or with permit applicationwith residence permit or (1998, 2001)registration for legalisationCensus
4
made an impact on the illegality of migrants, but of a transitory nature and leaving a
large minority in illegal status.
The 1991 Census significantly under-recorded immigrant residents, finding only EU
residents and those with legal status. The 2001 Census, however, made an explicit
attempt to capture a record of all immigrants – legal or undocumented – and according
to Figure 1 had success in so doing, with fewer than 100.000 people not participating.
However, if we add the estimated number of homogeneis who were recorded as Greek
nationals, Figure 1 is significantly changed. On the one hand, homogeneis are invisible in
the Census data, and on the other hand are indistinguishable from illegal immigrants in
other data. If we add to this, the problem of delayed residence permit procedures and
the non-appearance of legal immigrants in the permit data, there is only one conclusion
possible. We cannot estimate other than crudely how many illegal or even legal
immigrants are present in Greece, or what the total of immigrants might be.
Finally, Figure 1 shows how significant immigrant children are, not only in Greek schools,
but also as a component of immigration flows. This is the result of three coinciding
factors: the primacy of Albanian immigration into Greece, the larger family size and
relative youth of Albanian married couples, and the increased grants of family
reunification to immigrants. Thus, foreign schoolchildren constitute some 13% of
immigrants in Greece, and a similar proportion of total schoolchildren, with Albanians as
the overwhelming majority nationality.
Thus, by 2004 the immigrant population (with a conservative estimate of illegal stocks)
stands at around 900.000 non-EU/EFTA or non-homogeneis persons, and including EU
nationals this takes the total to about 950.000 immigrants. This latter figure is about
200.000 more than recorded in the 2001 Census, and takes the immigrant/total
population ratio up to about 8,5%. If we add the estimated number of ethnic Greeks
with homogeneis cards, this takes the figure up to 1,15 million persons – about 10,3%.
However, without proper data on all legal immigrants in Greece, plus detailed accounts
of citizenship awards, these figures are highly unreliable.
5
Profile of immigrants in Greece: information from the 2001 Census The Census recorded 762.191 persons normally resident in Greece and without Greek
citizenship, constituting around 7% of total population. Of these, 48.560 are EU or EFTA
nationals; there are also 17.426 Cypriots with privileged status. The residual is around
690.000 persons of non-EU or non-homogeneis status, whose adult members all require
standard residence permits.
Nationalities Figure 2 shows the distribution of all immigrants by nationality, with Albanians
constituting some 56% of total immigrants, followed by Bulgarians (5%), Georgians
(3%) and Romanians (3%). Americans, Cypriots, British and Germans appear as sizeable
foreign communities at around 2% each of total foreign population. However, Greece is
unique in the EU in having one dominant immigrant group in excess of 50% of its
immigrant population.
Gender balance The gender balance of immigrant groups varies widely, as shown in Figure 3. Overall,
the sexes are well-balanced, but certain nationalities have highly skewed profiles. The
Asian countries in particular (Pakistan, Bangladesh and India) have almost exclusively
male immigrants in Greece, and the Arab countries also tend in this direction. Syria and
Egypt have 80% male presence in Greece. Other nationalities have a predominantly
female presence, the Ukraine, Philippines and Moldavia especially so at around 70%
female. Albania shows some 60% male presence, along with Romania. The other leading
nationalities (Bulgaria, Georgia, USA, Cyprus, Russia, UK, Germany, Poland) are 50-60%
female, until we reach Pakistanis at 1,4% of foreign population.
Age profiles by nationality Around 80% of immigrants are of working age (15-64), which contrasts with the Greek
ratio of only 68%. The principal difference with the Greek population is the presence of
many elderly Greeks, although there is a slightly higher ratio of children than amongst
Greeks (17% as opposed to 15%).
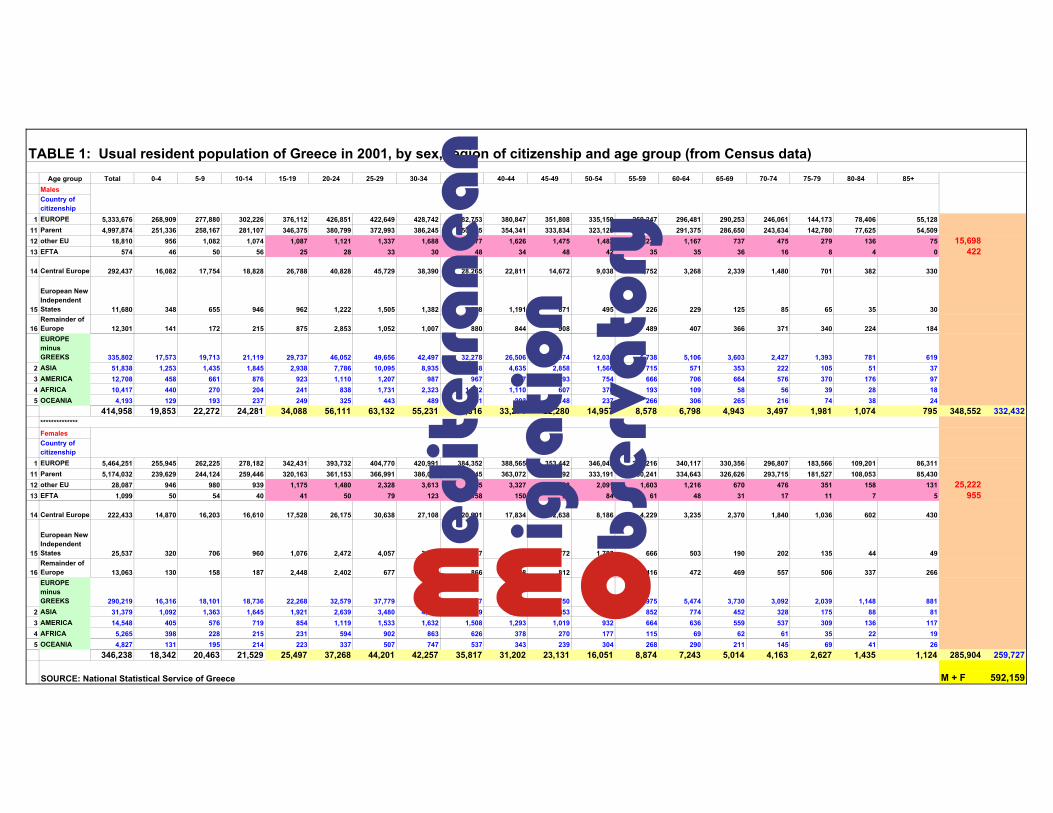
Table 1 shows summary data by geographical region of origin of immigrant and Greek
populations, by age group and sex. For both sexes, Central Europe (i.e. Albania, along
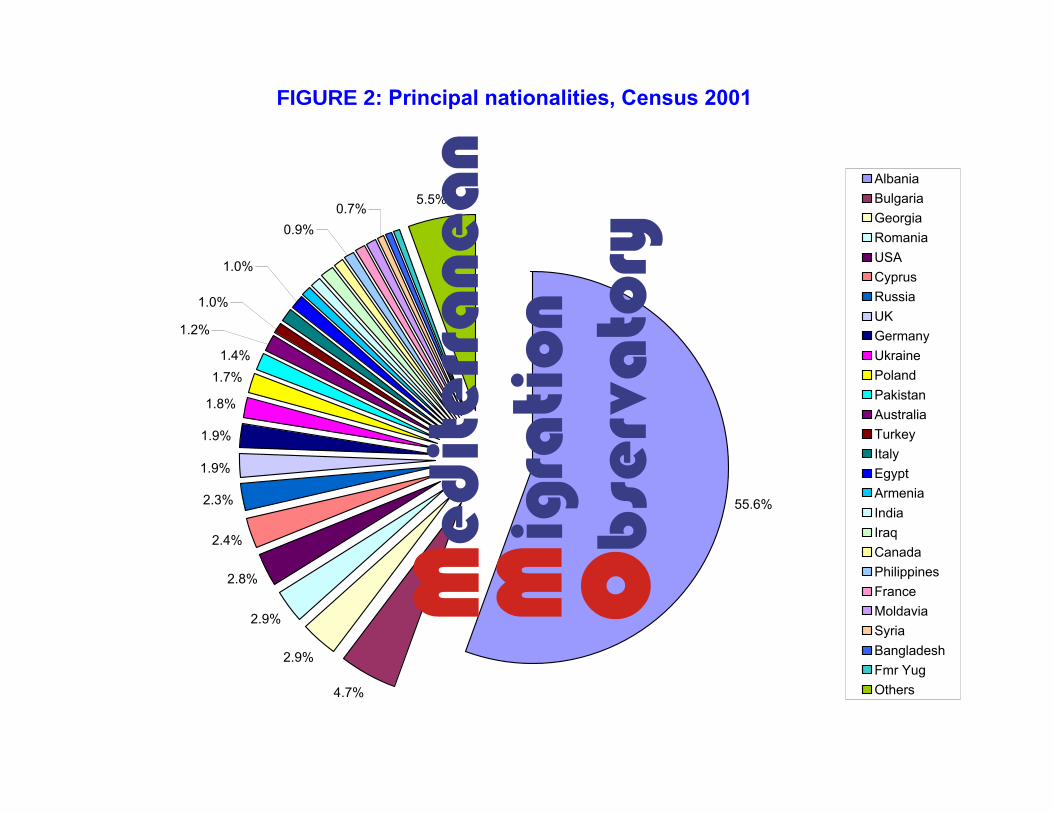
FIGURE 2: Principal nationalities, Census 2001
55.6%
4.7%
2.9%
2.9%
2.8%
2.4%
2.3%
1.9%
1.9%
1.8%
1.7%1.4%
5.5%
1.2%
1.0%
1.0%
0.9%0.7%
AlbaniaBulgariaGeorgiaRomaniaUSACyprusRussiaUKGermanyUkrainePolandPakistanAustraliaTurkeyItalyEgyptArmeniaIndiaIraqCanadaPhilippinesFranceMoldaviaSyriaBangladeshFmr YugOthers
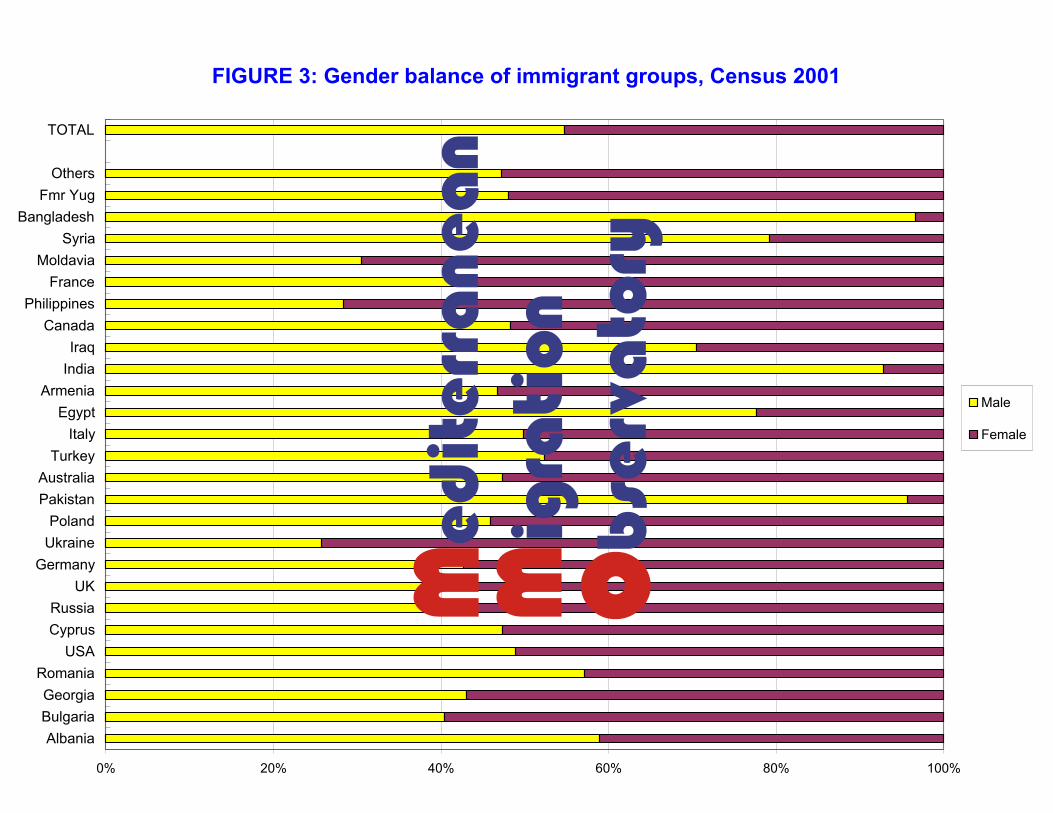
FIGURE 3: Gender balance of immigrant groups, Census 2001
0% 20% 40% 60% 80% 100%
AlbaniaBulgariaGeorgia
RomaniaUSA
CyprusRussia
UKGermany
UkrainePoland
PakistanAustralia
TurkeyItaly
EgyptArmenia
IndiaIraq
CanadaPhilippines
FranceMoldavia
SyriaBangladesh
Fmr YugOthers
TOTAL
Male
Female
Age group Total 0-4 5-9 10-14 15-19 20-24 25-29 30-34 35-39 40-44 45-49 50-54 55-59 60-64 65-69 70-74 75-79 80-84 85+MalesCountry of citizenship
1 EUROPE 5,333,676 268,909 277,880 302,226 376,112 426,851 422,649 428,742 382,753 380,847 351,808 335,150 269,247 296,481 290,253 246,061 144,173 78,406 55,12811 Parent 4,997,874 251,336 258,167 281,107 346,375 380,799 372,993 386,245 350,475 354,341 333,834 323,120 262,509 291,375 286,650 243,634 142,780 77,625 54,50912 other EU 18,810 956 1,082 1,074 1,087 1,121 1,337 1,688 1,777 1,626 1,475 1,482 1,236 1,167 737 475 279 136 75 15,69813 EFTA 574 46 50 56 25 28 33 30 48 34 48 42 35 35 36 16 8 4 0 422
14 Central Europe 292,437 16,082 17,754 18,828 26,788 40,828 45,729 38,390 28,265 22,811 14,672 9,038 4,752 3,268 2,339 1,480 701 382 330
15
European New Independent States 11,680 348 655 946 962 1,222 1,505 1,382 1,308 1,191 871 495 226 229 125 85 65 35 30
16Remainder of Europe 12,301 141 172 215 875 2,853 1,052 1,007 880 844 908 973 489 407 366 371 340 224 184EUROPE minus GREEKS 335,802 17,573 19,713 21,119 29,737 46,052 49,656 42,497 32,278 26,506 17,974 12,030 6,738 5,106 3,603 2,427 1,393 781 619
2 ASIA 51,838 1,253 1,435 1,845 2,938 7,786 10,095 8,935 6,438 4,635 2,858 1,566 715 571 353 222 105 51 373 AMERICA 12,708 458 661 876 923 1,110 1,207 987 967 817 693 754 666 706 664 576 370 176 974 AFRICA 10,417 440 270 204 241 838 1,731 2,323 1,782 1,110 607 370 193 109 58 56 39 28 185 OCEANIA 4,193 129 193 237 249 325 443 489 351 203 148 237 266 306 265 216 74 38 24
414,958 19,853 22,272 24,281 34,088 56,111 63,132 55,231 41,816 33,271 22,280 14,957 8,578 6,798 4,943 3,497 1,981 1,074 795 348,552 332,432
FemalesCountry of citizenship
1 EUROPE 5,464,251 255,945 262,225 278,182 342,431 393,732 404,770 420,991 384,352 388,565 353,442 346,042 287,216 340,117 330,356 296,807 183,566 109,201 86,31111 Parent 5,174,032 239,629 244,124 259,446 320,163 361,153 366,991 386,091 355,245 363,072 334,692 333,191 280,241 334,643 326,626 293,715 181,527 108,053 85,43012 other EU 28,087 946 980 939 1,175 1,480 2,328 3,613 4,165 3,327 2,438 2,091 1,603 1,216 670 476 351 158 131 25,22213 EFTA 1,099 50 54 40 41 50 79 123 158 150 90 84 61 48 31 17 11 7 5 955
14 Central Europe 222,433 14,870 16,203 16,610 17,528 26,175 30,638 27,108 20,901 17,834 12,638 8,186 4,229 3,235 2,370 1,840 1,036 602 430
15
European New Independent States 25,537 320 706 960 1,076 2,472 4,057 3,402 3,017 3,184 2,772 1,782 666 503 190 202 135 44 49
16Remainder of Europe 13,063 130 158 187 2,448 2,402 677 654 866 998 812 708 416 472 469 557 506 337 266EUROPE minus GREEKS 290,219 16,316 18,101 18,736 22,268 32,579 37,779 34,900 29,107 25,493 18,750 12,851 6,975 5,474 3,730 3,092 2,039 1,148 881
2 ASIA 31,379 1,092 1,363 1,645 1,921 2,639 3,480 4,115 4,039 3,695 2,853 1,787 852 774 452 328 175 88 813 AMERICA 14,548 405 576 719 854 1,119 1,533 1,632 1,508 1,293 1,019 932 664 636 559 537 309 136 1174 AFRICA 5,265 398 228 215 231 594 902 863 626 378 270 177 115 69 62 61 35 22 195 OCEANIA 4,827 131 195 214 223 337 507 747 537 343 239 304 268 290 211 145 69 41 26
346,238 18,342 20,463 21,529 25,497 37,268 44,201 42,257 35,817 31,202 23,131 16,051 8,874 7,243 5,014 4,163 2,627 1,435 1,124 285,904 259,727
M + F 592,159
**************
SOURCE: National Statistical Service of Greece
TABLE 1: Usual resident population of Greece in 2001, by sex, region of citizenship and age group (from Census data)
6
with Bulgaria, Romania and Poland) dominates all age brackets – even the 85+ group.
Table 1 is also able to show us how many non-EU immigrants are over 18 by 2004, and
thus require residence permits. The calculations are shown on the right, yielding 592.159
persons aged 15+ in 2001 who need residence permits.
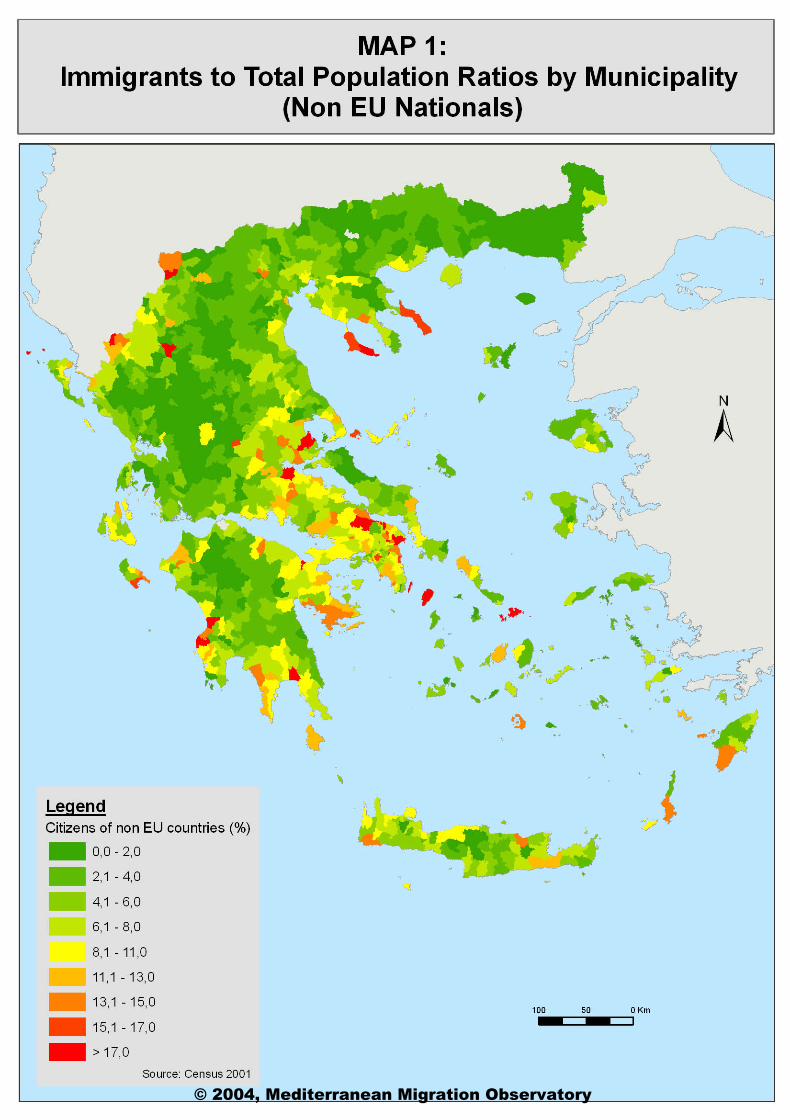
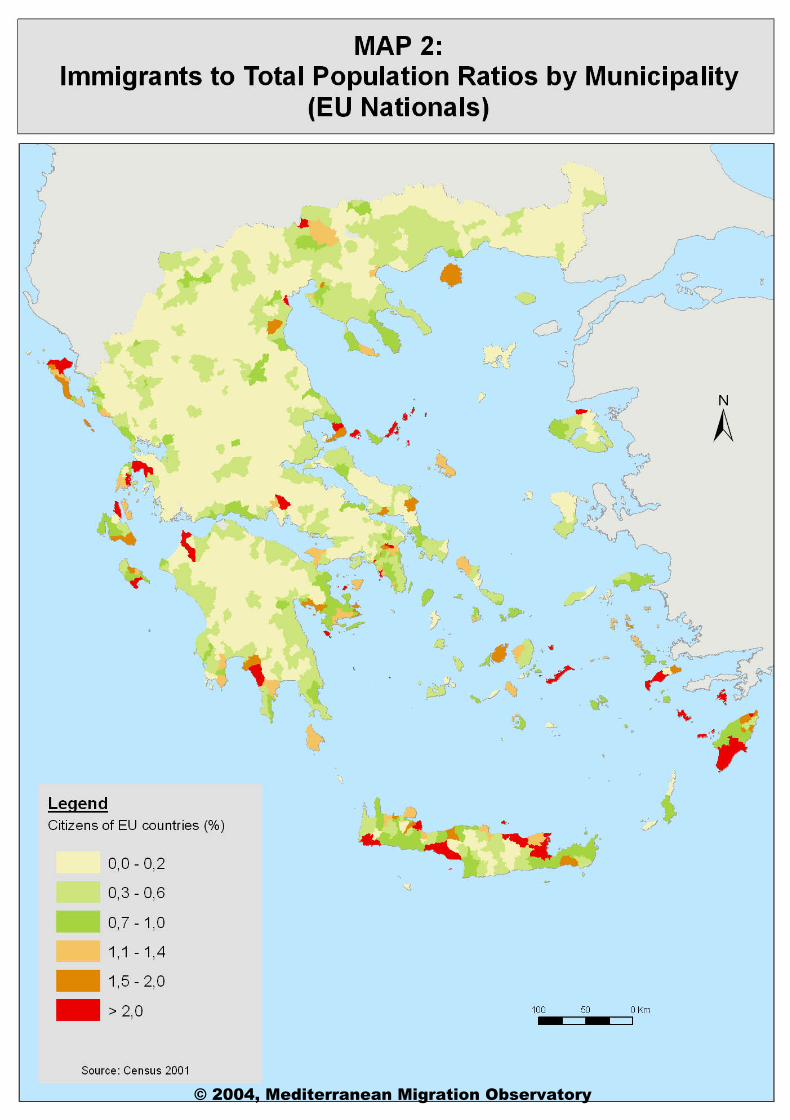
Location in Greece For the first time, detailed accounts of the location of immigrants in Greece have become
available from the Statistical Service. Maps 1 and 2 show these by municipality level,
revealing a wide range of immigrant population densities going from 0% to 25%.
Looking at non-EU population densities, the highest (13-25%) seem to be generally on
islands (Mikonos, Kea, Skiathos, Zakynthos), in Attika and close to Athens, or the
northwestern Greek border. The lowest (0-1,7%) are in the northeast of Greece, around
Alexandroupoli and also a few economically disadvantaged regions of the country. Maps
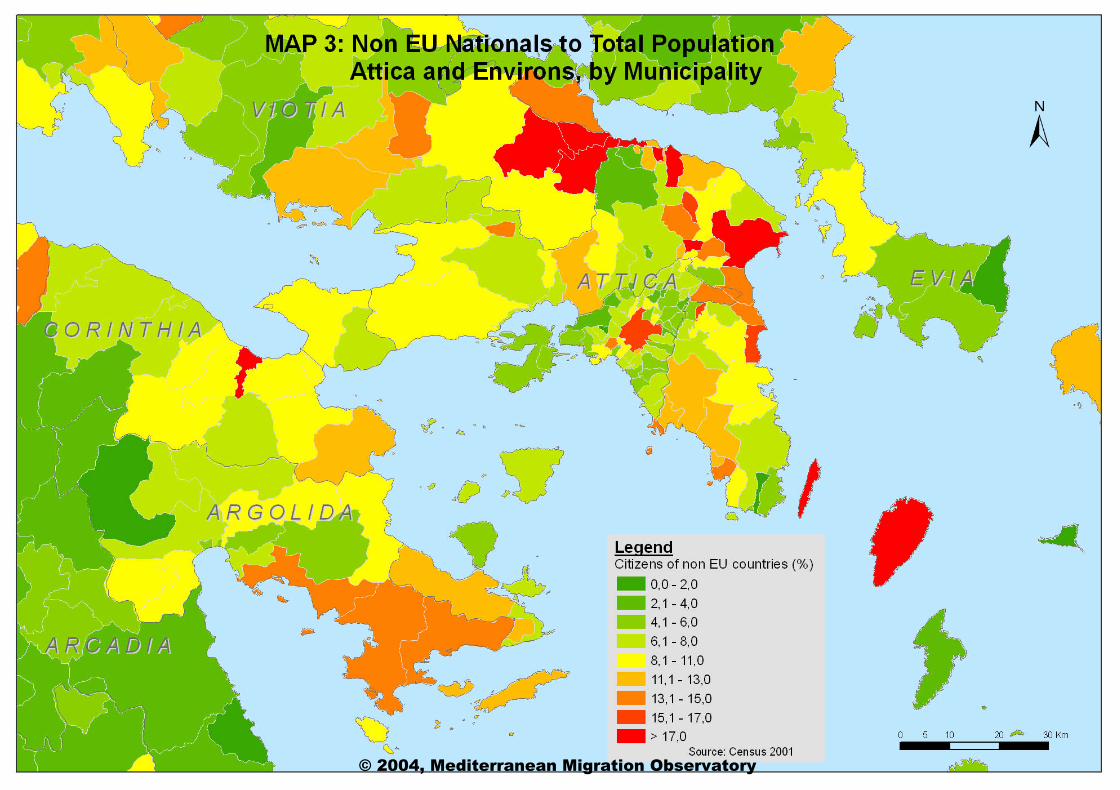
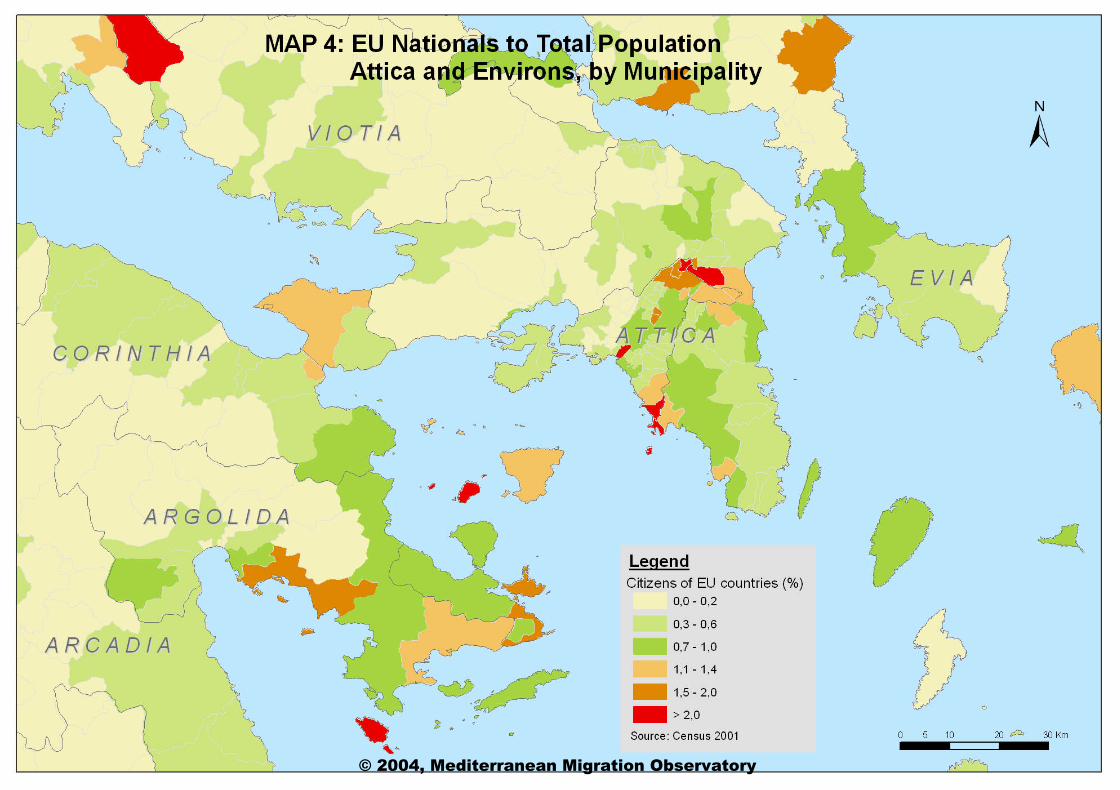
3 and 4 show the non-EU and EU immigrant population ratios for the Attika region, one
of the most important for immigrant location in Greece.
The greatest cluster of non-EU immigrant population is in the Muncipality of Athens –
some 132.000 immigrants, at 17% of local population. Thessaloniki is the second largest
cluster, with 27.000 – but reaching only 7% of local population. After this, the
predominant areas of location are the Athens environs. Islands also show large numbers
of immigrants, particularly on Kriti, Rodos, Kerkyra and Zakynthos.
EU migrant population ratios are low, although reaching 6,4% in the island of Alonissos,
and tend to be in the richer suburbs of Athens and many Greek islands (South Rodos
and Lindos, Symi, Amorgos, Skiathos, Spetses). EU migrant clusters are in Athens,
followed by Thessaloniki, and again focused on islands (Rodos, Kerkyra, Kos) and richer
suburbs of Athens such as Glyfada, Kifissia, Voula.
Looking at major population centres in Greece, it is apparent that these attract both EU
and non-EU immigrants; however, the population density of immigrants varies with a
clear geographical pattern. Northern Greece, even where there are quite large numbers
of immigrants, has a low concentration (e.g. around 1-3% in Serres, Drama, Komotini,
© 2004, Mediterranean Migration Observatory
© 2004, Mediterranean Migration Observatory
© 2004, Mediterranean Migration Observatory
© 2004, Mediterranean Migration Observatory
7
Alexandroupoli), with even Thessaloniki at only 7%. Attika and some island regions (e.g.
Chania, Rodos) have around 8%, with central Athens at 17%.
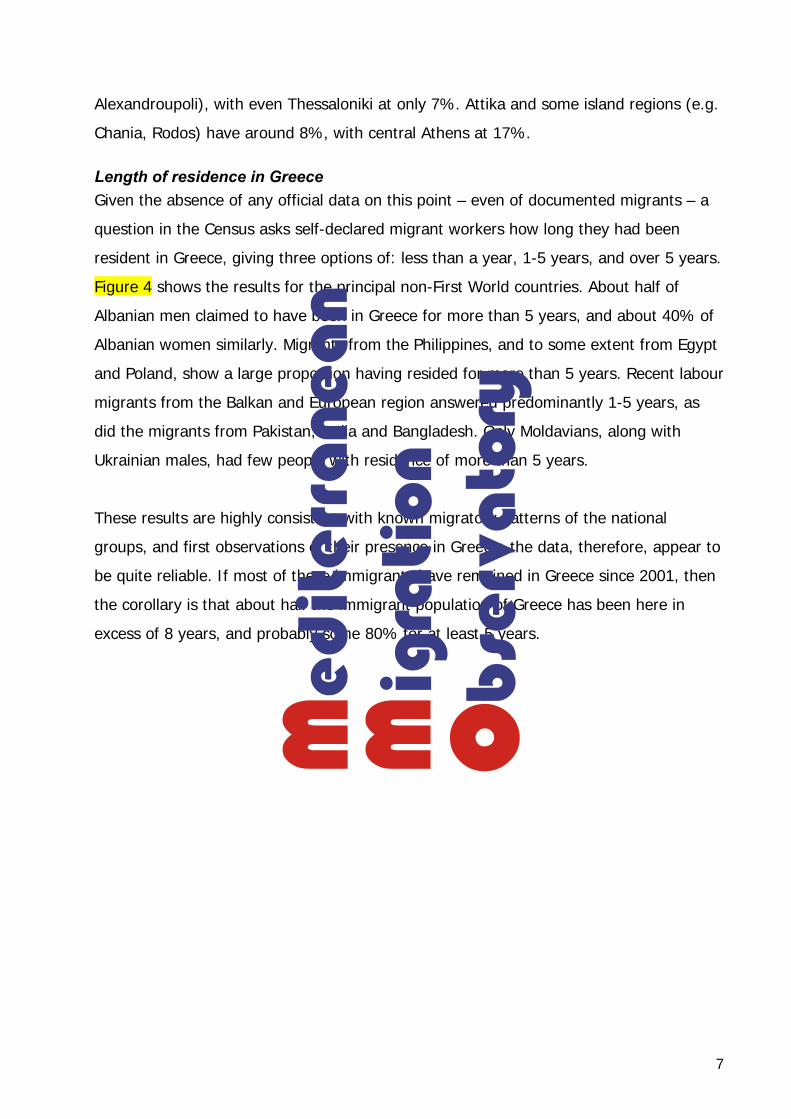
Length of residence in Greece Given the absence of any official data on this point – even of documented migrants – a
question in the Census asks self-declared migrant workers how long they had been
resident in Greece, giving three options of: less than a year, 1-5 years, and over 5 years.
Figure 4 shows the results for the principal non-First World countries. About half of
Albanian men claimed to have been in Greece for more than 5 years, and about 40% of
Albanian women similarly. Migrants from the Philippines, and to some extent from Egypt
and Poland, show a large proportion having resided for more than 5 years. Recent labour
migrants from the Balkan and European region answered predominantly 1-5 years, as
did the migrants from Pakistan, India and Bangladesh. Only Moldavians, along with
Ukrainian males, had few people with residence of more than 5 years.
These results are highly consistent with known migratory patterns of the national
groups, and first observations of their presence in Greece: the data, therefore, appear to
be quite reliable. If most of these immigrants have remained in Greece since 2001, then
the corollary is that about half the immigrant population of Greece has been here in
excess of 8 years, and probably some 80% for at least 5 years.
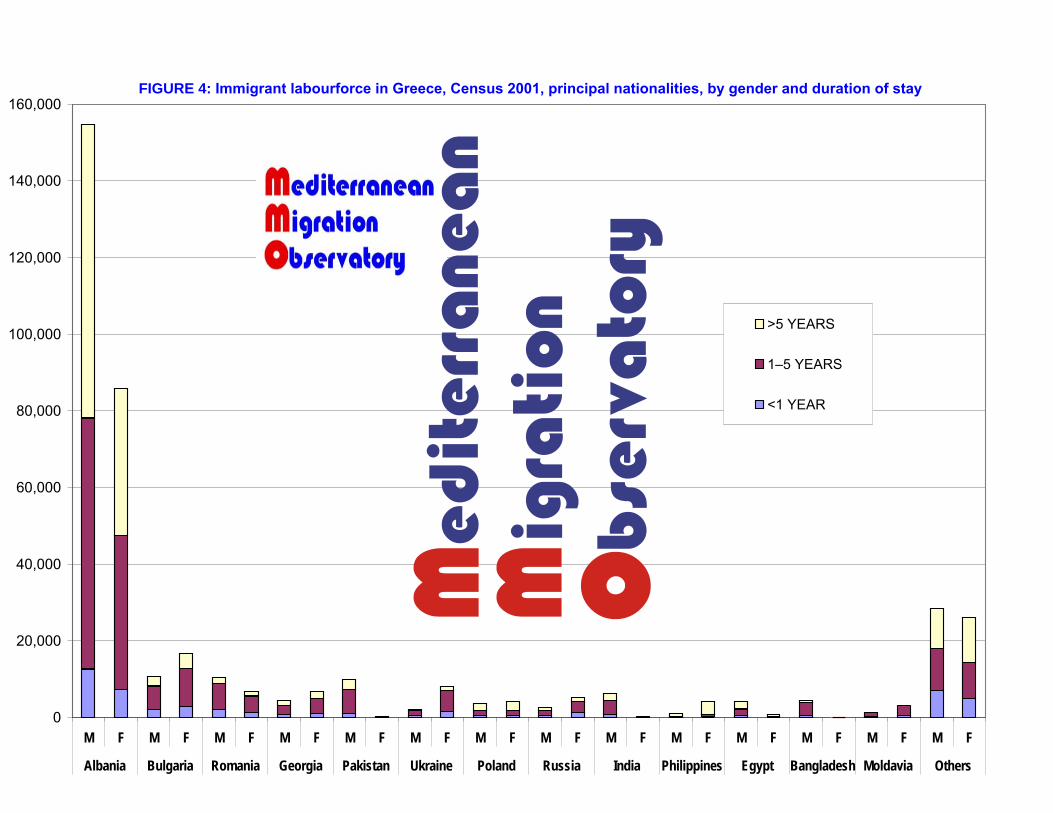
FIGURE 4: Immigrant labourforce in Greece, Census 2001, principal nationalities, by gender and duration of stay
0
20,000
40,000
60,000
80,000
100,000
120,000
140,000
160,000
M F M F M F M F M F M F M F M F M F M F M F M F M F M F
Albania Bulgaria Romania Georgia Pakistan Ukraine Poland Russia India Philippines Egypt Bangladesh Moldavia Others
>5 YEARS
1–5 YEARS
<1 YEAR
8
Characteristics of the immigrant population from residence permit data, 2003-4 The Ministry of Interior database for Residence Permit data is a dynamic one, with
significantly different results being obtained according to the date of printout. In our
view, this factor has not been comprehended by the Ministry and has led to incorrect
data being given out by the Ministry to journalists and others. The problem is discussed
in Part B in some detail, but we mention it here in order that recent data are not taken
to be accurate.
Two sorts of data have been provided to us:
I. Valid permits by nationality and gender, at reference date
II. Detailed listings of cumulatively issued permits [since 1 July 2003] at reference
date, by nationality, gender, and permit type
Type I data have been provided, on 6 October 2004, for the reference dates 15/01/04,
15/03/04, 15/05/04, 15/07/04 and 16/09/04.
Type II data have been provided with great detail for the reference date 16 September
2004. Summary data for both types of data are displayed in Figure 5, which shows a
cumulative total of 683.324 permits issued, and apparently a continuing decline in the
number of valid permits throughout 2004 [from 509.168 in January down to 250.068 in
September]. This decline we now believe to be illusory, and is either the result of an
administrative defect in statistical collation or it shows the issue of expired and semi-
expired permits, both rendering invalid all of the recent data. However, we are of the
opinion that the cumulative data are useful, even though they refer to expired permits:
as of 16 September 2004, there were apparently 432.932 expired permits out of the
683.324 issued. The reasons for this problem are documented in Part B and will not be
discussed here: what is important, is that the cumulative data provide valid information
about the permits which were issued in 2003 and early 2004.
FIGURE 5: Cumulative total and total valid residence permits, 2004
0
100,000
200,000
300,000
400,000
500,000
600,000
700,000
800,000
Valid permits at date Total permits issued since 1 July 2003
15/01/2004
15/03/2004
15/05/2004
15/07/2004
16/09/2004
9
The number of legal immigrants in Greece As should be evident from the above discussion, this number cannot be provided for
recent data. It is possible that the figure for January 2004 (509.000) is reliable, but this
is not assured. However, by October 2004 some 700.000 permits had been issued. This
figure is higher than the Census figure of 592.159 adults requiring permits. Although
children aged 14-17 not in the education system require their own permits, this does not
significantly alter the fact that Greece has handed out more residence permits than
appeared in the Census. The cumulative data show Albanians granted permits as
numbering 432.120 – a figure also considerably above the Census figure of 344.526
persons aged 15+ in 2001.
Figure 6 shows the proportions of nationalities granted residence permits 2003-4, using
the cumulative dataset. After the usual predominance of Albanians, there are Bulgarians
at 66.787, Romanians at 29.108, Ukrainains at 23.008. All nationalities show a marked
increase in permits compared with the Census, except for Polish [a marked reduction]
and Philippino [roughly the same]. Despite increased numbers of almost all nationalities,
several nationalities have altered their ranking in migrant group presence in Greece,
presumably owing to recent immigrations: these include Bulgarians, Ukrainians,
Georgians, Moldovans, Macedonians and Chinese. Looking at broad geographical region
of origin, Figure 7 shows the overwhelming importance of Central Europe, followed by
Asia [principally, Pakistan, Georgia, India, Philippines, Bangladesh, Armenia and China].
The European New Independent States are also important, at 6,7%: these are Ukraine,
Moldova and Russia.
A comparison of immigrants granted residence permits with those recorded in the
Census should enable us to gain a better picture of develeopments. Figure 8 shows this
by region of origin, for persons aged 15+ in the Census and holders of residence pemits.
Clearly there are some 120.000 more persons from Central Europe, but also small
recorded increases for the European New Independent States, Asia and North Africa.
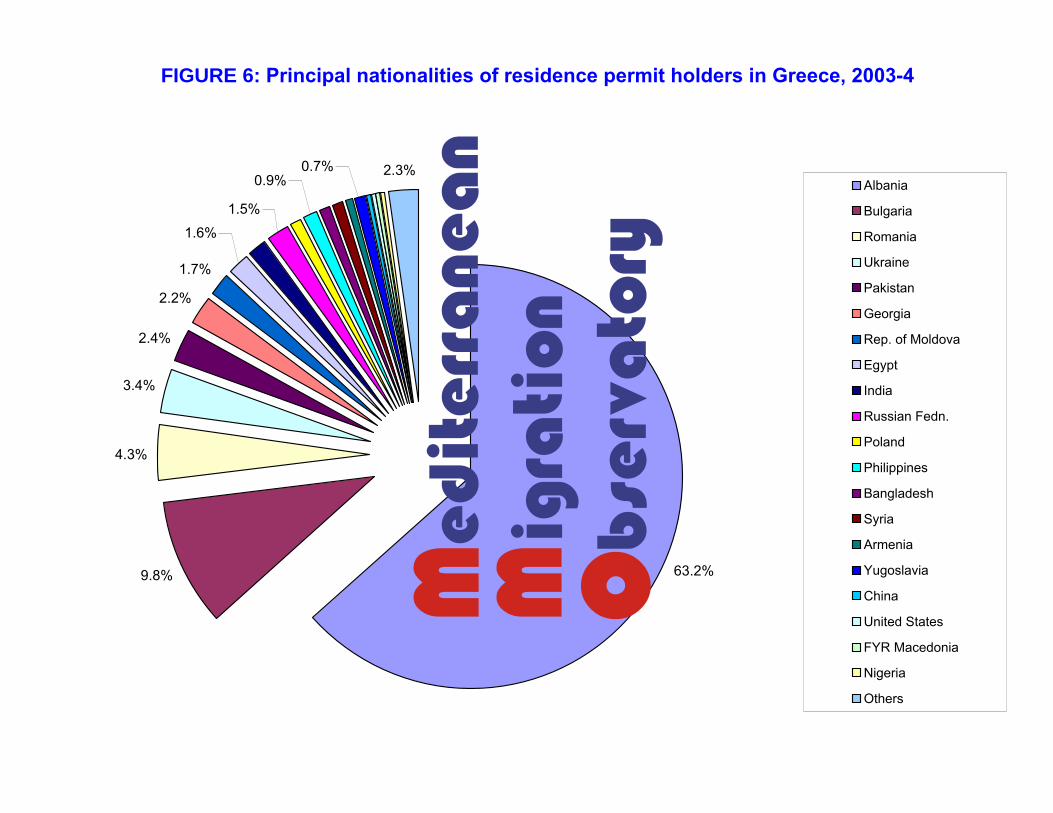
FIGURE 6: Principal nationalities of residence permit holders in Greece, 2003-4
63.2%9.8%
4.3%
3.4%
2.4%
2.2%
1.7%
2.3%
1.5%
0.7%0.9%
1.6%
Albania
Bulgaria
Romania
Ukraine
Pakistan
Georgia
Rep. of Moldova
Egypt
India
Russian Fedn.
Poland
Philippines
Bangladesh
Syria
Armenia
Yugoslavia
China
United States
FYR Macedonia
Nigeria
Others
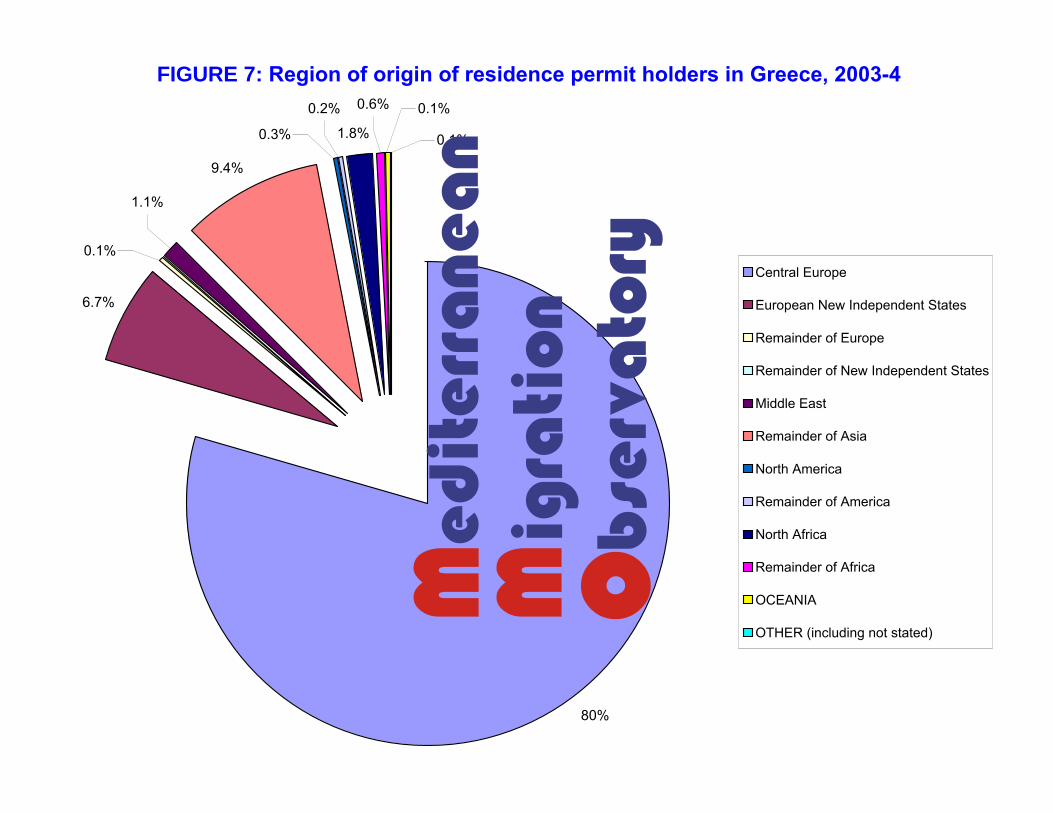
FIGURE 7: Region of origin of residence permit holders in Greece, 2003-4
80%
1.8%
6.7%
9.4%
0.1%
0.3%
0.6% 0.1%
0.1%
0.2%
1.1%
Central Europe
European New Independent States
Remainder of Europe
Remainder of New Independent States
Middle East
Remainder of Asia
North America
Remainder of America
North Africa
Remainder of Africa
OCEANIA
OTHER (including not stated)
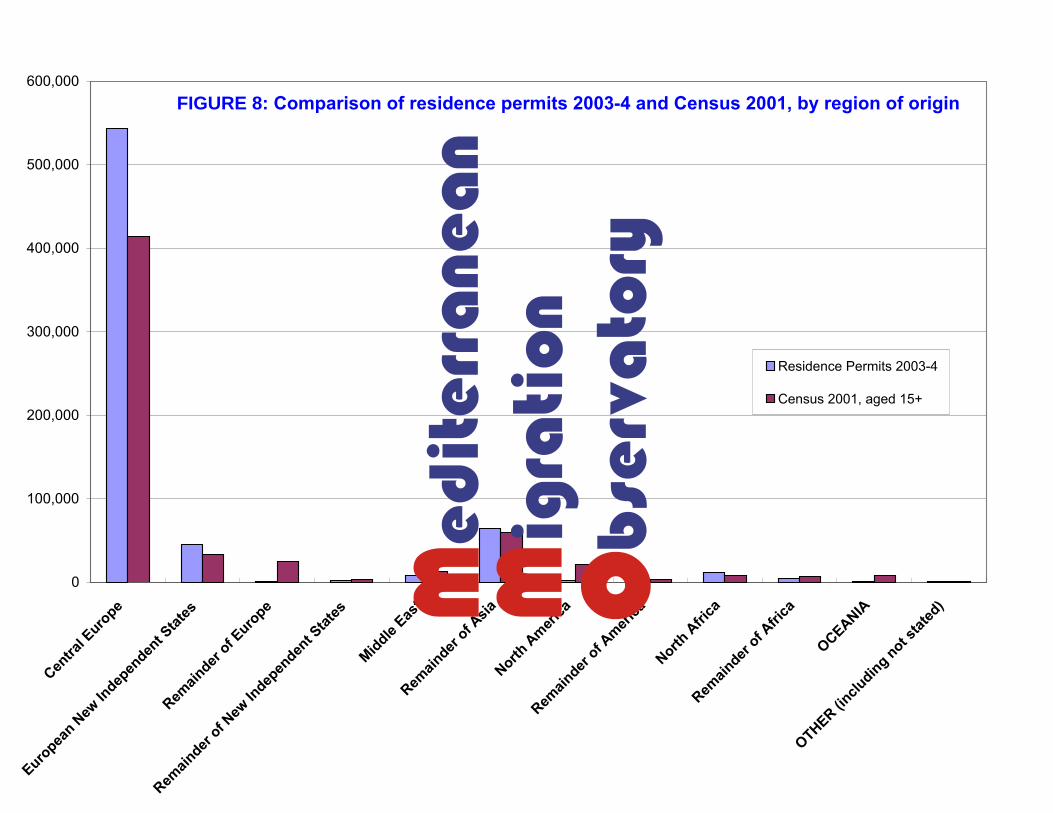
FIGURE 8: Comparison of residence permits 2003-4 and Census 2001, by region of origin
0
100,000
200,000
300,000
400,000
500,000
600,000
Centra
l Euro
pe
Europea
n New
Indep
enden
t Stat
esRem
ainder
of Euro
pe
Remain
der of N
ew In
depen
dent S
tates
Middle Eas
tRem
ainder
of Asia
North A
merica
Remain
der of A
merica
North A
frica
Remain
der of A
frica
OCEANIA
OTHER (inclu
ding not stat
ed)
Residence Permits 2003-4
Census 2001, aged 15+
10
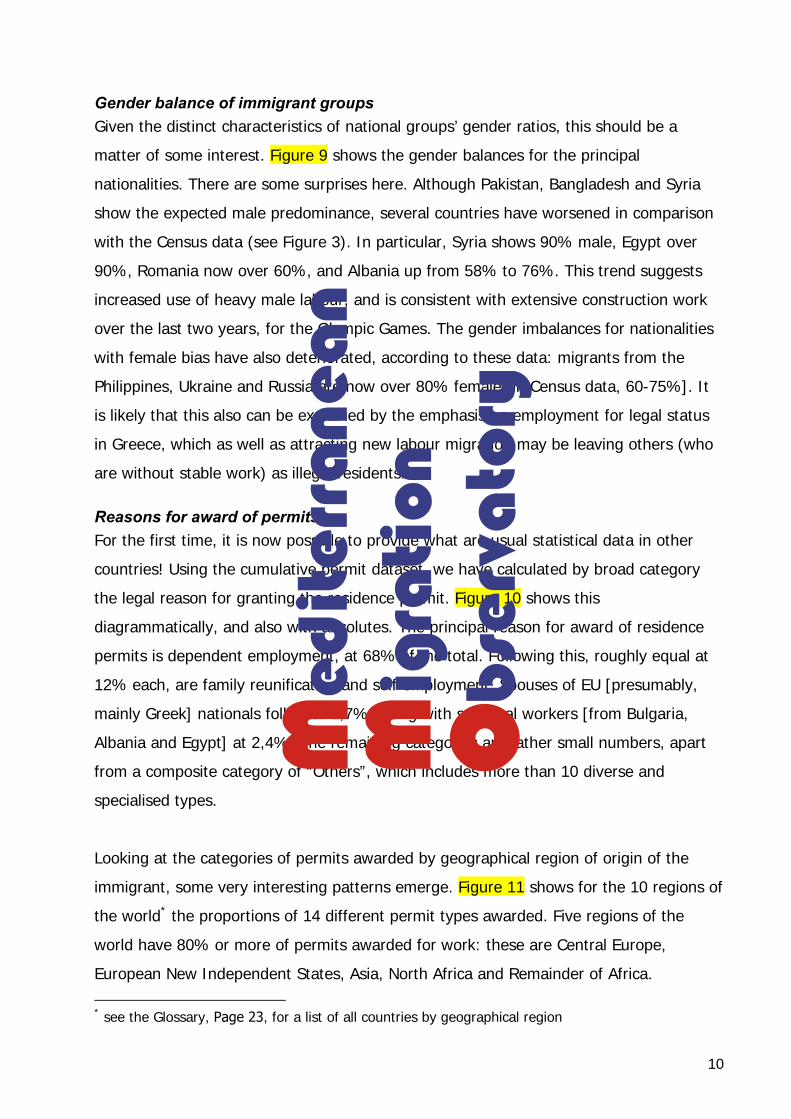
Gender balance of immigrant groups Given the distinct characteristics of national groups’ gender ratios, this should be a
matter of some interest. Figure 9 shows the gender balances for the principal
nationalities. There are some surprises here. Although Pakistan, Bangladesh and Syria
show the expected male predominance, several countries have worsened in comparison
with the Census data (see Figure 3). In particular, Syria shows 90% male, Egypt over
90%, Romania now over 60%, and Albania up from 58% to 76%. This trend suggests
increased use of heavy male labour, and is consistent with extensive construction work
over the last two years, for the Olympic Games. The gender imbalances for nationalities
with female bias have also deteriorated, according to these data: migrants from the
Philippines, Ukraine and Russia are now over 80% female [in Census data, 60-75%]. It
is likely that this also can be explained by the emphasis on employment for legal status
in Greece, which as well as attracting new labour migration may be leaving others (who
are without stable work) as illegal residents.
Reasons for award of permits For the first time, it is now possible to provide what are usual statistical data in other
countries! Using the cumulative permit dataset, we have calculated by broad category
the legal reason for granting the residence permit. Figure 10 shows this
diagrammatically, and also with absolutes. The principal reason for award of residence
permits is dependent employment, at 68% of the total. Following this, roughly equal at
12% each, are family reunification and self-employment. Spouses of EU [presumably,
mainly Greek] nationals follow at 2,7%, along with seasonal workers [from Bulgaria,
Albania and Egypt] at 2,4%. The remaining categories are rather small numbers, apart
from a composite category of “Others”, which includes more than 10 diverse and
specialised types.
Looking at the categories of permits awarded by geographical region of origin of the
immigrant, some very interesting patterns emerge. Figure 11 shows for the 10 regions of
the world* the proportions of 14 different permit types awarded. Five regions of the
world have 80% or more of permits awarded for work: these are Central Europe,
European New Independent States, Asia, North Africa and Remainder of Africa.
* see the Glossary, Page 23, for a list of all countries by geographical region
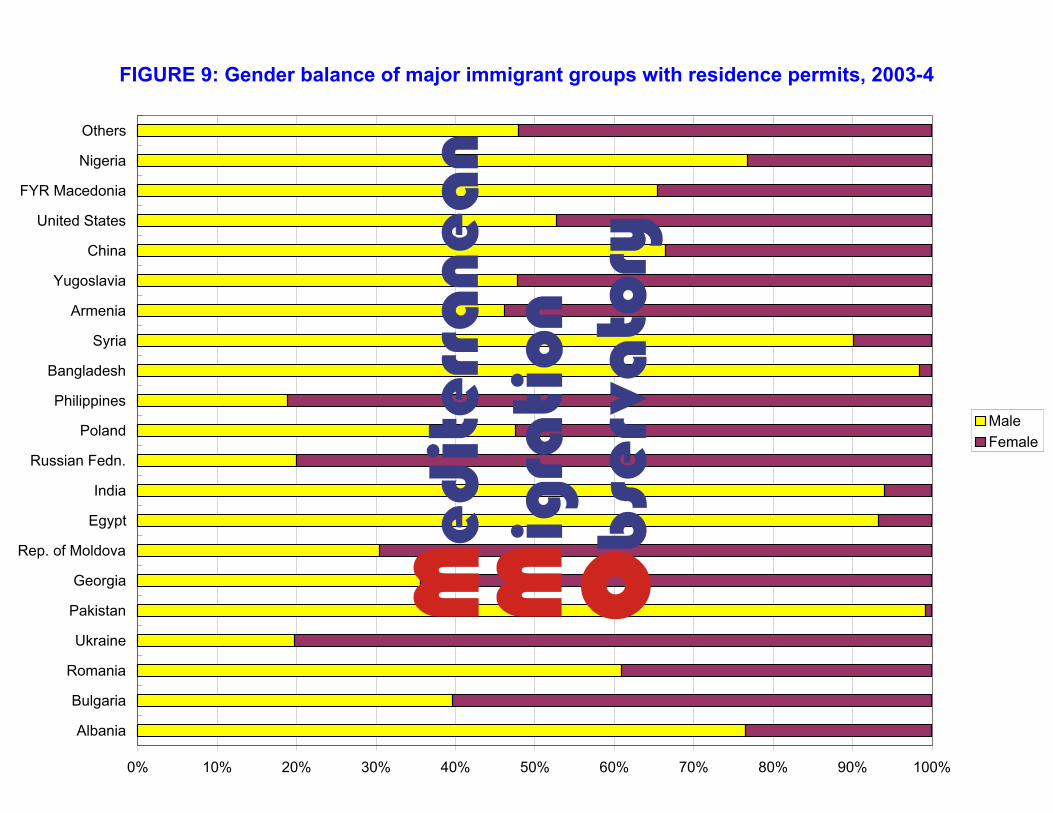
FIGURE 9: Gender balance of major immigrant groups with residence permits, 2003-4
0% 10% 20% 30% 40% 50% 60% 70% 80% 90% 100%
Albania
Bulgaria
Romania
Ukraine
Pakistan
Georgia
Rep. of Moldova
Egypt
India
Russian Fedn.
Poland
Philippines
Bangladesh
Syria
Armenia
Yugoslavia
China
United States
FYR Macedonia
Nigeria
Others
MaleFemale
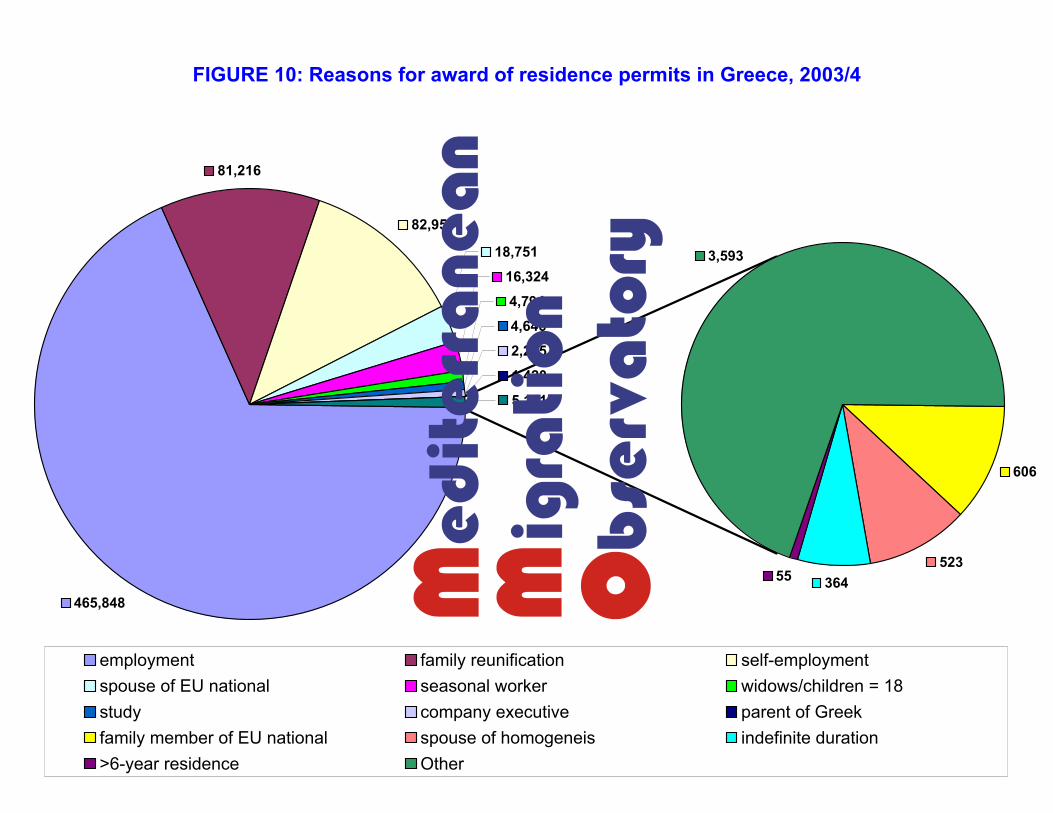
FIGURE 10: Reasons for award of residence permits in Greece, 2003/4
465,848
81,216
82,954
18,751
16,324
4,794
4,646
2,225
1,420
606
52336455
3,593
5,141
employment family reunification self-employmentspouse of EU national seasonal worker widows/children = 18study company executive parent of Greekfamily member of EU national spouse of homogeneis indefinite duration>6-year residence Other
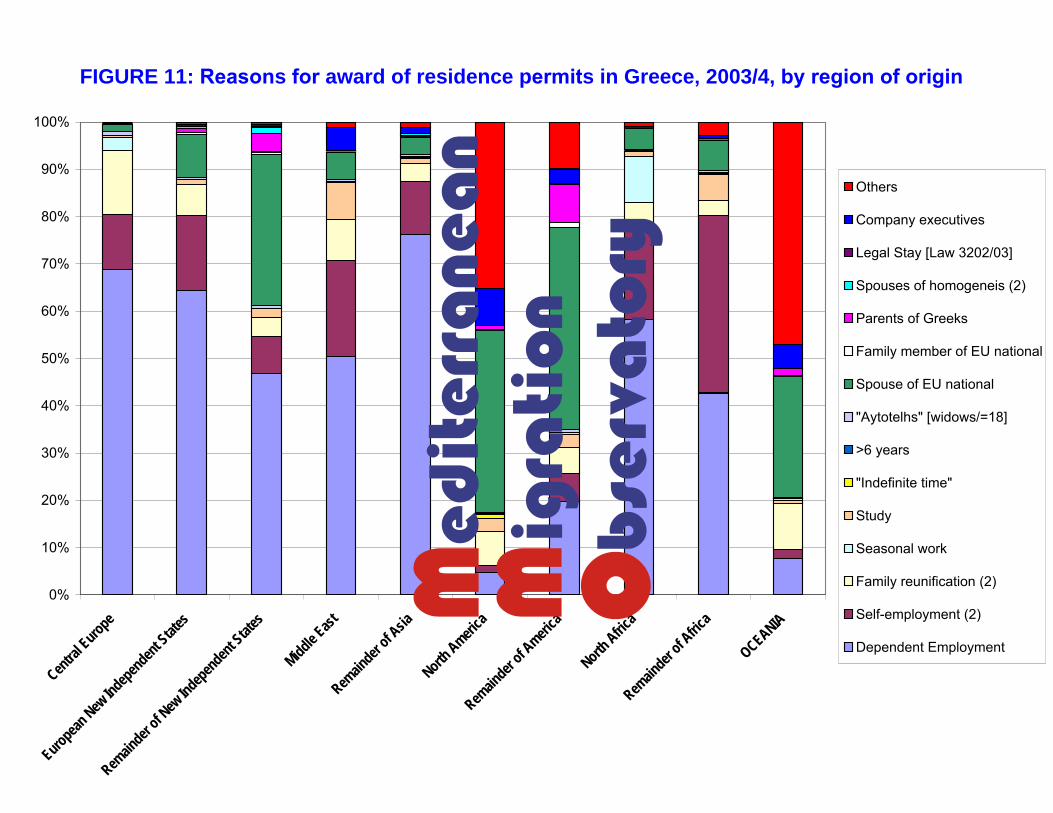
FIGURE 11: Reasons for award of residence permits in Greece, 2003/4, by region of origin
0%
10%
20%
30%
40%
50%
60%
70%
80%
90%
100%
Central E
urope
European New
Independent Stat
es
Remain
der of N
ew Independent S
tates
Middle East
Remain
der of A
siaNorth
America
Remain
der of A
merica
North Afric
aRem
ainder
of Afric
a
OCEANIA
Others
Company executives
Legal Stay [Law 3202/03]
Spouses of homogeneis (2)
Parents of Greeks
Family member of EU national
Spouse of EU national
"Aytotelhs" [widows/=18]
>6 years
"Indefinite time"
Study
Seasonal work
Family reunification (2)
Self-employment (2)
Dependent Employment

11
However, within this group there are differences regarding the remaining 20% or so of
permits: Central Europe [mainly Albania] has very high family reunification, whereas
European New Independent States has a mix of family reunification and marriage to EU
nationals, Asia has higher work dependency but a similar mix of the remainder to
European New Independent States, North Africa has high seasonal work [Egypt] with
some family reunification and marriage to EU nationals, and Africa has low family
reunification and higher study and marriage to EU nationals.
A second category consists of the Middle East, with 70% work, and a mix of family
reunification, study, marriage to EU nationals, and company executives.
The Remainder of New Independent States is a distinct third type, with 55%
employment, low family reunification and high marriage to EU nationals [30%] along
with 5% as parents of Greeks.
South America can be classed as a fourth category, with only 25% employment related,
40% spouses of EU nationals, and nearly 10% parents of Greeks.
The fifth type consists of North America and Oceania [countries with high numbers of
homogeneis] where employment permits are below 10%, marriage to EU nationals high
at 25-40%, and very high “Others” category permits. These latter are principally “public
interest”, whose definition we are not currently aware of.
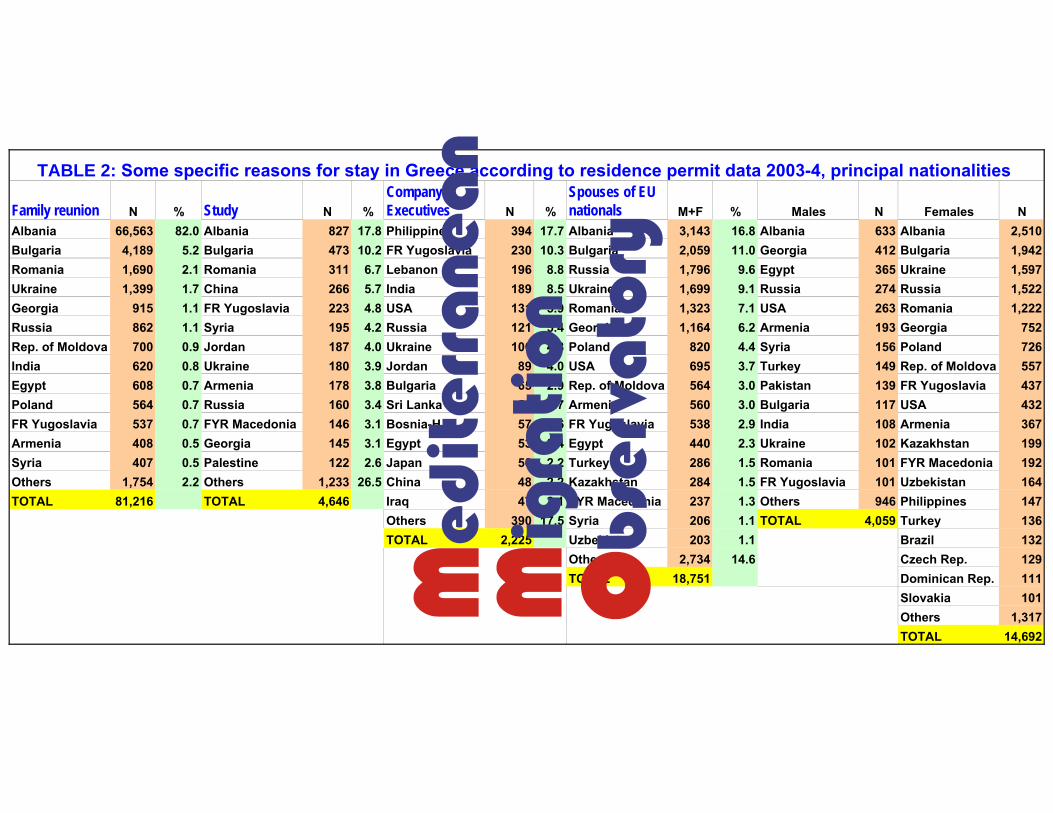
Specific reasons for stay in Greece, other than employment As we have seen in Figure 10, the vast majority of permits (80%) are awarded for
employment reasons. Given the very different patterns observed above (by region of
origin) for residence in Greece, it is useful to look at some specific smaller categories.
Table 2 shows principal nationalities for reasons of family reunion, study, business
(company executives) and marriage to an EU national.
Family reunion is dominated by Albanians at 80% of the total – well above their recorded
presence in the immigrant population of Greece. Residence for study purposes, although
with Albanians as the leading nationality at only 17%, is much more diverse. Other
Albania 66,563 82.0 Albania 827 17.8 Philippines 394 17.7 Albania 3,143 16.8 Albania 633 Albania 2,510Bulgaria 4,189 5.2 Bulgaria 473 10.2 FR Yugoslavia 230 10.3 Bulgaria 2,059 11.0 Georgia 412 Bulgaria 1,942Romania 1,690 2.1 Romania 311 6.7 Lebanon 196 8.8 Russia 1,796 9.6 Egypt 365 Ukraine 1,597Ukraine 1,399 1.7 China 266 5.7 India 189 8.5 Ukraine 1,699 9.1 Russia 274 Russia 1,522Georgia 915 1.1 FR Yugoslavia 223 4.8 USA 131 5.9 Romania 1,323 7.1 USA 263 Romania 1,222Russia 862 1.1 Syria 195 4.2 Russia 121 5.4 Georgia 1,164 6.2 Armenia 193 Georgia 752Rep. of Moldova 700 0.9 Jordan 187 4.0 Ukraine 106 4.8 Poland 820 4.4 Syria 156 Poland 726India 620 0.8 Ukraine 180 3.9 Jordan 89 4.0 USA 695 3.7 Turkey 149 Rep. of Moldova 557Egypt 608 0.7 Armenia 178 3.8 Bulgaria 65 2.9 Rep. of Moldova 564 3.0 Pakistan 139 FR Yugoslavia 437Poland 564 0.7 Russia 160 3.4 Sri Lanka 59 2.7 Armenia 560 3.0 Bulgaria 117 USA 432FR Yugoslavia 537 0.7 FYR Macedonia 146 3.1 Bosnia-H. 57 2.6 FR Yugoslavia 538 2.9 India 108 Armenia 367Armenia 408 0.5 Georgia 145 3.1 Egypt 53 2.4 Egypt 440 2.3 Ukraine 102 Kazakhstan 199Syria 407 0.5 Palestine 122 2.6 Japan 50 2.2 Turkey 286 1.5 Romania 101 FYR Macedonia 192Others 1,754 2.2 Others 1,233 26.5 China 48 2.2 Kazakhstan 284 1.5 FR Yugoslavia 101 Uzbekistan 164TOTAL 81,216 TOTAL 4,646 Iraq 47 2.1 FYR Macedonia 237 1.3 Others 946 Philippines 147
Others 390 17.5 Syria 206 1.1 TOTAL 4,059 Turkey 136TOTAL 2,225 Uzbekistan 203 1.1 Brazil 132
Others 2,734 14.6 Czech Rep. 129TOTAL 18,751 Dominican Rep. 111
Slovakia 101Others 1,317TOTAL 14,692
N NFemalesCompany Executives
Spouses of EU nationals M+F Males
TABLE 2: Some specific reasons for stay in Greece according to residence permit data 2003-4, principal nationalities
Family reunion N % Study N N% % %
12
Balkan countries are proportionately present, but Chinese, Yugoslavs, Syrians and
Jordanians are over-represented, as are Palestinians. Not evident in the Table is the
large presence of African students, but with small numbers from each country. Company
Executives show a remarkable mix of businesspeople from less developed countries, with
the Philippines taking 18% of such permits, and apart from Yugoslavia an under-
representation of Balkan countries.
Finally, spouses of EU nationals is an interesting category, as it implies some measure of
integration of different ethnic groups into Greek society. Albanians are under-
represented, at 17%, while Bulgarians are proportionately represented. The other
principal nationalities are significantly over-represented: Russians (10%), Ukrainians
(9%), Romanians (7%) and Georgians (6%). These latter compare with proportions of
2,2% to 4,3% of total permits. Looking at gender differences, the Table shows that it is
women from Albania, Bulgaria, Ukraine, Russia and Romania who have married Greek
men. The much smaller numbers of foreign men who have married Greek women are
Albanians, Georgians, Egyptians, Russians and Americans, although with quite a few
over-representations of other nationalities, such as Armenian, Syrian, Turkish. Marriage
of Pakistani and Indian men to Greeks is with very small numbers, compared to their
presence in Greece.
Duration of residence permits As noted previously, these data have never been available before. With some difficulty, it
has been possible to calculate the duration of the permits from the permit reasons,
although we are not able to distinguish between one and two year permits. Figure 12
gives a breakdown of permit durations. 92% are for one or two years; 5,4% are for less
than one year – these are seasonal workers [6-9 months] and temporary family
reunification permits [3 months]. 3% of permit holders benefit from the EU regime for
EU family members, with 5-year permits; and only 0,1% have indefinite permits.
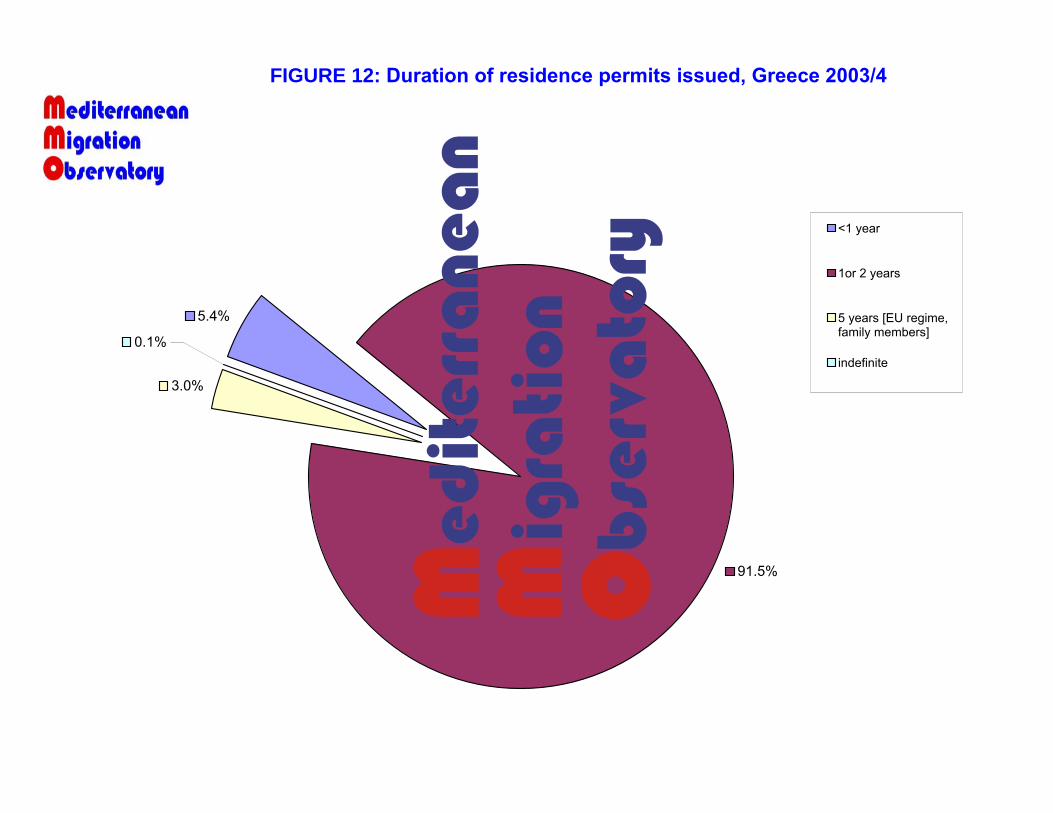
FIGURE 12: Duration of residence permits issued, Greece 2003/4
5.4%
91.5%
3.0%
0.1%
<1 year
1or 2 years
5 years [EU regime,family members]
indefinite
13
Immigrants in the Greek Labour Market Despite the earlier legalisations of immigrants, in particular the Green Cards which
required employment contracts and social insurance registration, almost nothing about
immigrant employment is known from official records prior to the 2001 Census. The only
three reliable and comprehensive sources of information, as of late 2004, consist of the
Census, residence permit data and IKA data. There is absolutely nothing available from
the Ministry of Labour – the responsible ministry for managing three legalisations and
currently for work permit awards in Greece.
The geographical distribution of non-EU immigrants in Greece follows, with some
exceptions, the general pattern of other countries: immigrants go to where there is work
available, which tend to be the economically developed regions. Therefore, immigrant
concentrations [as shown in Maps 1 and 3] are in Attika and tourist areas, such as
islands. The principal exception is the border region with Albania, where some areas
have large numbers of Albanians: the exact nature of their employment is not known
from official data.
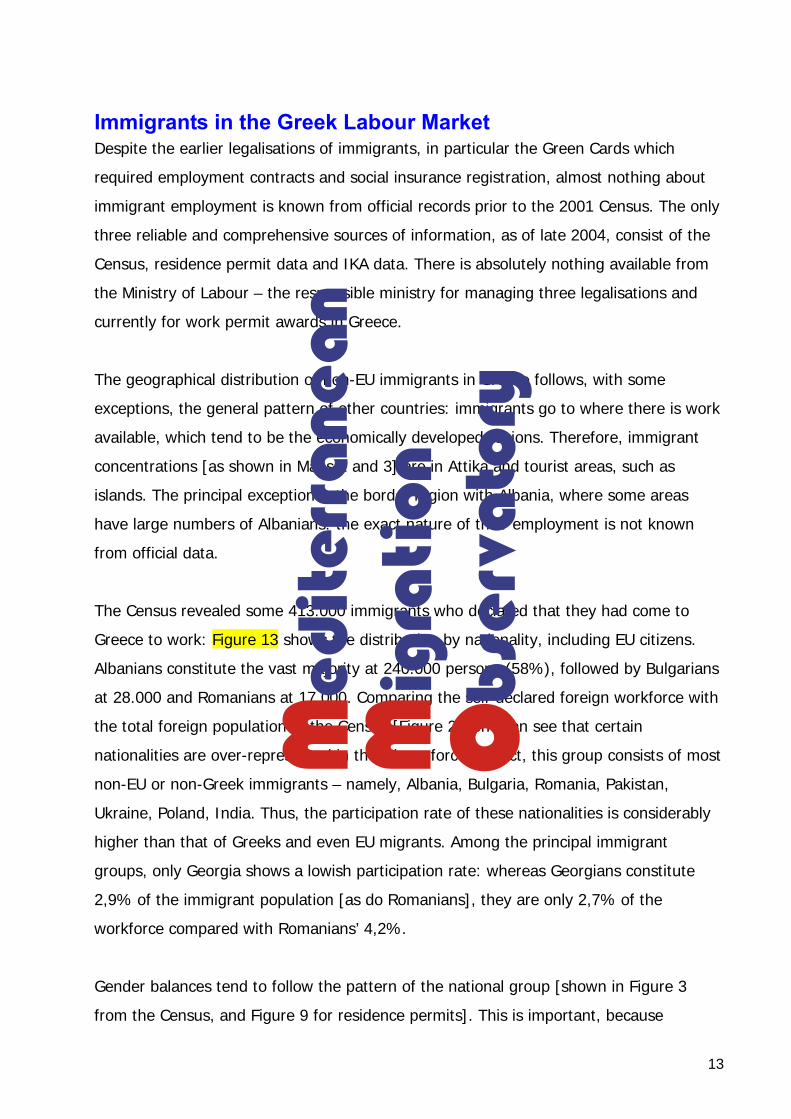
The Census revealed some 413.000 immigrants who declared that they had come to
Greece to work: Figure 13 shows the distribution by nationality, including EU citizens.
Albanians constitute the vast majority at 240.000 persons (58%), followed by Bulgarians
at 28.000 and Romanians at 17.000. Comparing the self-declared foreign workforce with
the total foreign population of the Census [Figure 2], one can see that certain
nationalities are over-represented in the labour force. In fact, this group consists of most
non-EU or non-Greek immigrants – namely, Albania, Bulgaria, Romania, Pakistan,
Ukraine, Poland, India. Thus, the participation rate of these nationalities is considerably
higher than that of Greeks and even EU migrants. Among the principal immigrant
groups, only Georgia shows a lowish participation rate: whereas Georgians constitute
2,9% of the immigrant population [as do Romanians], they are only 2,7% of the
workforce compared with Romanians’ 4,2%.
Gender balances tend to follow the pattern of the national group [shown in Figure 3
from the Census, and Figure 9 for residence permits]. This is important, because
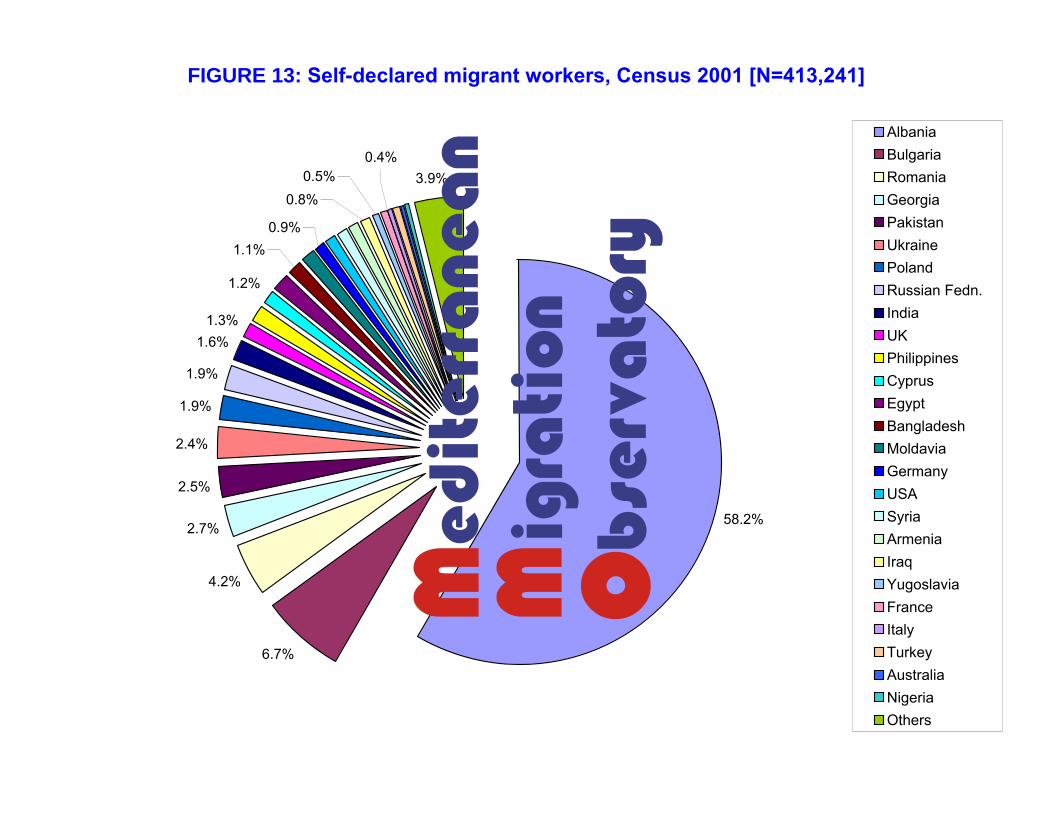
FIGURE 13: Self-declared migrant workers, Census 2001 [N=413,241]
58.2%
6.7%
4.2%
2.7%
2.5%
2.4%
1.9%
1.9%
1.6%1.3%
1.2%
3.9%0.4%
0.8%
1.1%0.9%
0.5%
AlbaniaBulgaria RomaniaGeorgiaPakistanUkrainePolandRussian Fedn.IndiaUK PhilippinesCyprusEgyptBangladeshMoldaviaGermanyUSASyriaArmeniaIraqYugoslaviaFranceItalyTurkeyAustraliaNigeriaOthers
14
immigrants in Greece follow very stereotypical and rigid employment possibilities –
determined by nationality and gender. Thus, the labour market is highly segmented and
non-competitive.
Looking from Census data at male immigrants’ main occupations, Figure 14 shows the
primacy of Albanian men in the immigrant labour market. Up until 2001, the principal
employment has been in building construction, followed by agriculture, industry and
tourism. Figure 15 gives percentage breakdowns of occupation by nationality. The very
different characteristics of each national group are clearly visible: Bulgarians and Indians
with a very high presence in agriculture [although of different types]; Bangladeshi and
Pakistanis are specialised in industry; Polish, Georgians and to a lesser extent Albanians
tend to work in construction. With different national emphases, and different specific
niches in the labour market, non-EU immigrant male employment is concentrated in
construction, agriculture and industry – although with some presence also in tourism.
Female employment is shown in Figure 16 – again, with a massive presence of
Albanians, but this time a more significant presence of other nationalities such as
Bulgarian, Ukrainian, Georgian, Romanian, Russian and Filipina. Figure 17 gives
percentage breakdowns, with the category of “Other” dominating all but one national
group. This we suppose to be live-in housekeeping and cleaning, not specifically
identified in the Census questions: it constitutes more than 50% of employment for all
migrant women other than Romanian. The latter have a large presence in agriculture, as
do Bulgarians, but also in tourism.
Immigrants’ insurance with IKA It will be recalled that around 70% of residence permits have been awarded for
dependent employment, with self-employment at only 12%. This means that the
principal social insurance agency for employees – IKA – should be able to provide
important information on the activities of the vast majority of immigrant workers. The
latest IKA data contain more detail than previously on employment by sector: Figure 18
shows this for 60 sectors, with Greek and non-Greek employment. In only one sector –
housekeeping – do immigrants outnumber Greeks, but the actual figure is very low at
25.000 total. The other major area (as shown also by the Census data) is building
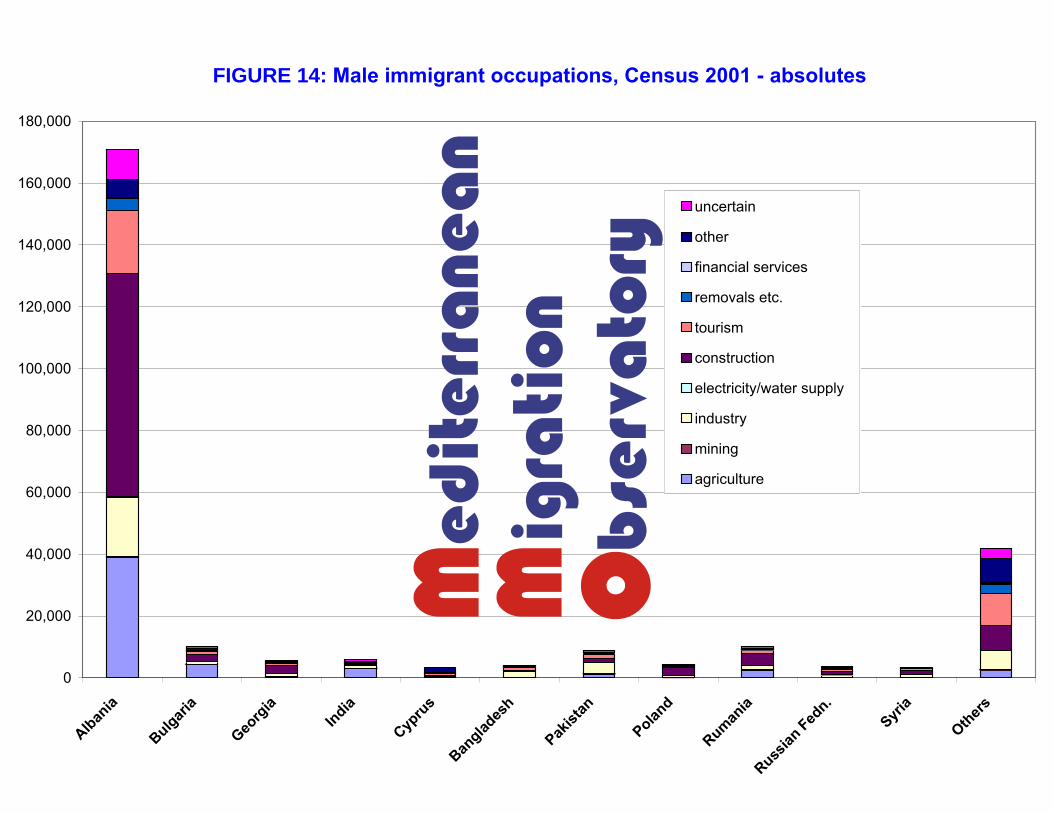
FIGURE 14: Male immigrant occupations, Census 2001 - absolutes
0
20,000
40,000
60,000
80,000
100,000
120,000
140,000
160,000
180,000
Albania
Bulgaria
Georg
ia
India
Cypru
sBan
glades
h
Pakist
an
Poland
Rumania
Russian
Fedn.
Syria
Others
uncertain
other
financial services
removals etc.
tourism
construction
electricity/water supply
industry
mining
agriculture
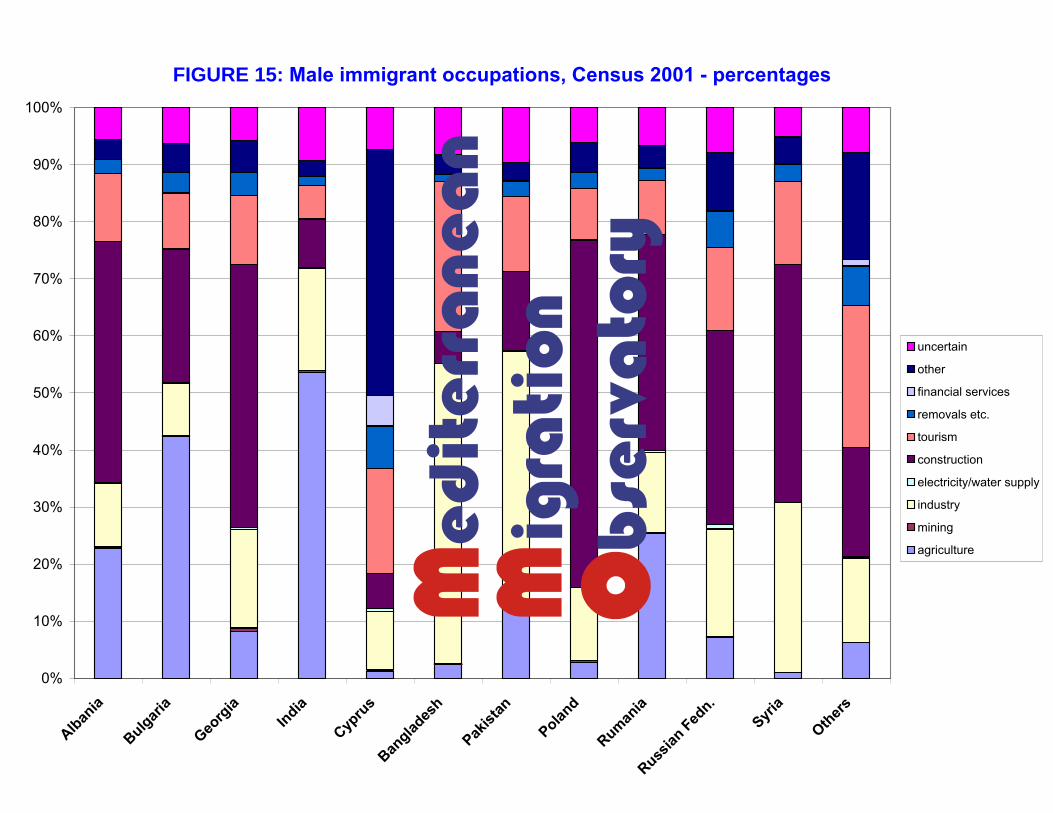
FIGURE 15: Male immigrant occupations, Census 2001 - percentages
0%
10%
20%
30%
40%
50%
60%
70%
80%
90%
100%
Albania
Bulgaria
Georg
ia
India
Cypru
sBan
glades
h
Pakist
an
Poland
Rumania
Russian
Fedn.
Syria
Others
uncertain
other
financial services
removals etc.
tourism
construction
electricity/water supply
industry
mining
agriculture
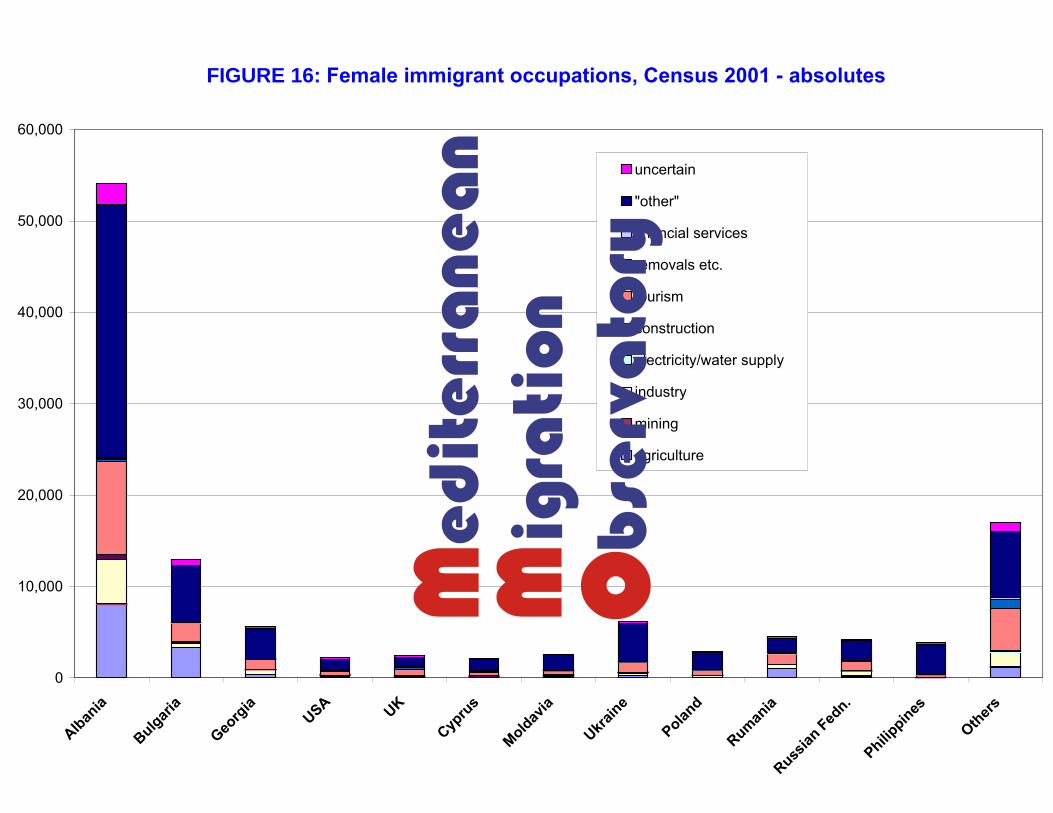
FIGURE 16: Female immigrant occupations, Census 2001 - absolutes
0
10,000
20,000
30,000
40,000
50,000
60,000
Albania
Bulgaria
Georg
ia
USA UK
Cypru
s
Moldavia
Ukraine
Poland
Rumania
Russian
Fedn.
Philippines
Others
uncertain
"other"
financial services
removals etc.
tourism
construction
electricity/water supply
industry
mining
agriculture
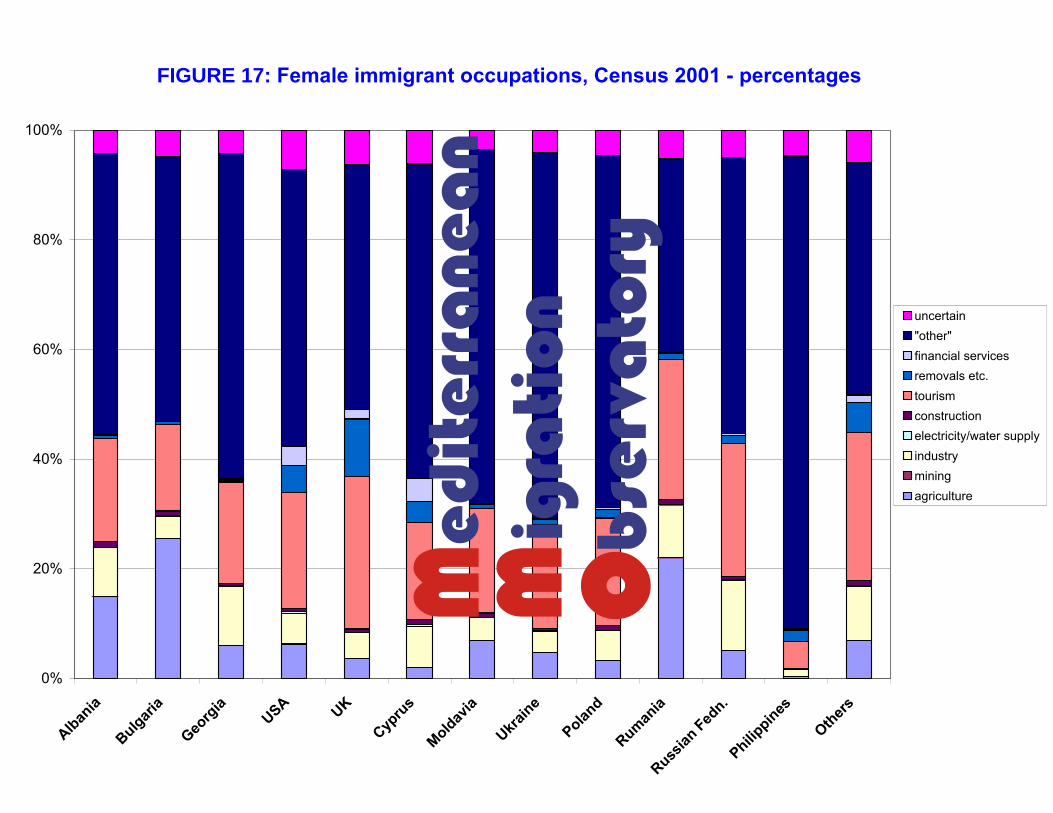
FIGURE 17: Female immigrant occupations, Census 2001 - percentages
0%
20%
40%
60%
80%
100%
Albania
Bulgaria
Georg
ia
USA UK
Cypru
sMoldav
ia
Ukraine
Poland
Rumania
Russian
Fedn.
Philippines
Others
uncertain"other"financial servicesremovals etc.tourismconstructionelectricity/water supplyindustryminingagriculture
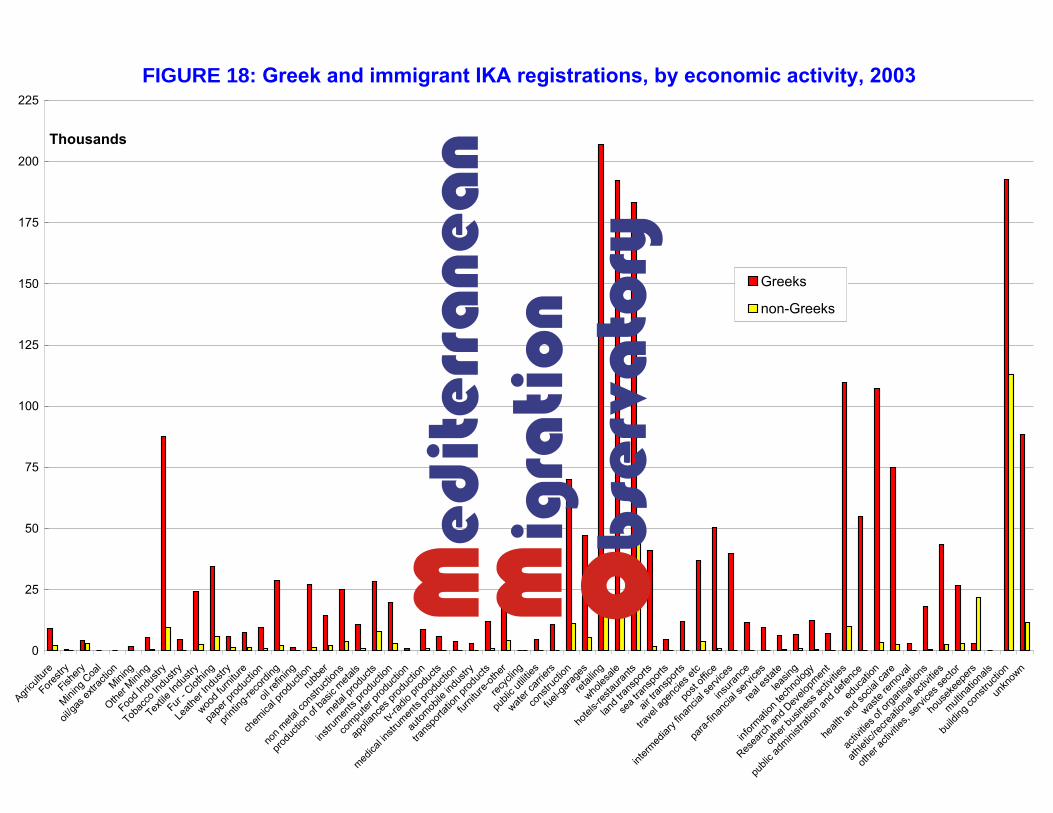
FIGURE 18: Greek and immigrant IKA registrations, by economic activity, 2003
0
25
50
75
100
125
150
175
200
225
Agricu
lture
Forestr
yFish
ery
Mining
Coa
l
oil/ga
s extr
actio
nMini
ng
Other M
ining
Food I
ndus
try
Tobac
co In
dustr
y
Textile
Indu
stry
Fur - C
lothin
g
Leath
er Ind
ustry
wood f
urnitu
re
pape
r prod
uctio
n
printi
ng-re
cordi
ngoil
refin
ing
chem
ical p
roduc
tion
rubbe
r
non m
etal c
onstr
uctio
ns
produ
ction
of ba
sic m
etals
meta
l prod
ucts
instru
ments
produ
ction
compu
ter pr
oduc
tion
appli
ance
s prod
uctio
n
tv-rad
io pro
ducts
medica
l instr
umen
ts pro
ducti
on
autom
obile
indu
stry
trans
porta
tion p
roduc
ts
furnit
ure-ot
her
recyc
ling
publi
c utili
ties
water c
arrier
s
cons
tructi
on
fuel-g
arage
sret
ailing
wholes
ale
hotel
s-res
tauran
ts
land t
ransp
orts
sea t
ransp
orts
air tra
nspo
rts
trave
l age
ncies
etc
post
office
interm
ediar
y fina
ncial
servi
ces
insura
nce
para-
finan
cial s
ervice
srea
l esta
telea
sing
inform
ation
tech
nolog
y
Resea
rch an
d Dev
elopm
ent
other
busin
ess a
ctivit
ies
publi
c adm
inistr
ation
and d
efenc
eed
ucati
on
healt
h and
socia
l care
waste
remov
al
activ
ities o
f orga
nisati
ons
athlet
ic/rec
reatio
nal a
ctivit
ies
other
activ
ities,
servi
ces s
ector
hous
ekee
pers
multina
tiona
ls
build
ing co
nstru
ction
unkn
own
Greeks
non-Greeks
Thousands
15
construction, which insured over 110.000 immigrants in 2003. Also important is the
sector of hotels/restaurants, presumably coinciding with the category of tourism in the
Census: this employed around 45.000 immigrants in 2003. Other sectors with significant
immigrant presence are retail, wholesale, food industry, metal products, “other
construction”, other businesses. The sectors with near-zero immigrant presence are
financial services activities and the state sector generally [although there is a small
presence in education and health/social care].
Looking at non-construction IKA registrations by nationality and gender, Figure 19 shows
the top 17 nationalities for 2002 and 2003. The general pattern is a small increase in IKA
membership over 2002-3 for all national groups other than Russians. The largest
absolute increase is by Albanians, although proportionately Pakistani and Indian
registrations increased significantly.
The employment of male immigrants by economic sector is shown in Figure 20. Out of a
total of 231.750 IKA registrations, the overwhelming importance of construction
[approaching 50% of all male employment] stands out; other important sectors are
retailing (7%), hotels and restaurants (7%), “other construction” (4%), metal products
(3%) and the food industry (3%).
Registrations by economic sector are shown in Figure 21, out of a total of 102.012
female immigrants. Surprisingly, the largest share is in hotels and restaurants (28%),
with housekeeping at only 20%. Following some way below this are wholesale at 7%,
retail at 6% and the food industry at 4%. Unhelpfully, there are large numbers in
“unknown” (7%) and “other” (6%).
Making sense of employment data from the Census, IKA statistics and residence permits Allowing for less than full employment, limited insurance with other agencies and other
factors, the IKA data are broadly in line with the numbers of foreign declared workers in
the Census; but the very small number of women insured for housekeeping is not. Of
course, we assumed (on the strength of published empirical research) that the “Other”
category in the Census data largely means housekeeping: it is possible, though, that
housekeeping was only one of several occupations covered by this category. Another
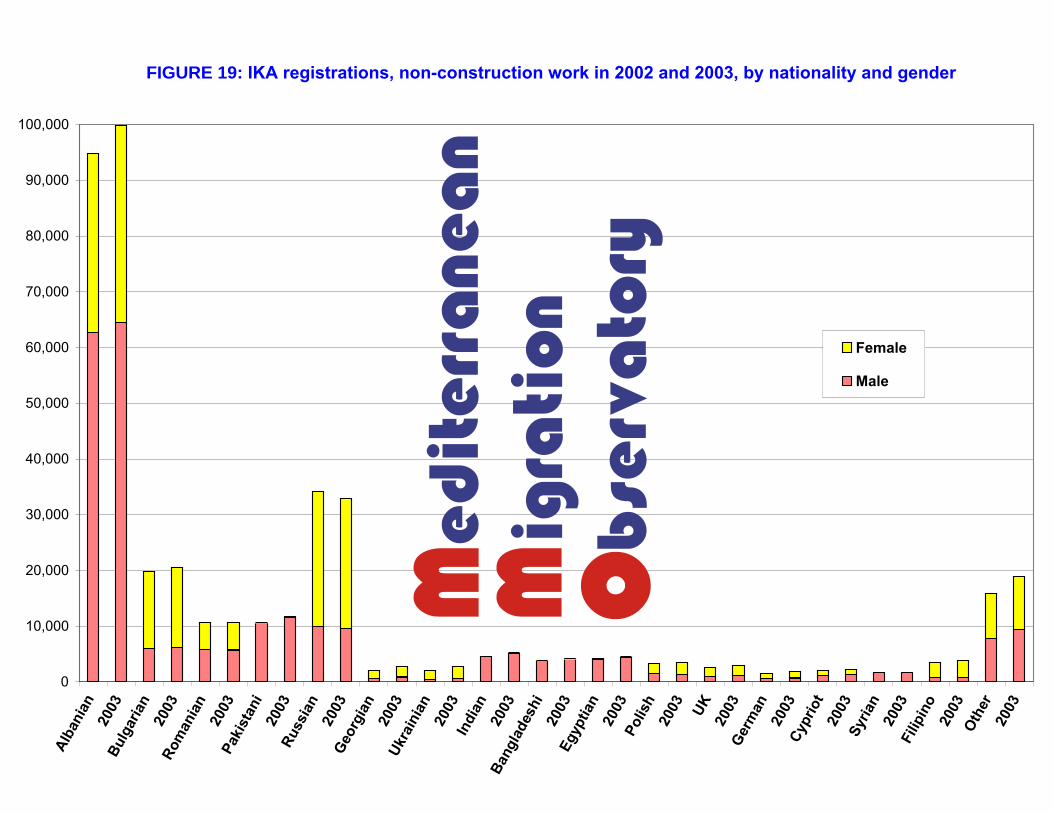
FIGURE 19: IKA registrations, non-construction work in 2002 and 2003, by nationality and gender
0
10,000
20,000
30,000
40,000
50,000
60,000
70,000
80,000
90,000
100,000
Alba
nian
2003
Bulg
aria
n20
03Ro
man
ian
2003
Paki
stan
i20
03Ru
ssia
n20
03Ge
orgi
an20
03Uk
rain
ian
2003
Indi
an20
03Ba
ngla
desh
i20
03Eg
yptia
n20
03Po
lish
2003 UK 2003
Germ
an20
03Cy
prio
t20
03Sy
rian
2003
Filip
ino
2003
Othe
r20
03
Female
Male
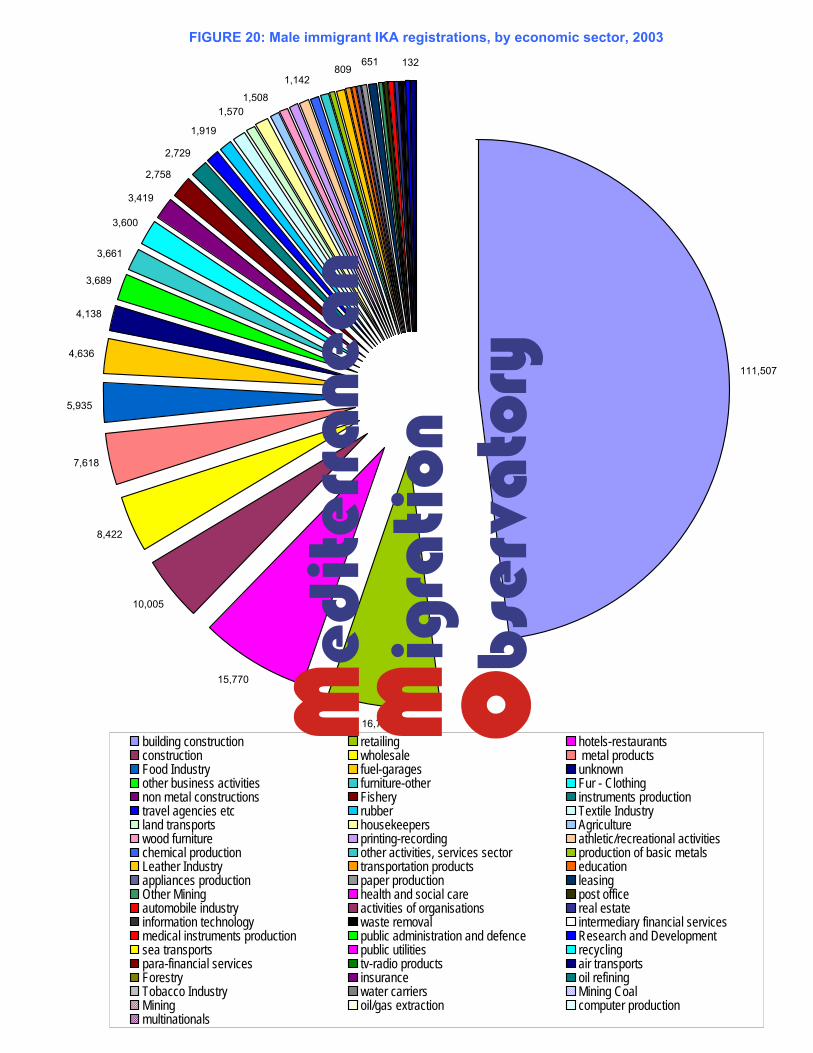
FIGURE 20: Male immigrant IKA registrations, by economic sector, 2003
111,507
16,740
15,770
10,005
8,422
7,618
5,935
4,636
4,138
3,689
3,661
3,600
3,419
2,758
2,729
1,919
1,5701,508
1,142809
132651
building construction retailing hotels-restaurantsconstruction wholesale metal productsFood Industry fuel-garages unknownother business activities furniture-other Fur - Clothingnon metal constructions Fishery instruments productiontravel agencies etc rubber Textile Industryland transports housekeepers Agriculturewood furniture printing-recording athletic/recreational activitieschemical production other activities, services sector production of basic metalsLeather Industry transportation products educationappliances production paper production leasingOther Mining health and social care post officeautomobile industry activities of organisations real estateinformation technology waste removal intermediary financial servicesmedical instruments production public administration and defence Research and Developmentsea transports public utilities recyclingpara-financial services tv-radio products air transportsForestry insurance oil refiningTobacco Industry water carriers Mining CoalMining oil/gas extraction computer productionmultinationals
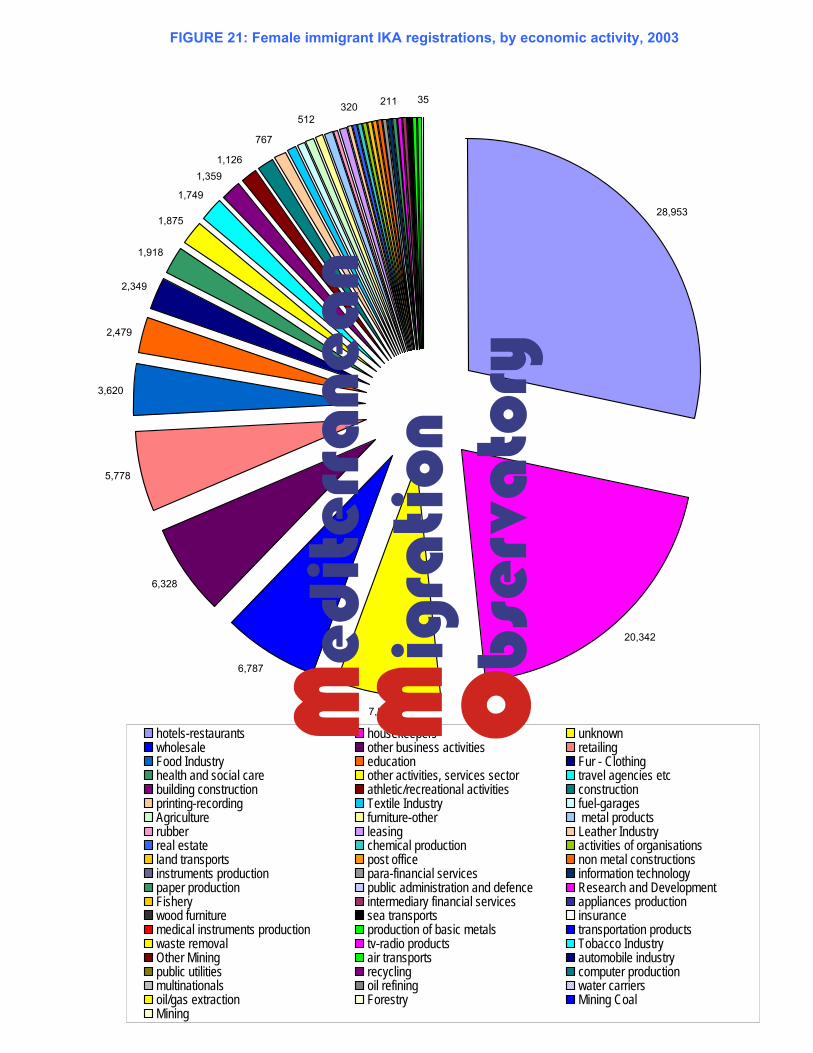
FIGURE 21: Female immigrant IKA registrations, by economic activity, 2003
28,953
20,342
7,504
6,787
6,328
5,778
3,620
2,479
2,349
1,918
1,875
1,749
1,3591,126
767
512320 211 35
hotels-restaurants housekeepers unknownwholesale other business activities retailingFood Industry education Fur - Clothinghealth and social care other activities, services sector travel agencies etcbuilding construction athletic/recreational activities constructionprinting-recording Textile Industry fuel-garagesAgriculture furniture-other metal productsrubber leasing Leather Industryreal estate chemical production activities of organisationsland transports post office non metal constructionsinstruments production para-financial services information technologypaper production public administration and defence Research and DevelopmentFishery intermediary financial services appliances productionwood furniture sea transports insurancemedical instruments production production of basic metals transportation productswaste removal tv-radio products Tobacco IndustryOther Mining air transports automobile industrypublic utilities recycling computer productionmultinationals oil refining water carriersoil/gas extraction Forestry Mining CoalMining
16
possibility is that immigrant women have shifted their employment to other sectors,
owing to the difficulty of being insured by Greek employers – a requirement enforced by
the Ministry of Labour for renewal of work permits. Another possibility is that many
women have withdrawn from the formal labour market, if they have been able to acquire
family reunification residence rights. Thus, housekeeping work may have continued to
exist largely in the informal economy.
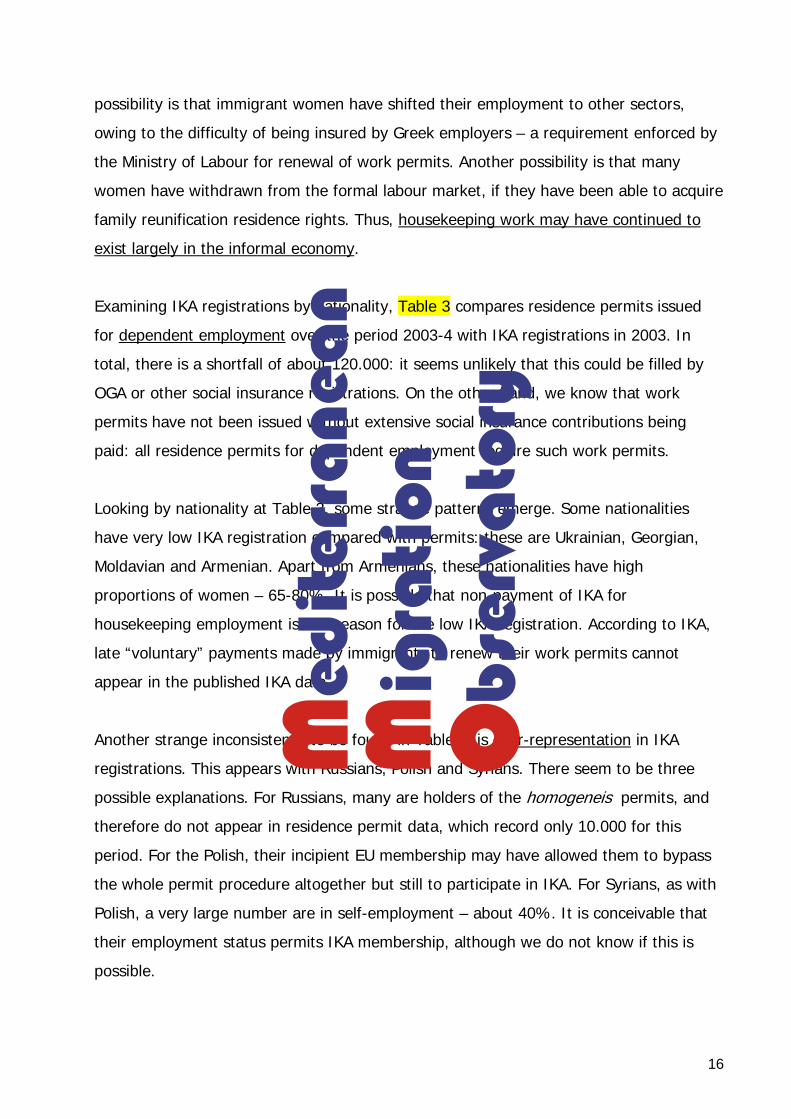
Examining IKA registrations by nationality, Table 3 compares residence permits issued
for dependent employment over the period 2003-4 with IKA registrations in 2003. In
total, there is a shortfall of about 120.000: it seems unlikely that this could be filled by
OGA or other social insurance registrations. On the other hand, we know that work
permits have not been issued without extensive social insurance contributions being
paid: all residence permits for dependent employment require such work permits.
Looking by nationality at Table 3, some strange patterns emerge. Some nationalities
have very low IKA registration compared with permits: these are Ukrainian, Georgian,
Moldavian and Armenian. Apart from Armenians, these nationalities have high
proportions of women – 65-80%. It is possible that non-payment of IKA for
housekeeping employment is one reason for the low IKA registration. According to IKA,
late “voluntary” payments made by immigrants to renew their work permits cannot
appear in the published IKA data.
Another strange inconsistency to be found in Table 3, is over-representation in IKA
registrations. This appears with Russians, Polish and Syrians. There seem to be three
possible explanations. For Russians, many are holders of the homogeneis permits, and
therefore do not appear in residence permit data, which record only 10.000 for this
period. For the Polish, their incipient EU membership may have allowed them to bypass
the whole permit procedure altogether but still to participate in IKA. For Syrians, as with
Polish, a very large number are in self-employment – about 40%. It is conceivable that
their employment status permits IKA membership, although we do not know if this is
possible.
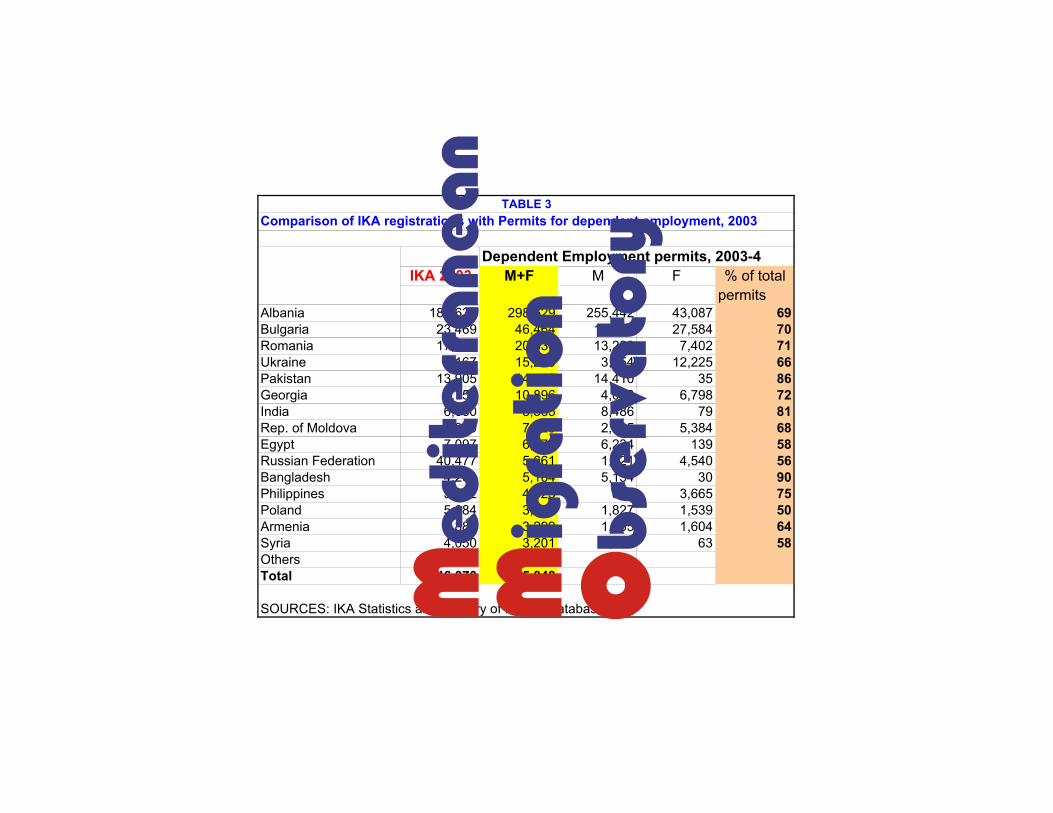
Dependent Employment permits, 2003-4IKA 2003 M+F M F % of total
permitsAlbania 185,636 298,529 255,442 43,087 69Bulgaria 23,469 46,464 18,880 27,584 70Romania 17,174 20,630 13,228 7,402 71Ukraine 3,167 15,279 3,054 12,225 66Pakistan 13,905 14,445 14,410 35 86Georgia 3,750 10,896 4,098 6,798 72India 6,050 8,565 8,486 79 81Rep. of Moldova 1,339 7,829 2,445 5,384 68Egypt 7,097 6,373 6,234 139 58Russian Federation 40,477 5,661 1,121 4,540 56Bangladesh 4,264 5,164 5,134 30 90Philippines 3,872 4,523 858 3,665 75Poland 5,084 3,366 1,827 1,539 50Armenia 885 3,299 1,695 1,604 64Syria 4,050 3,201 3,138 63 58Others 25,851 11,624Total 346,070 465,848
SOURCES: IKA Statistics and Ministry of Interior database
Comparison of IKA registrations with Permits for dependent employment, 2003TABLE 3
17
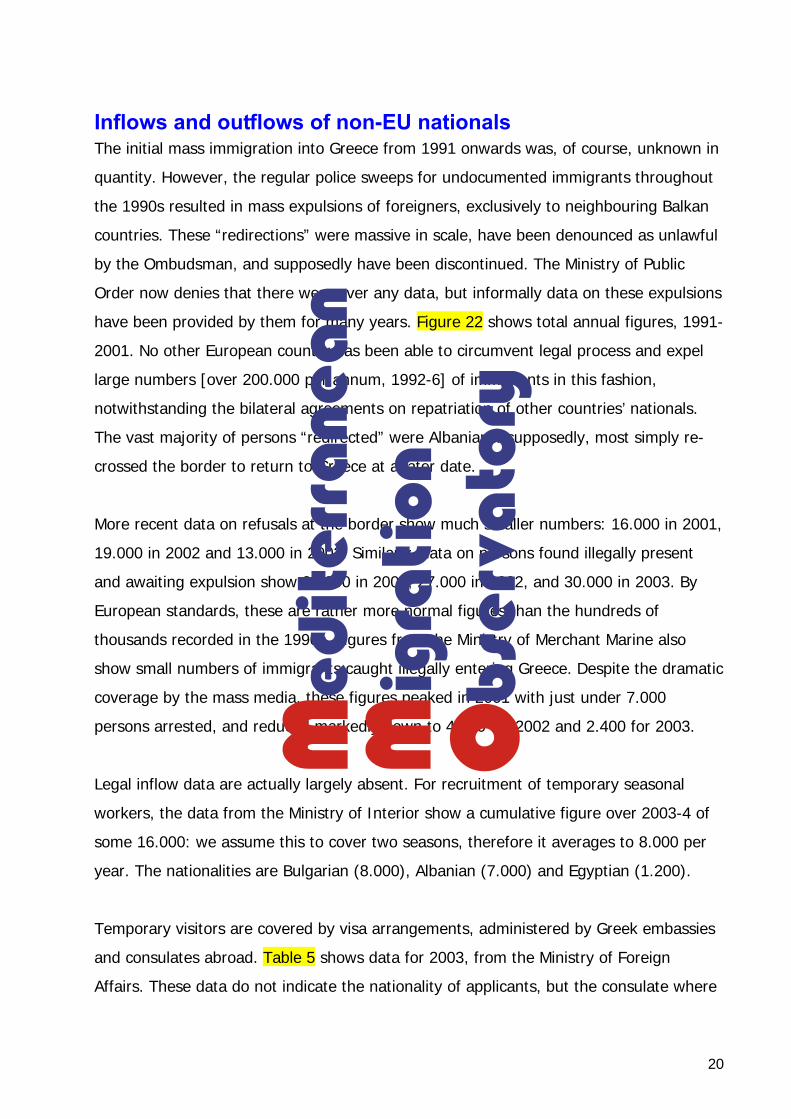
Overall, the nominal IKA membership levels look a little too low compared with residence
permit data. In particular, the insured employment of housekeepers seems strangely
low. Furthermore, the 2003 legislative amendment “allowing” immigrants to pay their
employers’ missing social insurance contributions is a contributory factor in obscuring the
economic realities of immigrants’ work. Not only is it a discriminatory transfer of financial
obligation from (Greek) employers onto the immigrant workers, functioning as an
additional form of tax which Greeks themselves do not have to pay, it is also a serious
problem for economic analysis. If national statistical data do not reliably reflect the
economic reality, then management of the economy and related issues becomes near
impossible. Whilst imposing rigid rules for issuing work permits and payment of social
insurance, the Ministry of Labour makes no serious effort to collect the data for which it
is responsible, nor does it conduct any analysis of immigrants’ role in the Greek labour
market.

18
Immigrant children in Greek state schools In the initial phase of mass immigration into Greece in the early 1990s, there seemed to
be few immigrant children: certainly, those who had arrived were not generally admitted
into the state schooling system, as they were the children of illegal immigrants.
However, there was always – and remains – a serious problem of exploitation of
Albanian and other children for begging and prostitution.
Since the mid-1990s, there has been a highly visible increase in the number of
immigrant children recorded in state schools. This is partly because of more recent
toleration of the undocumented status of their parents (as required by the UN
Convention on the Rights of the Child), partly because of the legalisation programmes
since 1997, and partly through the advent of family reunification measures allowed by
the Greek state. Thus, Greece has started to move into a new phase of immigration,
where family settlement is becoming evident – and most especially of Albanian families.
Of course, since the influxes of ethnic Greeks in the 1980s, along with “returning Greeks”
from the USA and elsewhere, the Ministry of Education has had some programme for
rapid language acquisition in the so-called Intercultural Schools. However, with declining
school rolls of Greeks, it is the non-Greek immigrants especially who are making up for
the demographic decline of the Greek population.
There is no reliable time-series of even global figures for immigrant children in Greek
schools, although we have tried to assemble a crude time series as illustrated in Figure
1. According to our unofficial data, there has been a rapid increase in total foreign
student numbers (including homogeneis) from 44.000 in primary and secondary
education in 1996, through 86.000 in 2000, and reaching 119.000 in 2003. With
declining numbers of Greek children, this has meant an even bigger increase in the
proportion of foreign students in the school system. However, the ratio of 10,6% in
primary education for 2002/3 can be expected to increase in the next few years, if the
residence permit data for 2003-4 are accurate, since they imply much higher numbers of
total immigrants and especially Albanians.

19
The Ministry of Education has published data for the school year 2002/3, showing some
97.000 non-ethnic Greek children and 31.000 ethnic Greek children in the state school
system. In both cases, although much more so for allogeneis, the majority are in primary
school; also, for both homogeneis and allogeneis, the drop-out rate of male students
before high school or TEE is indicated by the significantly higher number of female
students at that level.
Data on foreign students remain patchy and inconsistent, especially with regard to
nationality. Table 4 shows the latest data from the Ministry of Education, where country
of birth is used as a proxy for citizenship. The vast majority of immigrant children in the
state school system are Albanian – over 72%, as compared with 56% of foreign
population in the Census. This high propertion is partly because Albanian immigrants
tend to be younger and with larger families, and also because some other nationalities,
such as American or British, tend to send their children to expensive private schools.
Other ethnic groups also have their own schools, such as the Polish and Arabic schools in
Athens.
Looking at Table 4, there are few surprises – if one accepts the country of birth as a
proxy for citizenship of the children. However, over 10% [some 10.000 children] have
been born in Greece. It is unlikely that more than a few, of mixed marriages, have
acquired Greek citizenship: therefore, their actual citizenship is unknown. Presumably,
the vast majority are Albanian, but some data on this are urgently needed. In particular,
the nationalities of both parents should be included in such data, as this is essential
information not only for the condition and reality of the child’s homelife, but also for
public policy.
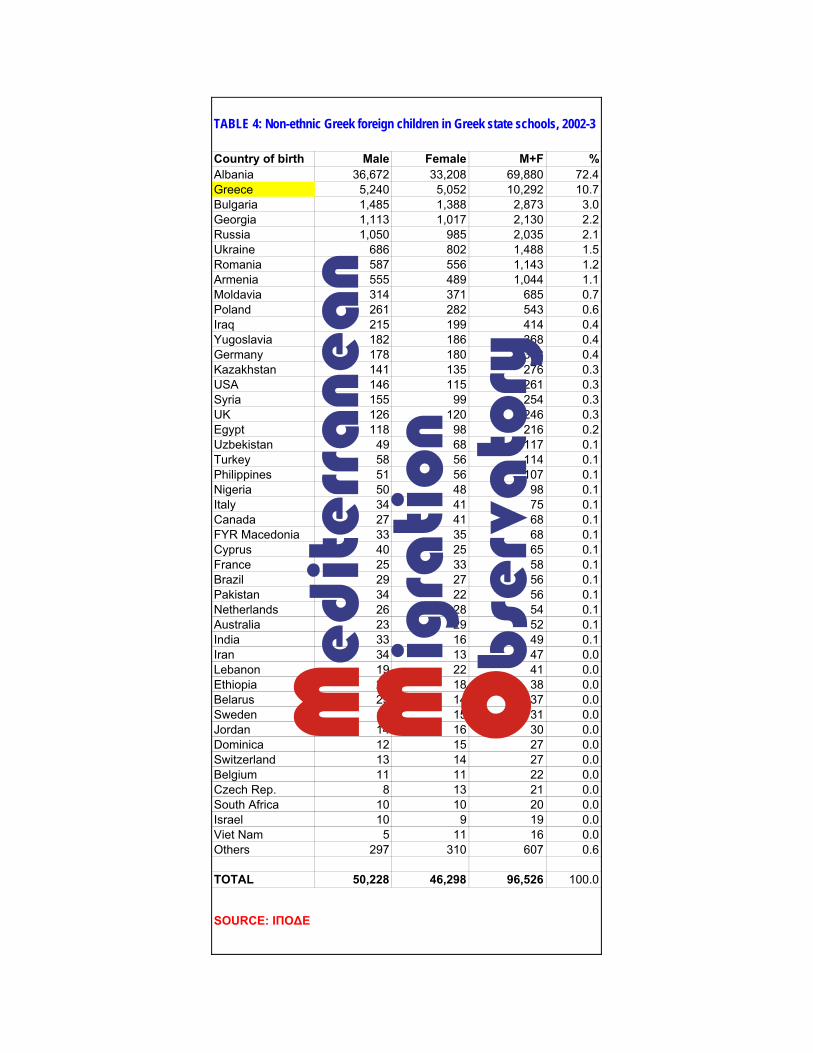
Country of birth Male Female M+F %Albania 36,672 33,208 69,880 72.4Greece 5,240 5,052 10,292 10.7Bulgaria 1,485 1,388 2,873 3.0Georgia 1,113 1,017 2,130 2.2Russia 1,050 985 2,035 2.1Ukraine 686 802 1,488 1.5Romania 587 556 1,143 1.2Armenia 555 489 1,044 1.1Moldavia 314 371 685 0.7Poland 261 282 543 0.6Iraq 215 199 414 0.4Yugoslavia 182 186 368 0.4Germany 178 180 358 0.4Kazakhstan 141 135 276 0.3USA 146 115 261 0.3Syria 155 99 254 0.3UK 126 120 246 0.3Egypt 118 98 216 0.2Uzbekistan 49 68 117 0.1Turkey 58 56 114 0.1Philippines 51 56 107 0.1Nigeria 50 48 98 0.1Italy 34 41 75 0.1Canada 27 41 68 0.1FYR Macedonia 33 35 68 0.1Cyprus 40 25 65 0.1France 25 33 58 0.1Brazil 29 27 56 0.1Pakistan 34 22 56 0.1Netherlands 26 28 54 0.1Australia 23 29 52 0.1India 33 16 49 0.1Iran 34 13 47 0.0Lebanon 19 22 41 0.0Ethiopia 20 18 38 0.0Belarus 23 14 37 0.0Sweden 16 15 31 0.0Jordan 14 16 30 0.0Dominica 12 15 27 0.0Switzerland 13 14 27 0.0Belgium 11 11 22 0.0Czech Rep. 8 13 21 0.0South Africa 10 10 20 0.0Israel 10 9 19 0.0Viet Nam 5 11 16 0.0Others 297 310 607 0.6
TOTAL 50,228 46,298 96,526 100.0
SOURCE: ΙΠΟ∆Ε
TABLE 4: Non-ethnic Greek foreign children in Greek state schools, 2002-3
20
Inflows and outflows of non-EU nationals The initial mass immigration into Greece from 1991 onwards was, of course, unknown in
quantity. However, the regular police sweeps for undocumented immigrants throughout
the 1990s resulted in mass expulsions of foreigners, exclusively to neighbouring Balkan
countries. These “redirections” were massive in scale, have been denounced as unlawful
by the Ombudsman, and supposedly have been discontinued. The Ministry of Public
Order now denies that there were ever any data, but informally data on these expulsions
have been provided by them for many years. Figure 22 shows total annual figures, 1991-
2001. No other European country has been able to circumvent legal process and expel
large numbers [over 200.000 per annum, 1992-6] of immigrants in this fashion,
notwithstanding the bilateral agreements on repatriation of other countries’ nationals.
The vast majority of persons “redirected” were Albanians: supposedly, most simply re-
crossed the border to return to Greece at a later date.
More recent data on refusals at the border show much smaller numbers: 16.000 in 2001,
19.000 in 2002 and 13.000 in 2003. Similarly, data on persons found illegally present
and awaiting expulsion show 20.000 in 2001, 27.000 in 2002, and 30.000 in 2003. By
European standards, these are rather more normal figures than the hundreds of
thousands recorded in the 1990s. Figures from the Ministry of Merchant Marine also
show small numbers of immigrants caught illegally entering Greece. Despite the dramatic
coverage by the mass media, these figures peaked in 2001 with just under 7.000
persons arrested, and reduced markedly down to 4.000 for 2002 and 2.400 for 2003.
Legal inflow data are actually largely absent. For recruitment of temporary seasonal
workers, the data from the Ministry of Interior show a cumulative figure over 2003-4 of
some 16.000: we assume this to cover two seasons, therefore it averages to 8.000 per
year. The nationalities are Bulgarian (8.000), Albanian (7.000) and Egyptian (1.200).
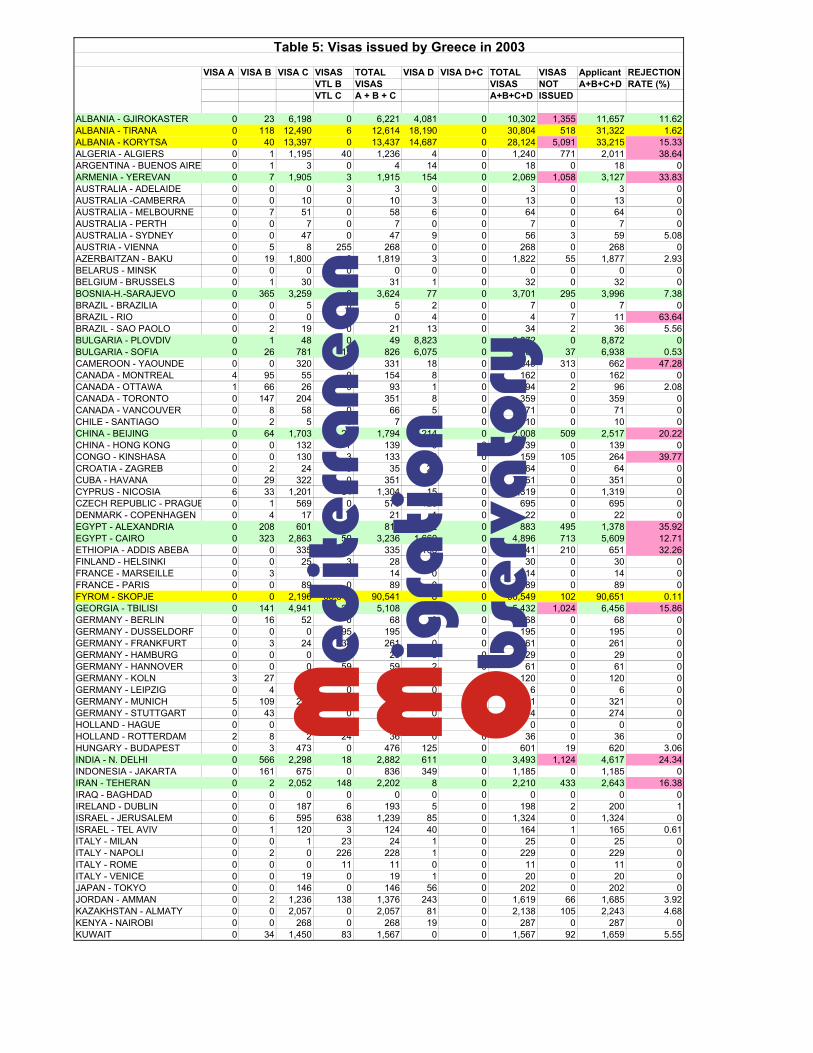
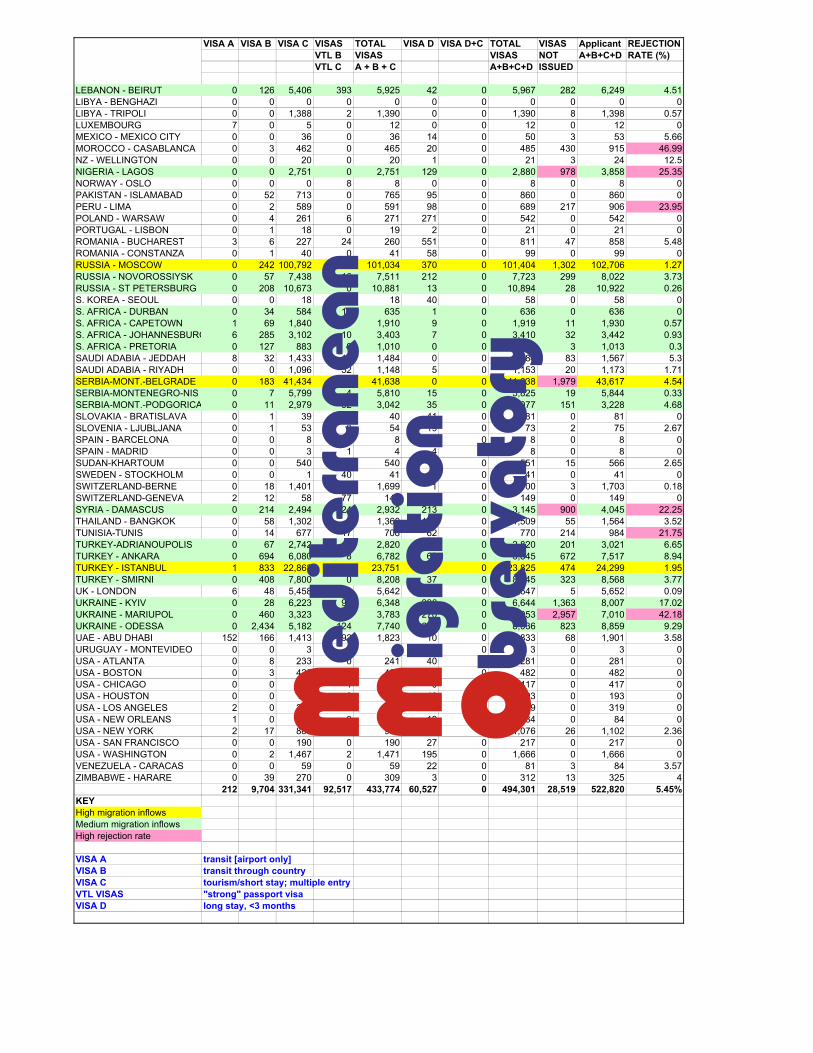
Temporary visitors are covered by visa arrangements, administered by Greek embassies
and consulates abroad. Table 5 shows data for 2003, from the Ministry of Foreign
Affairs. These data do not indicate the nationality of applicants, but the consulate where
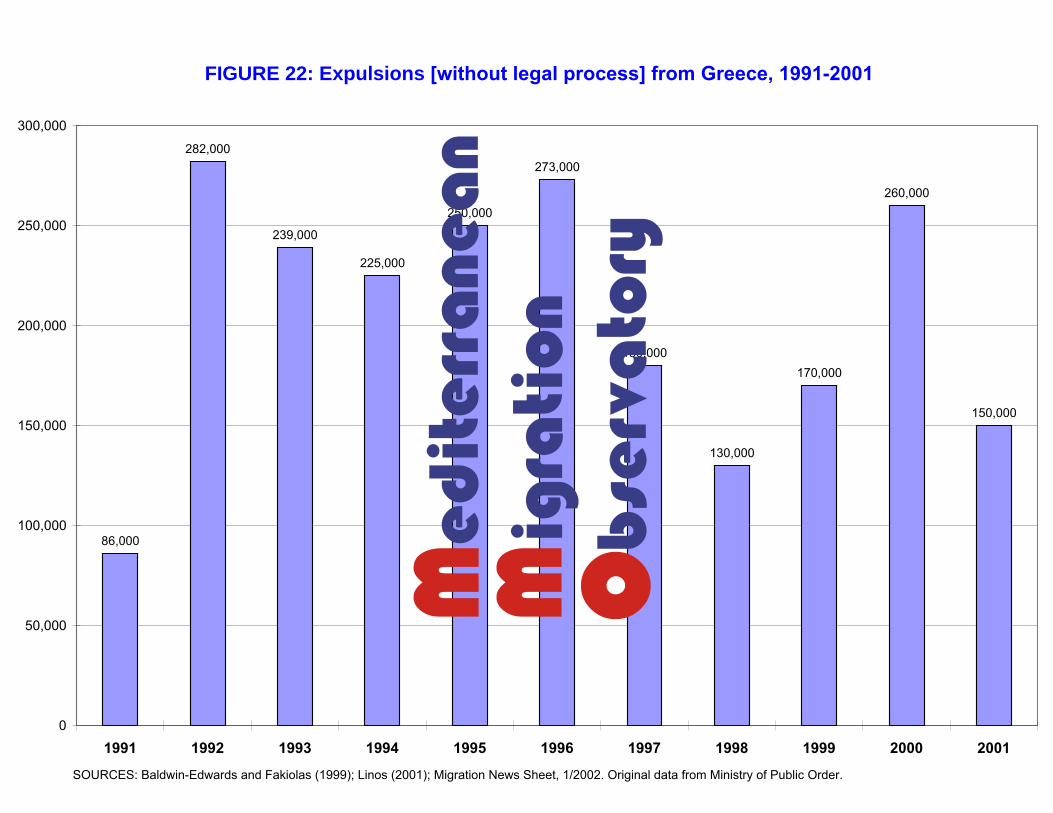
SOURCES: Baldwin-Edwards and Fakiolas (1999); Linos (2001); Migration News Sheet, 1/2002. Original data from Ministry of Public Order.
FIGURE 22: Expulsions [without legal process] from Greece, 1991-2001
86,000
282,000
239,000
225,000
250,000
273,000
180,000
130,000
170,000
260,000
150,000
0
50,000
100,000
150,000
200,000
250,000
300,000
1991 1992 1993 1994 1995 1996 1997 1998 1999 2000 2001
VISA A VISA B VISA C VISAS TOTAL VISA D VISA D+C TOTAL VISAS Applicant REJECTIONVTL B VISAS VISAS NOT A+B+C+D RATE (%)VTL C A + B + C A+B+C+D ISSUED
ALBANIA - GJIROKASTER 0 23 6,198 0 6,221 4,081 0 10,302 1,355 11,657 11.62ALBANIA - TIRANA 0 118 12,490 6 12,614 18,190 0 30,804 518 31,322 1.62ALBANIA - KORYTSA 0 40 13,397 0 13,437 14,687 0 28,124 5,091 33,215 15.33ALGERIA - ALGIERS 0 1 1,195 40 1,236 4 0 1,240 771 2,011 38.64ARGENTINA - BUENOS AIRE 0 1 3 0 4 14 0 18 0 18 0ARMENIA - YEREVAN 0 7 1,905 3 1,915 154 0 2,069 1,058 3,127 33.83AUSTRALIA - ADELAIDE 0 0 0 3 3 0 0 3 0 3 0AUSTRALIA -CAMBERRA 0 0 10 0 10 3 0 13 0 13 0AUSTRALIA - MELBOURNE 0 7 51 0 58 6 0 64 0 64 0AUSTRALIA - PERTH 0 0 7 0 7 0 0 7 0 7 0AUSTRALIA - SYDNEY 0 0 47 0 47 9 0 56 3 59 5.08AUSTRIA - VIENNA 0 5 8 255 268 0 0 268 0 268 0AZERBAITZAN - BAKU 0 19 1,800 0 1,819 3 0 1,822 55 1,877 2.93BELARUS - MINSK 0 0 0 0 0 0 0 0 0 0 0BELGIUM - BRUSSELS 0 1 30 0 31 1 0 32 0 32 0BOSNIA-H.-SARAJEVO 0 365 3,259 0 3,624 77 0 3,701 295 3,996 7.38BRAZIL - BRAZILIA 0 0 5 0 5 2 0 7 0 7 0BRAZIL - RIO 0 0 0 0 0 4 0 4 7 11 63.64BRAZIL - SAO PAOLO 0 2 19 0 21 13 0 34 2 36 5.56BULGARIA - PLOVDIV 0 1 48 0 49 8,823 0 8,872 0 8,872 0BULGARIA - SOFIA 0 26 781 19 826 6,075 0 6,901 37 6,938 0.53CAMEROON - YAOUNDE 0 0 320 11 331 18 0 349 313 662 47.28CANADA - MONTREAL 4 95 55 0 154 8 0 162 0 162 0CANADA - OTTAWA 1 66 26 0 93 1 0 94 2 96 2.08CANADA - TORONTO 0 147 204 0 351 8 0 359 0 359 0CANADA - VANCOUVER 0 8 58 0 66 5 0 71 0 71 0CHILE - SANTIAGO 0 2 5 0 7 3 0 10 0 10 0CHINA - BEIJING 0 64 1,703 27 1,794 214 0 2,008 509 2,517 20.22CHINA - HONG KONG 0 0 132 7 139 0 0 139 0 139 0CONGO - KINSHASA 0 0 130 3 133 26 0 159 105 264 39.77CROATIA - ZAGREB 0 2 24 9 35 29 0 64 0 64 0CUBA - HAVANA 0 29 322 0 351 0 0 351 0 351 0CYPRUS - NICOSIA 6 33 1,201 64 1,304 15 0 1,319 0 1,319 0CZECH REPUBLIC - PRAGUE 0 1 569 0 570 125 0 695 0 695 0DENMARK - COPENHAGEN 0 4 17 0 21 1 0 22 0 22 0EGYPT - ALEXANDRIA 0 208 601 2 811 72 0 883 495 1,378 35.92EGYPT - CAIRO 0 323 2,863 50 3,236 1,660 0 4,896 713 5,609 12.71ETHIOPIA - ADDIS ABEBA 0 0 335 0 335 106 0 441 210 651 32.26FINLAND - HELSINKI 0 0 25 3 28 2 0 30 0 30 0FRANCE - MARSEILLE 0 3 1 10 14 0 0 14 0 14 0FRANCE - PARIS 0 0 89 0 89 0 0 89 0 89 0FYROM - SKOPJE 0 0 2,196 88,345 90,541 8 0 90,549 102 90,651 0.11GEORGIA - TBILISI 0 141 4,941 26 5,108 324 0 5,432 1,024 6,456 15.86GERMANY - BERLIN 0 16 52 0 68 0 0 68 0 68 0GERMANY - DUSSELDORF 0 0 0 195 195 0 0 195 0 195 0GERMANY - FRANKFURT 0 3 24 234 261 0 0 261 0 261 0GERMANY - HAMBURG 0 0 0 29 29 0 0 29 0 29 0GERMANY - HANNOVER 0 0 0 59 59 2 0 61 0 61 0GERMANY - KOLN 3 27 90 0 120 0 0 120 0 120 0GERMANY - LEIPZIG 0 4 2 0 6 0 0 6 0 6 0GERMANY - MUNICH 5 109 207 0 321 0 0 321 0 321 0GERMANY - STUTTGART 0 43 231 0 274 0 0 274 0 274 0HOLLAND - HAGUE 0 0 0 0 0 0 0 0 0 0 0HOLLAND - ROTTERDAM 2 8 2 24 36 0 0 36 0 36 0HUNGARY - BUDAPEST 0 3 473 0 476 125 0 601 19 620 3.06INDIA - N. DELHI 0 566 2,298 18 2,882 611 0 3,493 1,124 4,617 24.34INDONESIA - JAKARTA 0 161 675 0 836 349 0 1,185 0 1,185 0IRAN - TEHERAN 0 2 2,052 148 2,202 8 0 2,210 433 2,643 16.38IRAQ - BAGHDAD 0 0 0 0 0 0 0 0 0 0 0IRELAND - DUBLIN 0 0 187 6 193 5 0 198 2 200 1ISRAEL - JERUSALEM 0 6 595 638 1,239 85 0 1,324 0 1,324 0ISRAEL - TEL AVIV 0 1 120 3 124 40 0 164 1 165 0.61ITALY - MILAN 0 0 1 23 24 1 0 25 0 25 0ITALY - NAPOLI 0 2 0 226 228 1 0 229 0 229 0ITALY - ROME 0 0 0 11 11 0 0 11 0 11 0ITALY - VENICE 0 0 19 0 19 1 0 20 0 20 0JAPAN - TOKYO 0 0 146 0 146 56 0 202 0 202 0JORDAN - AMMAN 0 2 1,236 138 1,376 243 0 1,619 66 1,685 3.92KAZAKHSTAN - ALMATY 0 0 2,057 0 2,057 81 0 2,138 105 2,243 4.68KENYA - NAIROBI 0 0 268 0 268 19 0 287 0 287 0KUWAIT 0 34 1,450 83 1,567 0 0 1,567 92 1,659 5.55
Table 5: Visas issued by Greece in 2003
VISA A VISA B VISA C VISAS TOTAL VISA D VISA D+C TOTAL VISAS Applicant REJECTIONVTL B VISAS VISAS NOT A+B+C+D RATE (%)VTL C A + B + C A+B+C+D ISSUED
LEBANON - BEIRUT 0 126 5,406 393 5,925 42 0 5,967 282 6,249 4.51LIBYA - BENGHAZI 0 0 0 0 0 0 0 0 0 0 0LIBYA - TRIPOLI 0 0 1,388 2 1,390 0 0 1,390 8 1,398 0.57LUXEMBOURG 7 0 5 0 12 0 0 12 0 12 0MEXICO - MEXICO CITY 0 0 36 0 36 14 0 50 3 53 5.66MOROCCO - CASABLANCA 0 3 462 0 465 20 0 485 430 915 46.99NZ - WELLINGTON 0 0 20 0 20 1 0 21 3 24 12.5NIGERIA - LAGOS 0 0 2,751 0 2,751 129 0 2,880 978 3,858 25.35NORWAY - OSLO 0 0 0 8 8 0 0 8 0 8 0PAKISTAN - ISLAMABAD 0 52 713 0 765 95 0 860 0 860 0PERU - LIMA 0 2 589 0 591 98 0 689 217 906 23.95POLAND - WARSAW 0 4 261 6 271 271 0 542 0 542 0PORTUGAL - LISBON 0 1 18 0 19 2 0 21 0 21 0ROMANIA - BUCHAREST 3 6 227 24 260 551 0 811 47 858 5.48ROMANIA - CONSTANZA 0 1 40 0 41 58 0 99 0 99 0RUSSIA - MOSCOW 0 242 100,792 0 101,034 370 0 101,404 1,302 102,706 1.27RUSSIA - NOVOROSSIYSK 0 57 7,438 16 7,511 212 0 7,723 299 8,022 3.73RUSSIA - ST PETERSBURG 0 208 10,673 0 10,881 13 0 10,894 28 10,922 0.26S. KOREA - SEOUL 0 0 18 0 18 40 0 58 0 58 0S. AFRICA - DURBAN 0 34 584 17 635 1 0 636 0 636 0S. AFRICA - CAPETOWN 1 69 1,840 0 1,910 9 0 1,919 11 1,930 0.57S. AFRICA - JOHANNESBURG 6 285 3,102 10 3,403 7 0 3,410 32 3,442 0.93S. AFRICA - PRETORIA 0 127 883 0 1,010 0 0 1,010 3 1,013 0.3SAUDI ADABIA - JEDDAH 8 32 1,433 11 1,484 0 0 1,484 83 1,567 5.3SAUDI ADABIA - RIYADH 0 0 1,096 52 1,148 5 0 1,153 20 1,173 1.71SERBIA-MONT.-BELGRADE 0 183 41,434 21 41,638 0 0 41,638 1,979 43,617 4.54SERBIA-MONTENEGRO-NIS 0 7 5,799 4 5,810 15 0 5,825 19 5,844 0.33SERBIA-MONT.-PODGORICA 0 11 2,979 52 3,042 35 0 3,077 151 3,228 4.68SLOVAKIA - BRATISLAVA 0 1 39 0 40 41 0 81 0 81 0SLOVENIA - LJUBLJANA 0 1 53 0 54 19 0 73 2 75 2.67SPAIN - BARCELONA 0 0 8 0 8 0 0 8 0 8 0SPAIN - MADRID 0 0 3 1 4 4 0 8 0 8 0SUDAN-KHARTOUM 0 0 540 0 540 11 0 551 15 566 2.65SWEDEN - STOCKHOLM 0 0 1 40 41 0 0 41 0 41 0SWITZERLAND-BERNE 0 18 1,401 280 1,699 1 0 1,700 3 1,703 0.18SWITZERLAND-GENEVA 2 12 58 77 149 0 0 149 0 149 0SYRIA - DAMASCUS 0 214 2,494 224 2,932 213 0 3,145 900 4,045 22.25THAILAND - BANGKOK 0 58 1,302 0 1,360 149 0 1,509 55 1,564 3.52TUNISIA-TUNIS 0 14 677 17 708 62 0 770 214 984 21.75TURKEY-ADRIANOUPOLIS 0 67 2,742 11 2,820 0 0 2,820 201 3,021 6.65TURKEY - ANKARA 0 694 6,080 8 6,782 63 0 6,845 672 7,517 8.94TURKEY - ISTANBUL 1 833 22,868 49 23,751 74 0 23,825 474 24,299 1.95TURKEY - SMIRNI 0 408 7,800 0 8,208 37 0 8,245 323 8,568 3.77UK - LONDON 6 48 5,458 130 5,642 5 0 5,647 5 5,652 0.09UKRAINE - KYIV 0 28 6,223 97 6,348 296 0 6,644 1,363 8,007 17.02UKRAINE - MARIUPOL 0 460 3,323 0 3,783 270 0 4,053 2,957 7,010 42.18UKRAINE - ODESSA 0 2,434 5,182 124 7,740 296 0 8,036 823 8,859 9.29UAE - ABU DHABI 152 166 1,413 92 1,823 10 0 1,833 68 1,901 3.58URUGUAY - MONTEVIDEO 0 0 3 0 3 0 0 3 0 3 0USA - ATLANTA 0 8 233 0 241 40 0 281 0 281 0USA - BOSTON 0 3 423 0 426 56 0 482 0 482 0USA - CHICAGO 0 0 416 1 417 0 0 417 0 417 0USA - HOUSTON 0 0 150 0 150 43 0 193 0 193 0USA - LOS ANGELES 2 0 274 2 278 41 0 319 0 319 0USA - NEW ORLEANS 1 0 64 0 65 19 0 84 0 84 0USA - NEW YORK 2 17 885 28 932 144 0 1,076 26 1,102 2.36USA - SAN FRANCISCO 0 0 190 0 190 27 0 217 0 217 0USA - WASHINGTON 0 2 1,467 2 1,471 195 0 1,666 0 1,666 0VENEZUELA - CARACAS 0 0 59 0 59 22 0 81 3 84 3.57ZIMBABWE - HARARE 0 39 270 0 309 3 0 312 13 325 4
212 9,704 331,341 92,517 433,774 60,527 0 494,301 28,519 522,820 5.45%KEYHigh migration inflowsMedium migration inflowsHigh rejection rate
VISA A transit [airport only]VISA B transit through countryVISA C tourism/short stay; multiple entryVTL VISAS "strong" passport visaVISA D long stay, <3 months
21
the applications were processed. They are, therefore, a proxy only of nationality of
applicants. There is no clear indication in the data for the reason of entry.
As can be seen from the Table, the most important points of legal entry to Greece are:
Moscow, Skopje, Belgrade, Albania and Istanbul. The total of visas granted for 2003 was
just under 500.000: clearly, overstayers out of this number could reach significant levels
on an annual basis. As fas as we know, there is no information available on departures
from Greece, in contrast with some other EU countries (such as Spain) which record
these data. Countries whose nationals are thought likely to overstay or apply for asylum
are subjected to greater scrutiny in the visa process, and rejection rates are higher:
these are indicated in red on the Table. They include, in order of rejection rate, Brazil,
Morocco, Ukraine, Cameroon, Congo, Algeria, Egypt, Armenia, Ethiopia, Nigeria, India,
Peru, Syria.
22
NOTES 1 METHODOLOGY USED IN COMPILING Figure 1: Evolution of legal and undocumented non-EU immigrant stock Census data: Total normally resident population without Greek citizenship, minus EU (15) population. These figures therefore should include homogeneis and minors; however, our research has revealed that the 2001 Census did not record homogeneis as foreign nationals [see Part B, below]. With residence permit or registration for legalisation: 1988-1997, valid residence permits for non-EU/EFTA residents, issued by the Ministry of Public Order. 1998-2001, small numbers of MPO permits added to other data. 1998: applications for White Card. 1999: applications for Green Card. 2000: applications for Green Card minus expired and unrenewed Green Cards [calculations from global data on Green Card award and renewal rates]. 2001: applications for Green Card II 2002: reported total of accepted applications for Green Card II 2003: Ministry of Interior valid permits, as of 15 January 2004 [includes some minors, aged 14-17] 2004: Ministry of Interior valid permits, as of 16 June 2004 [figure in extreme doubt – see Part B below] Undocumented, tolerated homogeneis or with permit application: 1988-1997, global estimates of number of illegal migrants in Greece, various sources and years, as reported in Baldwin-Edwards and Fakiolas (1998) 1998-2002: assumption of stable stock of total migrants, with small annual increases: figure then reduced by number of applicants for legalisation, and also by estimated number of homogeneis cards. 2003-2004: figure derived from total number of residence permits issued since 1 July 2003 minus total valid. This category of merged data is highly unsatisfactory as it relies almost completely upon estimates for the following reasons:
(1) Until 2000 and 2001, homogeneis were statistically and legally undifferentiated from illegal immigrants: in practice, of course, there was a distinction.
(2) Since the invention of the ‘homogeneis card’, no data have been provided by the Ministry of Public Order – on the grounds of “national security”.
(3) The Ministry of Interior does not record for statistical purposes received applications for permits and applications for permit renewals: such persons thus appear as undocumented immigrants.
Schoolchildren: Data for immigrant and homogeneis children are used for 1995-6, 1999-2000 and 2002-3. Interpolation is made for other years, plus one extrapolation for 2004. These data are needed because schoolchildren are not counted in any dataset other than the Census, although they are covered by their parents’ residence permits.
All years of these data are highly suspect, with contradictory datasets, massive confusions over homogeneis and allogeneis schoolchildren, and country of birth of children used as a proxy for nationality.
‘Homogeneis Cards’: These important data are concealed by the Ministry of Public Order: our estimates are based on unofficial leaks of information. There is no information on nationalities, but we imagine that Albanians predominate.
GLOSSARY OF GEOGRAPHICAL REGIONS OF THE WORLD
23
Central Europe Albania Bosnia-Herzegovina Bulgaria Croatia Czech Republic Estonia FYR Macedonia Hungary Latvia Lithuania Poland Romania Slovakia Slovenia Fed. Rep. of Yugoslavia
European New Independent States Belarus Republic of Moldova Russian Federation Ukraine
Remainder of Europe Andorra Cyprus Malta Monaco San Marino Holy See (Vatican City) Turkey
Remainder of New Independent States Kazakhstan Kyrgyzstan Tajikistan Turkmenistan Uzbekistan
Middle East Bahrain Iraq Israel Jordan Kuwait Lebanon Oman Qatar Saudi Arabia Syria United Arab Emirates Yemen
Remainder of Asia Afghanistan Armenia Azerbaijan Bangladesh Bhutan Brunei Darussalam Cambodia China East Timor Georgia India Indonesia Iran Japan Korea, Dem. P. Rep. Korea, Republic of Laos, P. Dem. Rep. Malaysia Maldives Mongolia Myanmar Nepal Pakistan Philippines Singapore Sri Lanka Thailand Viet Nam West Bank and Gaza
North America Bermuda Canada United States
Remainder of America Antigua and Barbuda Argentina Bahamas Barbados Belize Bolivia Brazil Chile Colombia Costa Rica Cuba Dominica Dominican Republic Ecuador
El Salvador Grenada Guatemala Guyana Haiti Honduras Jamaica Mexico Nicaragua Panama Paraguay Peru St Christopher & Nevis Saint Lucia St Vincent & Grenadines Suriname Trinidad and Tobago Uruguay Venezuela
North Africa Algeria Egypt Libyan Arab Jamahiriya Morocco Tunisia Western Sahara
Remainder of Africa Angola Benin Botswana Burkina Faso Burundi Cameroon Cape Verde Central African Republic Chad Comoros Congo, Congo, Republic of Cote d'Ivoire Djibouti Equatorial Guinea Eritrea Ethiopia Gabon Gambia Ghana Guinea Guinea-Bissau
Kenya Lesotho Liberia Madagascar Malawi Mali Mauritania Mauritius Mozambique Namibia Niger Nigeria Rwanda Sao Tome and Principe Senegal Seychelles Sierra Leone Somalia South Africa Sudan Swaziland Tanzania, United Togo Uganda Zambia Zimbabwe
OCEANIA Australia Fiji Kiribati Marshall Islands Micronesia (Federated) Nauru New Zealand Palau Papua New Guinea Samoa Solomon Islands Tonga US Minor Outlying Isles Tuvalu Vanuatu

24
PART B
GREEK GOVERNMENT DATASETS ON IMMIGRATION:
Compliance with the Draft EU Regulation on Community Statistics on
International Migration, Citizenship, Residence Permits and Asylum
Ministry contacts and responses
Ministry of Labour Contact was made on 24 August 2004 with K. Kon. Chryssinis asking what datasets are
compiled or available. The reply is that data are fragmented and incomplete, that they
cannot supply any data, and do not know when they might be able to do so.
►►►
Ministry of Foreign Affairs Contact was made with K. Christodoulopoulou on 5 August 2004, a fax sent requesting
all data on visa requests and grants, 1991-2004. This was approved by the Ministry and
a reply received on 16 August with all data prepared according to Schengen
requirements, but only for the years 2000-2003. The datasets vary substantially
annually, with only that for 2003 giving much detail. This is included as Table 5 in
Part A. These data are not covered by the proposed Regulation, but should be of
interest since they contain valuable information on legal temporary admissions onto
Greek territory.
Our main concern is that the nationality, gender and age of the applicants are not
collected in statistical data: presumably, these are not required by Schengen. Also, the
reason for visiting Greece is not transparent in the data: this would be of some interest
for policy-makers, especially differentiating between tourism, business activities and
personal reasons.
►►►
25
IKA Foundation Contact was made with K. Skadas on 9 August, and 11 August 2004; faxes were
received from IKA on 10 and 11 August. The datasets are summarised in Figures 18-21
and in Table 3, Part A. There have been several telephone discussions on the datasets
and related matters since then.
The IKA data constitute the only reliable dataset on employment of immigrants in
Greece, as TEBE and OGA do not collect and collate their data and the Ministry of Labour
cannot provide data derived from applications for work permits. The IKA data are useful,
but do not cover age or regional location of immigrants [the actual IKA office receiving
payments is recorded, but this is not a reliable indicator of region]. Perhaps a more
serious problem is that IKA does not have the information about immigrants who
supplemented their ensima contributions in order to receive work permits. Therefore, the
real situation of immigrants’ relations with the social security system is concealed. We do
not consider this to be an acceptable manner in which to manage public policy relating
to Greece’s immigrant population, although the fault does not lie with IKA but with the
Ministry of Labour.
►►►
National Statistical Service of Greece (ΕΣΥΕ) We have had extensive telephone contact with the Population Head of Section, Ka.
Zikou, and with the responsible for Censuses, K. Dimas. These have included telephone
calls of 4 August, 9 August, leading to the collection of material from their Library on 11
August and to 2 meetings with K. Dimas on 31 August and 2 September. A formal
meeting with the Director-General, Dr Kontopirakis, took place on 22 September, and an
email requesting specific unpublished data from the 2001 Census was despatched on 23
September. The data requested were:
(a) the number of persons declaring themselves as homogeneis in the Census
(b) details of the housing conditions of immigrants
(c) some disaggregation of the data on immigrants in the Municipality of Athens, as
their number is very high (132.000), unlike other municipalities in Greece.

26
In principle, these data will be provided, but there is a problem with the ongoing
relocation of the offices of the Service. As of 13 October 2004, only data on homogeneis
[all but six with dual nationality] have been provided to us (on 11 and 12 October). The
dataset is attached in Appendix C.
Emerging problems with the 2001 Census data collection
The recently-compiled data on homogeneis show some 87.000 persons claiming
homogeneis status, out of a total of 850.000 answering the question “Are you
homogeneis?: Yes/No”. There are only 762.000 foreigners recorded in the Census, so
this was something of a surprise. Upon investigation, the ΕΣΥΕ has replied that almost all
the recorded homogeneis have dual nationality, and that there are only six homogeneis
without Greek citizenship residing in Greece! Given that the Ministry of Public Order
refuses to disclose the data on homogeneis permits, it is unclear how many should have
appeared in the Census: in particular, Albanian homogeneis generally have been denied
Greek citizenship, yet in the Census there were only 1.350 (dual nationals) who claimed
to be ethnic Greeks. [Confidential sources have suggested to us that it should be around
150.000 permits for 2001.]
The clear [and unhappy] answer to this conundrum lies in the way in which the Census
was conducted. The Census-takers asked at first sight: “Are you Greek?” [Eiste Ellhnas;]
and did not make enquiry about citizenship or ask if the person had a taftotita or
homogeneis card. Thus, it is more or less certain that all homogeneis without Greek
citizenship have been recorded in the Census as Greek nationals, with the implication
that there are 150-200.000 fewer Greek nationals, and the same number more
immigrants than was thought until this revelation. Thus, we can apparently add about
150.000 immigrants to the 2001 Census data in Figure 1, adding about 1,3% to the total
immigrant/population ratio. Other than this problem with homogeneis, the Census
appears to have been a fairly reliable measure of the extent of immigrant stocks at that
time.
►►►
27
Ministry of Public Order Initial contact was made by telephone with Ka. Papandreou, on 6 August 2004, after
which we sent a fax on 10 August. Further contacts were made by telephone with Ka.
Papandreou on 23 August, with K. Tzeremes in the Minister’s Office, Officer Tragoulias of
the Immigration Section and a faxed letter to the Dieuthinsi Allodapon (Immigration
Administration) – all on 24 August.
Owing to the primary role of this Ministry in dealing with immigration issues, and its
responsibility under the draft Regulation for collecting and compiling data on EU
nationals, asylum-seekers and refugees, illegal entry and residence, and “long-term
immigration status other than residence permits” [namely, homogeneis permits], we
drafted a detailed letter explaining the information required by us. This letter specified
the exact data required by the draft Directive, and we requested two things relating to
these:
(i) the identity of the data [i.e. the variables included in the dataset]
(ii) if possible, a printout of these actual data for 1991-2004
Our request was apparently approved by the Minister. However, the response of
responsible officials was unhelpful, to say the least, and the information and data
provided of little use in conducting our research. The exchange of correspondence –
including the 2-page reply from the Ministry – is attached as Appendix B. This reply fails
to provide any information at all on the identity of the data, does not even mention the
existence of homogeneis permits, nor does it provide data on administrative expulsions
or “redirections” of illegal immigrants. The data which are provided are not broken down
by nationality, gender or age and are, therefore, of very low quality.
The data provided are of the following:
o Residence permits awarded by the Ministry, 1991-2001 [simple annual totals]
o EU residence permits, 1991-2003 [simple annual totals]
o Refusals of admission, 2000-2003 [simple annual totals]
o Asylum-seekers: applications and recognitions, 1991-2003
o Persons arrested and awaiting expulsion [simple annual totals]
28
►►►
Ministry of Education: Data on immigrant schoolchildren are not explicitly covered by the draft Directive, but
owing to extreme difficulty with all official data on immigrants in Greece, such data are
needed to try to compile a coherent picture of the situation. As can be seen in Figure 1,
immigrant schoolchildren are included as a separate category of immigrants quite simply
because they are missing from all data other than the Census.
Our contacts with the Ministry consist of a telephone call on 16 August, and on 17
August to IPODE – a research branch of the Ministry, specialised in immigrant children in
state schools. Dr Kyriakou paid a visit to the Ministry on 18 August, where we were
provided with some data on intercultural schools. When IPODE re-opened after a
summer break, we obtained on 27 August from IPODE itself some published data in 2
volumes.
The publications contain very detailed colour charts concerning immigrants in Greek
schools for the schoolyear 2002/3. There is no time-series of comparable data, and we
have some serious worries about the quality of the data. The actual nationalities of the
children are not given: instead, there are proxies used of ‘country of birth’ and ‘country
of birth of the father’. Given that there is only a loose correspondence between these
proxies and the legal citizenship of the child – in particular, all children born in Greece
are clearly not Greek – this is a poor substitute for the actual nationality of the child.
Other problems with the data include little hard data, but many tables of percentages
and other unverifiable proportionate statistical data, which cannot be used for analytical
purposes.
►►►
Ministry of Interior We have had excellent co-operation with this Ministry within the parameters of this
project, but also previously through Mr. Baldwin-Edwards’ formal relations with the EU
Monitoring Centre on Racism and Xenophobia. Other than frequent telephone contact,
we have had one meeting with Ka. Markaki and her staff on 12 August, 2004, with Ka.

29
Koudouli and other staff on 17 September, and with K. Anastassiou [database
management] on 8 October. In each of these three meetings, we have conducted
interviews lasting 1-2 hours, and the responses have been as open and frank as anyone
could wish.
In the first of these meetings, some preliminary data were supplied verbally concerning
the number of valid residence permits, the total issued since July 2003, and their
relationship with the 2001 Census data. The Ministry officials expressed concern that
there are few obvious linkages between these – citing contemporaneous statistics of
about 190.000 valid permits, a total of 510.000 issued, and a larger presence of
immigrants recorded in the Census. At that point, Mr Baldwin-Edwards expressed his
view that these data were completely consistent with each other, except that the low
number of valid permits showed a problem with the renewal process.
Subsequently, we have assembled over one thousand sheets of paper print-out,
compiled our own database in Excel format (covering 200 countries with 18 variables), at
the reference date of 16 September 2004 and attempted to make sense of conflicting
data. In particular, some older printouts given to us, for reference dates of 15 January
2004 and 20 May 2004, are inconsistent with printouts for the same reference dates but
compiled later on 6 October. The later printouts show much higher figures, about which
we puzzled for some time. In our discussions with K. Anastassiou, we concluded that the
management of the database is of a very high standard – with minimal double-counting,
effective cross-checking of data, and generally a serious attempt to provide a high-
quality service. Thus, the inconsistencies and problems which we noted were rather
perplexing.
Their explanation is now apparent to us: the database is a dynamic one and is not
consolidated for any point in time. Since it is continuously being updated, anyone with
data input access can add data for any period – even 6 or 9 months previously! The
result of this is that current data do not reflect current reality, since many of the
prefectures are probably entering their data on a low priority basis. Thus, only the oldest
data for valid permits are likely to be correct: our oldest reference date is 15 January,

30
2004 with 509.168 valid permits recorded as of 6 October 2004. There should be a
continuous decline in the recorded number of valid permits since that date, if this theory
of delayed data entry is correct. Indeed, Figure 5 of Appendix A shows precisely this
phenomenon. An alternative possibility, which is more worrying, is that this problem is
caused by massive numbes of partially-expired permits being issued. We do not have
sufficient information to comment on this, other than to note that it has been the subject
of much discussion in the press and in the Ombudsman’s Office.
The positive aspect of this lack of data quality is that probably there are far more valid
permits than the Ministry thinks: the obvious problem is that nobody can actually know
this for certain. We recommend that bureaucratic management reforms are urgently
needed in order to correct this information deficit.
Other minor problems exist with the lack of statistical access to recorded data in the
database: for example, the variables of:
o date of birth
o permit duration
o region of residence
o dependent children covered by the permit
Some data which would be helpful for grasping the realities of legal immigrant presence,
are apparently not recorded. This is especially true of data relating to bureaucratic
management, such as:
o if an expired permit is under renewal
o whether a permit is first-time or renewal
o date of first legal presence in Greece
o change of immigration or employment status
►►►
These summaries of the responses of state agencies, the sort of data provided, and
information concerning data identity do not indicate the extent of compliance with the
draft EU Regulation. This matter we address below, with reference to specific provisions
of the draft Regulation itself.
31
Conformity with the draft EU Regulation The latest version of the draft Regulation dated 19 May 2004 (attached as Appendix A )
contains some important changes made after consultation with interested parties in the
member states. The primary obligation to provide statistics to Eurostat will lie with the
Statistical Service, which itself will be dependent upon the provision of data from
relevant ministries and authorities. The Regulation is not expected to apply to data
before 2006, and certain types of statistic – most notably residence permit data – are to
be incorporated at a later date.
Article 3 of the revised draft stipulates the statistics required. These are:
International immigration and emigration to and from the territory
Citizenship and country of birth of persons usually resident on the territory
Administrative and judicial procedures and processes relating to immigration,
award of citizenship, asylum and other forms of protection, and the prevention of
illegal immigration.
Article 4:
(a) International migration flows are already requested by Eurostat on an annual basis,
and this change adds several disaggregations. It is not clear how ΕΣΥΕ will handle these
data requirements, but there are only two possible sources: the Ministry of Public Order
and the Ministry of Interior. The data required are for emigrants and immigrants,
disaggregated by:
o citizenship, by age and sex
o country of birth, by age and sex
o country of previous and next residence, by age and sex
o region of usual residence
As far as Ministry of Public Order data are concerned, we know nothing of
their data holdings as they have refused to disclose them. Interior Ministry
data do not include country of birth or country of previous residence; they do
32
cover age and region of residence, but at this time the database cannot access
that information.
(b) Data on usual residence, disaggregated by:
o citizenship, by age and sex
o country of birth, by age and sex
o region of usual residence
o year of first arrival
o employment status, occupation, industry branch, level of education and training
These data could theoretically be derived from the 2001 Census, except that
they are required on an annual basis (Article 10). It would seem that
residence permit and work permit data are the only possible sources of annual
data. At this time, the Interior Ministry can provide only citizenship by sex,
but with some changes could also provide disaggregation by age and also
data on region. The Ministry of Labour can provide no data, and appears to
have no intention ever of doing so. Data on labour market issues could be
derived from the Labour Force Survey, but sampled data are difficult to
integrate with other data.
(c) Citizenship acquisition data, by former citizenship, age and sex.
These are the responsibility of the Interior Ministry: at present, the data are
fragmented, owing to different procedures applying to palinostoundes and
allogeneis, and regional procedures with poor data collation. The data are
disaggregated by former citizenship and sex, but not by age. Furthermore, the
central database cannot print out anything other than simple annual totals.
33
Article 5:
Asylum statistics are the responsibility of the Ministry of Public Order.
Disaggregations are required by citizenship, age and sex. According to the
quality of data provided to us by the Ministry, they will not be able to provide
anything other than simple annual totals.
Article 6:
(a) Refusals of entry at the border, by citizenship, age and sex
(b) Persons found to be illegally resident, by citizenship, age and sex
Data on illegal entry and stay are also the responsibility of the Ministry of
Public Order. They appear to be unable to provide any disaggregations.
Article 7:
1 (a) residence permits for non-EU/EFTA nationals, as follows:
(i) first issue permits in reference period, by citizenship, permit reason, duration of
permit, age, sex
(ii) changed permit type in reference period, by citizenship, permit reason, duration
of permit, age, sex
(iii) valid permits at reference date, by citizenship, permit reason, duration of permit,
age, sex
(b) number of EU long-term permits [after 5 years’ residence]
2. Other long-term residence status for non-EU/EFTA
1 (a) The Interior Ministry database does not seem to be able to distinguish
between first issue permits, changed permits, and renewed permits. It is also
at this time unable to disaggregate by age or duration of permit. As discussed
above, the data for valid permits are highly problematic, but presumably can
be used after a substantial delay. However, for all of these data, the serious
bureaucratic delays in renewing or granting permits mean that without any
34
record of applications/renewals in process, there appear to be too few legal
immigrants.
(b) Greece has not started to implement the EU Directive on Long Term
Residence, and looks as if it will delay implementation well beyond the legal
period allowed. There are, therefore, no statistics to collect.
2. Homogeneis permits, awarded by the Ministry of Public Order are clearly
covered by this. The Ministry refuses to discuss these, on the grounds of
“national security”. There will, therefore, be no data provided.
Article 8:
Deportations and expulsions, by citizenship, age and sex
This is the province of the Ministry of Public Order. We do not believe that
they can provide any disaggregation other than citizenship.

35
Recommendations for data collection, collation and compilation of migration statistics
Most of the problems observed with the provision of statistical data on immigrants in
Greece can be classified as being of four different types. These are identified below:
1) Data collection problem:
The required data have never been collected, even though they are probably
available. In submitting official data, for example, ‘country of birth’ is rarely, if ever,
required.
2) Data collation problem:
In this category, the data have been collected but cannot be properly used for
statistical compilation. There are two subcategories:
(a) Data have been recorded manually, but not electronically
(b) Data are held in different locations, with no central database
3) Data quality problem:
In this case, the data have been recorded electronically on a central database, but
there are problems with the actual mechanism by which this has been done. The
result is that the final statistical data do not adequately reflect reality. Causes include
inconsistent approaches to the recording of data (e.g. too much discretion left to
individuals or regional offices), heavily delayed or irregular compilations of electronic
data submissions, and mistaken interpretations of manual records when entering the
data electronically.
4) Data access problem:
With this category, the problem is most easily solved as it is a technical one: the data
have been electronically recorded on a central database, but the computer software
is unable to extract the data for statistical purposes. This is essentially a short-term
issue, which normally can be fixed with time and relatively little money.

36
A fifth category exists, which is unique to the Ministry of Public Order – a reluctance to
provide or compile data for the end-user. This seems to arise from a political control
mentality traditional to that Ministry: this approach is, of course, completely incompatible
with the requirements of Eurostat and Greece’s membership of the European Union.
Looking at ministry datasets in turn, it is now possible to identify exactly what are the
problems with statistical data in each. First, the Ministry of Labour: the fundamental
issue with this Ministry is type (2) – with collation of data. Data are left at the level of
prefecture or municipality, with not central database. There may also be problems of
types (1) and (3) with collection and quality of data, but we are not able to evaluate
that. The two datasets of relevance in the Ministry of Interior are the residence
permit database and the citizenship acquisition database. The former is clearly the
highest level of management of immigration data that Greece has ever achieved:
however, there are temporal problems with data entry in the regions, type (3) problem.
There are also some issues with data collection (type 1), and some less serious issues
with access to the data (type 4), concerning age and dependent children, for example.
The principal known problem with the Ministry of Public Order lies in its self-
perception of its role in the Greek polity and society: we are not able to comment upon
the datasets in an adequate manner. Other ministries do collect some data on
immigrants, and there are some general provisions which we believe apply to all state
agencies using such data.
IKA has made great steps forward with its immigration data, but there appears to be a
data quality problem caused by the ensima requirements laid down by the Ministry of
Labour and the accompanying late payments of such. These data corrections can only be
made post hoc, and probably too late to use the data for policy guidance.
The Statistical Service is the principal authority for secondary data collation and
publication, and is dependent on other state agencies actually to collect the data.
However, with the Census data ΕΣΥΕ has complete control, and we have revealed a
problem (type 3) with data on non-Greek citizen homogeneis.

37
RECOMMENDATION 1
The Prime Minister’s Office should review why non-policing policy areas, such as the
award of EU and homogeneis permits, or the management of political asylum
applications, are the province of the Ministry of Public Order. The Ministry’s lack of co-
operation with other ministries and (it seems likely soon) with Eurostat is a serious
impediment to the proper management of immigration into Greece. Non-provision of
data is a remarkable exception to the general principles of public openness and
accountability: we do not comprehend the claim of “national security reasons” as a
justification for failing to provide immigration data.
In our view, it is imperative that all immigration issues be dealt with by one ministry:
only through this mechanism is it possible for proper data collection and policy planning
to be carried out. The database of the Interior Ministry is the most successful venture so
far in collecting data on immigrants, despite its defects. The logical choice for ministerial
competence in all immigration matters would be the Ministry of Interior.
RECOMMENDATION 2
The Ministry of Labour should act immediately to collate and process the data on work
permits held across the regions of Greece. This means, in the long-term, setting up
a central database and mechanisms for inputing reliable data from the regions. In the
interim, the Ministry might request collaboration with the Interior Ministry to add a few
employment variables to their central database: this would help to ameliorate what is
actually a very serious deficit of information.
In particular, the unique registration number for each immigrant should be utilised
systematically and without exception in the work permit application process. This is
essential not only for security reasons, but also to enable cross-linking data with the
Interior Ministry dataset. Other data required by Eurostat – and which are the sole
responsibility of the Labour Ministry to provide – are detailed and up-to-date data
on employment statuses, occupations, branch of industry, and levels of education and
vocational training of all immigrants granted work permits. The preparation of

38
standardised data in these areas will be technically demanding and complex, and cannot
be addressed here.
RECOMMENDATION 3
The Interior Ministry should try to reform the procedures for data-entry and the
apparent serious time-lag in inputing data in the regions. This is essentially a
bureaucratic problem, but we offer here some ideas:
There should be a maximum permissible delay between award of a permit and its
entry on the database, e.g. 7 days. Currently, there seems to be nothing preventing
entry of data even as much as 6 months late.
Exceptions to this rule should be authorised, on a case-by-case basis, by senior
personnel.
The database managers should monitor the temporal aspects of database entry,
and determine the latest reliable data for policy purposes. It is damaging to the
Ministry to issue recent data which are wrong, and which imply failures that may not
exist.
For the provision of statistical data to ΕΣΥΕ, the database management should
define a cut-off point for data-entry in that year, and try to establish that all relevant
data actually have been entered.
As it is possible that the late data entries are caused by the issuing of semi-expired
permits, this matter should be addressed as appropriate. Recommendations have already
been made on this point by the Ombudsman, namely that permits should be valid from
the date of issue and not earlier.
RECOMMENDATION 4
The Interior Ministry should add to the data variables currently listed on the permits
database. For administrative purposes, there should be clear distinction between
applications for permits, first-time permits, permit permission change, renewed permits,
and expired permits. The addition of these variables would enable the Ministry to
calculate the extent of lapsed permits, for which nationalities they occur, and draw some
conclusions concerning the presence of undocumented immigrants in Greece.
39
For other statistical purposes, including the Eurostat requirements, the following data will
need to be collected:
o Year of first arrival in Greece
o Country of birth
o Country of previous residence
o Country of next residence [applies to holders of the EU long-term residence status]
RECOMMENDATION 5
The Interior Ministry should upgrade its computer software for the residence permits
database in order to access detailed statistics which are already recorded, covering the
following variables:
o Dependent children
o Age of permit holder
o Region of usual residence
o Permit duration
RECOMMENDATION 6
The Interior Ministry should address the very serious lack of reliable data on award of
Greek citizenship. These data are required by Eurostat, but are also essential for policy
purposes within the Greek state. There seem to be two major sorts of problem – data
collation and data access. Thus, the compilation of all data on award of Greek citizenship
should be prioritised, and a centralised database (like that for residence permits)
established. In particular, the system should integrate data concerning the three
different categories of citizenship award: to allogeneis, homogeneis from other than CIS
countries, and to homogeneis from CIS countries.
The existing database on citizenship awards has serious problems of data access, and
these should be corrected with computer software upgrades: otherwise, the database
system itself should be replaced. Data on former citizenship, age and sex are required by
Eurostat and cannot be provided at this time.

40
RECOMMENDATION 7
The Statistical Service of Greece should re-examine its Census data and consider a
statistical “fix” for the problem of no recorded homogeneis without Greek citizenship.
Access to the data on homogeneis permits held by the Ministry of Public Order would
permit such an adjustment of data.
RECOMMENDATION 8
IKA should examine its statistical provision, and if necessary issue post hoc additional
data in order to include the late voluntary payments of immigrants. Although far from
ideal, this would represent an improvement on the current data provision.
RECOMMENDATION 9
A coherent approach across the public domain in the collection and management of data
on non-Greek residents would confer advantage to the Greek state. We recommend that
an Inter-Ministerial Committee on Immigration Data Standards be established,
with some expert scientific participation, in order to agree a framework of types of data
requested and formats used. In particular, such a committee could facilitate the general
collection of data currently not available: these include ‘country of birth’, ‘country of
former residence’, other nationalities held, etc. Ministries whose activities we have not
examined here, such as Justice, Health or Education, are also continuously grappling
with immigrant issues: the implementation of common standards on data collection
would not only allow Greece to produce data to the standards of other EU countries, but
also would provide policy-makers with a clearer picture of reality. Competent statistics
are not a luxury for the privileged, but a normal tool in the pursuit of good governance.