FluorescenceSpectrometricDeterminationofDrugs Containing...
10
Hindawi Publishing Corporation International Journal of Analytical Chemistry Volume 2011, Article ID 840178, 9 pages doi:10.1155/2011/840178 Research Article Fluorescence Spectrometric Determination of Drugs Containing α-Methylene Sulfone/Sulfonamide Functional Groups Using N 1 -Methylnicotinamide Chloride as a Fluorogenic Agent Khaled M. Elokely, Mohamed A. Eldawy, Mohamed A. Elkersh, and Tarek F. El-Moselhy Department of Pharmaceutical Chemistry, Faculty of Pharmacy, Tanta University, Tanta 31527, Egypt Correspondence should be addressed to Tarek F. El-Moselhy, [email protected] Received 19 January 2011; Accepted 14 March 2011 Academic Editor: Alejandro Cifuentes Copyright © 2011 Khaled M. Elokely et al. This is an open access article distributed under the Creative Commons Attribution License, which permits unrestricted use, distribution, and reproduction in any medium, provided the original work is properly cited. A simple spectrofluorometric method has been developed, adapted, and validated for the quantitative estimation of drugs containing α-methylene sulfone/sulfonamide functional groups using N 1 -methylnicotinamide chloride (NMNCl) as fluorogenic agent. The proposed method has been applied successfully to the determination of methyl sulfonyl methane (MSM) (1), tinidazole (2), rofecoxib (3), and nimesulide (4) in pure forms, laboratory-prepared mixtures, pharmaceutical dosage forms, spiked human plasma samples, and in volunteer’s blood. The method showed linearity over concentration ranging from 1 to 150 μg/mL, 10 to 1000 ng/mL, 1 to 1800 ng/mL, and 30 to 2100 ng/mL for standard solutions of 1, 2, 3, and 4, respectively, and over concentration ranging from 5 to 150 μg/mL, 10 to 1000 ng/mL, 10 to 1700ng/mL, and 30 to 2350 ng/mL in spiked human plasma samples of 1, 2, 3, and 4, respectively. The method showed good accuracy, specificity, and precision in both laboratory-prepared mixtures and in spiked human plasma samples. The proposed method is simple, does not need sophisticated instruments, and is suitable for quality control application, bioavailability, and bioequivalency studies. Besides, its detection limits are comparable to other sophisticated chromatographic methods. 1. Introduction Encouraged by the successful application of the NMNCl methodology to the determination of a similar α-methylene carbonyl functional group containing drugs, namely, war- farin [1], pentoxifylline, propafenone hydrochloride and ace- butolol hydrochloride [2], the almost isosteric α-methylene sulfoxide group, such as proton pump inhibitors (PPIs) and the cyclic α-methylene carbonyl group, such as ketamine hydrochloride, griseofulvin, and levonorgestrel (unpub- lished results), we decided to investigate the possibility of extending the application of such methodology to drugs containing the isosteric α-methylene sulfone/sulfonamide functional groups, namely, methyl sulfonyl methane (MSM) (1), tinidazole (2), rofecoxib (3), and nimesulide (4). Methyl sulfonyl methane (MSM) (1) is a relatively new dietary supplement form of sulfur that is found in our living tissues. MSM supports healthy connective tissues like tendons, ligaments, and muscle. Thus, it is important in conditions such as arthritis, muscle pains, and bursitis. MSM should be considered an integral part of any health care practice because of its physiological action, indirect importance, and current/future uses [3–5]. In this report, MSM was used as a model compound and was found to react successfully with NMNCl quanti- tatively yielding a fluorophore. Because there are marketed dosage forms containing MSM, it was decided to apply the developed method for its analysis in its marketed dietary supplement dosage forms in view of the rather elaborate and costly methodologies reported for its analysis in the available literature. The reported methods include Fourier-transform infrared (FT-IR) spectrometry [6], Raman spectroscopy [7], CIMS [8], GC [9], GC with flame ionization detector [10], GC with flame photometric detection [11], capillary
Transcript of FluorescenceSpectrometricDeterminationofDrugs Containing...
Hindawi Publishing CorporationInternational Journal of Analytical ChemistryVolume 2011, Article ID 840178, 9 pagesdoi:10.1155/2011/840178
Research Article
Fluorescence Spectrometric Determination of DrugsContaining α-Methylene Sulfone/Sulfonamide Functional GroupsUsing N 1-Methylnicotinamide Chloride as a Fluorogenic Agent
Khaled M. Elokely, Mohamed A. Eldawy, Mohamed A. Elkersh, and Tarek F. El-Moselhy
Department of Pharmaceutical Chemistry, Faculty of Pharmacy, Tanta University, Tanta 31527, Egypt
Correspondence should be addressed to Tarek F. El-Moselhy, [email protected]
Received 19 January 2011; Accepted 14 March 2011
Academic Editor: Alejandro Cifuentes
Copyright © 2011 Khaled M. Elokely et al. This is an open access article distributed under the Creative Commons AttributionLicense, which permits unrestricted use, distribution, and reproduction in any medium, provided the original work is properlycited.
A simple spectrofluorometric method has been developed, adapted, and validated for the quantitative estimation of drugscontaining α-methylene sulfone/sulfonamide functional groups using N1-methylnicotinamide chloride (NMNCl) as fluorogenicagent. The proposed method has been applied successfully to the determination of methyl sulfonyl methane (MSM) (1), tinidazole(2), rofecoxib (3), and nimesulide (4) in pure forms, laboratory-prepared mixtures, pharmaceutical dosage forms, spiked humanplasma samples, and in volunteer’s blood. The method showed linearity over concentration ranging from 1 to 150 μg/mL, 10 to1000 ng/mL, 1 to 1800 ng/mL, and 30 to 2100 ng/mL for standard solutions of 1, 2, 3, and 4, respectively, and over concentrationranging from 5 to 150 μg/mL, 10 to 1000 ng/mL, 10 to 1700 ng/mL, and 30 to 2350 ng/mL in spiked human plasma samples of1, 2, 3, and 4, respectively. The method showed good accuracy, specificity, and precision in both laboratory-prepared mixturesand in spiked human plasma samples. The proposed method is simple, does not need sophisticated instruments, and is suitablefor quality control application, bioavailability, and bioequivalency studies. Besides, its detection limits are comparable to othersophisticated chromatographic methods.
1. Introduction
Encouraged by the successful application of the NMNClmethodology to the determination of a similar α-methylenecarbonyl functional group containing drugs, namely, war-farin [1], pentoxifylline, propafenone hydrochloride and ace-butolol hydrochloride [2], the almost isosteric α-methylenesulfoxide group, such as proton pump inhibitors (PPIs) andthe cyclic α-methylene carbonyl group, such as ketaminehydrochloride, griseofulvin, and levonorgestrel (unpub-lished results), we decided to investigate the possibility ofextending the application of such methodology to drugscontaining the isosteric α-methylene sulfone/sulfonamidefunctional groups, namely, methyl sulfonyl methane (MSM)(1), tinidazole (2), rofecoxib (3), and nimesulide (4).
Methyl sulfonyl methane (MSM) (1) is a relatively newdietary supplement form of sulfur that is found in our
living tissues. MSM supports healthy connective tissues liketendons, ligaments, and muscle. Thus, it is important inconditions such as arthritis, muscle pains, and bursitis.MSM should be considered an integral part of any healthcare practice because of its physiological action, indirectimportance, and current/future uses [3–5].
In this report, MSM was used as a model compoundand was found to react successfully with NMNCl quanti-tatively yielding a fluorophore. Because there are marketeddosage forms containing MSM, it was decided to apply thedeveloped method for its analysis in its marketed dietarysupplement dosage forms in view of the rather elaborate andcostly methodologies reported for its analysis in the availableliterature. The reported methods include Fourier-transforminfrared (FT-IR) spectrometry [6], Raman spectroscopy[7], CIMS [8], GC [9], GC with flame ionization detector[10], GC with flame photometric detection [11], capillary
2 International Journal of Analytical Chemistry
GC [12], GC-MS for estimating volatile sulfur compounds[13, 14], solid-phase microextraction-GC-MS [15], dynamicheadspace-GC-MS [16], reversed phase HPLC followed byheadspace GC-MS [17], and direct thermal desorption priorto GC-MS application [18]. Tinidazole (2) is a syntheticantiprotozoal agent. Survey of the available literature revealsseveral methods for the analysis of 2 active pharmaceuticalingredient (API) and pharmaceutical formulations in thepresence of possible impurities and related substances [19,20]. These methods include fluorometry involving the reduc-tion of its nitro group and subsequent measurement of itsemission intensity at 420 nm [21], UV [22], electrochemicalmethod [23], HPTLC [24, 25], LC/MS/MS [26], HPLC [27],and GLC [28]. Further, 2 was analyzed in biological fluidscontaining its major metabolite using HPLC-MS [29].
Rofecoxib (3) is a nonsteroidal anti-inflammatory drug(NSAID) introduced in 1998 with lots of fanfare claimingit a selective COX-2 inhibitor with minimal side effects,and 3 was withdrawn in September, 2004 because of safetyconcerns regarding its untoward cardiovascular side effectsleading to several deaths [30, 31].
Different methods are reported for the determination of3 in the presence of its degradation products and metabolites[32]. These methods include chemometric methods [32],derivative UV [33, 34], HPTLC [35], HPLC after UVphotocyclization [36], and LC-MS [37].
Nimesulide (4) is a sulfonanilide analogue clinically usedanti-inflammatory agent; it is not related to conventionalNSAIDs, which usually present a carboxyl or hydroxyl func-tional group [38]. Several methods were described for thedetermination of 4 in the presence of its compendia-relatedsubstances [39] as well as in the presence of its metabolites[40]. These methods include spectrophotometric ones asnear-infrared [41], UV techniques [42], fluorometry usingegg phosphatidylcholine liposomes [43], and colorimetricmethods [44]. Electrochemical methods involve flow amper-ometry [45] and adsorptive stripping voltammetry [46].Separation methods involve HPLC [47, 48] and HPLC-MS/MS [49].
Nakamura and Tamura described the application of thereaction of N 1-methylnicotinamide chloride (NMNCl) tothe analysis of various compounds containing α-methylenecarbonyl groups [50]. Nakamura and Tamura also madequalitative tests on the reaction mechanism and establishedthe cyclized α-adduct fluorophore [50]. This reaction was nottested before for compounds containing α-methylene groupsadjacent to other functional groups.
All previous publications based on the fluorophoreproduced by reaction with NMNCl described the utility ofthis reagent to react with drugs containing active methyleneα to carbonyl functional groups. This paper formulatesour continuous effort to extend the utility of NMNCl todetermine different classes of drugs containing active methy-lene α to various groups such as cyclic ketone, (ketamine,griseofulvin, and levonorgestrel) sulfoxide (PPIs), and sul-fone/sulfonamide (1–4) and even to groups that wouldproduce active methylene upon hydration, for example,methyne group, such as levonorgestrel and ethinyl estradiol(unpublished results).
This paper describes the application and validation of thereaction of NMNCl with some drugs containing α-methylenesulfone groups.
2. Results and Discussion
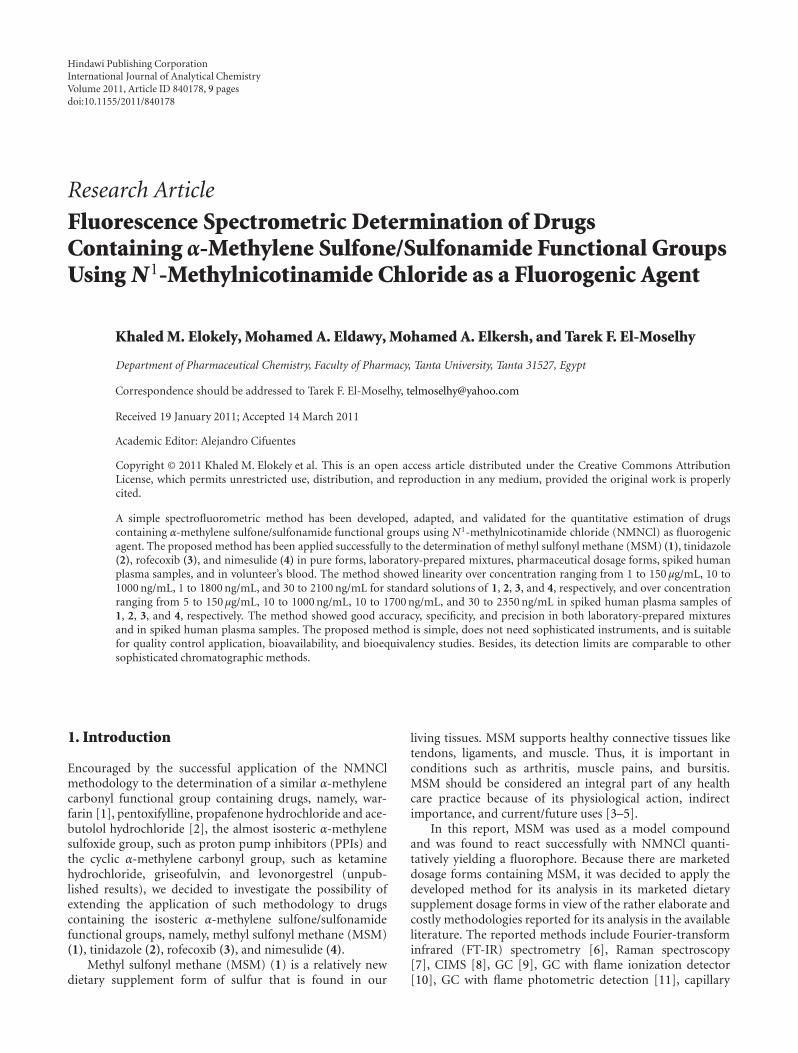
When 1, 2, 3, and 4 (for chemical structures and plausiblepathway of the reaction, cf. Figure 1) were allowed to reactwith NMNCl under the optimal conditions specified foreach, strong fluorescent products were obtained. The optimalwavelengths of excitation and emission of the reactionproduct were determined using synchronous wavelengthsearch and listed in Table 1.
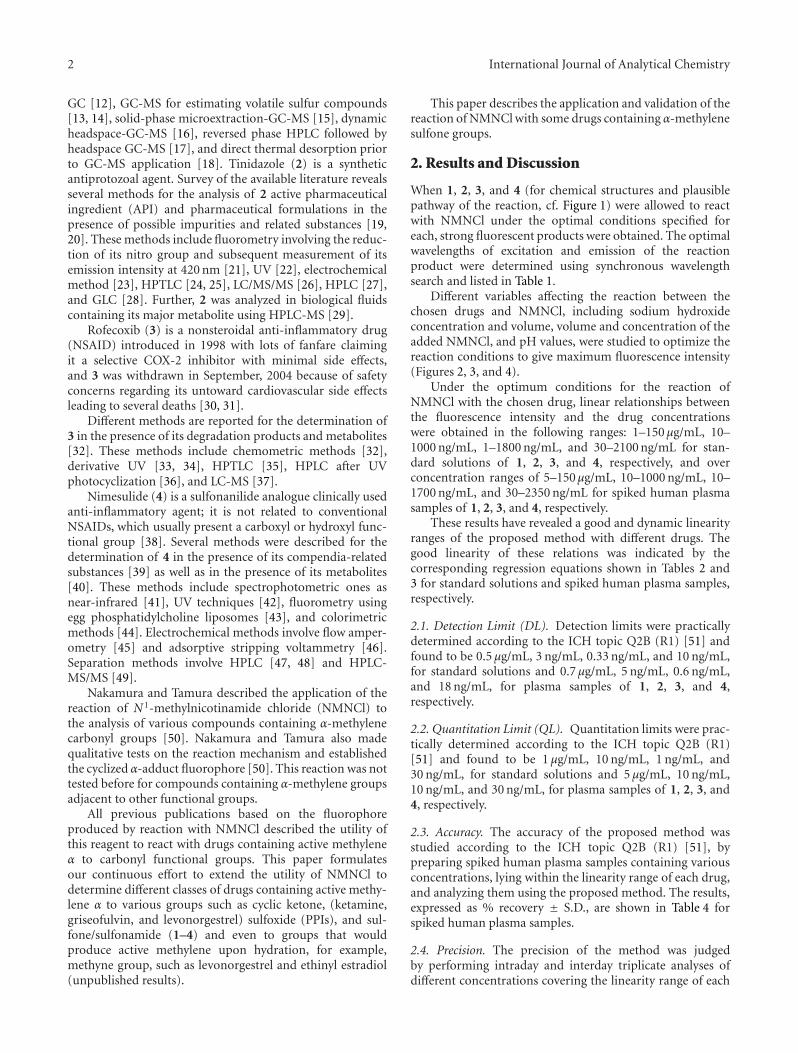
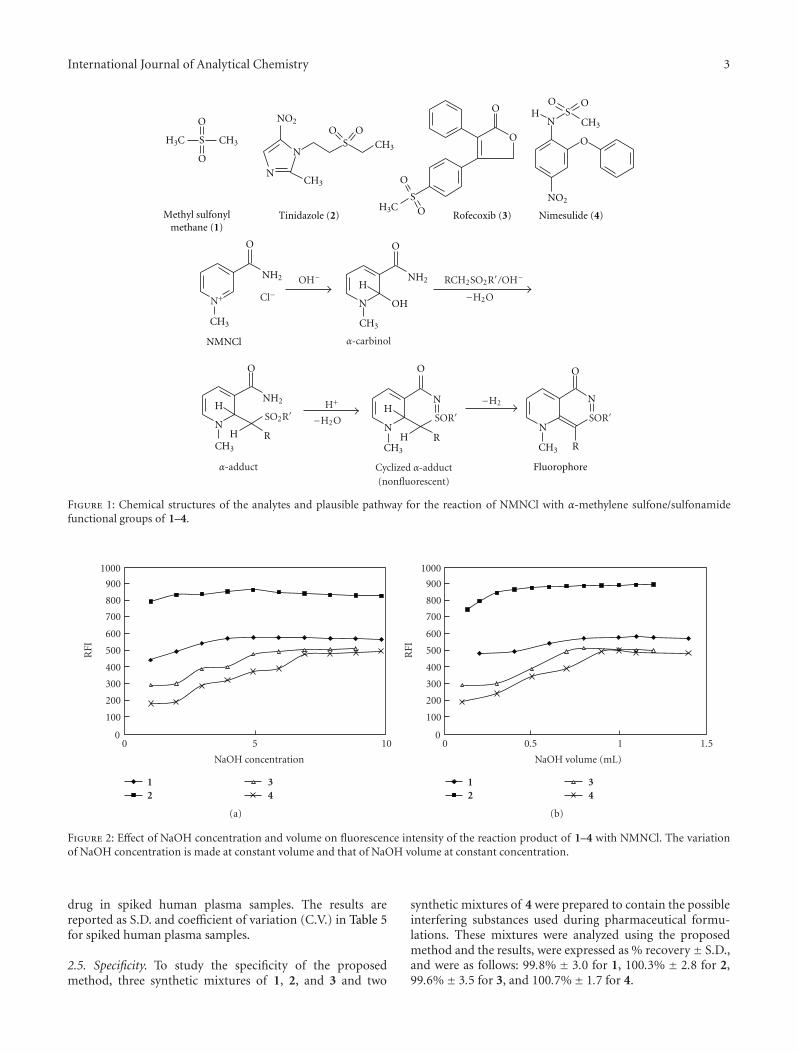
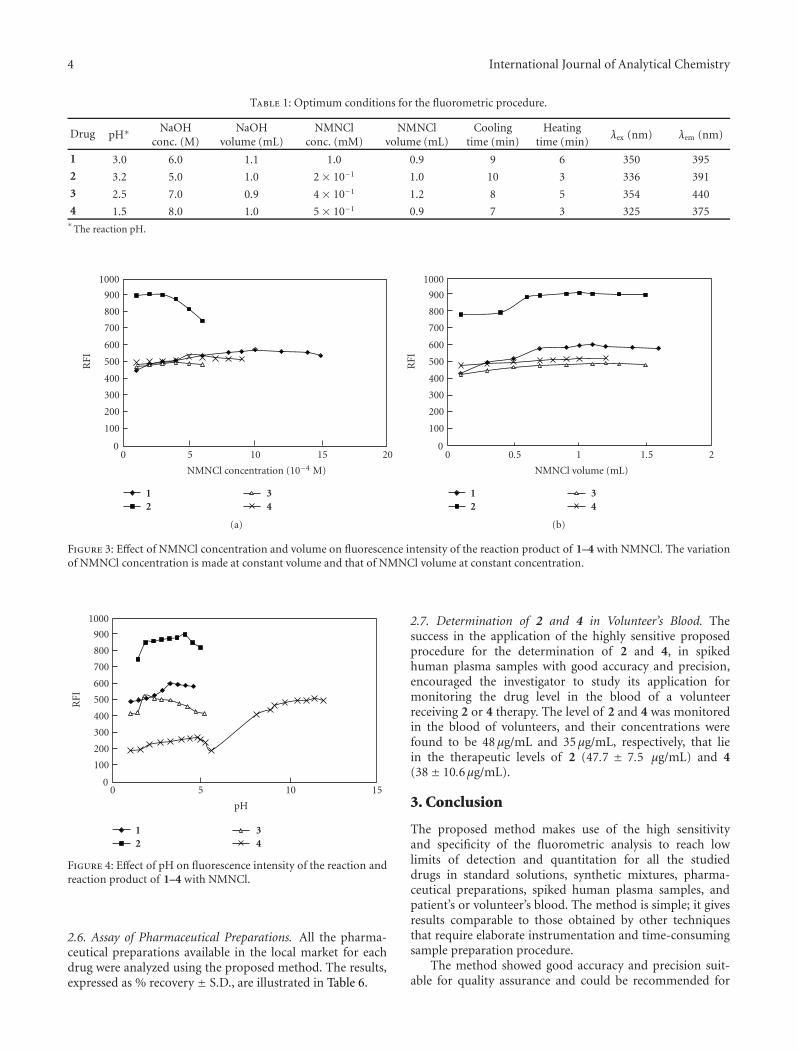
Different variables affecting the reaction between thechosen drugs and NMNCl, including sodium hydroxideconcentration and volume, volume and concentration of theadded NMNCl, and pH values, were studied to optimize thereaction conditions to give maximum fluorescence intensity(Figures 2, 3, and 4).
Under the optimum conditions for the reaction ofNMNCl with the chosen drug, linear relationships betweenthe fluorescence intensity and the drug concentrationswere obtained in the following ranges: 1–150 μg/mL, 10–1000 ng/mL, 1–1800 ng/mL, and 30–2100 ng/mL for stan-dard solutions of 1, 2, 3, and 4, respectively, and overconcentration ranges of 5–150μg/mL, 10–1000 ng/mL, 10–1700 ng/mL, and 30–2350 ng/mL for spiked human plasmasamples of 1, 2, 3, and 4, respectively.
These results have revealed a good and dynamic linearityranges of the proposed method with different drugs. Thegood linearity of these relations was indicated by thecorresponding regression equations shown in Tables 2 and3 for standard solutions and spiked human plasma samples,respectively.
2.1. Detection Limit (DL). Detection limits were practicallydetermined according to the ICH topic Q2B (R1) [51] andfound to be 0.5 μg/mL, 3 ng/mL, 0.33 ng/mL, and 10 ng/mL,for standard solutions and 0.7 μg/mL, 5 ng/mL, 0.6 ng/mL,and 18 ng/mL, for plasma samples of 1, 2, 3, and 4,respectively.
2.2. Quantitation Limit (QL). Quantitation limits were prac-tically determined according to the ICH topic Q2B (R1)[51] and found to be 1 μg/mL, 10 ng/mL, 1 ng/mL, and30 ng/mL, for standard solutions and 5 μg/mL, 10 ng/mL,10 ng/mL, and 30 ng/mL, for plasma samples of 1, 2, 3, and4, respectively.
2.3. Accuracy. The accuracy of the proposed method wasstudied according to the ICH topic Q2B (R1) [51], bypreparing spiked human plasma samples containing variousconcentrations, lying within the linearity range of each drug,and analyzing them using the proposed method. The results,expressed as % recovery ± S.D., are shown in Table 4 forspiked human plasma samples.
2.4. Precision. The precision of the method was judgedby performing intraday and interday triplicate analyses ofdifferent concentrations covering the linearity range of each
International Journal of Analytical Chemistry 3
Fluorophore
N
N
O
R
N
N
O
H
N
O
H
H HR R
NMNCl
N
O
H
OH
O
Nimesulide (4)Rofecoxib (3)Tinidazole (2)Methyl sulfonylmethane (1)
NO2
NH S
CH3
CH3
CH3
CH3 CH3 CH3
CH3
CH3CH3
NO2
NH2 NH2
NH2
OO
O OO
SH3C
H3C
O
O
OO
N
NSS
O
O
OH−
Cl−RCH2SO2R′/OH−
−H2ON+
H+
−H2O
−H2
α-carbinol
α-adduct Cyclized α-adduct(nonfluorescent)
SOR′SO2R′ SOR′
Figure 1: Chemical structures of the analytes and plausible pathway for the reaction of NMNCl with α-methylene sulfone/sulfonamidefunctional groups of 1–4.
12
34
1050
NaOH concentration
0
100
200
300
400
500
600
700
800
900
1000
RFI
(a)
12
34
1.510.50
NaOH volume (mL)
0
100
200
300
400
500
600
700
800
900
1000
RFI
(b)
Figure 2: Effect of NaOH concentration and volume on fluorescence intensity of the reaction product of 1–4 with NMNCl. The variationof NaOH concentration is made at constant volume and that of NaOH volume at constant concentration.
drug in spiked human plasma samples. The results arereported as S.D. and coefficient of variation (C.V.) in Table 5for spiked human plasma samples.
2.5. Specificity. To study the specificity of the proposedmethod, three synthetic mixtures of 1, 2, and 3 and two
synthetic mixtures of 4 were prepared to contain the possibleinterfering substances used during pharmaceutical formu-lations. These mixtures were analyzed using the proposedmethod and the results, were expressed as % recovery± S.D.,and were as follows: 99.8% ± 3.0 for 1, 100.3% ± 2.8 for 2,99.6%± 3.5 for 3, and 100.7%± 1.7 for 4.
4 International Journal of Analytical Chemistry
Table 1: Optimum conditions for the fluorometric procedure.
Drug pH∗ NaOHconc. (M)
NaOHvolume (mL)
NMNClconc. (mM)
NMNClvolume (mL)
Coolingtime (min)
Heatingtime (min)
λex (nm) λem (nm)
1 3.0 6.0 1.1 1.0 0.9 9 6 350 395
2 3.2 5.0 1.0 2 × 10⁻¹ 1.0 10 3 336 391
3 2.5 7.0 0.9 4 × 10⁻¹ 1.2 8 5 354 440
4 1.5 8.0 1.0 5 × 10⁻¹ 0.9 7 3 325 375∗
The reaction pH.
12
34
20151050
NMNCl concentration (10−4 M)
0
100
200
300
400
500
600
700
800
900
1000
RFI
(a)
12
34
21.510.50
NMNCl volume (mL)
0
100
200
300
400
500
600
700
800
900
1000
RFI
(b)
Figure 3: Effect of NMNCl concentration and volume on fluorescence intensity of the reaction product of 1–4 with NMNCl. The variationof NMNCl concentration is made at constant volume and that of NMNCl volume at constant concentration.
12
34
151050
pH
0
100
200
300
400
500
600
700
800
900
1000
RFI
Figure 4: Effect of pH on fluorescence intensity of the reaction andreaction product of 1–4 with NMNCl.
2.6. Assay of Pharmaceutical Preparations. All the pharma-ceutical preparations available in the local market for eachdrug were analyzed using the proposed method. The results,expressed as % recovery ± S.D., are illustrated in Table 6.
2.7. Determination of 2 and 4 in Volunteer’s Blood. Thesuccess in the application of the highly sensitive proposedprocedure for the determination of 2 and 4, in spikedhuman plasma samples with good accuracy and precision,encouraged the investigator to study its application formonitoring the drug level in the blood of a volunteerreceiving 2 or 4 therapy. The level of 2 and 4 was monitoredin the blood of volunteers, and their concentrations werefound to be 48 μg/mL and 35 μg/mL, respectively, that liein the therapeutic levels of 2 (47.7 ± 7.5 μg/mL) and 4(38± 10.6μg/mL).
3. Conclusion
The proposed method makes use of the high sensitivityand specificity of the fluorometric analysis to reach lowlimits of detection and quantitation for all the studieddrugs in standard solutions, synthetic mixtures, pharma-ceutical preparations, spiked human plasma samples, andpatient’s or volunteer’s blood. The method is simple; it givesresults comparable to those obtained by other techniquesthat require elaborate instrumentation and time-consumingsample preparation procedure.
The method showed good accuracy and precision suit-able for quality assurance and could be recommended for
International Journal of Analytical Chemistry 5
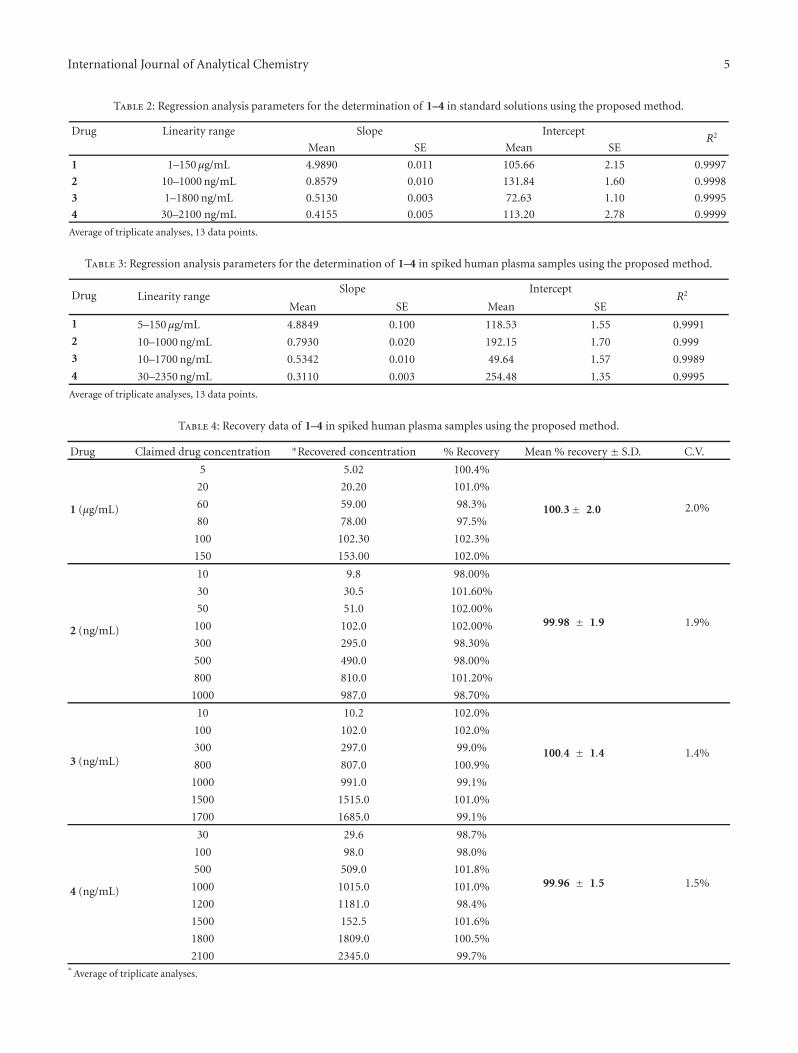
Table 2: Regression analysis parameters for the determination of 1–4 in standard solutions using the proposed method.
Drug Linearity range Slope InterceptR2
Mean SE Mean SE
1 1–150 μg/mL 4.9890 0.011 105.66 2.15 0.9997
2 10–1000 ng/mL 0.8579 0.010 131.84 1.60 0.9998
3 1–1800 ng/mL 0.5130 0.003 72.63 1.10 0.9995
4 30–2100 ng/mL 0.4155 0.005 113.20 2.78 0.9999
Average of triplicate analyses, 13 data points.
Table 3: Regression analysis parameters for the determination of 1–4 in spiked human plasma samples using the proposed method.
Drug Linearity rangeSlope Intercept
R2
Mean SE Mean SE
1 5–150 μg/mL 4.8849 0.100 118.53 1.55 0.9991
2 10–1000 ng/mL 0.7930 0.020 192.15 1.70 0.999
3 10–1700 ng/mL 0.5342 0.010 49.64 1.57 0.9989
4 30–2350 ng/mL 0.3110 0.003 254.48 1.35 0.9995
Average of triplicate analyses, 13 data points.
Table 4: Recovery data of 1–4 in spiked human plasma samples using the proposed method.
Drug Claimed drug concentration ∗Recovered concentration % Recovery Mean % recovery ± S.D. C.V.
1 (μg/mL)
5 5.02 100.4%
100.3± 2.0 2.0%
20 20.20 101.0%
60 59.00 98.3%
80 78.00 97.5%
100 102.30 102.3%
150 153.00 102.0%
2 (ng/mL)
10 9.8 98.00%
99.98 ± 1.9 1.9%
30 30.5 101.60%
50 51.0 102.00%
100 102.0 102.00%
300 295.0 98.30%
500 490.0 98.00%
800 810.0 101.20%
1000 987.0 98.70%
3 (ng/mL)
10 10.2 102.0%
100.4 ± 1.4 1.4%
100 102.0 102.0%
300 297.0 99.0%
800 807.0 100.9%
1000 991.0 99.1%
1500 1515.0 101.0%
1700 1685.0 99.1%
4 (ng/mL)
30 29.6 98.7%
99.96 ± 1.5 1.5%
100 98.0 98.0%
500 509.0 101.8%
1000 1015.0 101.0%
1200 1181.0 98.4%
1500 152.5 101.6%
1800 1809.0 100.5%
2100 2345.0 99.7%∗
Average of triplicate analyses.
6 International Journal of Analytical Chemistry
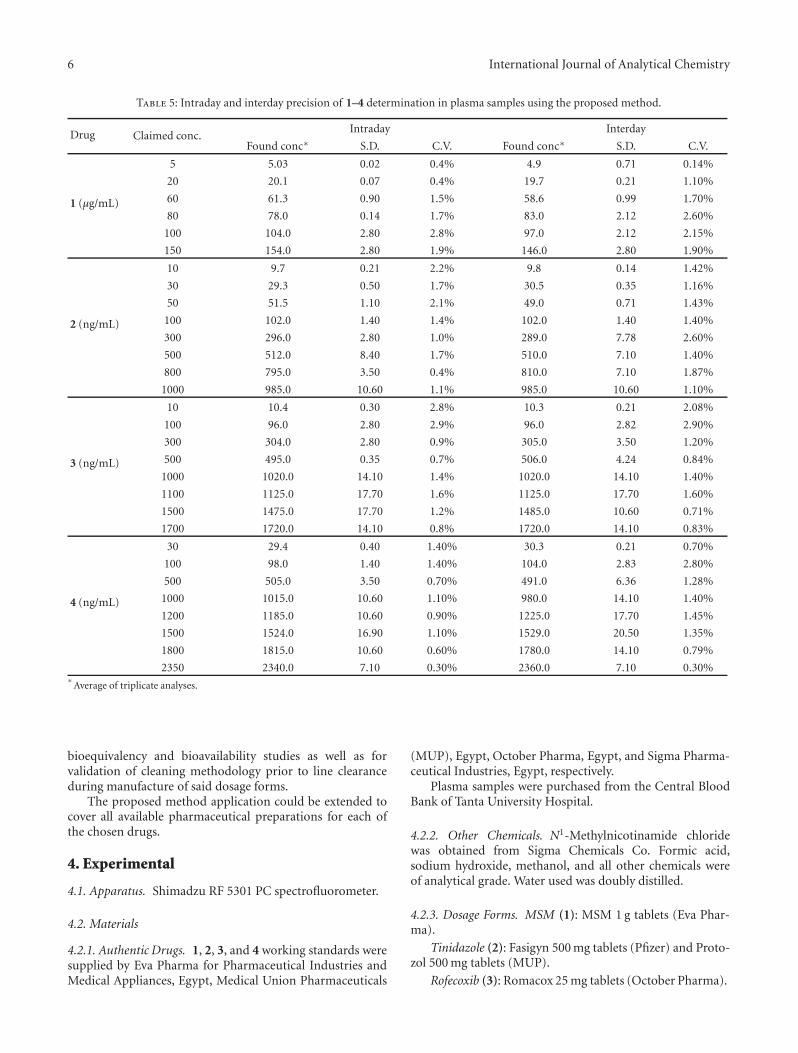
Table 5: Intraday and interday precision of 1–4 determination in plasma samples using the proposed method.
Drug Claimed conc.Intraday Interday
Found conc∗ S.D. C.V. Found conc∗ S.D. C.V.
1 (μg/mL)
5 5.03 0.02 0.4% 4.9 0.71 0.14%
20 20.1 0.07 0.4% 19.7 0.21 1.10%
60 61.3 0.90 1.5% 58.6 0.99 1.70%
80 78.0 0.14 1.7% 83.0 2.12 2.60%
100 104.0 2.80 2.8% 97.0 2.12 2.15%
150 154.0 2.80 1.9% 146.0 2.80 1.90%
2 (ng/mL)
10 9.7 0.21 2.2% 9.8 0.14 1.42%
30 29.3 0.50 1.7% 30.5 0.35 1.16%
50 51.5 1.10 2.1% 49.0 0.71 1.43%
100 102.0 1.40 1.4% 102.0 1.40 1.40%
300 296.0 2.80 1.0% 289.0 7.78 2.60%
500 512.0 8.40 1.7% 510.0 7.10 1.40%
800 795.0 3.50 0.4% 810.0 7.10 1.87%
1000 985.0 10.60 1.1% 985.0 10.60 1.10%
3 (ng/mL)
10 10.4 0.30 2.8% 10.3 0.21 2.08%
100 96.0 2.80 2.9% 96.0 2.82 2.90%
300 304.0 2.80 0.9% 305.0 3.50 1.20%
500 495.0 0.35 0.7% 506.0 4.24 0.84%
1000 1020.0 14.10 1.4% 1020.0 14.10 1.40%
1100 1125.0 17.70 1.6% 1125.0 17.70 1.60%
1500 1475.0 17.70 1.2% 1485.0 10.60 0.71%
1700 1720.0 14.10 0.8% 1720.0 14.10 0.83%
4 (ng/mL)
30 29.4 0.40 1.40% 30.3 0.21 0.70%
100 98.0 1.40 1.40% 104.0 2.83 2.80%
500 505.0 3.50 0.70% 491.0 6.36 1.28%
1000 1015.0 10.60 1.10% 980.0 14.10 1.40%
1200 1185.0 10.60 0.90% 1225.0 17.70 1.45%
1500 1524.0 16.90 1.10% 1529.0 20.50 1.35%
1800 1815.0 10.60 0.60% 1780.0 14.10 0.79%
2350 2340.0 7.10 0.30% 2360.0 7.10 0.30%∗
Average of triplicate analyses.
bioequivalency and bioavailability studies as well as forvalidation of cleaning methodology prior to line clearanceduring manufacture of said dosage forms.
The proposed method application could be extended tocover all available pharmaceutical preparations for each ofthe chosen drugs.
4. Experimental
4.1. Apparatus. Shimadzu RF 5301 PC spectrofluorometer.
4.2. Materials
4.2.1. Authentic Drugs. 1, 2, 3, and 4 working standards weresupplied by Eva Pharma for Pharmaceutical Industries andMedical Appliances, Egypt, Medical Union Pharmaceuticals
(MUP), Egypt, October Pharma, Egypt, and Sigma Pharma-ceutical Industries, Egypt, respectively.
Plasma samples were purchased from the Central BloodBank of Tanta University Hospital.
4.2.2. Other Chemicals. N1-Methylnicotinamide chloridewas obtained from Sigma Chemicals Co. Formic acid,sodium hydroxide, methanol, and all other chemicals wereof analytical grade. Water used was doubly distilled.
4.2.3. Dosage Forms. MSM (1): MSM 1 g tablets (Eva Phar-ma).
Tinidazole (2): Fasigyn 500 mg tablets (Pfizer) and Proto-zol 500 mg tablets (MUP).
Rofecoxib (3): Romacox 25 mg tablets (October Pharma).
International Journal of Analytical Chemistry 7
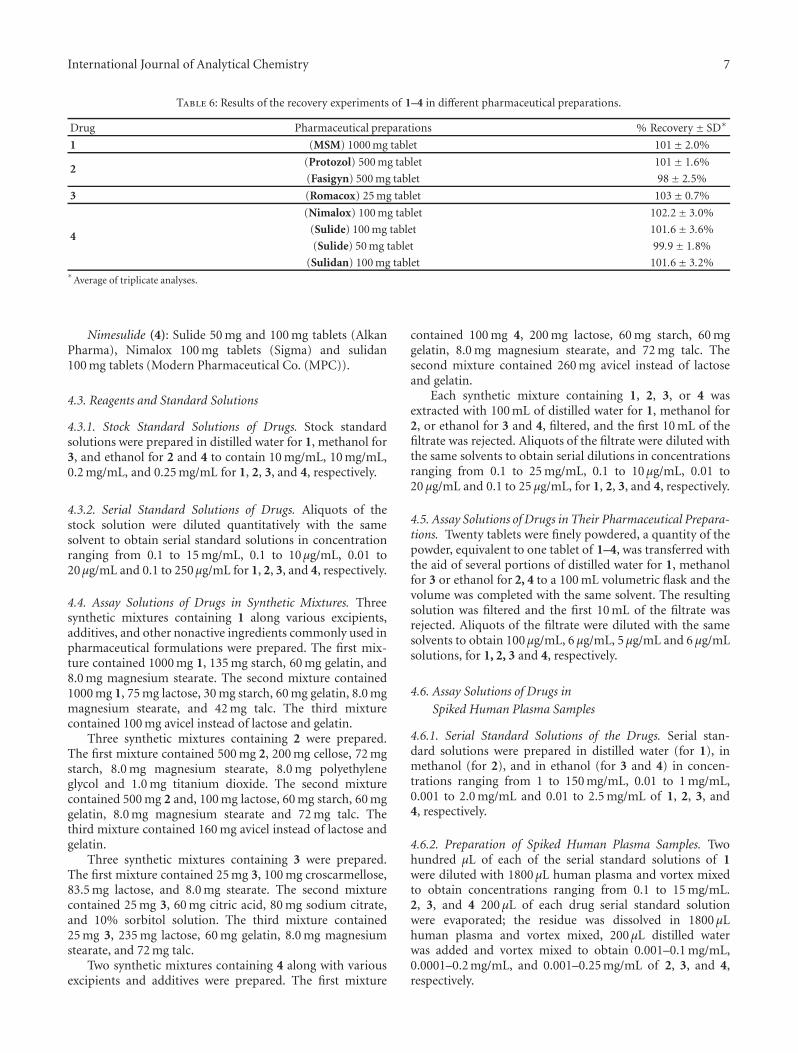
Table 6: Results of the recovery experiments of 1–4 in different pharmaceutical preparations.
Drug Pharmaceutical preparations % Recovery ± SD∗
1 (MSM) 1000 mg tablet 101± 2.0%
2(Protozol) 500 mg tablet 101± 1.6%
(Fasigyn) 500 mg tablet 98± 2.5%
3 (Romacox) 25 mg tablet 103± 0.7%
4
(Nimalox) 100 mg tablet 102.2± 3.0%
(Sulide) 100 mg tablet 101.6± 3.6%
(Sulide) 50 mg tablet 99.9± 1.8%
(Sulidan) 100 mg tablet 101.6± 3.2%∗
Average of triplicate analyses.
Nimesulide (4): Sulide 50 mg and 100 mg tablets (AlkanPharma), Nimalox 100 mg tablets (Sigma) and sulidan100 mg tablets (Modern Pharmaceutical Co. (MPC)).
4.3. Reagents and Standard Solutions
4.3.1. Stock Standard Solutions of Drugs. Stock standardsolutions were prepared in distilled water for 1, methanol for3, and ethanol for 2 and 4 to contain 10 mg/mL, 10 mg/mL,0.2 mg/mL, and 0.25 mg/mL for 1, 2, 3, and 4, respectively.
4.3.2. Serial Standard Solutions of Drugs. Aliquots of thestock solution were diluted quantitatively with the samesolvent to obtain serial standard solutions in concentrationranging from 0.1 to 15 mg/mL, 0.1 to 10μg/mL, 0.01 to20μg/mL and 0.1 to 250μg/mL for 1, 2, 3, and 4, respectively.
4.4. Assay Solutions of Drugs in Synthetic Mixtures. Threesynthetic mixtures containing 1 along various excipients,additives, and other nonactive ingredients commonly used inpharmaceutical formulations were prepared. The first mix-ture contained 1000 mg 1, 135 mg starch, 60 mg gelatin, and8.0 mg magnesium stearate. The second mixture contained1000 mg 1, 75 mg lactose, 30 mg starch, 60 mg gelatin, 8.0 mgmagnesium stearate, and 42 mg talc. The third mixturecontained 100 mg avicel instead of lactose and gelatin.
Three synthetic mixtures containing 2 were prepared.The first mixture contained 500 mg 2, 200 mg cellose, 72 mgstarch, 8.0 mg magnesium stearate, 8.0 mg polyethyleneglycol and 1.0 mg titanium dioxide. The second mixturecontained 500 mg 2 and, 100 mg lactose, 60 mg starch, 60 mggelatin, 8.0 mg magnesium stearate and 72 mg talc. Thethird mixture contained 160 mg avicel instead of lactose andgelatin.
Three synthetic mixtures containing 3 were prepared.The first mixture contained 25 mg 3, 100 mg croscarmellose,83.5 mg lactose, and 8.0 mg stearate. The second mixturecontained 25 mg 3, 60 mg citric acid, 80 mg sodium citrate,and 10% sorbitol solution. The third mixture contained25 mg 3, 235 mg lactose, 60 mg gelatin, 8.0 mg magnesiumstearate, and 72 mg talc.
Two synthetic mixtures containing 4 along with variousexcipients and additives were prepared. The first mixture
contained 100 mg 4, 200 mg lactose, 60 mg starch, 60 mggelatin, 8.0 mg magnesium stearate, and 72 mg talc. Thesecond mixture contained 260 mg avicel instead of lactoseand gelatin.
Each synthetic mixture containing 1, 2, 3, or 4 wasextracted with 100 mL of distilled water for 1, methanol for2, or ethanol for 3 and 4, filtered, and the first 10 mL of thefiltrate was rejected. Aliquots of the filtrate were diluted withthe same solvents to obtain serial dilutions in concentrationsranging from 0.1 to 25 mg/mL, 0.1 to 10 μg/mL, 0.01 to20 μg/mL and 0.1 to 25 μg/mL, for 1, 2, 3, and 4, respectively.
4.5. Assay Solutions of Drugs in Their Pharmaceutical Prepara-tions. Twenty tablets were finely powdered, a quantity of thepowder, equivalent to one tablet of 1–4, was transferred withthe aid of several portions of distilled water for 1, methanolfor 3 or ethanol for 2, 4 to a 100 mL volumetric flask and thevolume was completed with the same solvent. The resultingsolution was filtered and the first 10 mL of the filtrate wasrejected. Aliquots of the filtrate were diluted with the samesolvents to obtain 100 μg/mL, 6 μg/mL, 5 μg/mL and 6 μg/mLsolutions, for 1, 2, 3 and 4, respectively.
4.6. Assay Solutions of Drugs in
Spiked Human Plasma Samples
4.6.1. Serial Standard Solutions of the Drugs. Serial stan-dard solutions were prepared in distilled water (for 1), inmethanol (for 2), and in ethanol (for 3 and 4) in concen-trations ranging from 1 to 150 mg/mL, 0.01 to 1 mg/mL,0.001 to 2.0 mg/mL and 0.01 to 2.5 mg/mL of 1, 2, 3, and4, respectively.
4.6.2. Preparation of Spiked Human Plasma Samples. Twohundred μL of each of the serial standard solutions of 1were diluted with 1800 μL human plasma and vortex mixedto obtain concentrations ranging from 0.1 to 15 mg/mL.2, 3, and 4 200 μL of each drug serial standard solutionwere evaporated; the residue was dissolved in 1800 μLhuman plasma and vortex mixed, 200 μL distilled waterwas added and vortex mixed to obtain 0.001–0.1 mg/mL,0.0001–0.2 mg/mL, and 0.001–0.25 mg/mL of 2, 3, and 4,respectively.
8 International Journal of Analytical Chemistry
4.7. Preparation of Assay Solutions of Drugs in PlasmaSamples. Two hundred μL of spiked human plasma samples(cf. preparation of spiked human plasma samples) weremixed with 1800 μL methanol and centrifuged for 15 minutesto separate the precipitated protein. The clear supernatantwas filtered through Millipore filter (0.45 μm) to obtainsolutions in concentration range of 0.01–1.5 mg/mL, 0.1–10 μg/mL, 0.01–20μg/mL, and 0.1–25 μg/mL for 1, 2, 3, and4, respectively.
4.8. Determination of 2 and 4 in Volunteer’s Blood. Bloodsample was withdrawn in a test tube to which heparin waspreviously added and dried. The sample was centrifuged toseparate plasma and then treated as previously mentionedunder preparation of assay solutions of 2 and 4 in plasmasamples (cf. preparation of assay solutions of drugs in plasmasamples).
4.9. N1-Methylnicotinamide Chloride Reagent (NMNCl). TenmM solution NMNCl reagent was prepared by dissolving17.262 g NMNCl in one liter of 10−4 N HCl. Aliquots ofthis solution were diluted with distilled water to obtain1.0 mM, 2.0× 10⁻¹ mM, 4.0× 10⁻¹ mM, and 5.0× 10⁻¹ mMsolutions.
4.10. General Fluorometric Procedure. One milliliter of eachdrug standard solutions, assay solutions of synthetic mix-tures, assay solutions of pharmaceutical preparations, assaysolutions of plasma samples, or the assay solution of thevolunteer’s plasma was transferred to 10.0 mL screw-cappedtest tube. Solutions of sodium hydroxide and NMNCl wereadded. The mixture was cooled (in ice) for the indicatedtime, then the pH was adjusted using formic acid andheated for the indicated time and then was cooled in icefor 5 minutes (optimum NaOH concentration and volume,volume and concentration of added NMNCl, reaction pHvalues) and cooling and heating times are indicated inTable 1. The mixture was transferred to 10.0 mL volumetricflask, and the resulting solution was completed using distilledwater. In case of 4, the pH of the reaction productwas adjusted to 10.0 before completing to volume withdistilled water. The intensity of the resulting fluorescence wasmeasured at the optimal wavelengths indicated in Table 1.The fluorometric measurements were performed againstreagent blank experiments. Concentrations of the drugswere calculated from the corresponding calibration graphsprepared simultaneously.
References
[1] M. A. Eldawy, M. M. Mabrouk, and R. A. Elbarbary, “Spec-trofluorimetric determination of warfarin sodium by usingN1-methylnicotinamide chloride as a fluorigenic agent,” Jour-nal of Association of OfficialAnalytical Chemists International,vol. 88, pp. 455–461, 2005.
[2] M. A. El Dawy, M. M. Mabrouk, and R. A. El Barbary,“Spectrofluorimetric determination of drugs containing activemethylene group using N-methyl nicotinamide chloride as afluorigenic agent,” Chemical and Pharmaceutical Bulletin, vol.54, no. 7, pp. 1026–1029, 2006.
[3] D. Mitchell, S. J. Bock, and M. S. M. Sulfur, “Natural Healthand Longevity Resource Center,” October 2010, http://www.all-natural.com/msm.html.
[4] MSM, “Life Extension Foundation,” October 2010, http://www.lef.org/newshop/items/item00451.html.
[5] MSM, “Natural Ways to Health,” October 2010, http://www.naturalways.com/MSM.htm.
[6] C. Arsene, I. Barnes, K. H. Becker, and R. Mocanu, “FT-IRproduct study on the photo-oxidation of dimethyl sulphide inthe presence of NO—temperature dependence,” AtmosphericEnvironment, vol. 35, no. 22, pp. 3769–3780, 2001.
[7] Y. C. Ling, T. J. Vickers, and C. K. Mann, “Backgroundcorrection in raman spectroscopic determination of dimethyl-sulfone, sulfate, and bisulfate,” Applied Spectroscopy, vol. 39,pp. 463–470, 1983.
[8] H. Berresheim, D. J. Tanner, and F. L. Eisele, “Method for real-time detection of dimethyl sulfone in ambient air,” AnalyticalChemistry, vol. 65, no. 21, pp. 3168–3170, 1993.
[9] R. F. Lang and C. J. Brown, “Determination of dimethylsulfoxide and dimethyl sulfone in air,” Analytical Chemistry,vol. 63, no. 2, pp. 185–189, 1991.
[10] A. C. Mehta, S. Peaker, C. Acomb, and R. T. Calvert, “Rapid gaschromatographic determination of dimethyl sulphoxide andits metabolite dimethyl sulphone in plasma and urine,” Journalof Chromatography—Biomedical Applications, vol. 383, no. 2,pp. 400–404, 1986.
[11] N. Moreira, P. Guedes De Pinho, and I. Vasconcelos, “Methodfor analysis of heavy sulphur compounds using gas chro-matography with flame photometric detection,” AnalyticaChimica Acta, vol. 513, no. 1, pp. 183–189, 2004.
[12] J. L. Liu, S. Li, Z. H. Li, and H. Ma, “Capillary gas-chromatographic separation and determination of dimethylsulfoxide and dimethyl sulfone,” Lihua Jianyan Huaxue Fence,vol. 38, pp. 283–284, 2002.
[13] A. Willse, A. M. Belcher, G. Preti et al., “Identification ofmajor histocompatibility complex-regulated body odorants bystatistical analysis of a comparative gas chromatography/massspectrometry experiment,” Analytical Chemistry, vol. 77, no. 8,pp. 2348–2361, 2005.
[14] A. C. Silva Ferreira, P. Rodrigues, T. Hogg, and P. G. DePinho, “Influence of some technological parameters on theformation of dimethyl sulfide, 2-mercaptoethanol, methionol,and dimethyl sulfone in port wines,” Journal of Agriculturaland Food Chemistry, vol. 51, no. 3, pp. 727–732, 2003.
[15] D. T. T. Vu, “SPME/GC-MS characterization of volatilesassociated with methamphetamine: toward the developmentof a pseudomethamphetamine training material,” Journal ofForensic Sciences, vol. 46, no. 5, pp. 1014–1024, 2001.
[16] C. Peres, C. Denoyer, P. Tournayre, and J. L. Berdague,“Fast characterization of cheeses by dynamic headspace-massspectrometry,” Analytical Chemistry, vol. 74, no. 6, pp. 1386–1392, 2002.
[17] D. Saccu, P. Bogoni, and G. Procida, “Aloe exudate: charac-terization by reversed phase HPLC and headspace GC-MS,”Journal of Agricultural and Food Chemistry, vol. 49, no. 10, pp.4526–4530, 2001.
[18] E. Valero, J. Sanz, and I. Martınez-Castro, “Direct thermaldesorption in the analysis of cheese volatiles by gas chromatog-raphy and gas chromatography-mass spectrometry: compar-ison with simultaneous distillation-extraction and dynamicheadspace,” Journal of Chromatographic Science, vol. 39, no. 6,pp. 222–228, 2001.
[19] British Pharmacopoeia, Her-Majesty’s Stationary Office, Lon-don, UK, 2005.
International Journal of Analytical Chemistry 9
[20] United States Pharmacopoeia, vol. 28, United States Pharma-copoeia Convention, Washington, DC, USA, 2005.
[21] J. Z. Wang, B. Liu, and X. Q. Sun, “Determination of tinidazoleby fluorimetry,” Fenxi Ceshi Xuebao, vol. 23, pp. 76–79, 2004.
[22] X. C. Fu, G. P. Wang, Y. H. Wang, and W. Q. Liang, “Apredictive model for the release of slightly water-soluble drugsfrom HPMC matrices,” Pharmazie, vol. 59, no. 8, pp. 624–626,2004.
[23] C. H. Yang, “Voltammetric determination of tinidazole usinga glassy carbon electrode modified with single-wall carbonnanotubes,” Analytical Sciences, vol. 20, no. 5, pp. 821–824,2004.
[24] A. P. Argekar and J. G. Sawant, “Simultaneous determinationof ciprofloxacin hydrochloride and tinidazole in tablets byHPTLC,” Journal of Planar Chromatography—Modern TLC,vol. 12, no. 3, pp. 202–206, 1999.
[25] A. P. Argekar and S. G. Powar, “Simultaneous determinationof diloxanide furoate and tinidazole in tablets by high-performance thin-layer chromatography,” Journal of PlanarChromatography—Modern TLC, vol. 12, no. 6, pp. 452–455,1999.
[26] H. Sun, F. Wang, L. Ai, C. Guo, and R. Chen, “Validatedmethod for determination of eight banned nitroimida-zole residues in natural casings by LC/MS/MS with Solid-Phase Extraction,” Journal of Association of Official AnalyticalChemists International, vol. 92, no. 2, pp. 612–621, 2009.
[27] Y. J. Yang, X. Y. Li, and H. Y. Li, “HPLC determination ofrelated substances and content of tinidazole colon targetingtablets,” Yaowu Fenxi Zazhi, vol. 24, pp. 614–616, 2004.
[28] G. S. Sadana and M. V. Gaonkar, Indian Drugs, vol. 22, pp.241–246, 1989.
[29] Y. Cheng, E. Ho, B. Subramanyam, and J. L. Tseng, “Measure-ments of drug-protein binding by using immobilized humanserum albumin liquid chromatography-mass spectrometry,”Journal of Chromatography B: Analytical Technologies in theBiomedical and Life Sciences, vol. 809, no. 1, pp. 67–73, 2004.
[30] Vioxx� (rofecoxib) Information Center. Merk & Co.,Inc, October 2010 http://www.merck.com/newsroom/vioxxwithdrawal.
[31] Vioxx information, “Defective drugs, eJustice,” October2009,http://www.adrugrecall.com/vioxx/information.html.
[32] M. A. Shehata, A. Ashour, N. Y. Hassan, A. S. Fayed, andB. A. El-Zeany, “Liquid chromatography and chemometricmethods for determination of rofecoxib in presence of itsphotodegradate and alkaline degradation products,” AnalyticaChimica Acta, vol. 519, no. 1, pp. 23–30, 2004.
[33] N. Erk and T. G. Altuntas, “Comparison of derivativespectrophotometric and liquid chromatographic methods forthe determination of rofecoxib,” Pharmazie, vol. 59, no. 6, pp.453–456, 2004.
[34] A. Duran, B. Bekce, and H. N. Dogan, “Quantitativedetermination of rofecoxib in pharmaceutical preparations,”Pharmazie, vol. 59, no. 1, pp. 71–72, 2004.
[35] N. Kaul, S. R. Dhaneshwar, H. Agrawal, A. Kakad, and B.Patil, “Application of HPLC and HPTLC for the simultaneousdetermination of tizanidine and rofecoxib in pharmaceuticaldosage form,” Journal of Pharmaceutical and BiomedicalAnalysis, vol. 37, no. 1, pp. 27–38, 2005.
[36] M. Amini, M. P. Hamedani, M. Vosooghi, M. Nabavi, andA. Shafiee, “Pre-column derivatization of rofecoxib for deter-mination in serum by HPLC,” Analytical and BioanalyticalChemistry, vol. 382, no. 5, pp. 1265–1268, 2005.
[37] P. R. Tiller, L. A. Romanyshyn, and U. D. Neue, “Fast LC/MSin the analysis of small molecules,” Analytical and BioanalyticalChemistry, vol. 377, no. 5, pp. 788–802, 2003.
[38] Nimesulide, “PharmaceuticalIndustry, India,” October 2010,http://www.pharma-india.com/nimesulide.html.
[39] BritishPharmacopoeia, Her-Majesty’s Stationary Office, Lon-don, UK, 2005.
[40] Nimesulide Information, “Helsinn Healthcare SA,” October2010, http://www.nimesulide.net/nimesulide.htm.
[41] M. Blanco, M. A. Romero, and M. Alcala, “Strategies for con-structing the calibration set for a near infrared spectroscopicquantitation method,” Talanta, vol. 64, no. 3, pp. 597–602,2004.
[42] D. Mrinalini, A. Madgulkar, D. Juvale, B. Awate, and A.Zambre, “Simultaneous spectrophotometric estimation ofnimesulide and chlorzoxazone in tablet dosage form,” IndianDrugs, vol. 38, no. 11, pp. 576–579, 2001.
[43] H. Ferreira, M. Lucio, B. De Castro, P. Gameiro, J. L. F. C.Lima, and S. Reis, “Partition and location of nimesulide inEPC liposomes: a spectrophotometric and fluorescence study,”Analytical and Bioanalytical Chemistry, vol. 377, no. 2, pp.293–298, 2003.
[44] S. G. Navalgund, P. S. Prabhu, P. S. Sahasrabudhe, H. K.Deepa, and R. T. Sane, “A simple colorimetric method forthe determination of nimesulide from its pharmaceuticalpreparation,” Indian Drugs, vol. 37, no. 4, pp. 209–210, 2000.
[45] R. I. L. Catarino, A. C. L. Conceicao, M. B. Q. Garcia, M.L. S. Goncalves, J. L. F. C. Lima, and M. M. C. Dos Santos,“Flow amperometric determination of pharmaceuticals withon-line electrode surface renewal,” Journal of Pharmaceuticaland Biomedical Analysis, vol. 33, no. 4, pp. 571–580, 2003.
[46] S. Furlanetto, S. Orlandini, G. Aldini, R. Gotti, E. Dreassi,and S. Pinzauti, “Designing experiments to optimise andvalidate the adsorptive stripping voltammetric determinationof nimesulide,” Analytica Chimica Acta, vol. 413, no. 1-2, pp.229–239, 2000.
[47] C. M. B. Rolim, V. Porta, and S. Storpirtis, “Quantitationof nimesulide in human plasma by high-performance liquidchromatography with ultraviolet absorbance detection and itsapplication to a bioequivalence study,” Arzneimittel-Forschung,vol. 57, no. 8, pp. 537–541, 2007.
[48] A. Maltese, F. Maugeri, and C. Bucolo, “Rapid determinationof nimesulide in rabbit aqueous humor by liquid chromatog-raphy,” Journal of Chromatography B: Analytical Technologies inthe Biomedical and Life Sciences, vol. 804, no. 2, pp. 441–443,2004.
[49] R. E. Barrientos-Astigarraga, Y. B. Vannuchi, M. Sucupira, R.A. Moreno, M. N. Muscara, and G. De Nucci, “Quantificationof nimesulide in human plasma by high-performance liquidchromatography/tandem mass spectrometry. Application tobioequivalence studies,” Journal of Mass Spectrometry, vol. 36,no. 12, pp. 1281–1286, 2001.
[50] H. Nakamura and Z. Tamura, “Fluorometric assay of α-methylene carbonyl compounds with N-methylnicotinamidechloride,” Analytical Chemistry, vol. 50, no. 14, pp. 2047–2051,1978.
[51] “Validation of Analytical Procedures: Text and MethodologyICH,” October 2010, http://www.ich.org/cache/compo/363-272-1.html#Q2A.

Submit your manuscripts athttp://www.hindawi.com
Hindawi Publishing Corporationhttp://www.hindawi.com Volume 2014
Inorganic ChemistryInternational Journal of
Hindawi Publishing Corporation http://www.hindawi.com Volume 2014
International Journal ofPhotoenergy
Hindawi Publishing Corporationhttp://www.hindawi.com Volume 2014
Carbohydrate Chemistry
International Journal of
Hindawi Publishing Corporationhttp://www.hindawi.com Volume 2014
Journal of
Chemistry
Hindawi Publishing Corporationhttp://www.hindawi.com Volume 2014
Advances in
Physical Chemistry
Hindawi Publishing Corporationhttp://www.hindawi.com
Analytical Methods in Chemistry
Journal of
Volume 2014
Bioinorganic Chemistry and ApplicationsHindawi Publishing Corporationhttp://www.hindawi.com Volume 2014
SpectroscopyInternational Journal of
Hindawi Publishing Corporationhttp://www.hindawi.com Volume 2014
The Scientific World JournalHindawi Publishing Corporation http://www.hindawi.com Volume 2014
Medicinal ChemistryInternational Journal of
Hindawi Publishing Corporationhttp://www.hindawi.com Volume 2014
Chromatography Research International
Hindawi Publishing Corporationhttp://www.hindawi.com Volume 2014
Applied ChemistryJournal of
Hindawi Publishing Corporationhttp://www.hindawi.com Volume 2014
Hindawi Publishing Corporationhttp://www.hindawi.com Volume 2014
Theoretical ChemistryJournal of
Hindawi Publishing Corporationhttp://www.hindawi.com Volume 2014
Journal of
Spectroscopy
Analytical ChemistryInternational Journal of
Hindawi Publishing Corporationhttp://www.hindawi.com Volume 2014
Journal of
Hindawi Publishing Corporationhttp://www.hindawi.com Volume 2014
Quantum Chemistry
Hindawi Publishing Corporationhttp://www.hindawi.com Volume 2014
Organic Chemistry International
ElectrochemistryInternational Journal of
Hindawi Publishing Corporation http://www.hindawi.com Volume 2014
Hindawi Publishing Corporationhttp://www.hindawi.com Volume 2014
CatalystsJournal of

![Highly Branched Poly(α-Methylene-γ-Butyrolactone) from …file.scirp.org/pdf/OJPChem_2017112914172525.pdf · 2017-12-01 · ... (3.00 g, 0.013 mol), and L-valinol [(S)-(+)-2-Amino-3-methyl-1-butanol]](https://static.fdocument.org/doc/165x107/5b1be3007f8b9a28258f0d54/highly-branched-poly-methylene-butyrolactone-from-filescirporgpdfojpchem.jpg)