Failure Theories Why do parts fail? What kind of stresses? What else should be considered?
14
Failure Theories Why do parts fail? What kind of stresses? What else should be considered?
-
date post
20-Dec-2015 -
Category
Documents
-
view
235 -
download
5
Transcript of Failure Theories Why do parts fail? What kind of stresses? What else should be considered?
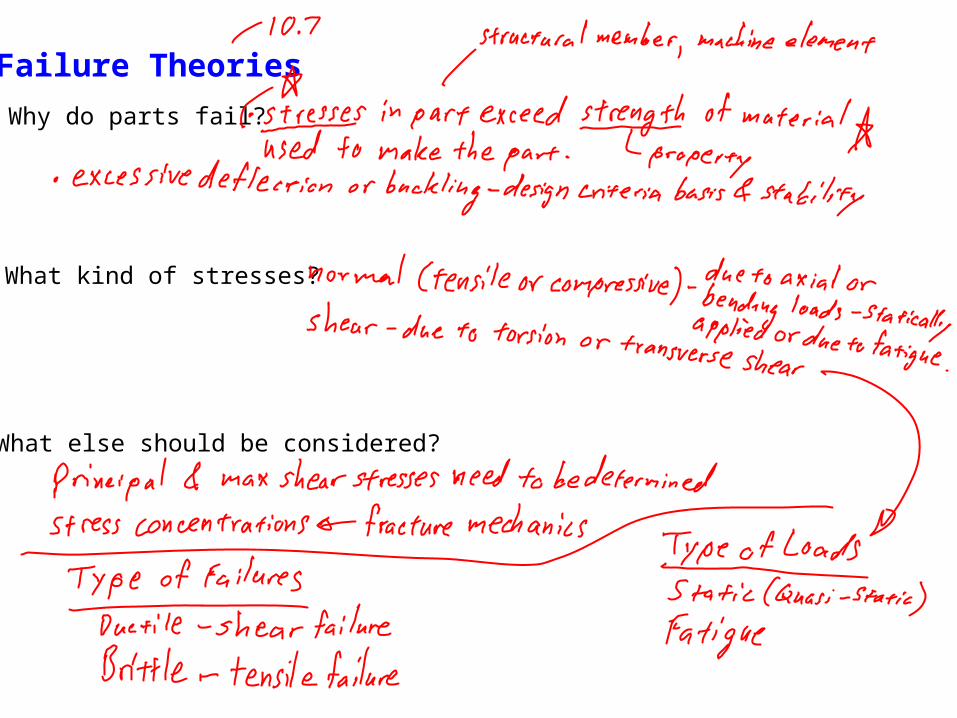
Failure Theories
Why do parts fail?
What kind of stresses?
What else should be considered?
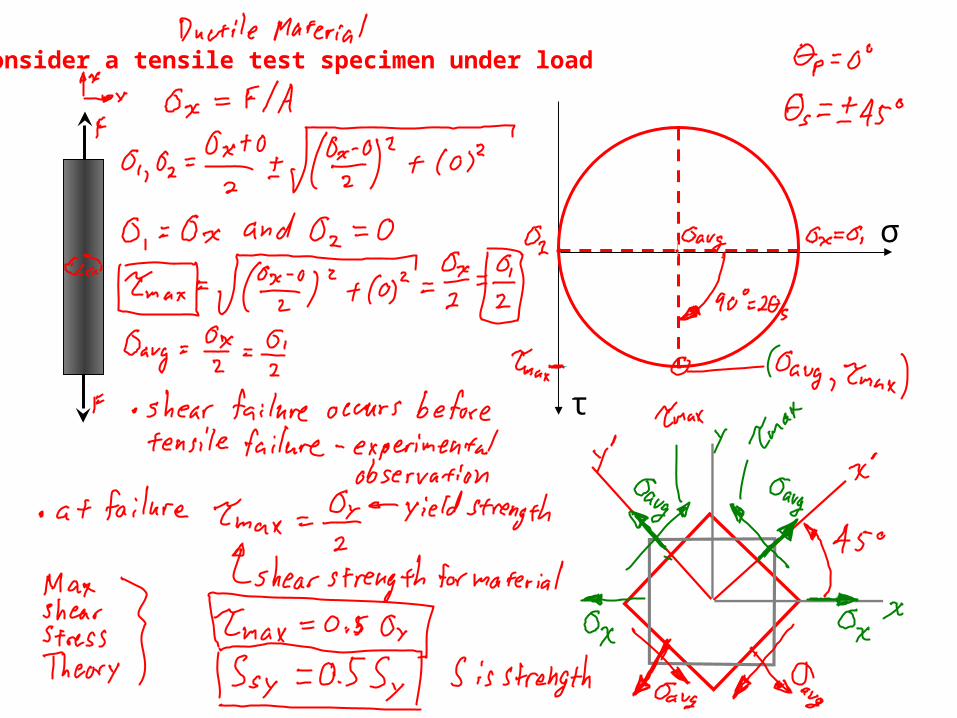
Consider a tensile test specimen under load
σ
τ
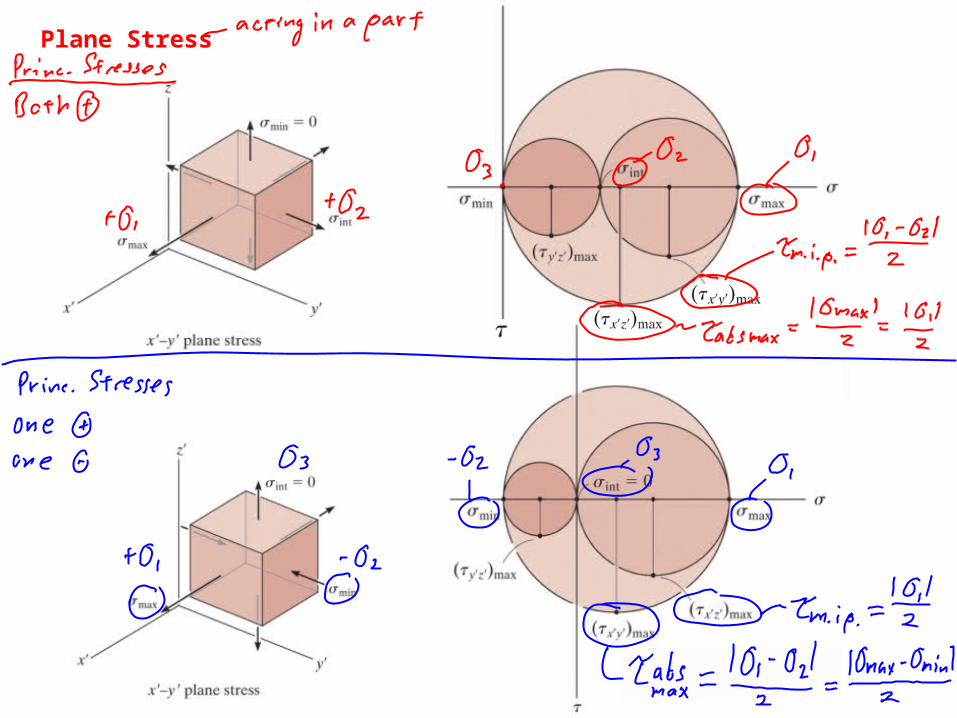
Plane Stress
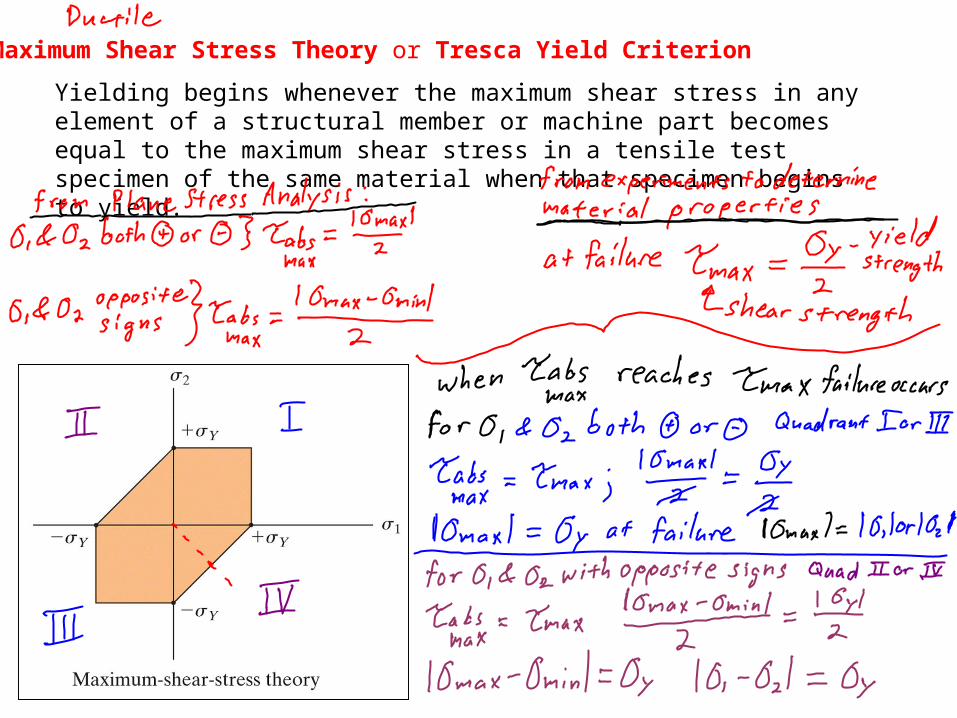
Maximum Shear Stress Theory or Tresca Yield Criterion
Yielding begins whenever the maximum shear stress in any element of a structural member or machine part becomes equal to the maximum shear stress in a tensile test specimen of the same material when that specimen begins to yield.
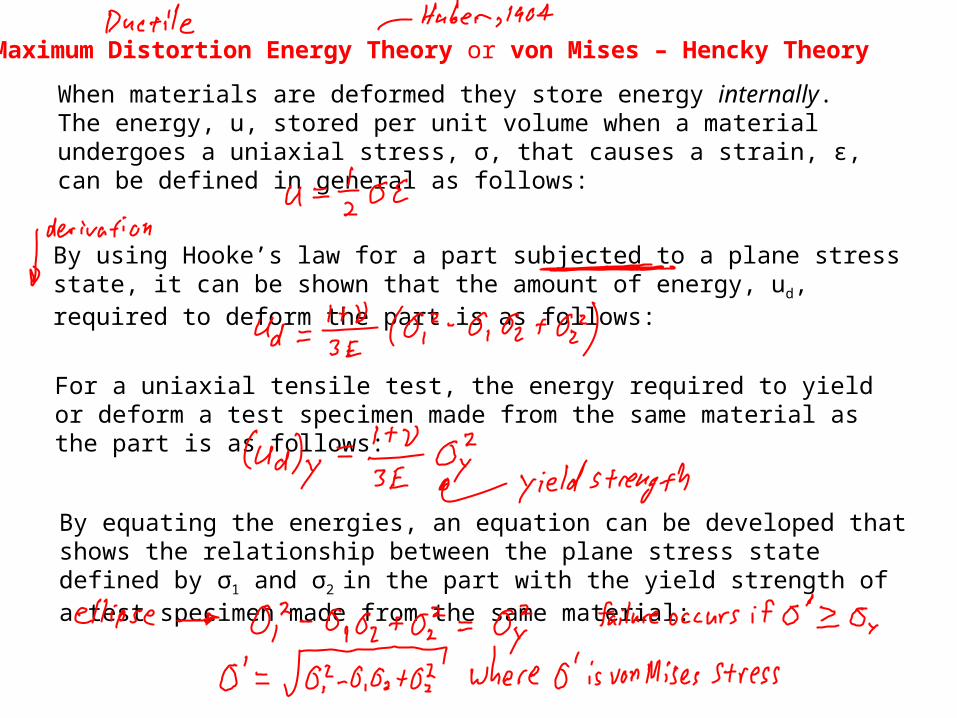
Maximum Distortion Energy Theory or von Mises – Hencky Theory
When materials are deformed they store energy internally. The energy, u, stored per unit volume when a material undergoes a uniaxial stress, σ, that causes a strain, ε, can be defined in general as follows:
By using Hooke’s law for a part subjected to a plane stress state, it can be shown that the amount of energy, ud, required to deform the part is as follows:
For a uniaxial tensile test, the energy required to yield or deform a test specimen made from the same material as the part is as follows:
By equating the energies, an equation can be developed that shows the relationship between the plane stress state defined by σ1 and σ2 in the part with the yield strength of a test specimen made from the same material:
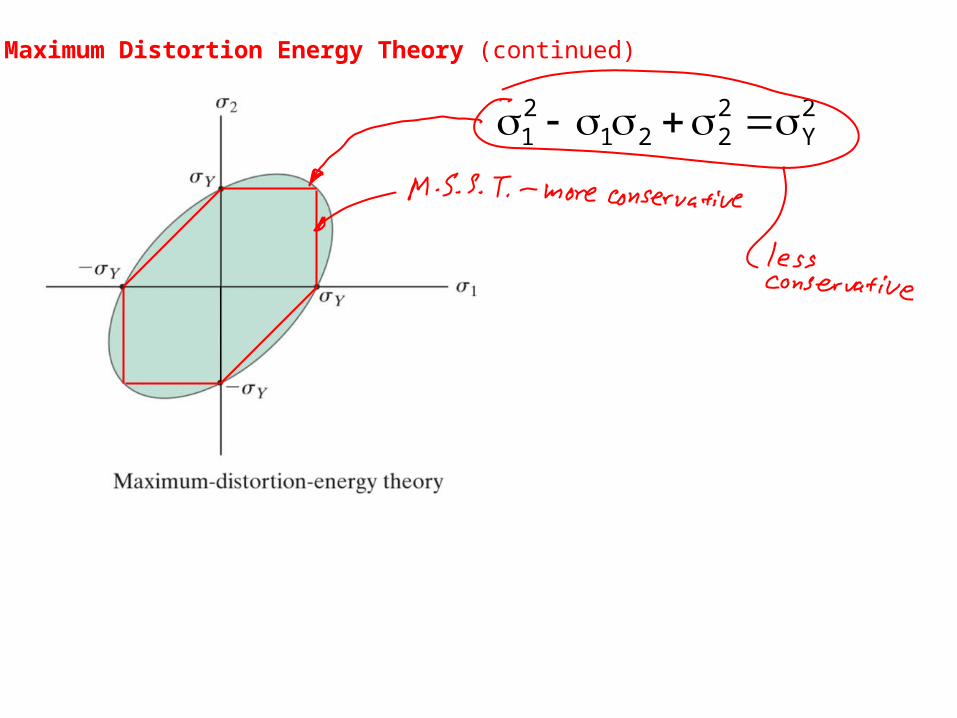
Maximum Distortion Energy Theory (continued)
2Y
2221
21
σA
σB
I
IV A
utS
n
1
n S SA
ut
B
uc
BAutAuc
utuc
σσSσS
SSn
B utS
B utS
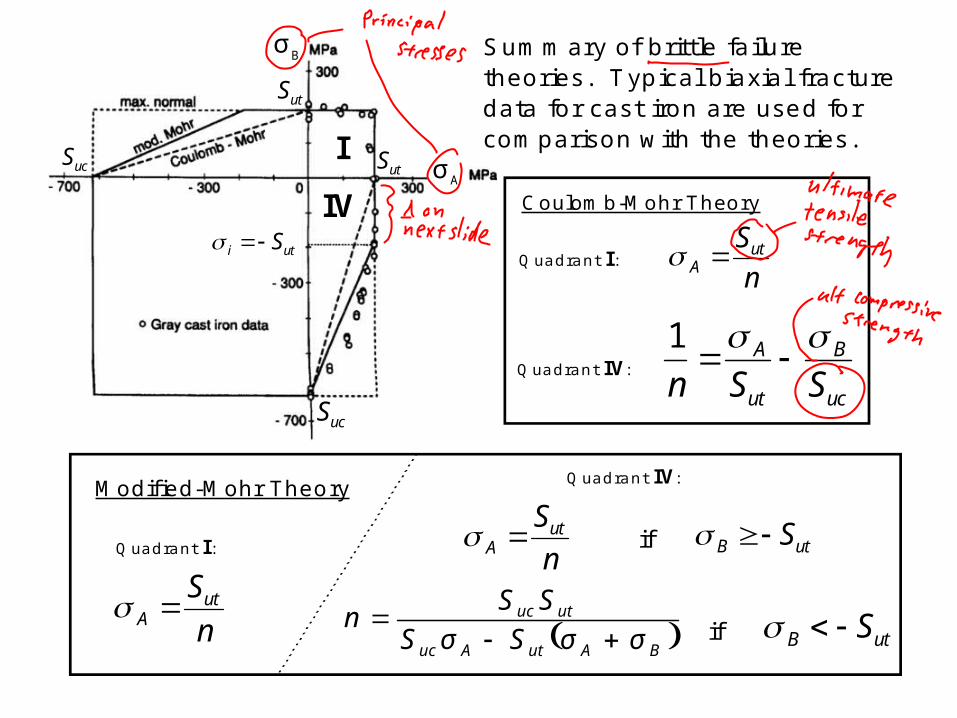
Coulomb-Mohr Theory
Quadrant I:
Quadrant IV:
Modified-Mohr Theory
Quadrant I:
AutS
n
Quadrant IV:
AutS
n if
if
Summary of brittle failuretheories. Typical biaxial fracturedata for cast iron are used forcomparison with the theories.
Sut
Sut
Suc
Suc
i utS

Experimental data from tensile tests superimposed on three failure theories.(from Mechanical Behavior of Materials by N.E. Dowling, Prentice-Hall, NJ, 1993.)
! For tensile loading conditions, the load is applied gradually allowing thestrain and corresponding stress to develop in a static or quasistatic manner. Many structural parts and machine parts are subject to these static conditions.
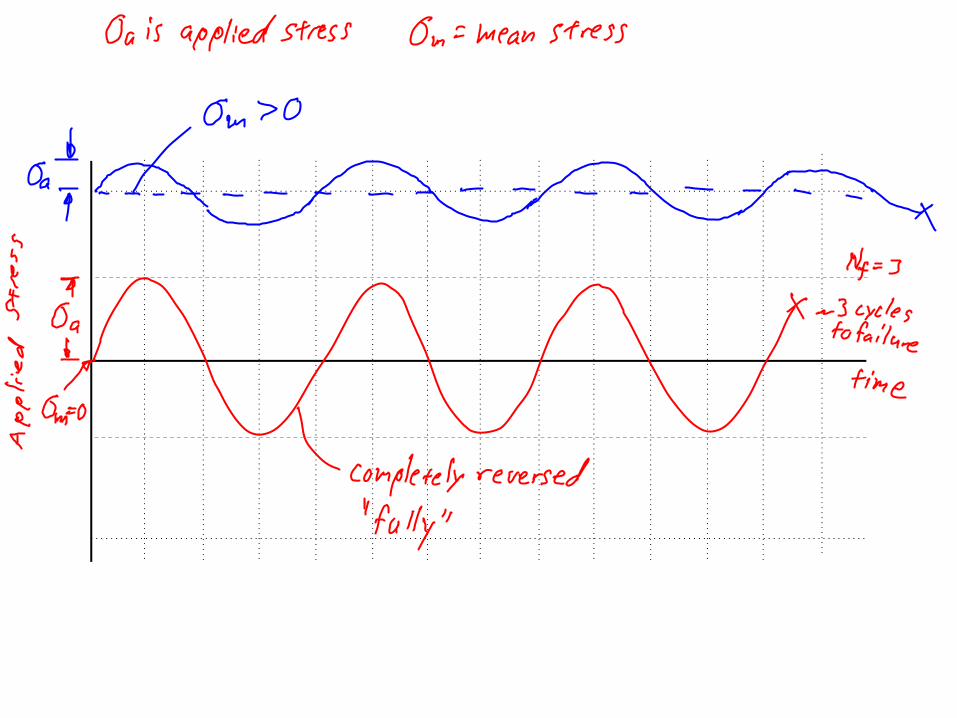
! For fatigue loading conditions, the load varies or fluctuates between twoextremes. (Example: rotating shafts which can have both axial and bendingcyclic loads.)
! Fatigue failures are dangerous!
– The maximum stress for a fatigue failure is lower than the ultimate strength.– Fatigue failures occur suddenly, and the phenomena are complicated.
! Fatigue failures begin at cracks or surface irregularities. An existing flaw ordefect can develop into a crack, and then a fracture process occurs.
Tensile Failures versus Fatigue Failures
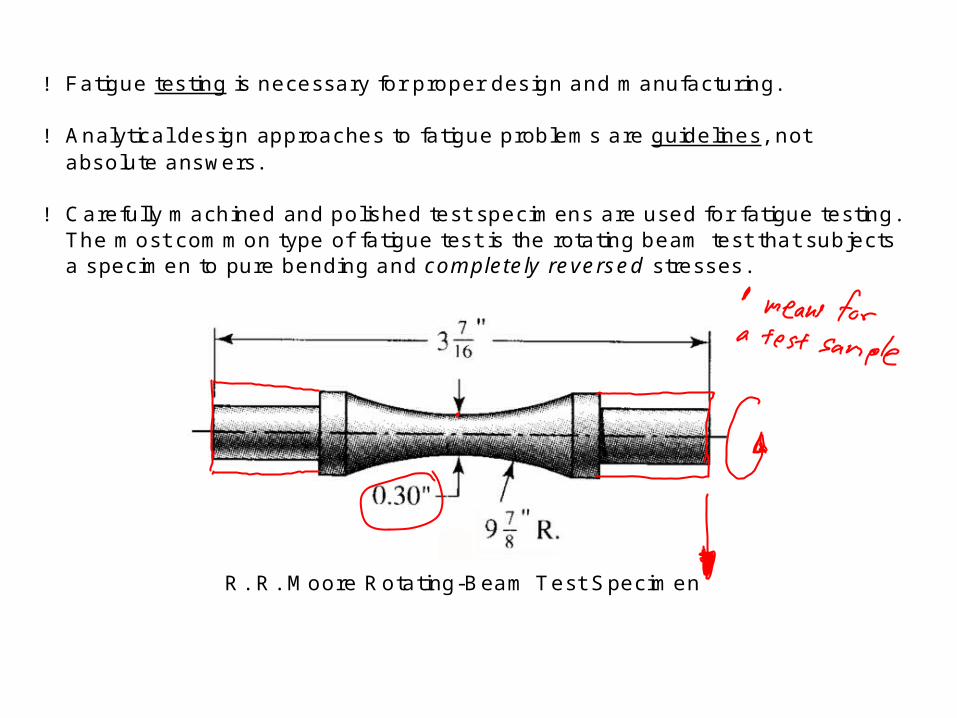
! Fatigue testing is necessary for proper design and manufacturing.
! Analytical design approaches to fatigue problems are guidelines, notabsolute answers.
! Carefully machined and polished test specimens are used for fatigue testing.The most common type of fatigue test is the rotating beam test that subjectsa specimen to pure bending and completely reversed stresses.
R. R. Moore Rotating-Beam Test Specimen
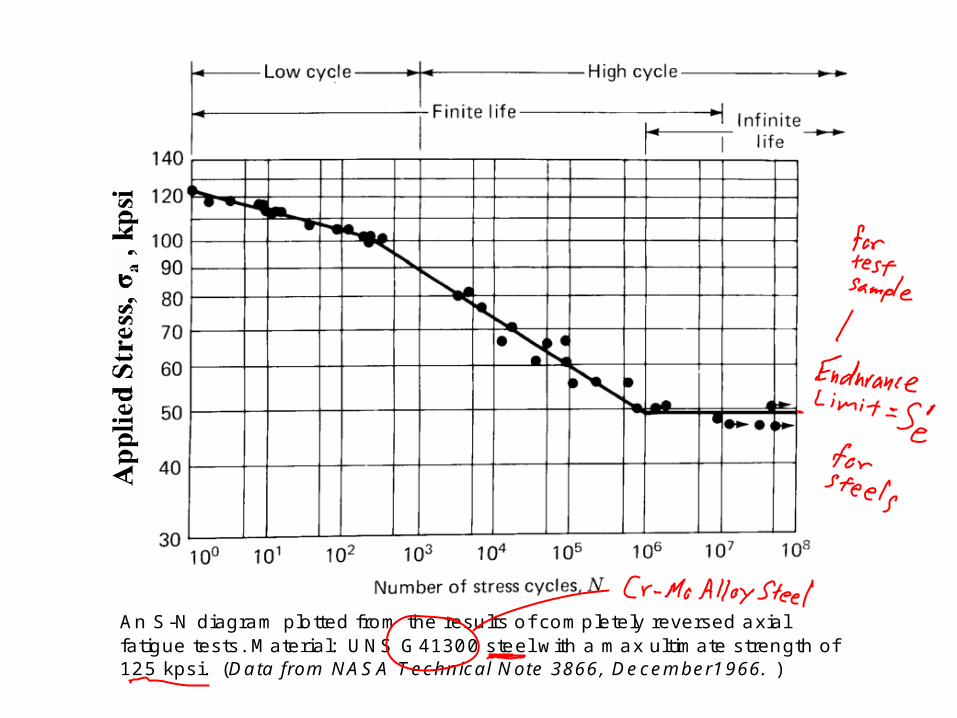
An S-N diagram plotted from the results of completely reversed axialfatigue tests. Material: UNS G41300 steel with a max ultimate strength of125 kpsi. (Data from NASA Technical Note 3866, December1966. )
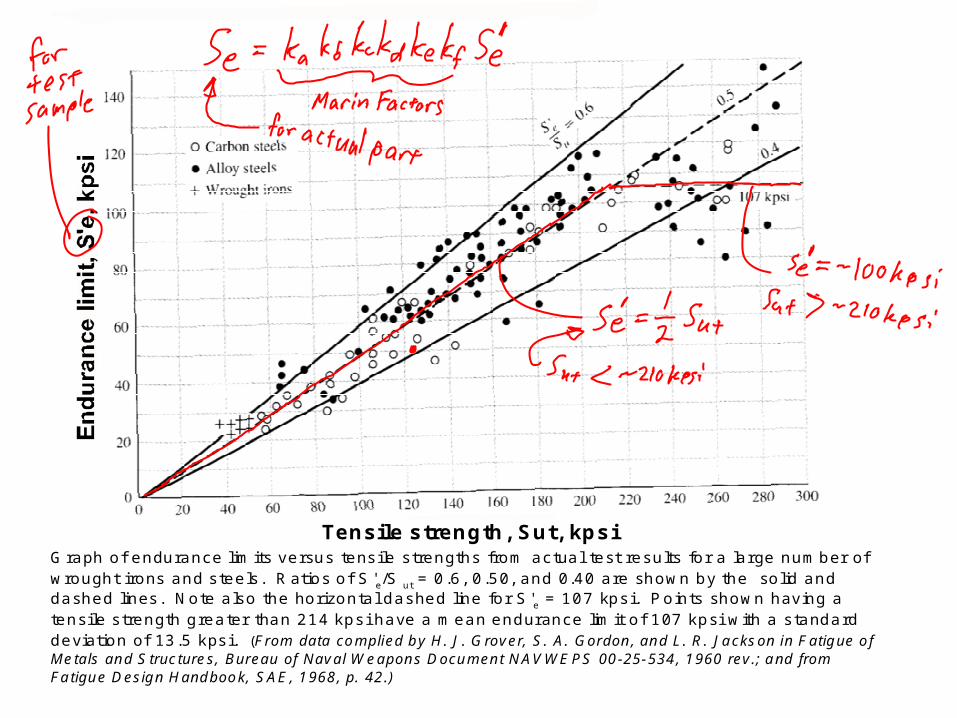
Tensile strength, Sut, kpsiGraph of endurance limits versus tensile strengths from actual test results for a large number ofwrought irons and steels. Ratios of S'e/S ut = 0.6, 0.50, and 0.40 are shown by the solid anddashed lines. Note also the horizontal dashed line for S'e = 107 kpsi. Points shown having atensile strength greater than 214 kpsi have a mean endurance limit of 107 kpsi with a standarddeviation of 13.5 kpsi. (From data complied by H. J. Grover, S. A. Gordon, and L. R. Jackson in Fatigue ofMetals and Structures, Bureau of Naval Weapons Document NAVWEPS 00-25-534, 1960 rev.; and fromFatigue Design Handbook, SAE, 1968, p. 42.)
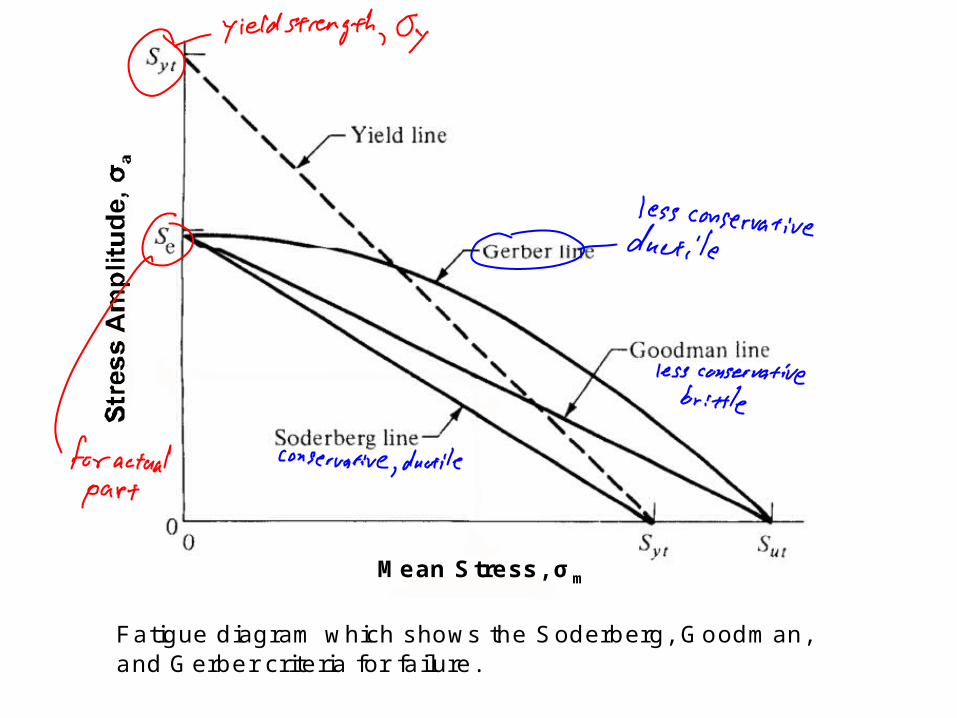
Fatigue diagram which shows the Soderberg, Goodman,and Gerber criteria for failure.
Mean Stress, σm