Experiments with Statistical Downscaling of Precipitation for … · 2012-08-16 · GCM grid scale)...
36
Experiments with Statistical Downscaling of Precipitation for South Florida Region: Issues & Observations Ramesh S. V. Teegavarapu Aneesh Goly Hydrosystems Research Laboratory (HRL) Department of Civil, Environmental and Geomatics Engineering, Florida Atlantic University, Boca Raton, FL, 33431 Everglades Workshop, March 29, 2012
Transcript of Experiments with Statistical Downscaling of Precipitation for … · 2012-08-16 · GCM grid scale)...
Experiments with Statistical Downscaling of Precipitation for South Florida Region: Issues
& Observations
Ramesh S. V. TeegavarapuAneesh Goly
Hydrosystems Research Laboratory (HRL)Department of Civil, Environmental
and Geomatics Engineering,Florida Atlantic University, Boca Raton, FL, 33431
Everglades Workshop, March 29, 2012
Statistical Downscaling
ϕ ρσβ
From a drop of water a logician could predict
an Atlantic or a Niagara- Sir Arthur C. Doyle.
Illustration source: Teegavarapu (2012)
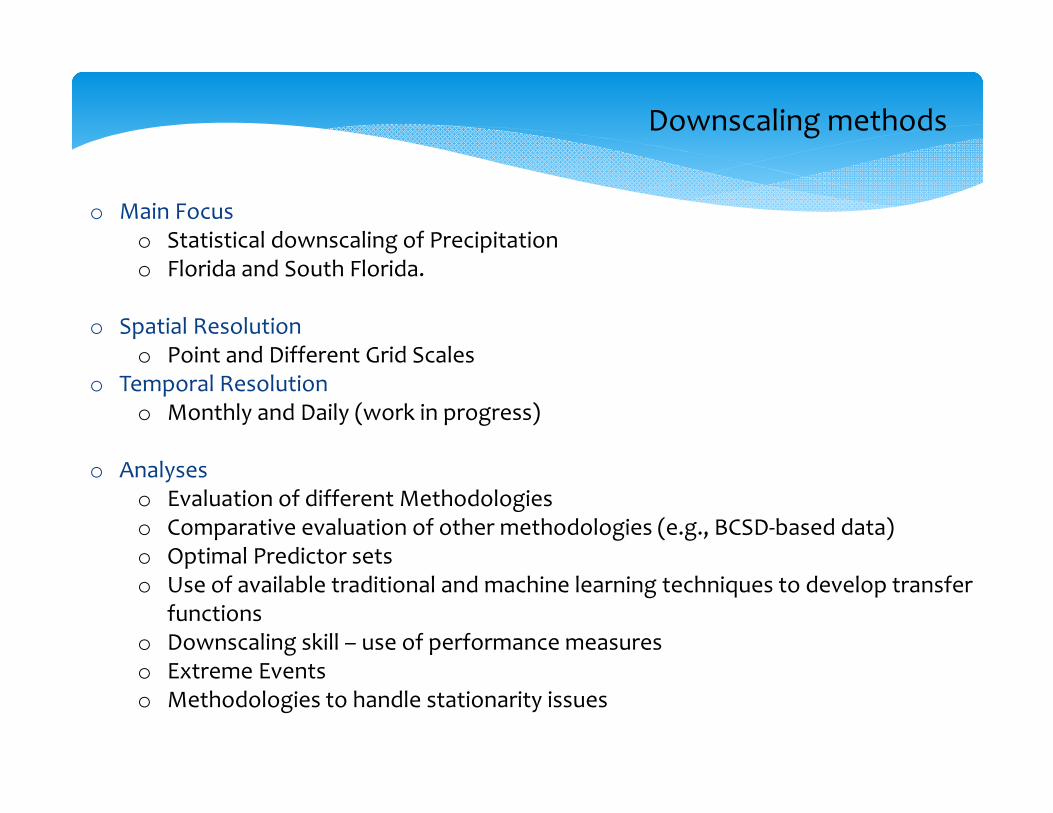
Downscaling methods
o Main Focus o Statistical downscaling of Precipitation o Florida and South Florida.
o Spatial Resolutiono Point and Different Grid Scales
o Temporal Resolutiono Monthly and Daily (work in progress)
o Analyseso Evaluation of different Methodologieso Comparative evaluation of other methodologies (e.g., BCSD‐based data)o Optimal Predictor setso Use of available traditional and machine learning techniques to develop transfer
functionso Downscaling skill – use of performance measureso Extreme Eventso Methodologies to handle stationarity issues
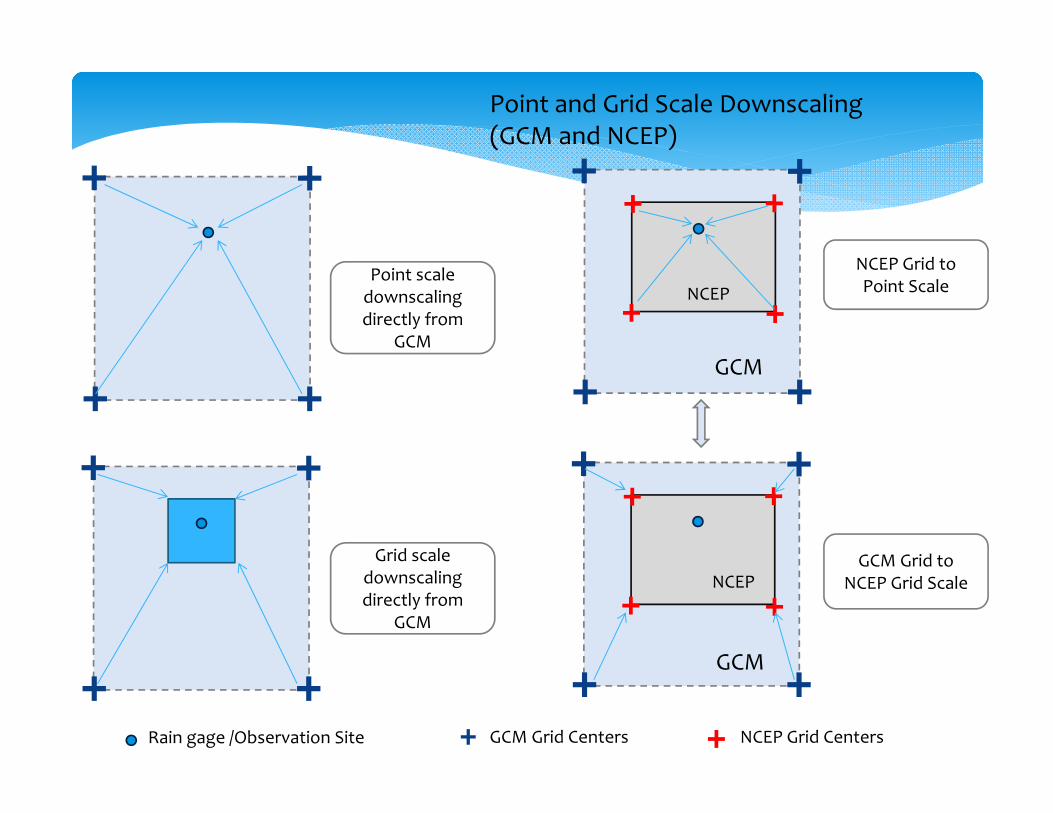
Point and Grid Scale Downscaling (GCM and NCEP)
++
++++
++
Point scale downscaling directly from
GCM
Grid scale downscaling directly from
GCM
Rain gage /Observation Site
++
++
+
+
+
+ NCEP
GCM
++
++
+
+
+
+GCM
NCEP
NCEP Grid to Point Scale
GCM Grid to NCEP Grid Scale
+ GCM Grid Centers + NCEP Grid Centers
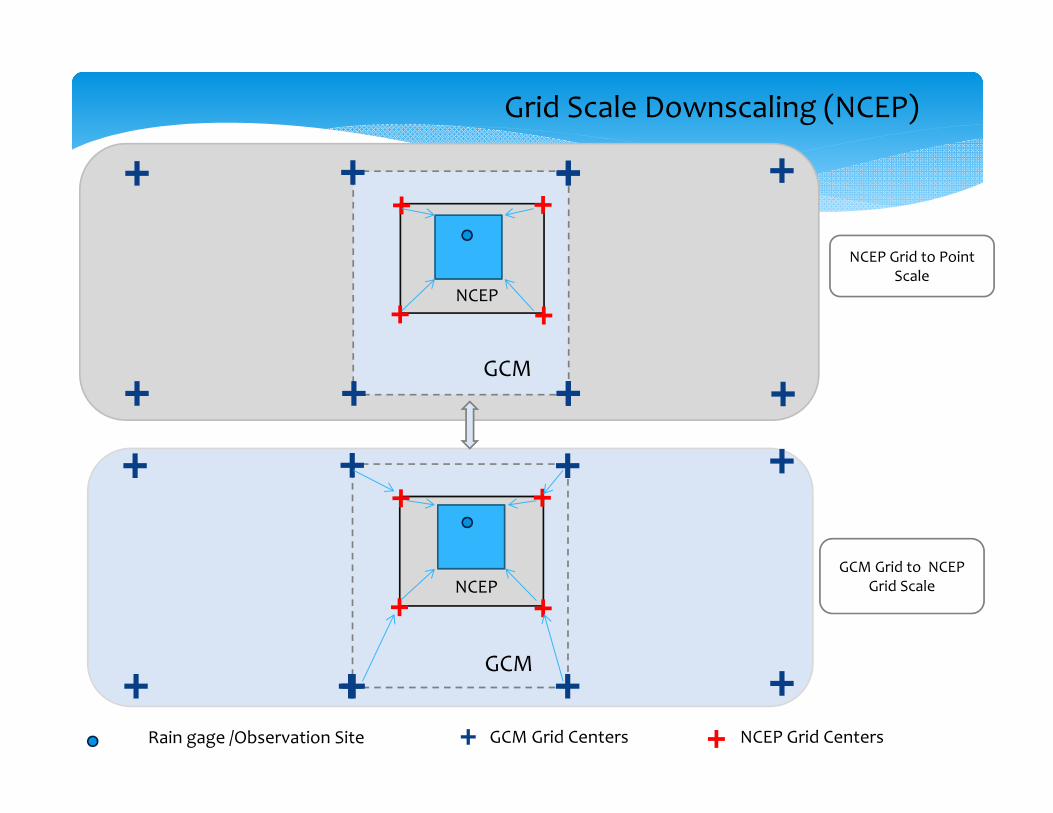
Grid Scale Downscaling (NCEP)
+
++
++Rain gage /Observation Site
++
++
+
+
+
+ NCEP
GCM
++
++
+
+
+
+GCM
NCEP
NCEP Grid to Point Scale
GCM Grid to NCEP Grid Scale
+ GCM Grid Centers + NCEP Grid Centers
+
++
+
+
+
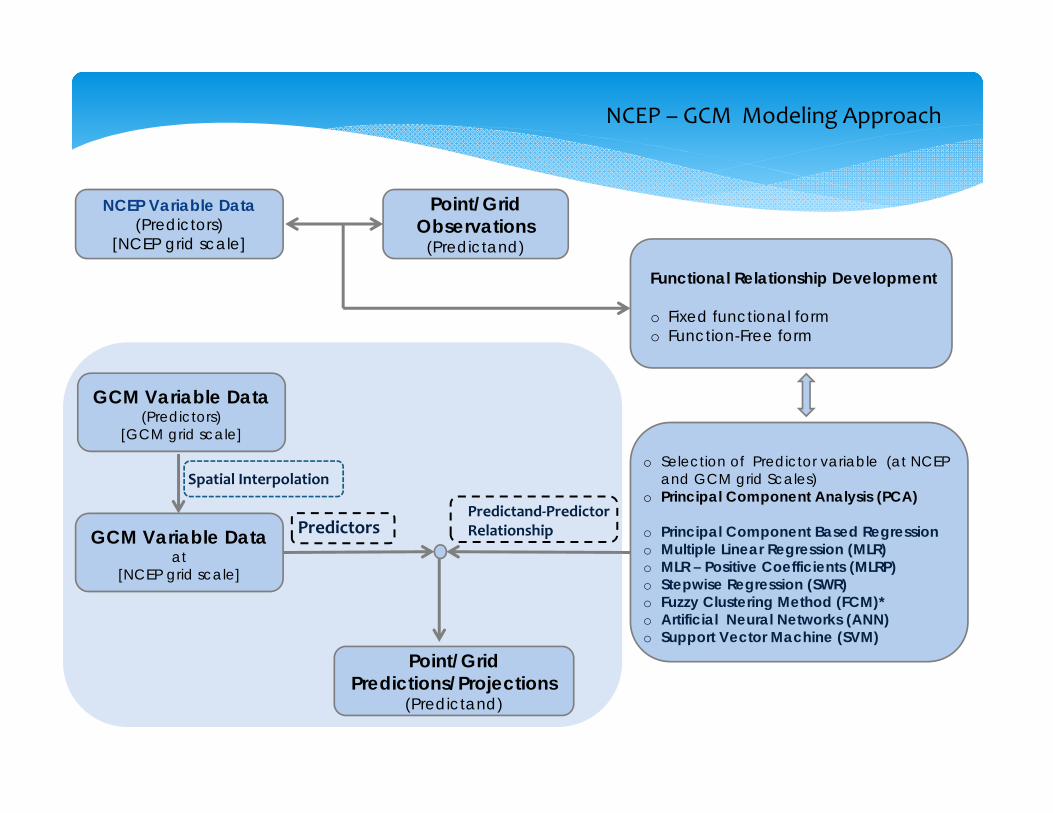
NCEP Variable Data(Predictors)
[NCEP grid scale]
Point/Grid Observations
(Predictand)
Functional Relationship Development
o Fixed functional form o Function-Free form
o Selection of Predictor variable (at NCEP and GCM grid Scales)
o Principal Component Analysis (PCA)
o Principal Component Based Regressiono Multiple Linear Regression (MLR)o MLR – Positive Coefficients (MLRP)o Stepwise Regression (SWR)o Fuzzy Clustering Method (FCM)*o Artificial Neural Networks (ANN)o Support Vector Machine (SVM)
NCEP – GCM Modeling Approach
GCM Variable Data(Predictors)
[GCM grid scale]
GCM Variable Dataat
[NCEP grid scale]
Spatial Interpolation
Point/Grid Predictions/Projections
(Predictand)
PredictorsPredictand‐PredictorRelationship

GCM Variable Data(Predictors)
[GCM grid scale]
Point/Grid Observations
(Predictand)Functional Relationship Development
o Fixed functional form o Function-Free form
o Selection of Predictor variables (at GCM grid scale)
o Principal Component Analysis (PCA)
o Principal Component Based Regression (PCR)
o Multiple Linear Regression (MLR)o MLR – Positive Coefficients (MLRP)o Stepwise Regression (SWR)o Fuzzy C-Means Clustering Method (FCM)o Artificial Neural Networks (ANN)o Support Vector Machine (SVM)
Direct GCM‐based Approach
GCM Variable Data(Predictors)
[GCM grid scale]
Point/Grid Predictions/Projections
(Predictand)
Predictors
Predictand‐PredictorRelationship
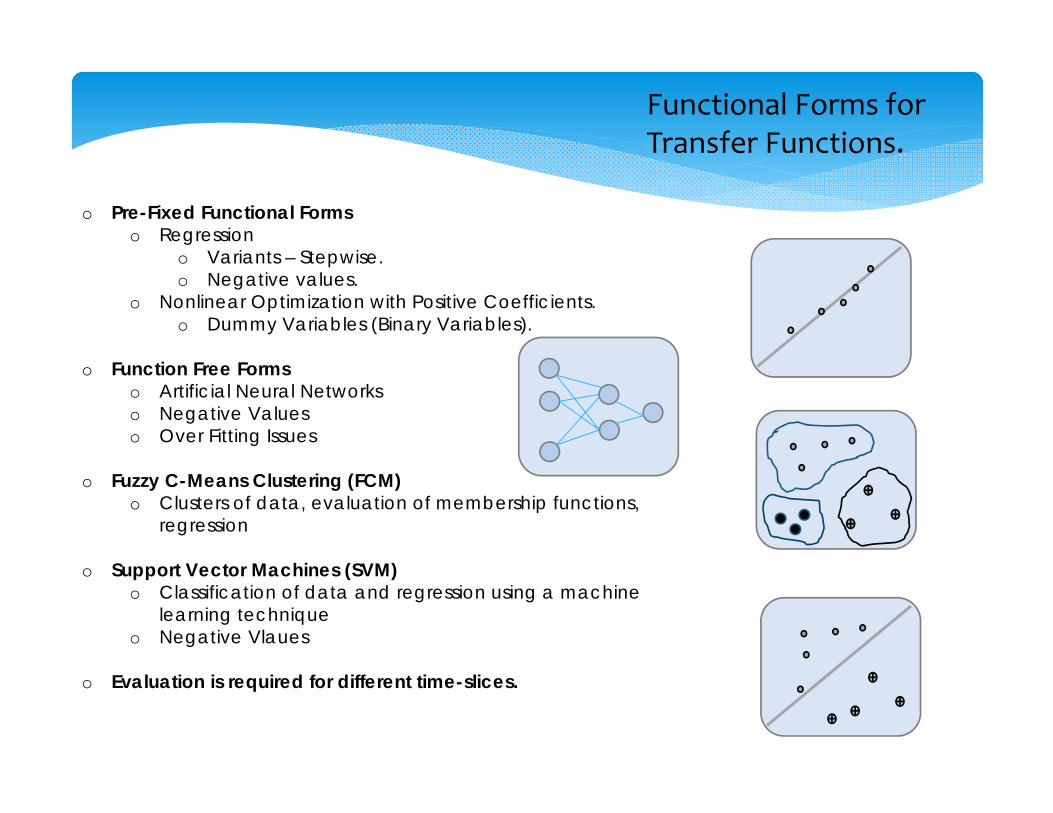
o Pre-Fixed Functional Formso Regression
o Variants – Stepwise. o Negative values.
o Nonlinear Optimization with Positive Coefficients.o Dummy Variables (Binary Variables).
o Function Free Formso Artificial Neural Networkso Negative Valueso Over Fitting Issues
o Fuzzy C-Means Clustering (FCM)o Clusters of data, evaluation of membership functions,
regression
o Support Vector Machines (SVM)o Classification of data and regression using a machine
learning technique o Negative Vlaues
o Evaluation is required for different time-slices.
Functional Forms for Transfer Functions.
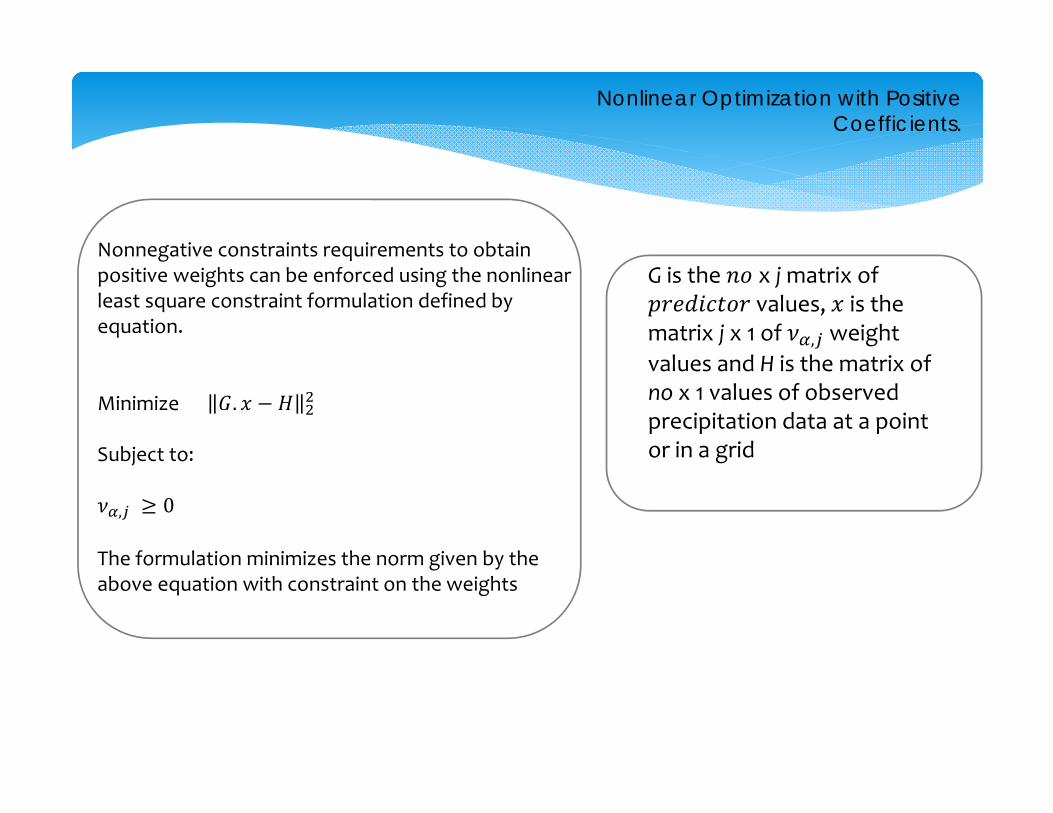
Nonlinear Optimization with Positive Coefficients.
Nonnegative constraints requirements to obtain positive weights can be enforced using the nonlinear least square constraint formulation defined by equation.
Minimize .
Subject to:
, 0
The formulation minimizes the norm given by the above equation with constraint on the weights
G is the x jmatrix of values, is the
matrix j x 1 of , weight values and H is the matrix of no x 1 values of observed precipitation data at a point or in a grid
, ∑ ∑
∑
∑
∑∀ 1,2, … .
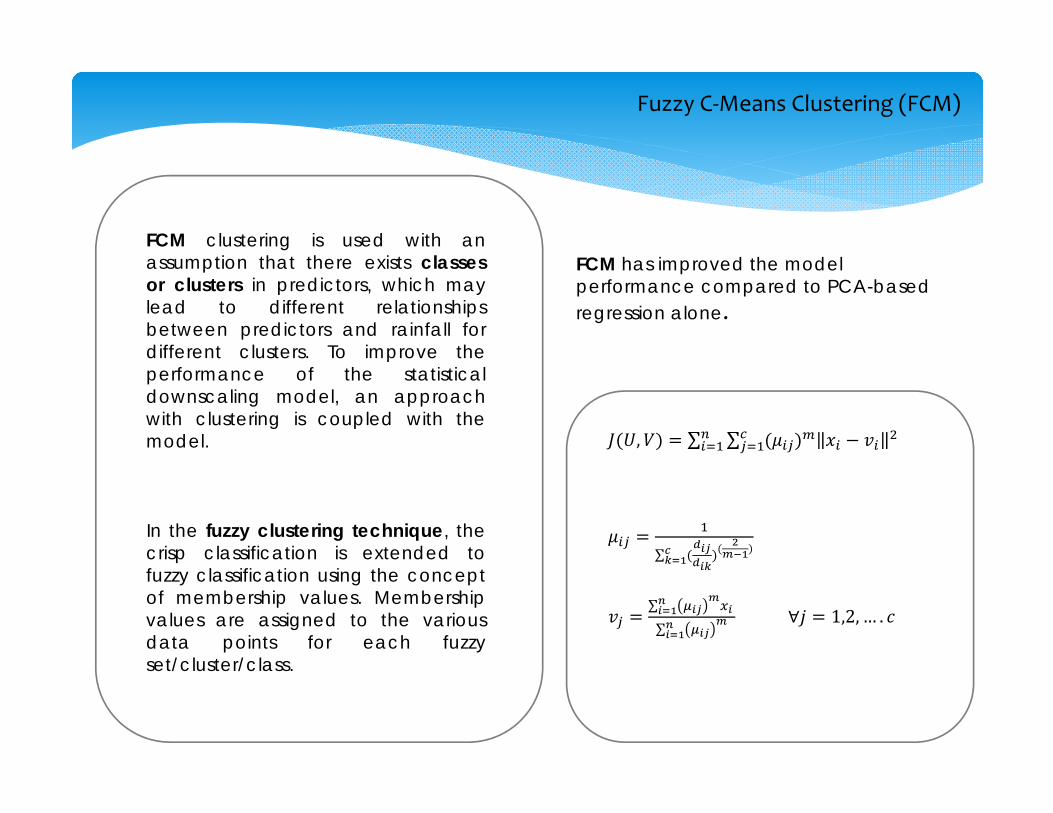
Fuzzy C‐Means Clustering (FCM)
FCM clustering is used with anassumption that there exists classesor clusters in predictors, which maylead to different relationshipsbetween predictors and rainfall fordifferent clusters. To improve theperformance of the statisticaldownscaling model, an approachwith clustering is coupled with themodel.
In the fuzzy clustering technique, thecrisp classification is extended tofuzzy classification using the conceptof membership values. Membershipvalues are assigned to the variousdata points for each fuzzyset/cluster/class.
FCM has improved the model performance compared to PCA-based regression alone.
Specific Issues
o Stationarityo Statistical relationship between the predictor and the predictand does not change
over timeo Florida experienced land use changes over the last few decades –that may
render stationarity assumption invalid.
o The plan to capture future patterns from scenarios via exploring temporal analogues from the past and develop corresponding statistical relationships.
o This is being explored and experimented in the current research integrating classification approaches.
o Evaluation of how well the large scale gridded data of a specific variable predicts the local variable (of same parameter)
o Predictor Variable Selectiono Physics‐inspired o Correlation Selectiono All available variables with PCA
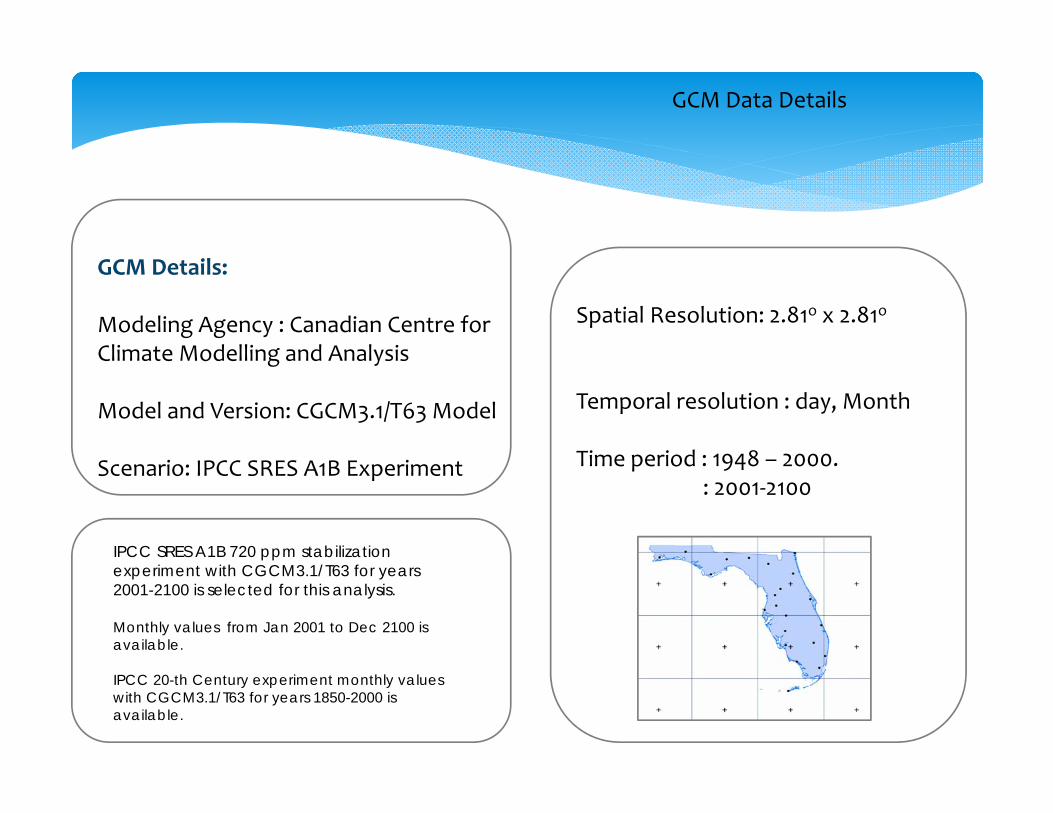
GCM Data Details
GCM Details:
Modeling Agency : Canadian Centre for Climate Modelling and Analysis
Model and Version: CGCM3.1/T63 Model
Scenario: IPCC SRES A1B Experiment
Spatial Resolution: 2.81o x 2.81o
Temporal resolution : day, Month
Time period : 1948 – 2000.: 2001‐2100
IPCC SRES A1B 720 ppm stabilization experiment with CGCM3.1/T63 for years 2001-2100 is selected for this analysis.
Monthly values from Jan 2001 to Dec 2100 is available.
IPCC 20-th Century experiment monthly values with CGCM3.1/T63 for years 1850-2000 is available.
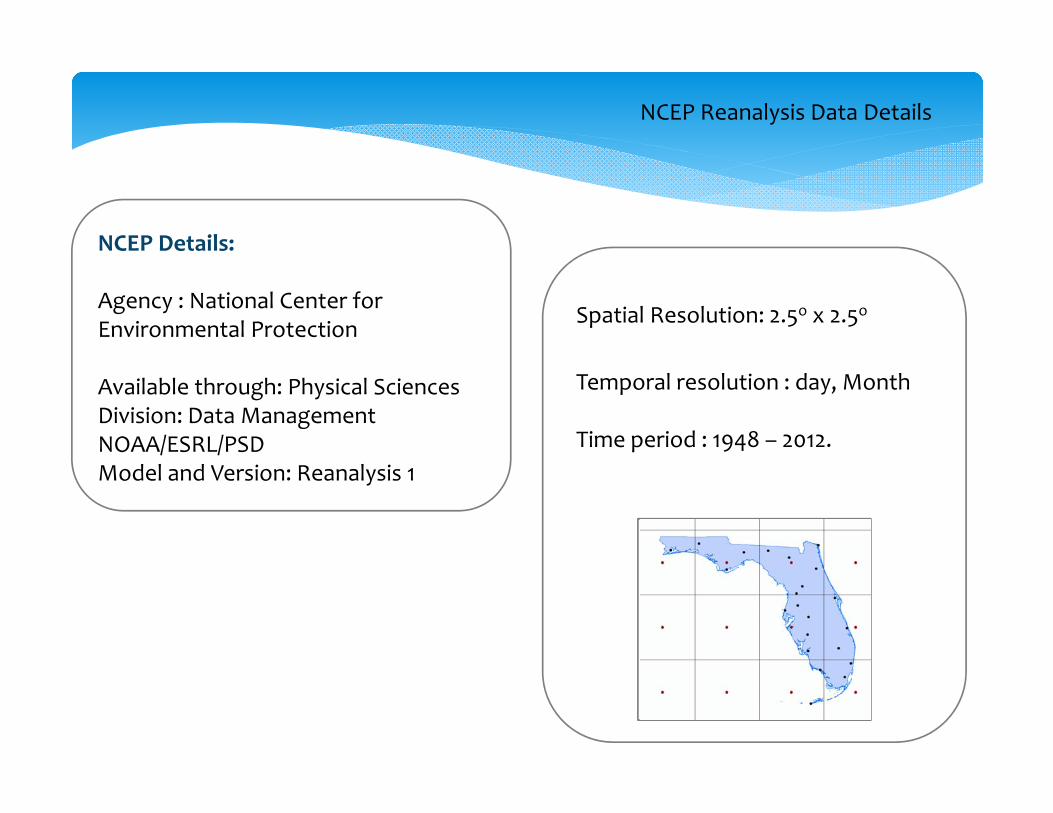
NCEP Details:
Agency : National Center for Environmental Protection
Available through: Physical Sciences Division: Data ManagementNOAA/ESRL/PSDModel and Version: Reanalysis 1
NCEP Reanalysis Data Details
Spatial Resolution: 2.5o x 2.5o
Temporal resolution : day, Month
Time period : 1948 – 2012.
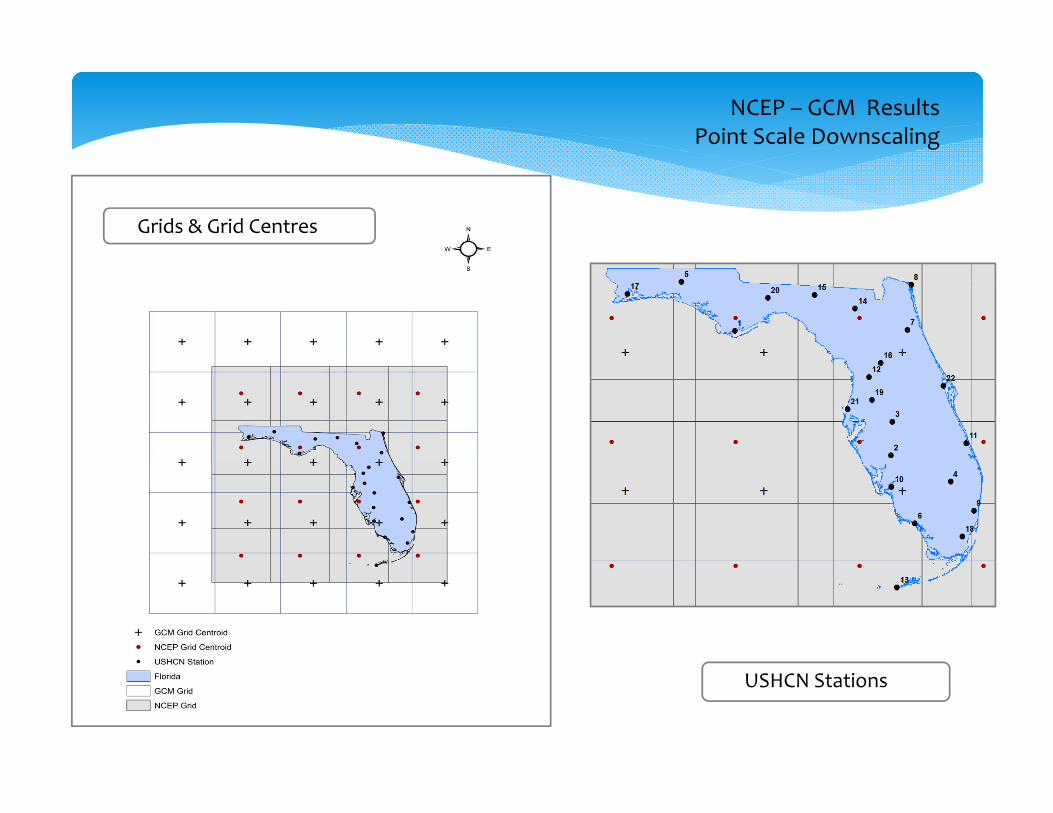
NCEP – GCM ResultsPoint Scale Downscaling
USHCN Stations
Grids & Grid Centres
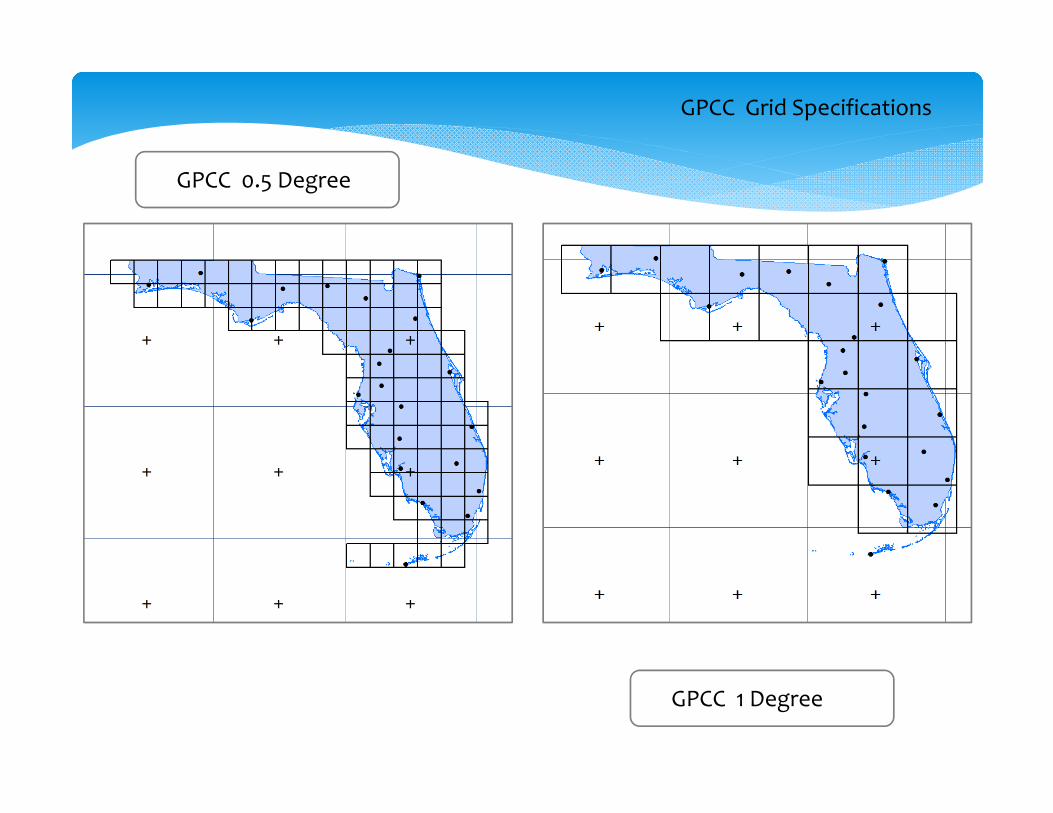
GPCC Grid Specifications
GPCC 0.5 Degree
GPCC 1 Degree
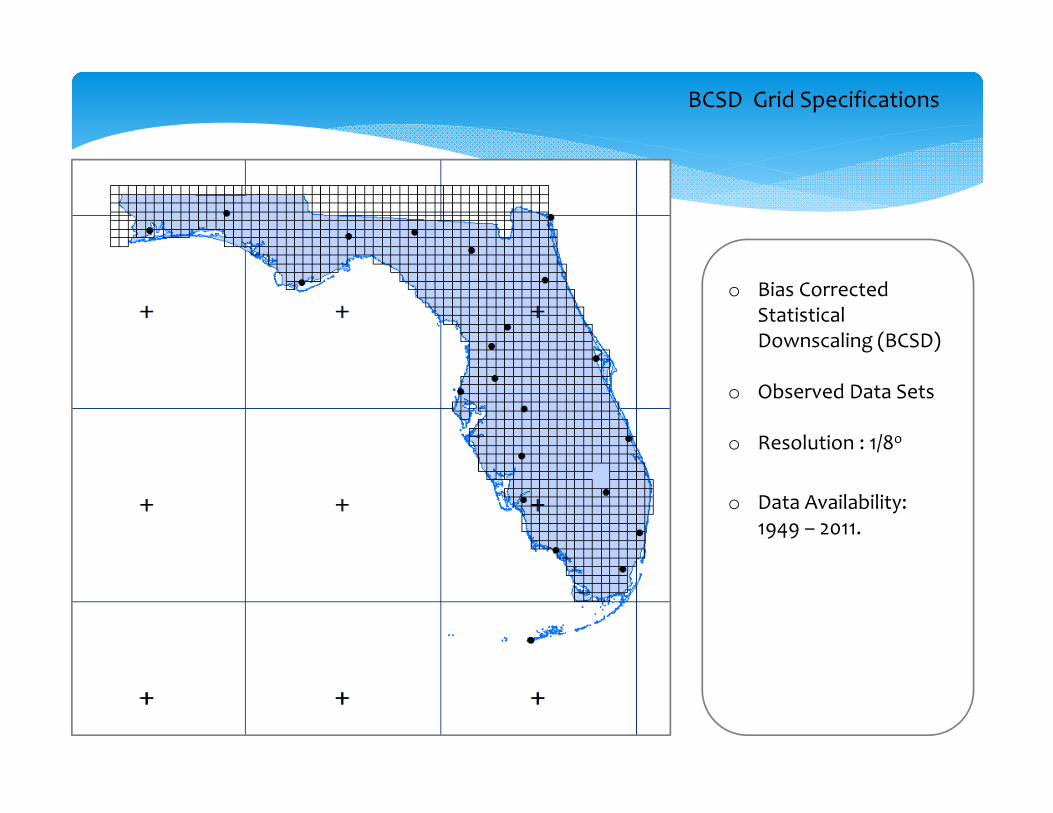
BCSD Grid Specifications
o Bias Corrected Statistical Downscaling (BCSD)
o Observed Data Sets
o Resolution : 1/8o
o Data Availability: 1949 – 2011.
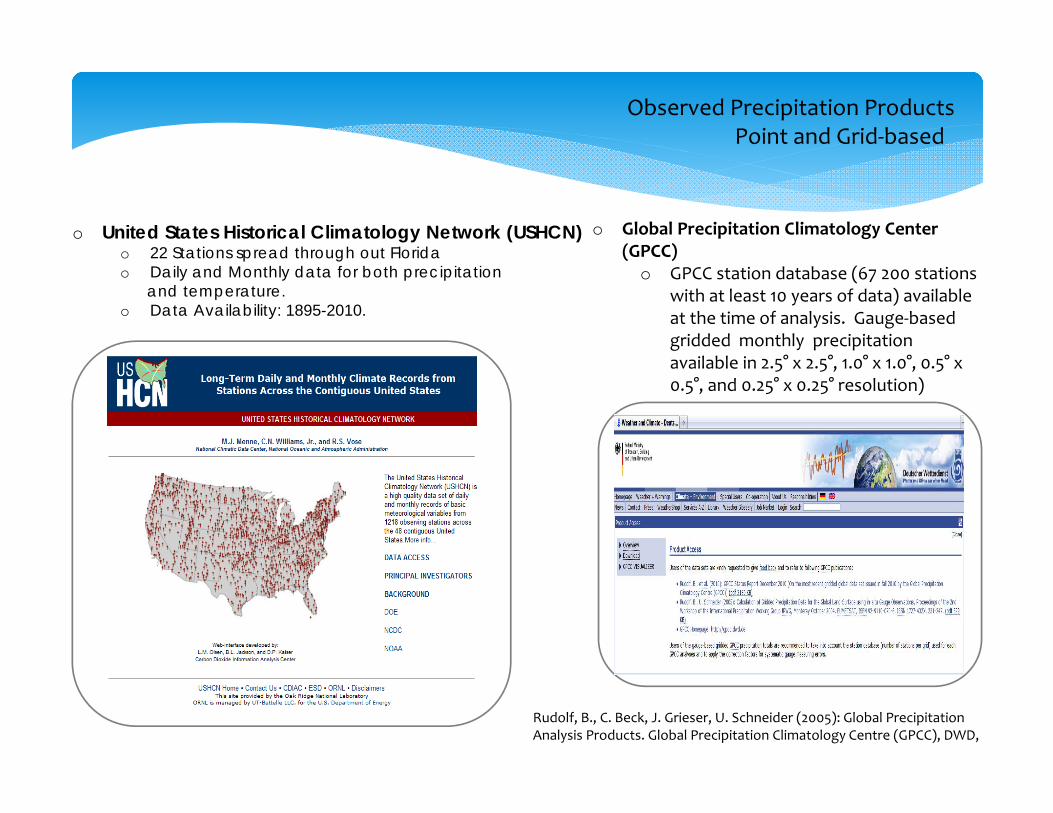
o United States Historical Climatology Network (USHCN)o 22 Stations spread through out Floridao Daily and Monthly data for both precipitation
and temperature.o Data Availability: 1895-2010.
Observed Precipitation ProductsPoint and Grid‐based
Rudolf, B., C. Beck, J. Grieser, U. Schneider (2005): Global Precipitation Analysis Products. Global Precipitation Climatology Centre (GPCC), DWD,
o Global Precipitation Climatology Center (GPCC)
o GPCC station database (67 200 stations with at least 10 years of data) available at the time of analysis. Gauge‐based gridded monthly precipitation available in 2.5° x 2.5°, 1.0° x 1.0°, 0.5° x 0.5°, and 0.25° x 0.25° resolution)
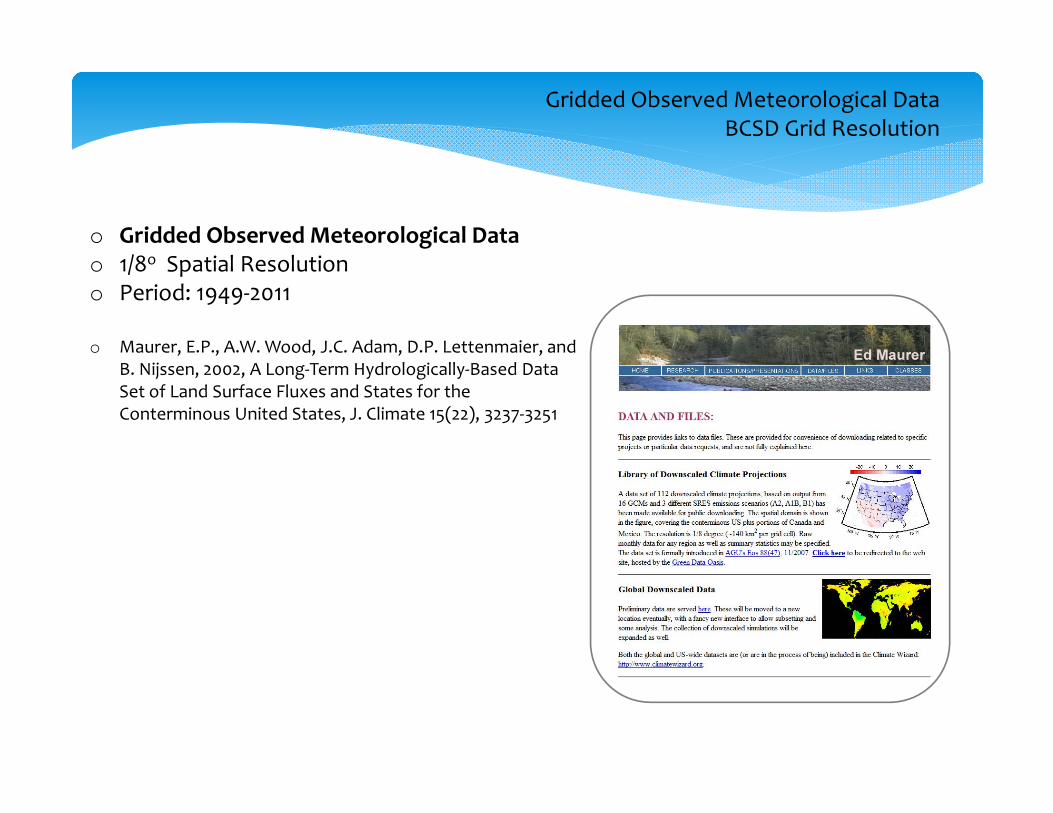
Gridded Observed Meteorological Data BCSD Grid Resolution
o Gridded Observed Meteorological Datao 1/8o Spatial Resolutiono Period: 1949‐2011
o Maurer, E.P., A.W. Wood, J.C. Adam, D.P. Lettenmaier, and B. Nijssen, 2002, A Long‐Term Hydrologically‐Based Data Set of Land Surface Fluxes and States for the Conterminous United States, J. Climate 15(22), 3237‐3251

0.25 0.3 0.35 0.4 0.45 0.5 0.55 0.6 0.65 0.7 0.750
2
4
6
8
10
12
14
16
Correlation Coefficient
Specific Humidity, 850mb - Precipitation
-0.6 -0.55 -0.5 -0.45 -0.4 -0.35 -0.3 -0.25 -0.20
2
4
6
8
10
12
14
Correlation Coefficient
Mean Sea Level Pressure - Precipitation
0.1 0.15 0.2 0.25 0.3 0.35 0.4 0.45 0.5 0.55 0.60
2
4
6
8
10
12
14
16
18
20
Correlation Coefficient
Geopotential Height, 500mb - Precipitation
-0.4 -0.3 -0.2 -0.1 0 0.1 0.2 0.30
2
4
6
8
10
12
14
16
18
Correlation Coefficient
U-wind - Precipitation
-0.2 -0.1 0 0.1 0.2 0.3 0.4 0.5 0.60
2
4
6
8
10
12
14
16
18
Correlation Coefficient
V-wind - Precipitation
Predictor‐ Predictand Correlations
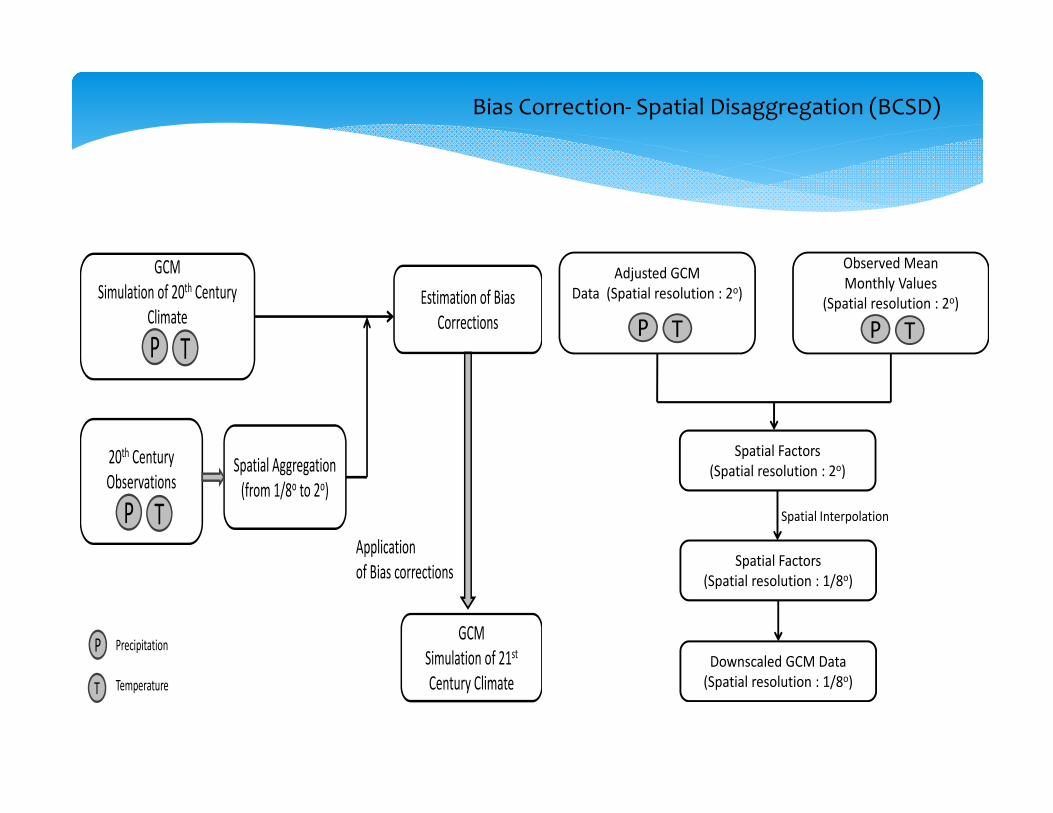
GCM Simulation of 20th Century
Climate
20th Century Observations
GCM Simulation of 21stCentury Climate
Estimation of Bias Corrections
Spatial Aggregation (from 1/8o to 2o)
P T
P T
Applicationof Bias corrections
P
T Temperature
Precipitation
Adjusted GCM Data (Spatial resolution : 2o)
P T
Observed MeanMonthly Values
(Spatial resolution : 2o)
P T
Spatial Factors(Spatial resolution : 2o)
Spatial Factors(Spatial resolution : 1/8o)
Spatial Interpolation
Downscaled GCM Data(Spatial resolution : 1/8o)
Bias Correction‐ Spatial Disaggregation (BCSD)
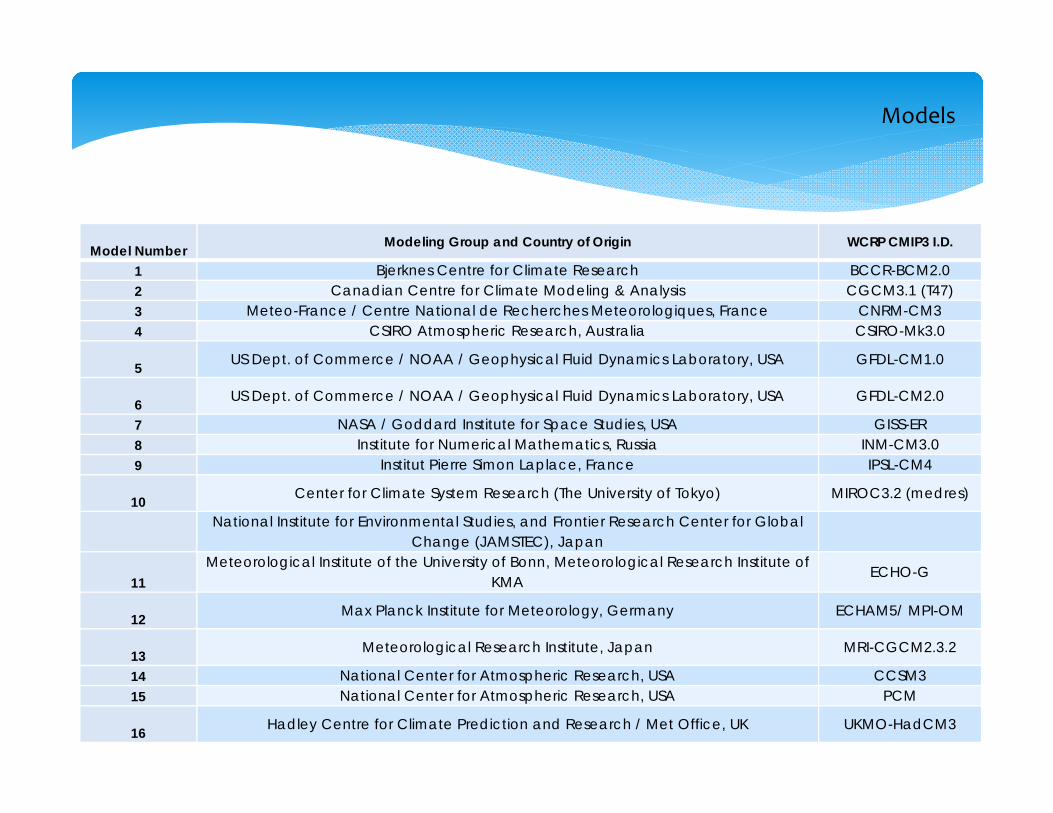
Model Number Modeling Group and Country of Origin WCRP CMIP3 I.D.
1 Bjerknes Centre for Climate Research BCCR-BCM2.02 Canadian Centre for Climate Modeling & Analysis CGCM3.1 (T47)3 Meteo-France / Centre National de Recherches Meteorologiques, France CNRM-CM34 CSIRO Atmospheric Research, Australia CSIRO-Mk3.0
5 US Dept. of Commerce / NOAA / Geophysical Fluid Dynamics Laboratory, USA GFDL-CM1.0
6 US Dept. of Commerce / NOAA / Geophysical Fluid Dynamics Laboratory, USA GFDL-CM2.0
7 NASA / Goddard Institute for Space Studies, USA GISS-ER8 Institute for Numerical Mathematics, Russia INM-CM3.09 Institut Pierre Simon Laplace, France IPSL-CM4
10 Center for Climate System Research (The University of Tokyo) MIROC3.2 (medres)
National Institute for Environmental Studies, and Frontier Research Center for Global Change (JAMSTEC), Japan
11Meteorological Institute of the University of Bonn, Meteorological Research Institute of
KMAECHO-G
12 Max Planck Institute for Meteorology, Germany ECHAM5/ MPI-OM
13 Meteorological Research Institute, Japan MRI-CGCM2.3.2
14 National Center for Atmospheric Research, USA CCSM315 National Center for Atmospheric Research, USA PCM
16 Hadley Centre for Climate Prediction and Research / Met Office, UK UKMO-HadCM3
Models
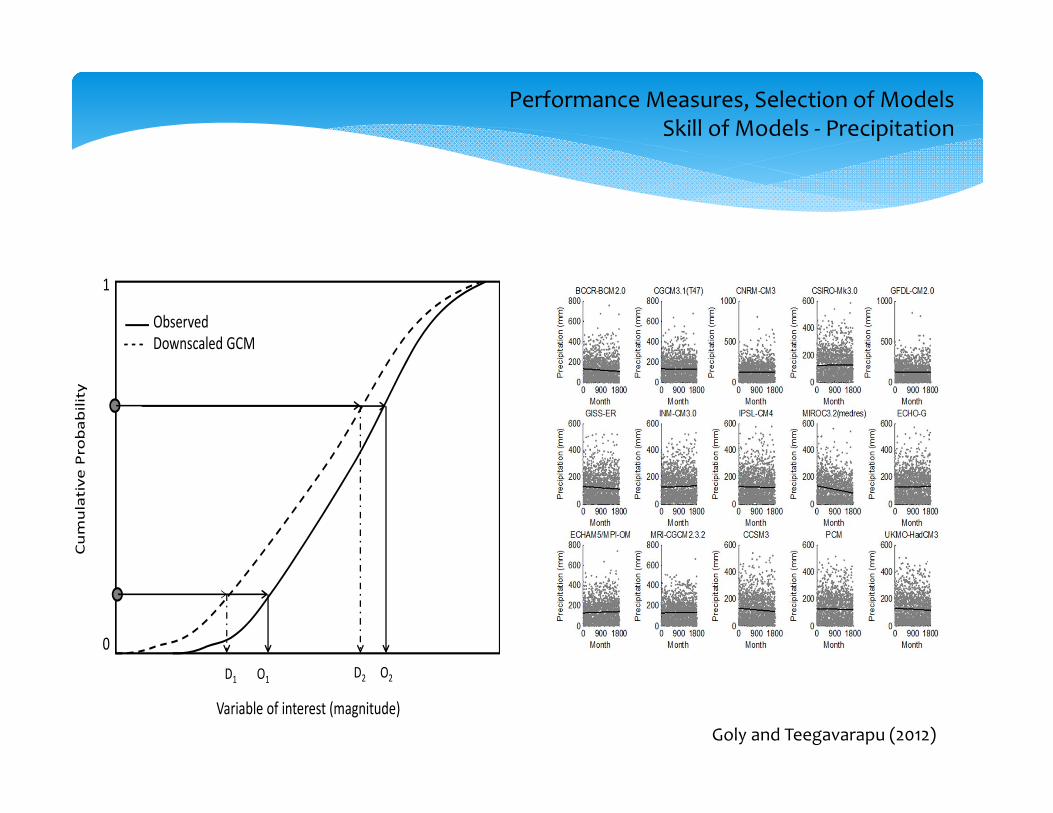
Variable of interest (magnitude)
0
Cumulative Probability
1
Observed‐ ‐ ‐ Downscaled GCM
D1 O1 D2 O2
Performance Measures, Selection of ModelsSkill of Models ‐ Precipitation
Goly and Teegavarapu (2012)
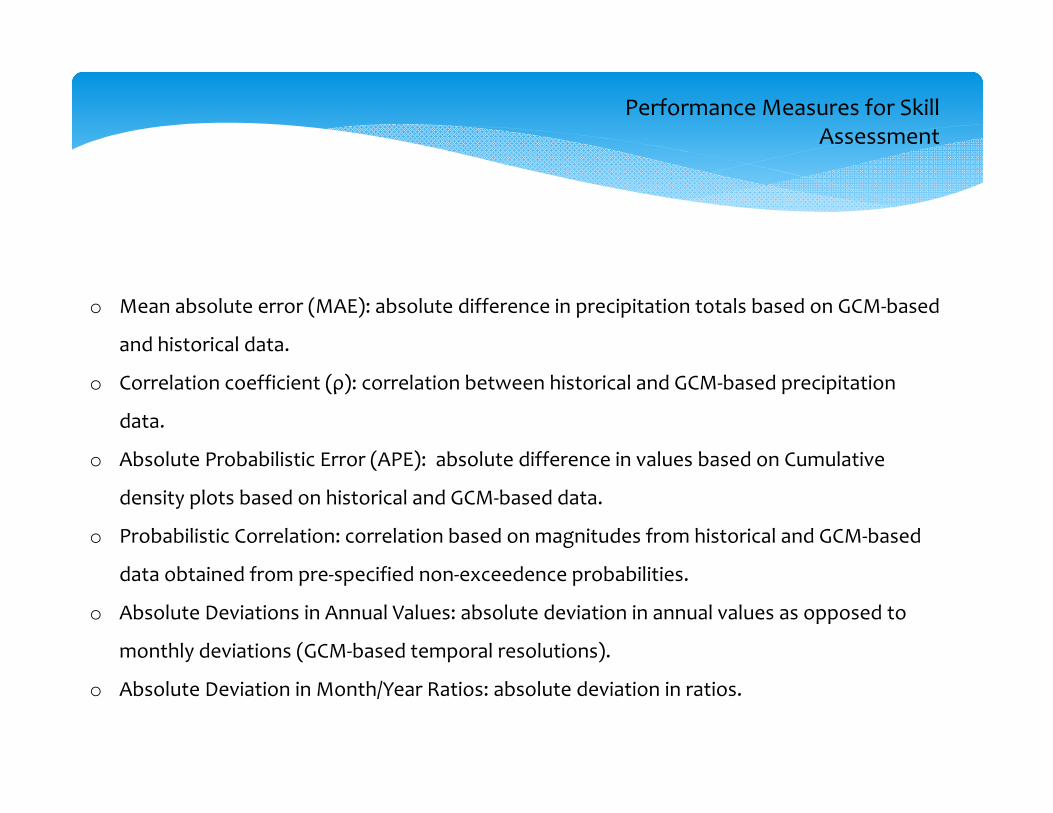
o Mean absolute error (MAE): absolute difference in precipitation totals based on GCM‐based
and historical data.
o Correlation coefficient (ρ): correlation between historical and GCM‐based precipitation
data.
o Absolute Probabilistic Error (APE): absolute difference in values based on Cumulative
density plots based on historical and GCM‐based data.
o Probabilistic Correlation: correlation based on magnitudes from historical and GCM‐based
data obtained from pre‐specified non‐exceedence probabilities.
o Absolute Deviations in Annual Values: absolute deviation in annual values as opposed to
monthly deviations (GCM‐based temporal resolutions).
o Absolute Deviation in Month/Year Ratios: absolute deviation in ratios.
Performance Measures for Skill Assessment
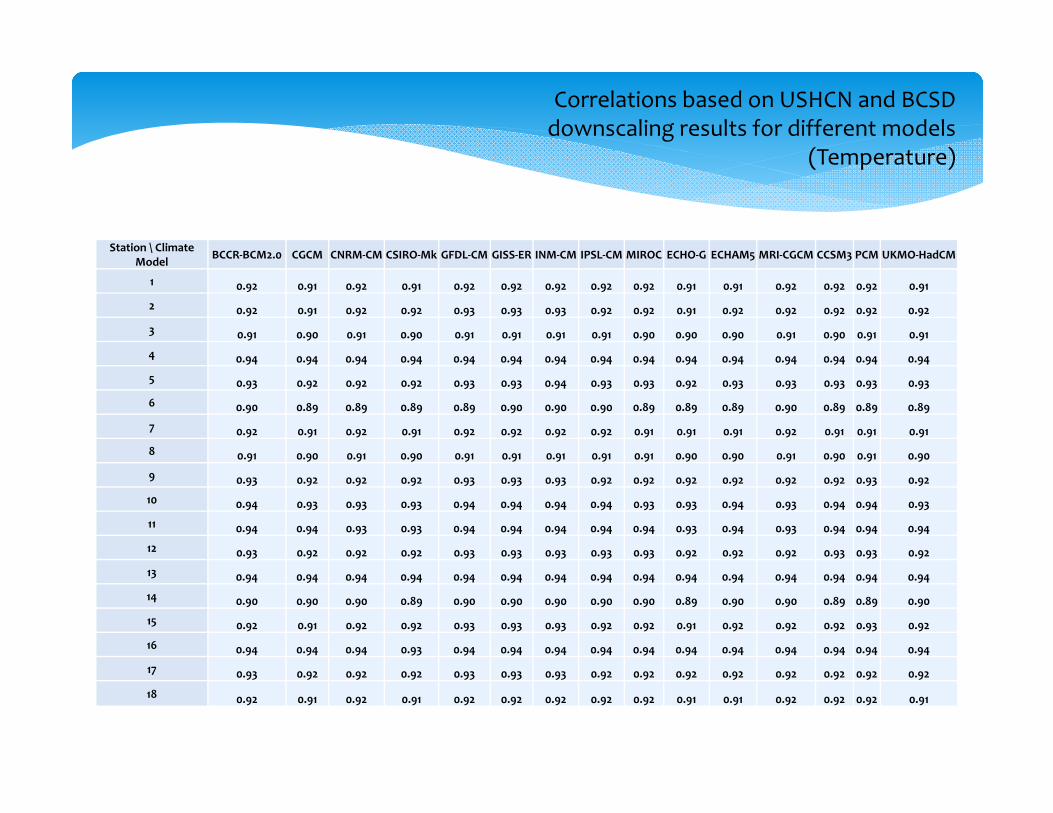
Correlations based on USHCN and BCSD downscaling results for different models
(Temperature)
Station \ Climate Model BCCR‐BCM2.0 CGCM CNRM‐CM CSIRO‐Mk GFDL‐CM GISS‐ER INM‐CM IPSL‐CM MIROC ECHO‐G ECHAM5 MRI‐CGCM CCSM3 PCM UKMO‐HadCM
1 0.92 0.91 0.92 0.91 0.92 0.92 0.92 0.92 0.92 0.91 0.91 0.92 0.92 0.92 0.91
2 0.92 0.91 0.92 0.92 0.93 0.93 0.93 0.92 0.92 0.91 0.92 0.92 0.92 0.92 0.92
3 0.91 0.90 0.91 0.90 0.91 0.91 0.91 0.91 0.90 0.90 0.90 0.91 0.90 0.91 0.91
4 0.94 0.94 0.94 0.94 0.94 0.94 0.94 0.94 0.94 0.94 0.94 0.94 0.94 0.94 0.94
5 0.93 0.92 0.92 0.92 0.93 0.93 0.94 0.93 0.93 0.92 0.93 0.93 0.93 0.93 0.93
6 0.90 0.89 0.89 0.89 0.89 0.90 0.90 0.90 0.89 0.89 0.89 0.90 0.89 0.89 0.89
7 0.92 0.91 0.92 0.91 0.92 0.92 0.92 0.92 0.91 0.91 0.91 0.92 0.91 0.91 0.91
8 0.91 0.90 0.91 0.90 0.91 0.91 0.91 0.91 0.91 0.90 0.90 0.91 0.90 0.91 0.90
9 0.93 0.92 0.92 0.92 0.93 0.93 0.93 0.92 0.92 0.92 0.92 0.92 0.92 0.93 0.92
10 0.94 0.93 0.93 0.93 0.94 0.94 0.94 0.94 0.93 0.93 0.94 0.93 0.94 0.94 0.93
11 0.94 0.94 0.93 0.93 0.94 0.94 0.94 0.94 0.94 0.93 0.94 0.93 0.94 0.94 0.94
12 0.93 0.92 0.92 0.92 0.93 0.93 0.93 0.93 0.93 0.92 0.92 0.92 0.93 0.93 0.92
13 0.94 0.94 0.94 0.94 0.94 0.94 0.94 0.94 0.94 0.94 0.94 0.94 0.94 0.94 0.94
14 0.90 0.90 0.90 0.89 0.90 0.90 0.90 0.90 0.90 0.89 0.90 0.90 0.89 0.89 0.90
15 0.92 0.91 0.92 0.92 0.93 0.93 0.93 0.92 0.92 0.91 0.92 0.92 0.92 0.93 0.92
16 0.94 0.94 0.94 0.93 0.94 0.94 0.94 0.94 0.94 0.94 0.94 0.94 0.94 0.94 0.94
17 0.93 0.92 0.92 0.92 0.93 0.93 0.93 0.92 0.92 0.92 0.92 0.92 0.92 0.92 0.92
18 0.92 0.91 0.92 0.91 0.92 0.92 0.92 0.92 0.92 0.91 0.91 0.92 0.92 0.92 0.91
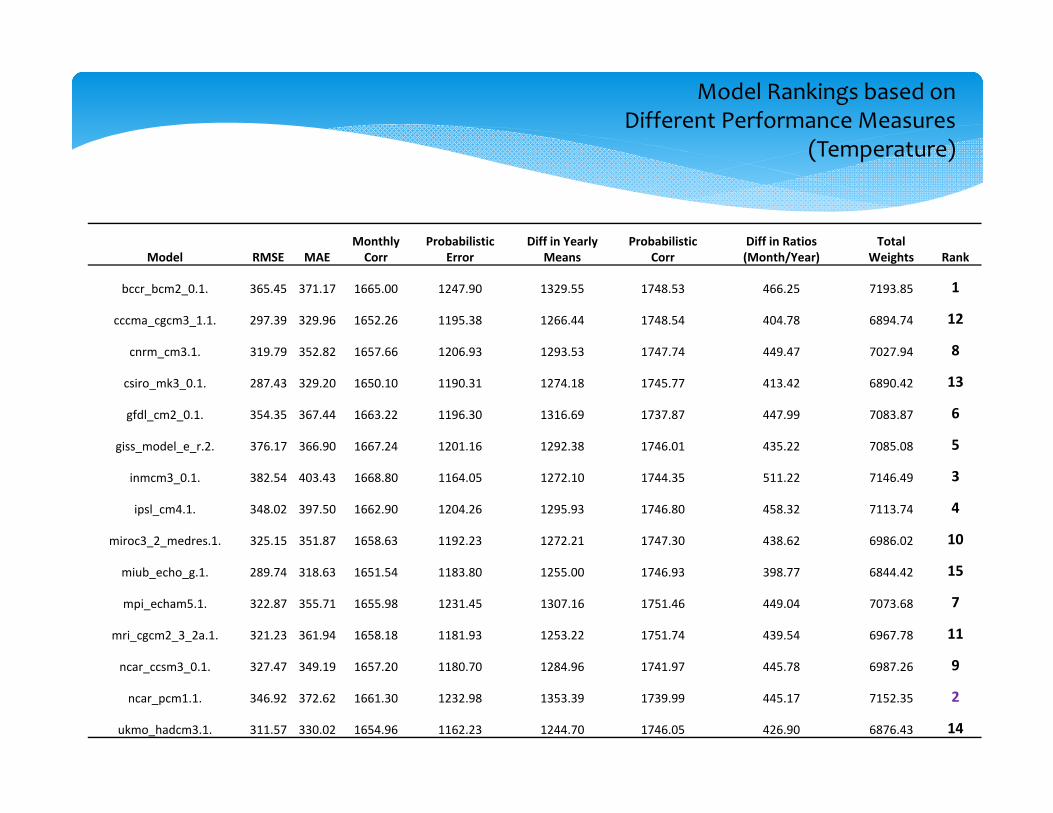
Model RMSE MAEMonthly Corr
Probabilistic Error
Diff in Yearly Means
Probabilistic Corr
Diff in Ratios (Month/Year)
Total Weights Rank
bccr_bcm2_0.1. 365.45 371.17 1665.00 1247.90 1329.55 1748.53 466.25 7193.85 1
cccma_cgcm3_1.1. 297.39 329.96 1652.26 1195.38 1266.44 1748.54 404.78 6894.74 12
cnrm_cm3.1. 319.79 352.82 1657.66 1206.93 1293.53 1747.74 449.47 7027.94 8
csiro_mk3_0.1. 287.43 329.20 1650.10 1190.31 1274.18 1745.77 413.42 6890.42 13
gfdl_cm2_0.1. 354.35 367.44 1663.22 1196.30 1316.69 1737.87 447.99 7083.87 6
giss_model_e_r.2. 376.17 366.90 1667.24 1201.16 1292.38 1746.01 435.22 7085.08 5
inmcm3_0.1. 382.54 403.43 1668.80 1164.05 1272.10 1744.35 511.22 7146.49 3
ipsl_cm4.1. 348.02 397.50 1662.90 1204.26 1295.93 1746.80 458.32 7113.74 4
miroc3_2_medres.1. 325.15 351.87 1658.63 1192.23 1272.21 1747.30 438.62 6986.02 10
miub_echo_g.1. 289.74 318.63 1651.54 1183.80 1255.00 1746.93 398.77 6844.42 15
mpi_echam5.1. 322.87 355.71 1655.98 1231.45 1307.16 1751.46 449.04 7073.68 7
mri_cgcm2_3_2a.1. 321.23 361.94 1658.18 1181.93 1253.22 1751.74 439.54 6967.78 11
ncar_ccsm3_0.1. 327.47 349.19 1657.20 1180.70 1284.96 1741.97 445.78 6987.26 9
ncar_pcm1.1. 346.92 372.62 1661.30 1232.98 1353.39 1739.99 445.17 7152.35 2
ukmo_hadcm3.1. 311.57 330.02 1654.96 1162.23 1244.70 1746.05 426.90 6876.43 14
Model Rankings based onDifferent Performance Measures
(Temperature)
Station \ Climate Model
BCCR‐BCM2.0 CGCM CNRM‐CM CSIRO‐
MkGFDL‐CM GISS‐ER INM‐
CMIPSL‐CM MIROC ECHO‐G ECHAM5 MRI‐
CGCM CCSM3 PCM UKMO‐HadCM
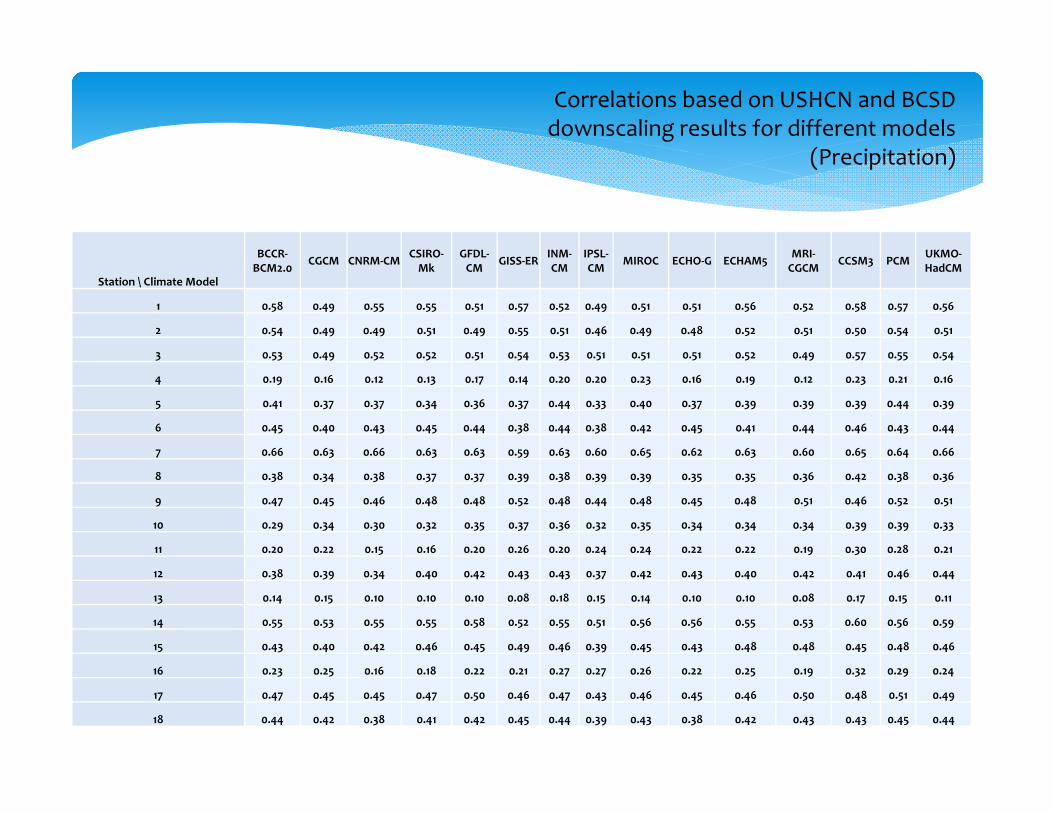
1 0.58 0.49 0.55 0.55 0.51 0.57 0.52 0.49 0.51 0.51 0.56 0.52 0.58 0.57 0.56
2 0.54 0.49 0.49 0.51 0.49 0.55 0.51 0.46 0.49 0.48 0.52 0.51 0.50 0.54 0.51
3 0.53 0.49 0.52 0.52 0.51 0.54 0.53 0.51 0.51 0.51 0.52 0.49 0.57 0.55 0.54
4 0.19 0.16 0.12 0.13 0.17 0.14 0.20 0.20 0.23 0.16 0.19 0.12 0.23 0.21 0.16
5 0.41 0.37 0.37 0.34 0.36 0.37 0.44 0.33 0.40 0.37 0.39 0.39 0.39 0.44 0.39
6 0.45 0.40 0.43 0.45 0.44 0.38 0.44 0.38 0.42 0.45 0.41 0.44 0.46 0.43 0.44
7 0.66 0.63 0.66 0.63 0.63 0.59 0.63 0.60 0.65 0.62 0.63 0.60 0.65 0.64 0.66
8 0.38 0.34 0.38 0.37 0.37 0.39 0.38 0.39 0.39 0.35 0.35 0.36 0.42 0.38 0.36
9 0.47 0.45 0.46 0.48 0.48 0.52 0.48 0.44 0.48 0.45 0.48 0.51 0.46 0.52 0.51
10 0.29 0.34 0.30 0.32 0.35 0.37 0.36 0.32 0.35 0.34 0.34 0.34 0.39 0.39 0.33
11 0.20 0.22 0.15 0.16 0.20 0.26 0.20 0.24 0.24 0.22 0.22 0.19 0.30 0.28 0.21
12 0.38 0.39 0.34 0.40 0.42 0.43 0.43 0.37 0.42 0.43 0.40 0.42 0.41 0.46 0.44
13 0.14 0.15 0.10 0.10 0.10 0.08 0.18 0.15 0.14 0.10 0.10 0.08 0.17 0.15 0.11
14 0.55 0.53 0.55 0.55 0.58 0.52 0.55 0.51 0.56 0.56 0.55 0.53 0.60 0.56 0.59
15 0.43 0.40 0.42 0.46 0.45 0.49 0.46 0.39 0.45 0.43 0.48 0.48 0.45 0.48 0.46
16 0.23 0.25 0.16 0.18 0.22 0.21 0.27 0.27 0.26 0.22 0.25 0.19 0.32 0.29 0.24
17 0.47 0.45 0.45 0.47 0.50 0.46 0.47 0.43 0.46 0.45 0.46 0.50 0.48 0.51 0.49
18 0.44 0.42 0.38 0.41 0.42 0.45 0.44 0.39 0.43 0.38 0.42 0.43 0.43 0.45 0.44
Correlations based on USHCN and BCSD downscaling results for different models
(Precipitation)
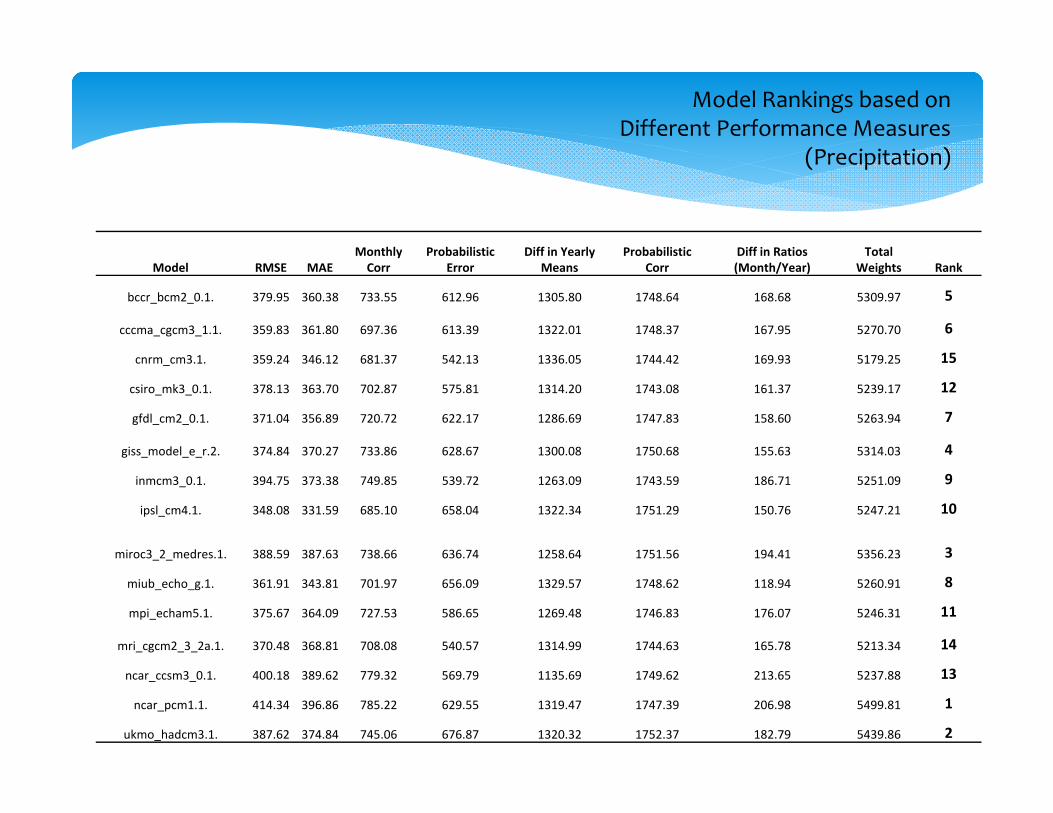
Model RMSE MAEMonthly Corr
Probabilistic Error
Diff in Yearly Means
Probabilistic Corr
Diff in Ratios (Month/Year)
Total Weights Rank
bccr_bcm2_0.1. 379.95 360.38 733.55 612.96 1305.80 1748.64 168.68 5309.97 5
cccma_cgcm3_1.1. 359.83 361.80 697.36 613.39 1322.01 1748.37 167.95 5270.70 6
cnrm_cm3.1. 359.24 346.12 681.37 542.13 1336.05 1744.42 169.93 5179.25 15
csiro_mk3_0.1. 378.13 363.70 702.87 575.81 1314.20 1743.08 161.37 5239.17 12
gfdl_cm2_0.1. 371.04 356.89 720.72 622.17 1286.69 1747.83 158.60 5263.94 7
giss_model_e_r.2. 374.84 370.27 733.86 628.67 1300.08 1750.68 155.63 5314.03 4
inmcm3_0.1. 394.75 373.38 749.85 539.72 1263.09 1743.59 186.71 5251.09 9
ipsl_cm4.1. 348.08 331.59 685.10 658.04 1322.34 1751.29 150.76 5247.21 10
miroc3_2_medres.1. 388.59 387.63 738.66 636.74 1258.64 1751.56 194.41 5356.23 3
miub_echo_g.1. 361.91 343.81 701.97 656.09 1329.57 1748.62 118.94 5260.91 8
mpi_echam5.1. 375.67 364.09 727.53 586.65 1269.48 1746.83 176.07 5246.31 11
mri_cgcm2_3_2a.1. 370.48 368.81 708.08 540.57 1314.99 1744.63 165.78 5213.34 14
ncar_ccsm3_0.1. 400.18 389.62 779.32 569.79 1135.69 1749.62 213.65 5237.88 13
ncar_pcm1.1. 414.34 396.86 785.22 629.55 1319.47 1747.39 206.98 5499.81 1
ukmo_hadcm3.1. 387.62 374.84 745.06 676.87 1320.32 1752.37 182.79 5439.86 2
Model Rankings based onDifferent Performance Measures
(Precipitation)
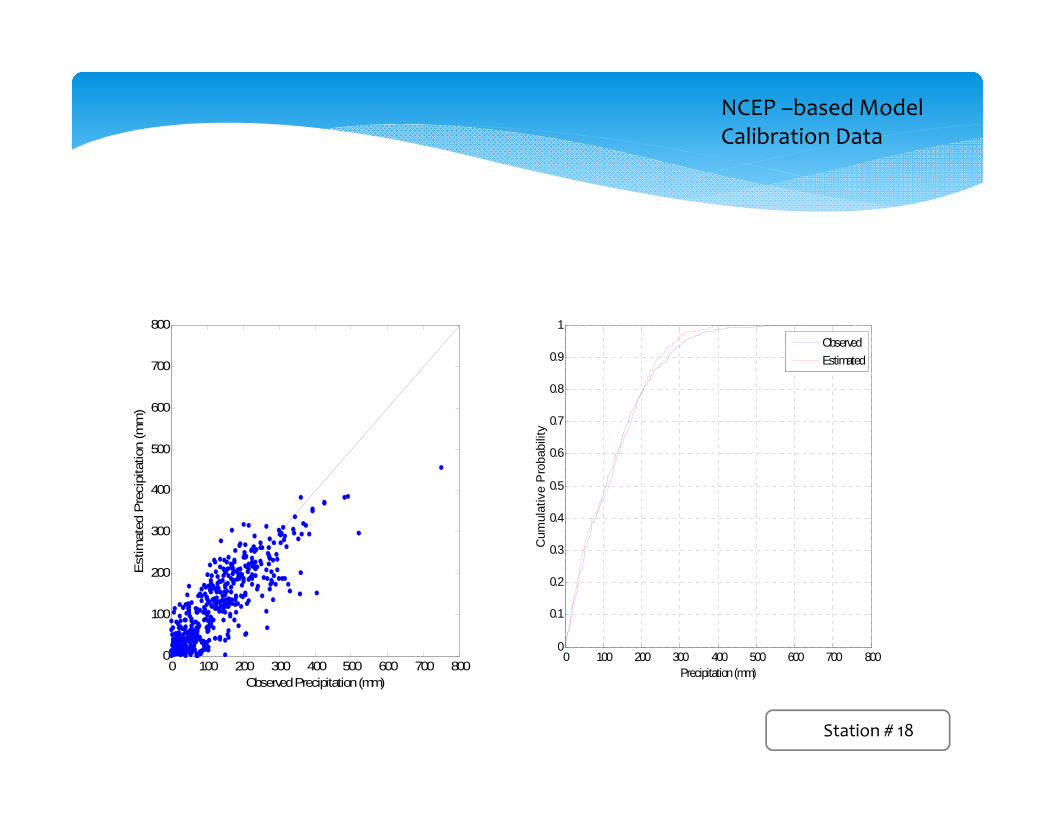
0 100 200 300 400 500 600 700 8000
100
200
300
400
500
600
700
800
Observed Precipitation (mm)
Est
imat
ed P
reci
pita
tion
(mm
)
0 100 200 300 400 500 600 700 8000
0.1
0.2
0.3
0.4
0.5
0.6
0.7
0.8
0.9
1
Precipitation (mm)
Cum
ulat
ive
Pro
babi
lity
ObservedEstimated
NCEP –based ModelCalibration Data
Station # 18
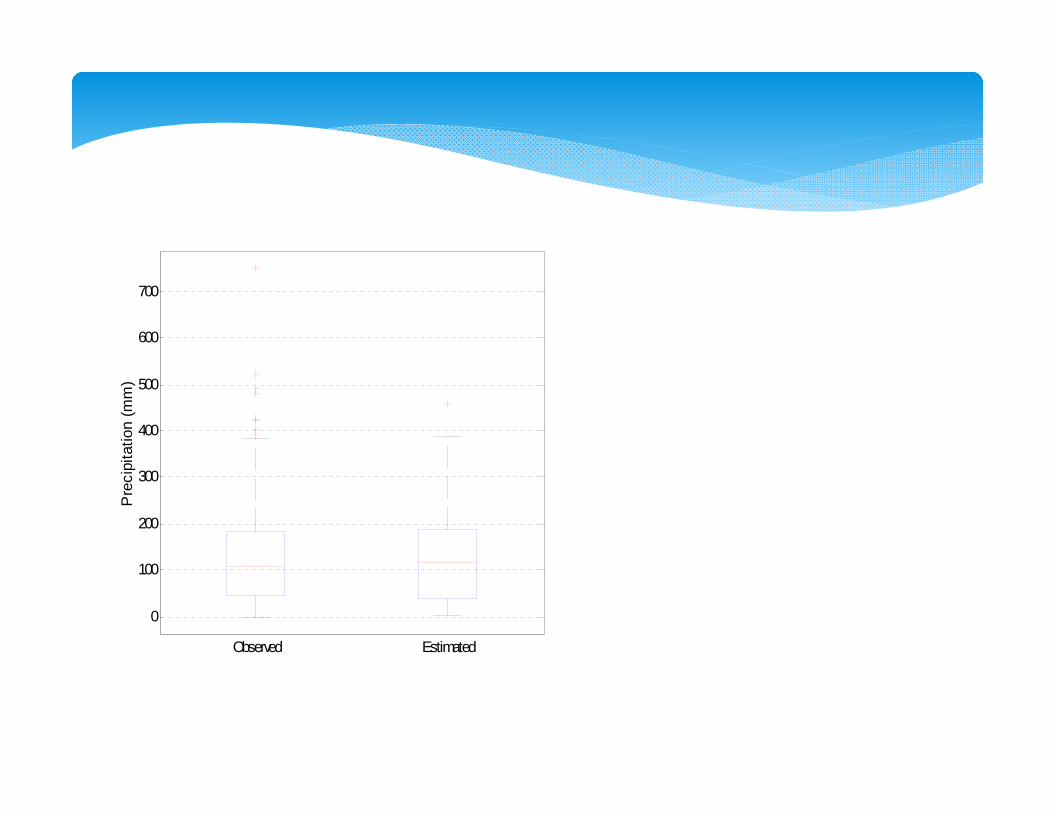
0
100
200
300
400
500
600
700
Observed Estimated
Pre
cipi
tatio
n (m
m)
0 100 200 300 400 500 6000
0.1
0.2
0.3
0.4
0.5
0.6
0.7
0.8
0.9
1
Precipitation (mm)
Cum
ulat
ive
Pro
babi
lity
ObservedEstimated
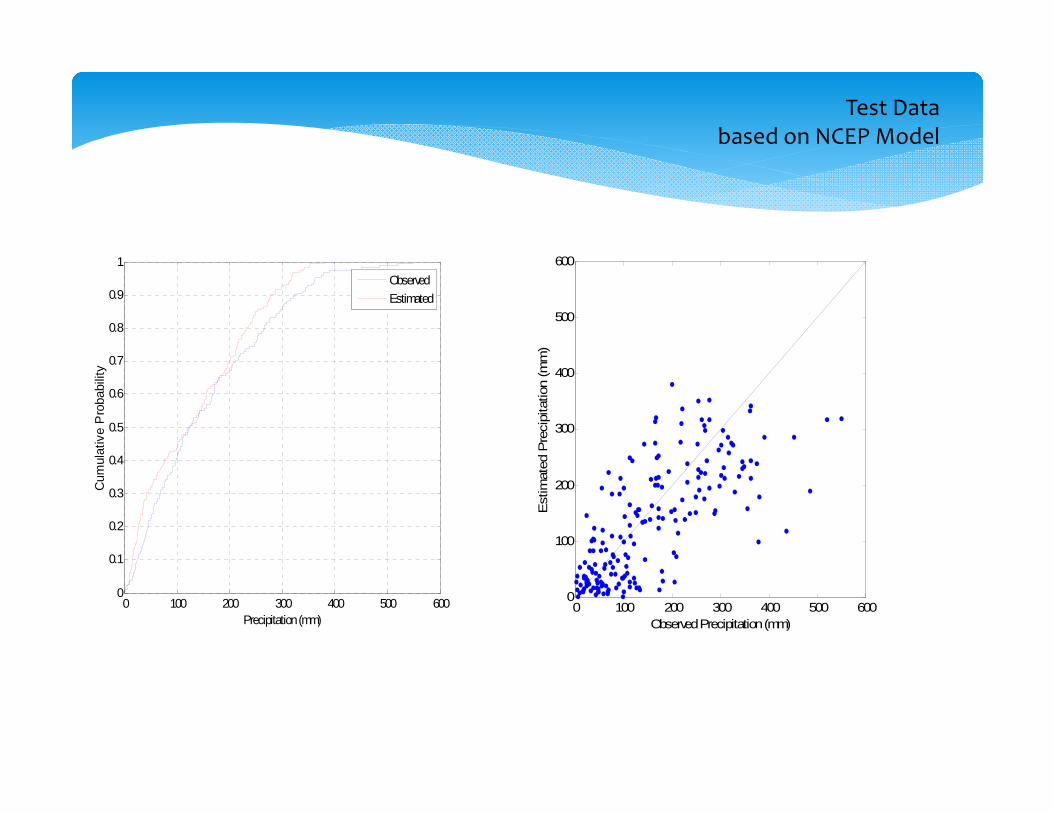
0 100 200 300 400 500 6000
100
200
300
400
500
600
Observed Precipitation (mm)
Est
imat
ed P
reci
pita
tion
(mm
)
Test Databased on NCEP Model
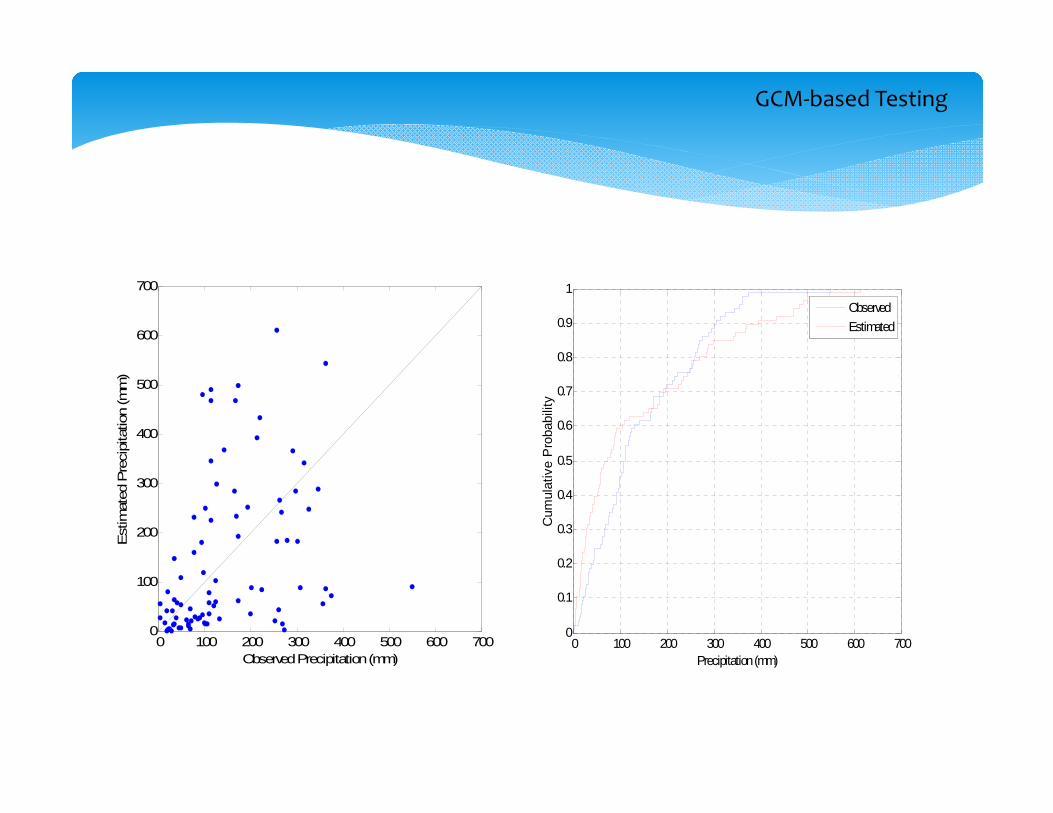
0 100 200 300 400 500 600 7000
100
200
300
400
500
600
700
Observed Precipitation (mm)
Est
imat
ed P
reci
pita
tion
(mm
)
0 100 200 300 400 500 600 7000
0.1
0.2
0.3
0.4
0.5
0.6
0.7
0.8
0.9
1
Precipitation (mm)
Cum
ulat
ive
Pro
babi
lity
ObservedEstimated
GCM‐based Testing
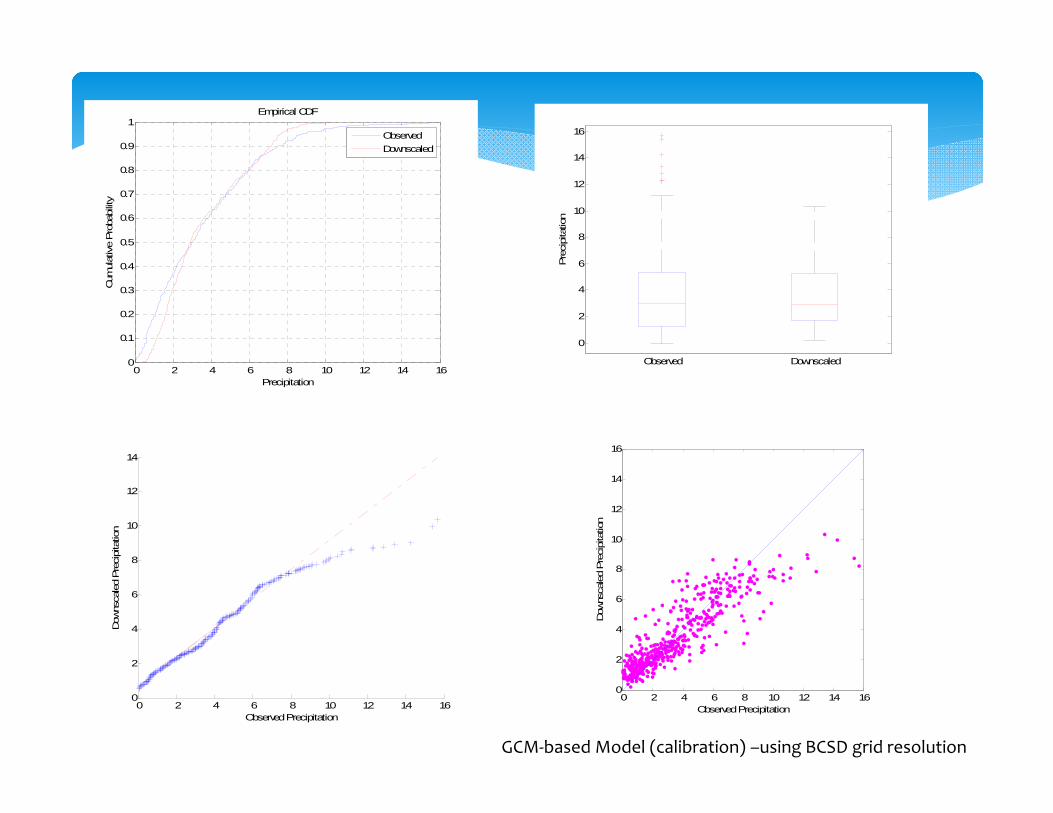
0 2 4 6 8 10 12 14 160
0.1
0.2
0.3
0.4
0.5
0.6
0.7
0.8
0.9
1
Precipitation
Cum
ulat
ive
Pro
babi
lity
Empirical CDF
ObservedDownscaled
0
2
4
6
8
10
12
14
16
Observed Downscaled
Pre
cipi
tatio
n
0 2 4 6 8 10 12 14 160
2
4
6
8
10
12
14
Observed Precipitation
Dow
nsca
led
Pre
cipi
tatio
n
0 2 4 6 8 10 12 14 160
2
4
6
8
10
12
14
16
Observed Precipitation
Dow
nsca
led
Pre
cipi
tatio
n
GCM‐based Model (calibration) –using BCSD grid resolution
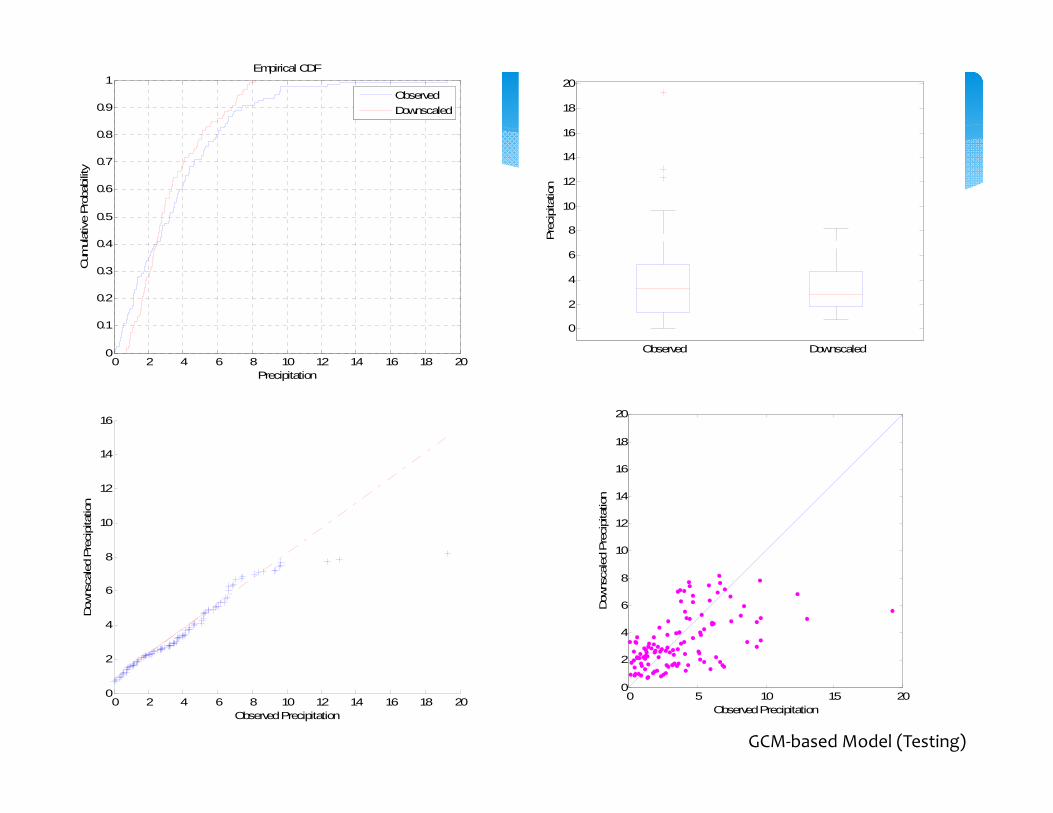
0 2 4 6 8 10 12 14 16 18 200
0.1
0.2
0.3
0.4
0.5
0.6
0.7
0.8
0.9
1
Precipitation
Cum
ulat
ive
Pro
babi
lity
Empirical CDF
ObservedDownscaled
0
2
4
6
8
10
12
14
16
18
20
Observed Downscaled
Pre
cipi
tatio
n
0 2 4 6 8 10 12 14 16 18 200
2
4
6
8
10
12
14
16
Observed Precipitation
Dow
nsca
led
Pre
cipi
tatio
n
0 5 10 15 200
2
4
6
8
10
12
14
16
18
20
Observed Precipitation
Dow
nsca
led
Pre
cipi
tatio
n
GCM‐based Model (Testing)
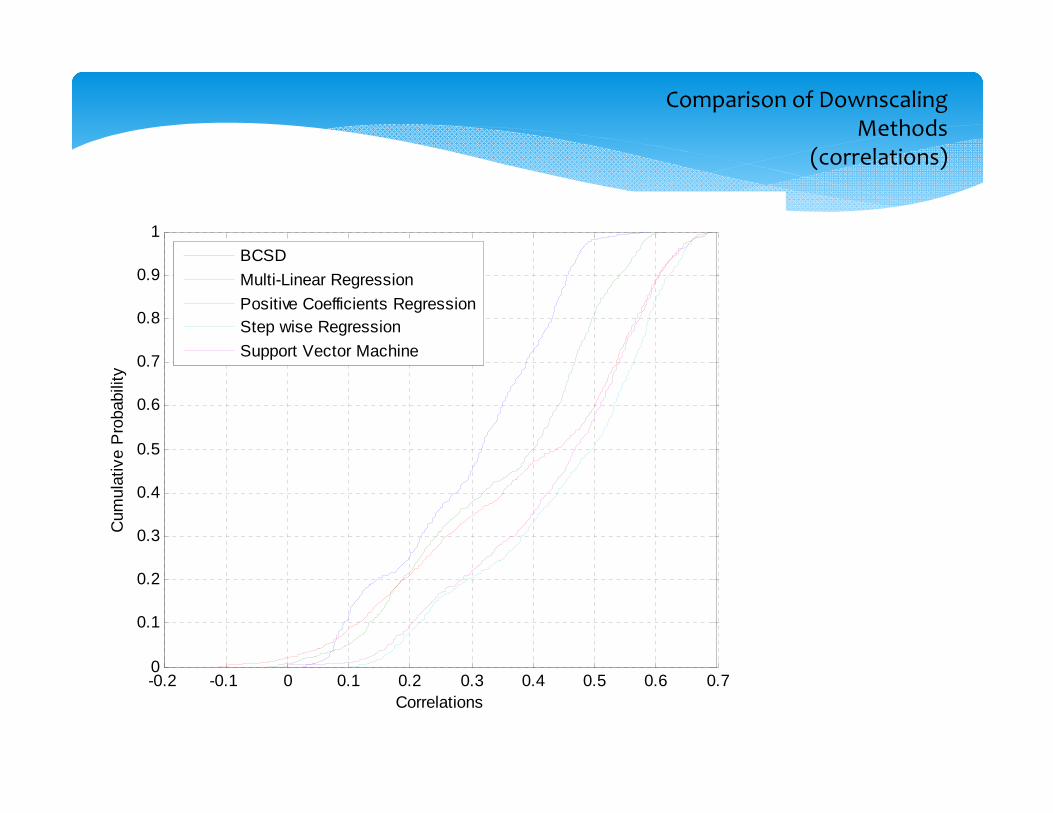
-0.2 -0.1 0 0.1 0.2 0.3 0.4 0.5 0.6 0.70
0.1
0.2
0.3
0.4
0.5
0.6
0.7
0.8
0.9
1
Correlations
Cum
ulat
ive
Pro
babi
lity
BCSDMulti-Linear RegressionPositive Coefficients RegressionStep wise RegressionSupport Vector Machine
Comparison of Downscaling Methods
(correlations)
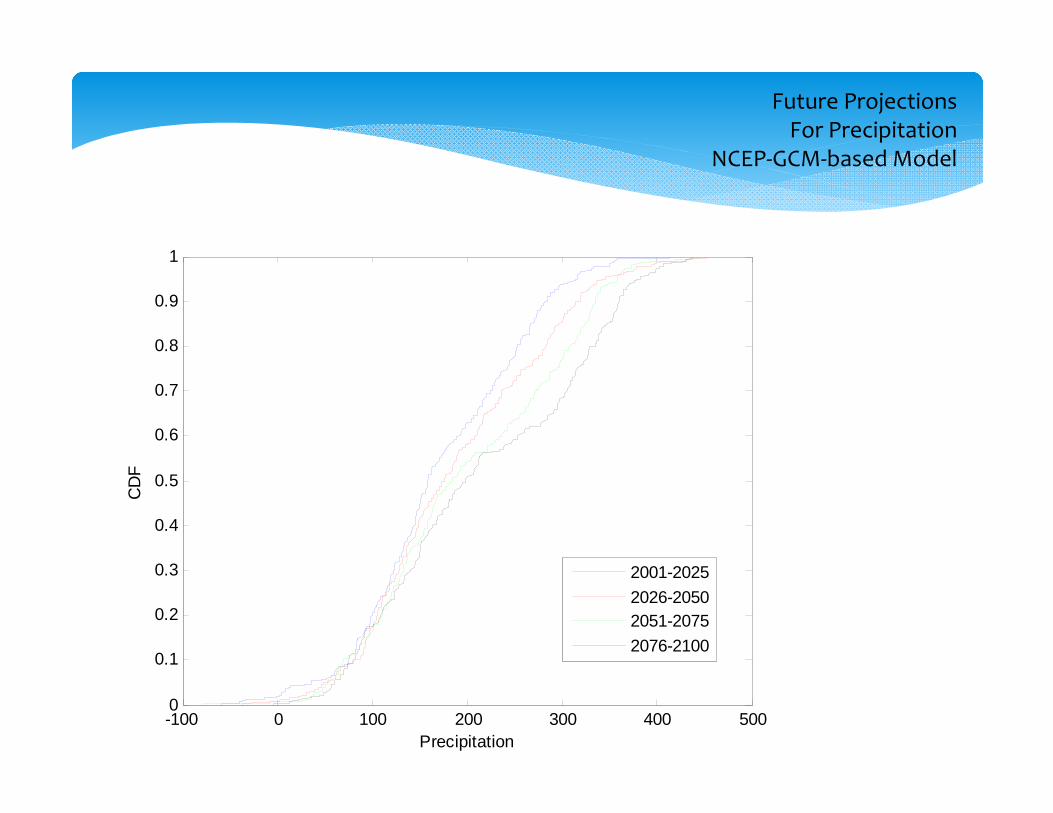
-100 0 100 200 300 400 5000
0.1
0.2
0.3
0.4
0.5
0.6
0.7
0.8
0.9
1
Precipitation
CD
F
2001-20252026-20502051-20752076-2100
Future Projections For Precipitation
NCEP‐GCM‐based Model
Conclusions
o Different methods are experimented for dowscaling precipitation data in Florida.o NCEP‐GCM and GCM‐based downscaling methods are evaluated at point and
different grid scale resolutions for Precipitation.o The grid‐scale resolutions include : 1/8, ½ and 1 Degree resolutions.
o Transfer functions linking GCM scale and grid‐scale predictors in NCEP‐GCM approach is critical in obtaining improved downscaling values at different resolutions.
o The downscaling models provided improved precipitation estimates (based on Canadian Centre for Climate Modeling and Analysis model – CGCM‐ CGCM3.1/T63 Model ) compared to those from BCSD approach at different stations in Florida. It is important to note that no bias corrections have been applied to the outputs of downscaling methods.
o A search for optimal selection of variables (as predictors) is on and methodologies are planned for selection of optimal number and type.