Experimental apparatus at KUR-ISOL to identify isomeric ...
22
Experimental apparatus at KUR-ISOL to identify isomeric transitions from fission products, and decay spectroscopy of 151 Ce Y. Kojima a,* , M. Shibata b , A. Taniguchi c , Y. Kawase c , R. Doi a , A. Nagao a , K. Shizuma a a Graduate School of Engineering, Hiroshima University, Higashi-Hiroshima 739-8527, Japan b Radioisotope Research Center, Nagoya University, Nagoya 464-8602, Japan c Research Reactor Institute, Kyoto University, Kumatori 590-0494, Japan Abstract Decay studies on 151 Ce have been performed using the on-line isotope separa- tor connected to the Kyoto University Reactor. In addition to conventional γ and conversion electron spectroscopy, β -gated measurements were carried out on mass- separated 151 Ce to identify an isomeric transition. From the analysis of the obtained data, the half-life of the isotope was ascertained to be 1.76(6) s and a decay scheme containing six excited levels was constructed for the first time. The excited level at 35.1 keV in 151 Pr was found to be a long-lived state (a half-life of approximately 10 μs or longer). Key words: radioactivity 151 Ce [from 235 U(n th , f )], β -gated measurement, long-lived level, decay scheme, 151 Pr deduced level, mass-separation PACS: 23.20.Lv, 27.70.+q Preprint submitted to Elsevier Science 5 April 2006
Transcript of Experimental apparatus at KUR-ISOL to identify isomeric ...
Experimental apparatus at KUR-ISOL to
identify isomeric transitions from fission
products, and decay spectroscopy of 151Ce
Y. Kojima a,∗, M. Shibata b, A. Taniguchi c, Y. Kawase c,
R. Doi a, A. Nagao a, K. Shizuma a
aGraduate School of Engineering, Hiroshima University,
Higashi-Hiroshima 739-8527, Japan
bRadioisotope Research Center, Nagoya University, Nagoya 464-8602, Japan
cResearch Reactor Institute, Kyoto University, Kumatori 590-0494, Japan
Abstract
Decay studies on 151Ce have been performed using the on-line isotope separa-
tor connected to the Kyoto University Reactor. In addition to conventional γ and
conversion electron spectroscopy, β-gated measurements were carried out on mass-
separated 151Ce to identify an isomeric transition. From the analysis of the obtained
data, the half-life of the isotope was ascertained to be 1.76(6) s and a decay scheme
containing six excited levels was constructed for the first time. The excited level at
35.1 keV in 151Pr was found to be a long-lived state (a half-life of approximately
10 µs or longer).
Key words: radioactivity 151Ce [from 235U(nth, f)], β-gated measurement,
long-lived level, decay scheme, 151Pr deduced level, mass-separation
PACS: 23.20.Lv, 27.70.+q
Preprint submitted to Elsevier Science 5 April 2006
1 Introduction
Decay schemes are one of the most important information in fields of nuclear
science and its applications. Many efforts, including the development of in-
struments and experimental techniques, have been devoted to construct decay
schemes. However, our knowledge on nuclei far from stability is still left in an
unsatisfied situation. The main reasons are experimental difficulties in prepar-
ing the sources and measuring them efficiently. For example, a considerable
amount of data is available for the decay of Ce isotopes with a mass number
A ≤ 149 [1]. In contrast to them, experimental data on heavier isotopes are
scarce. In particular, for 151Ce, only a half-life value of 1.02(6) s along with
energies of four γ rays have been reported [2]; Furthermore, no decay scheme
has been proposed.
In our previous report [3], a partial decay scheme of 151Ce was constructed
from γ-γ coincidence measurements using an on-line isotope separator. How-
ever, the 35.1-keV γ ray, which was the most intense, could not be placed in
the decay scheme because of the absence of experimentally observed cascade
relationships for this transition. Subsequently, we performed additional coinci-
dence measurements in order to obtain more comprehensive data, particularly
with regard to the 35-keV γ ray; The detection system used in this experi-
ment was partly reported in our previous paper [4], in which we successfully
identified the 4− 76.8-keV isomeric level in 148Pr. In this paper, we present
∗ Corresponding author. Tel: +81-82-424-7613. Fax: +81-82-424-2453.Email address: [email protected] (Y. Kojima).
2
the experimental method in detail and propose the decay scheme of 151Ce; It
has been constructed by using data previously reported by us as well as those
obtained from newly performed measurements.
2 Experimental methods
2.1 Source preparation
The 151Ce isotopes were prepared by the on-line isotope separator installed at
the Kyoto University Reactor (KUR-ISOL) [5], following the thermal neutron-
induced fission of 235U. A 93%-enriched 235UF4 target (50 mg) was irradiated
with a thermal neutron flux of 3 × 10¹² n/cm2s. The fission products ther-
malized in the target chamber were transported by a He-N2 mixture gas jet
stream to a surface-ionization-type ion source. After ionization to the chemi-
cal form of 151Ce16O+ in order to improve the ionization efficiency, the 151Ce
isotopes were extracted, accelerated to 30 keV and mass-separated with a res-
olution M/∆M of about 600. The mass-separated ions were implanted onto an
aluminized Mylar tape in a computer-controlled tape transport system. The
radioactive sources were periodically transported to a lead-shielded detector
station in time intervals of 3.5 s.
2.2 Gamma-ray spectroscopy
Gamma-ray singles and γ-γ coincidence measurements for the mass-separated
151Ce were performed through two experimental runs. The experimental se-
tups for the two runs were identical except for the energy region measured. In
3
the first run, γ rays were measured in an energy range of 0–2000 keV. These
experiments revealed that a spectrum in a low-energy region was complex.
Therefore, in the second run, the energy region was changed to 0–1000 keV
in order to obtain comprehensive data for low-energy γ rays. The following
detectors were used in these measurements: a 30% n-type HPGe detector
(ORTEC GAMMA-X) and a short coaxial detector (ORTEC LO-AX, crystal
diameter: 51 mm, thickness: 20 mm). The energy resolution (FWHM) of the
GAMMA-X was 2.2 keV at 1332 keV, and that of the LO-AX was 800 eV
at 122 keV. The source-to-detector distance was 10 mm for both detectors.
Energy and efficiency calibrations were performed using standard 60Co, 133Ba,
137Cs and 152Eu γ-ray sources. Coincidence summing effects were considered
for determining the full-energy peak efficiency. The uncertainty of the detec-
tion efficiency was estimated to be less than 10%.
In order to determine the half-life, γ-ray singles spectra were recorded in a
multispectrum mode by using 16 × 4096 channel pulse height analyzers, in
which a 3.2-s counting time was divided into sixteen 0.2-s intervals. The γ-γ
coincidence data were recorded in an event-by-event mode. Approximately 2.0
× 106 and 3.2 × 10⁷ events were accumulated during the measurement periods
of 56 h and 127 h in the first and second runs, respectively.
2.3 Conversion electron spectroscopy
Internal conversion electrons were measured using a 500-mm2-area and 5-mm-
thick Si(Li) detector (third run). The 151Ce source was periodically prepared in
time intervals of 3.5 s and positioned 15 mm from the Si(Li) detector surface.
The energy and efficiency calibrations were performed using mass-separated
4
146La. The energy resolution of the detector was 1.7 keV for a 218-keV electron
peak. In order to determine the internal conversion coefficients and obtain
the cascade relations, the γ-ray spectra were simultaneously measured by the
30% GAMMA-X detector in singles and electron-γ coincidence modes. The
distance between the source and the HPGe detector window was 15 mm.
Approximately 5.9 × 10⁷ events were detected over a period of 77 h. A more
detailed description of this setup is provided in our previous paper [6].
2.4 Beta-gated gamma and electron spectroscopy
Electron and γ-ray singles, β-gated electron and γ-ray singles, and electron-γ
coincidence measurements were performed over a period of 38 h in an indepen-
dent run (fourth run). The aim of this experiment was to obtain information
on long-lived excited states. Details of this detection system are as follows.
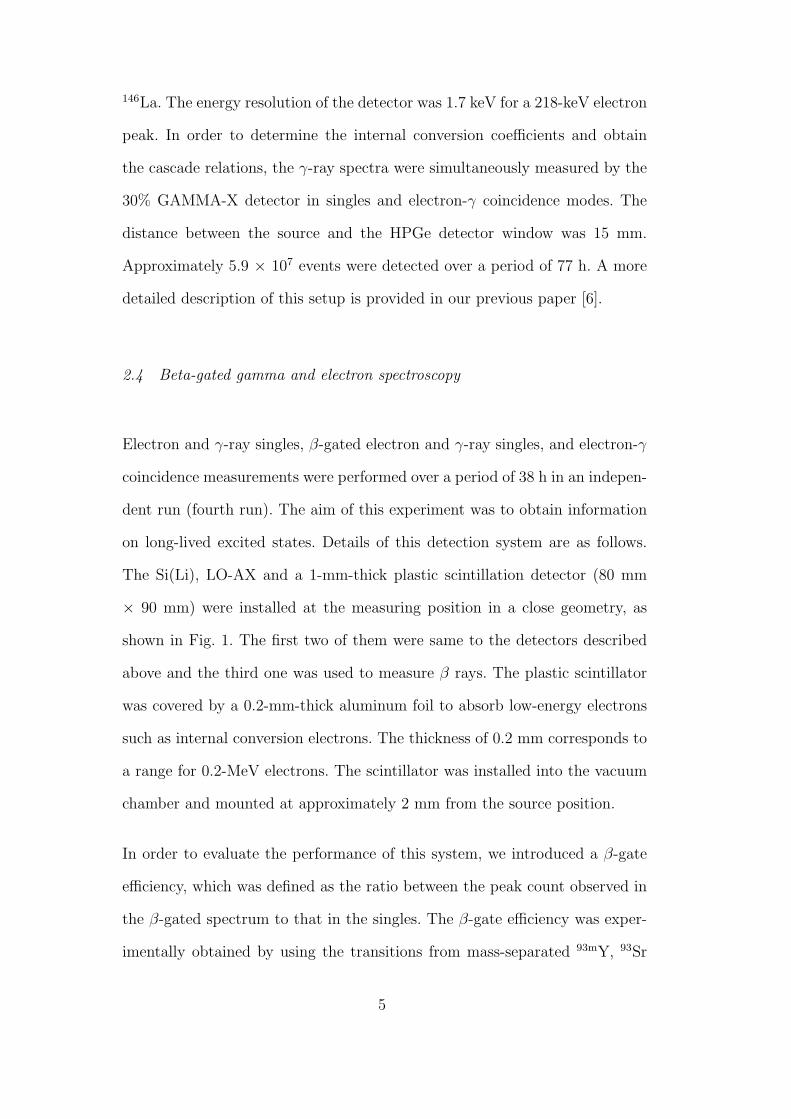
The Si(Li), LO-AX and a 1-mm-thick plastic scintillation detector (80 mm
× 90 mm) were installed at the measuring position in a close geometry, as
shown in Fig. 1. The first two of them were same to the detectors described
above and the third one was used to measure β rays. The plastic scintillator
was covered by a 0.2-mm-thick aluminum foil to absorb low-energy electrons
such as internal conversion electrons. The thickness of 0.2 mm corresponds to
a range for 0.2-MeV electrons. The scintillator was installed into the vacuum
chamber and mounted at approximately 2 mm from the source position.
In order to evaluate the performance of this system, we introduced a β-gate
efficiency, which was defined as the ratio between the peak count observed in
the β-gated spectrum to that in the singles. The β-gate efficiency was exper-
imentally obtained by using the transitions from mass-separated 93mY, 93Sr
5
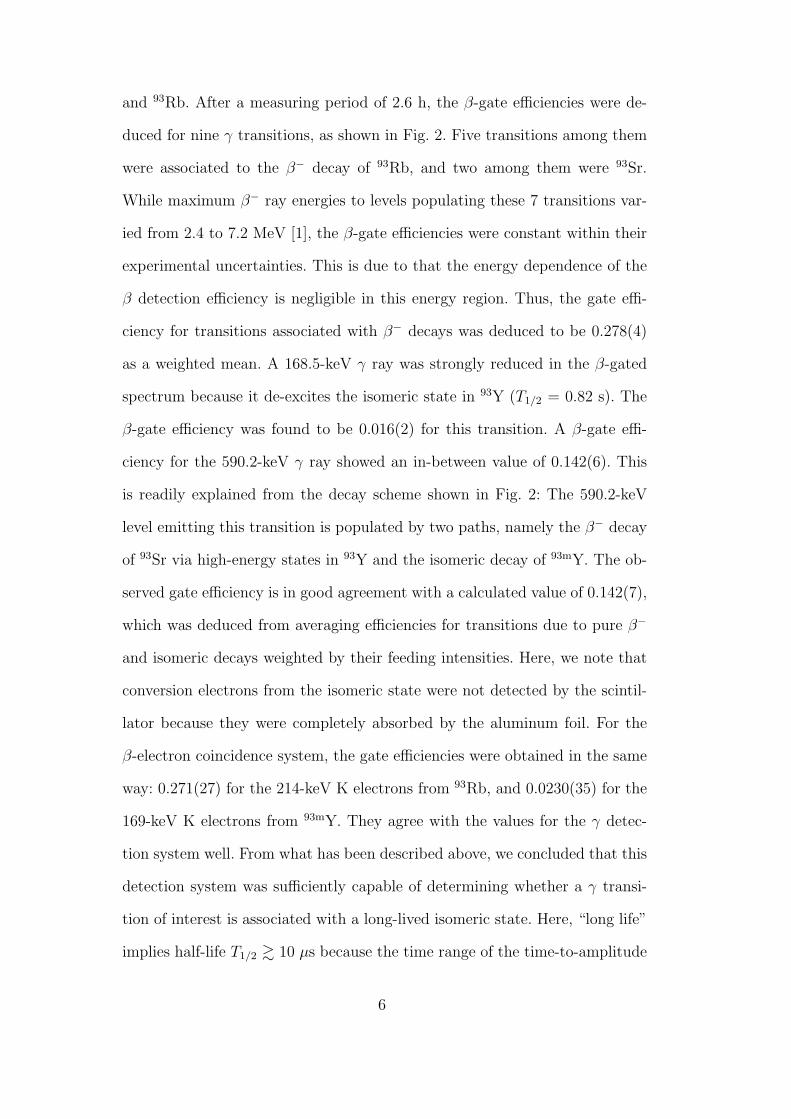
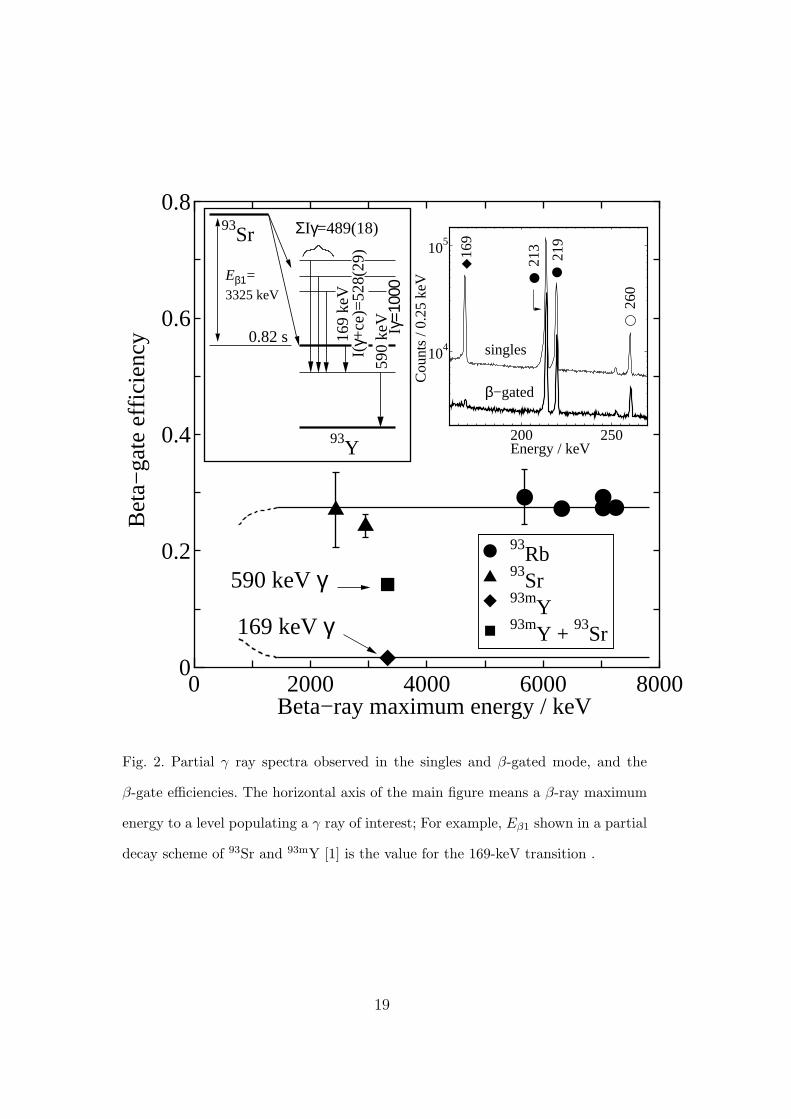
and 93Rb. After a measuring period of 2.6 h, the β-gate efficiencies were de-
duced for nine γ transitions, as shown in Fig. 2. Five transitions among them
were associated to the β− decay of 93Rb, and two among them were 93Sr.
While maximum β− ray energies to levels populating these 7 transitions var-
ied from 2.4 to 7.2 MeV [1], the β-gate efficiencies were constant within their
experimental uncertainties. This is due to that the energy dependence of the
β detection efficiency is negligible in this energy region. Thus, the gate effi-
ciency for transitions associated with β− decays was deduced to be 0.278(4)
as a weighted mean. A 168.5-keV γ ray was strongly reduced in the β-gated
spectrum because it de-excites the isomeric state in 93Y (T1/2 = 0.82 s). The
β-gate efficiency was found to be 0.016(2) for this transition. A β-gate effi-
ciency for the 590.2-keV γ ray showed an in-between value of 0.142(6). This
is readily explained from the decay scheme shown in Fig. 2: The 590.2-keV
level emitting this transition is populated by two paths, namely the β− decay
of 93Sr via high-energy states in 93Y and the isomeric decay of 93mY. The ob-
served gate efficiency is in good agreement with a calculated value of 0.142(7),
which was deduced from averaging efficiencies for transitions due to pure β−
and isomeric decays weighted by their feeding intensities. Here, we note that
conversion electrons from the isomeric state were not detected by the scintil-
lator because they were completely absorbed by the aluminum foil. For the
β-electron coincidence system, the gate efficiencies were obtained in the same
way: 0.271(27) for the 214-keV K electrons from 93Rb, and 0.0230(35) for the
169-keV K electrons from 93mY. They agree with the values for the γ detec-
tion system well. From what has been described above, we concluded that this
detection system was sufficiently capable of determining whether a γ transi-
tion of interest is associated with a long-lived isomeric state. Here, “long life”
implies half-life T1/2 & 10 µs because the time range of the time-to-amplitude
6
converters employed was set to 2 µs and the gate period of our coincidence
system was 5 µs.
3 Results
3.1 Gamma ray
For the mass fraction A = 151 + 16, some γ rays with a half-life of approxi-
mately 2 s were newly observed together with those from 151Pr (T1/2 = 18.90 s)
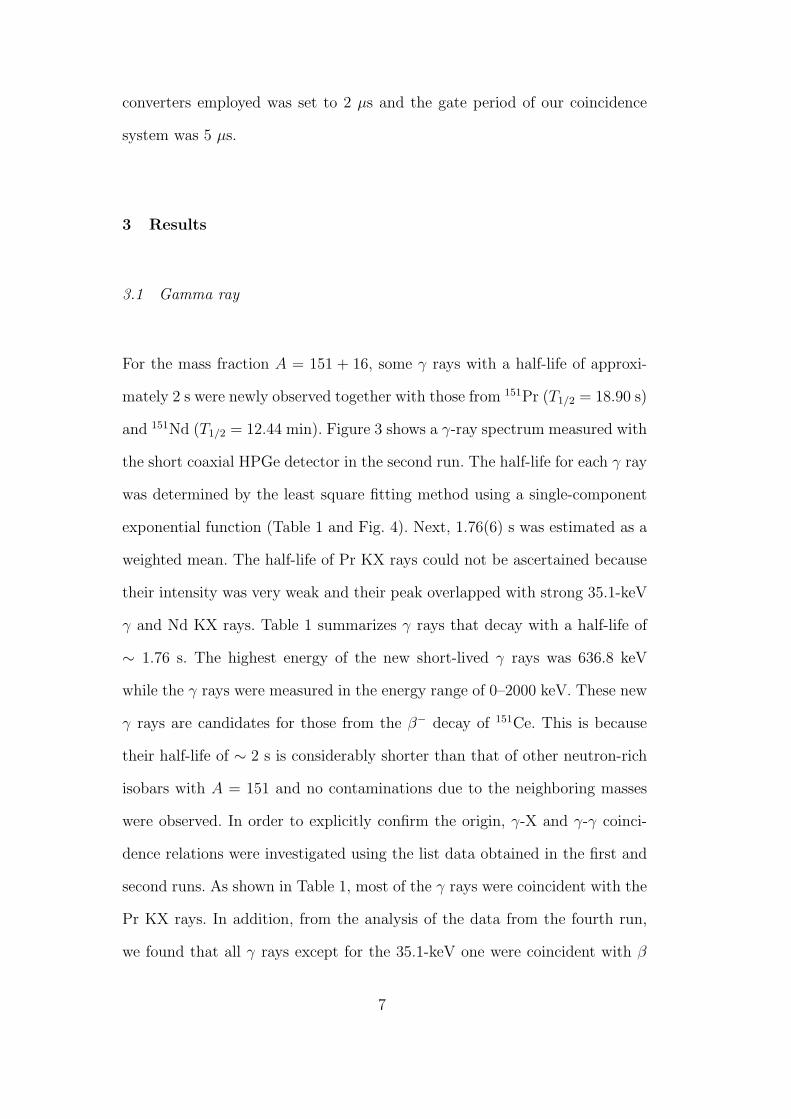
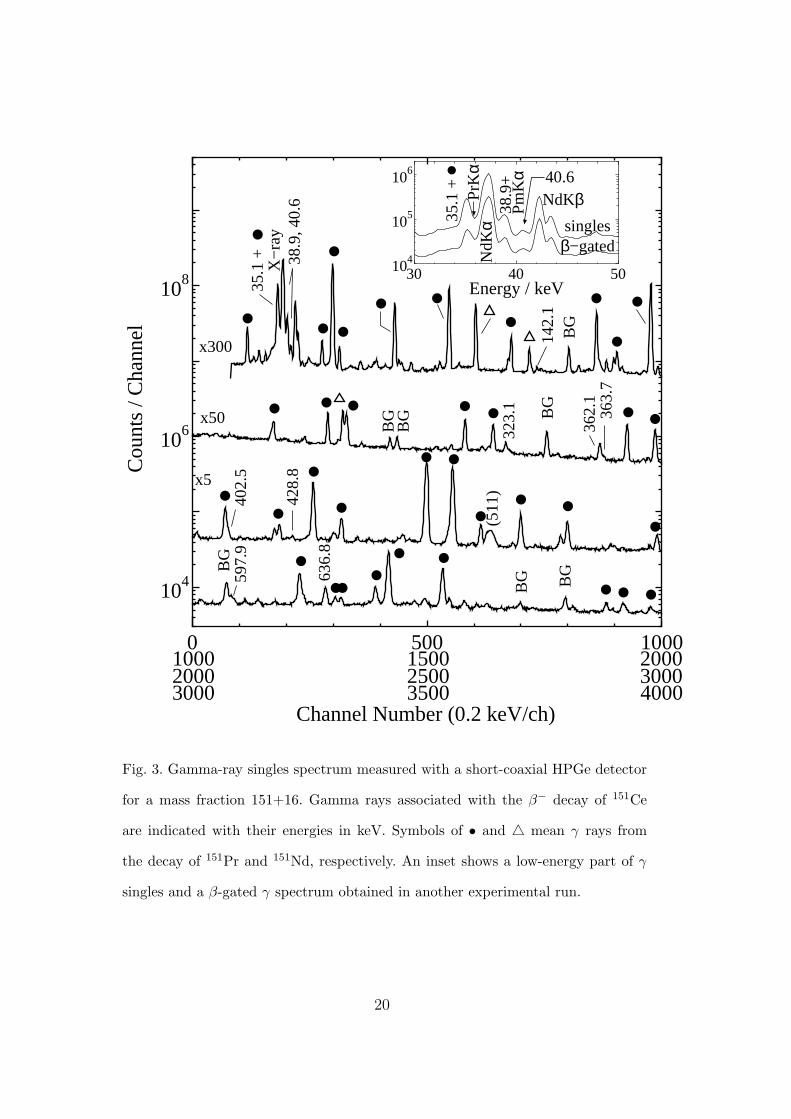
and 151Nd (T1/2 = 12.44 min). Figure 3 shows a γ-ray spectrum measured with
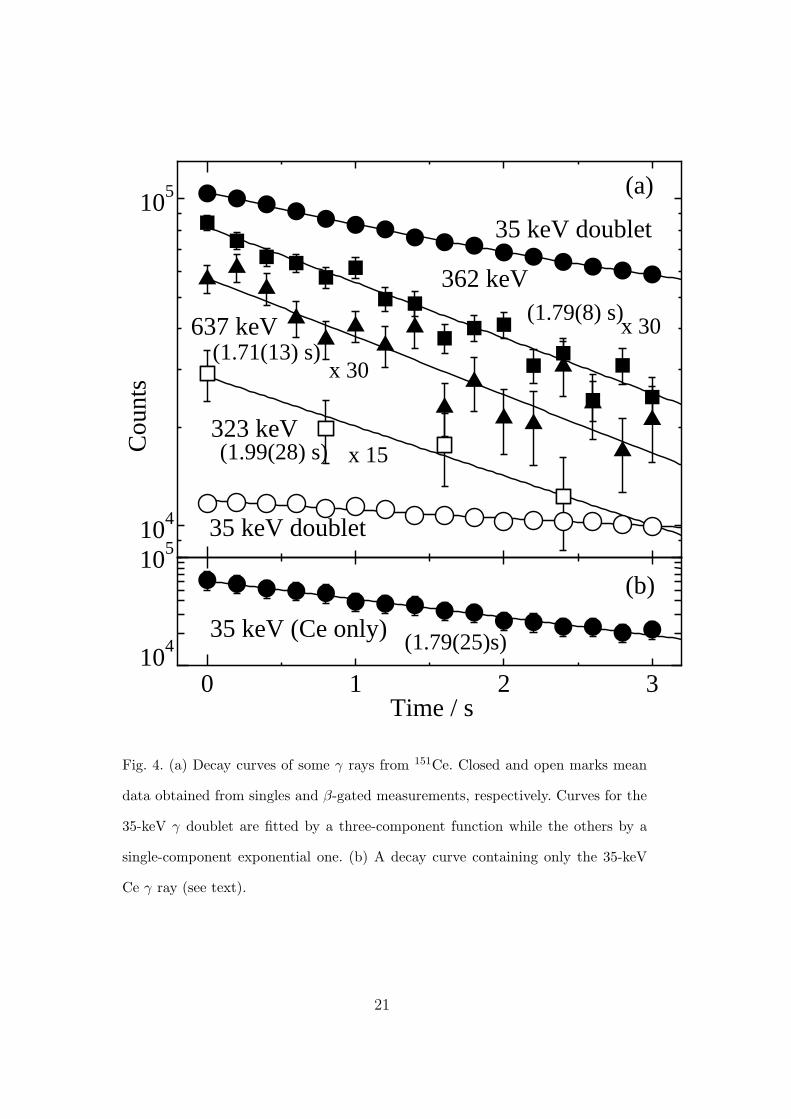
the short coaxial HPGe detector in the second run. The half-life for each γ ray
was determined by the least square fitting method using a single-component
exponential function (Table 1 and Fig. 4). Next, 1.76(6) s was estimated as a
weighted mean. The half-life of Pr KX rays could not be ascertained because
their intensity was very weak and their peak overlapped with strong 35.1-keV
γ and Nd KX rays. Table 1 summarizes γ rays that decay with a half-life of
∼ 1.76 s. The highest energy of the new short-lived γ rays was 636.8 keV
while the γ rays were measured in the energy range of 0–2000 keV. These new
γ rays are candidates for those from the β− decay of 151Ce. This is because
their half-life of ∼ 2 s is considerably shorter than that of other neutron-rich
isobars with A = 151 and no contaminations due to the neighboring masses
were observed. In order to explicitly confirm the origin, γ-X and γ-γ coinci-
dence relations were investigated using the list data obtained in the first and
second runs. As shown in Table 1, most of the γ rays were coincident with the
Pr KX rays. In addition, from the analysis of the data from the fourth run,
we found that all γ rays except for the 35.1-keV one were coincident with β
7
rays; The details will be described in section 3.3. The 363.7- and 597.9-keV
γ rays were not coincident with any X rays. However, they were in cascade
with the 39-keV line, which was coincident with the Pr KX rays. Also, no
coincidence relations were observed for the 35.1- and 636.8-keV γ rays. These
γ rays, however, decayed with a half-life of ∼ 1.8 s and 1.71(13) s, respectively.
They were consistent with the half-life value of 1.77(7) s deduced from other
peaks. Therefore, we concluded that the eleven γ rays shown in Table 1 were
associated with the β− decay of 151Ce.
The γ-ray intensities relative to the 636.8-keV peak were mainly obtained
using the singles data. The 35.1-, 38.9-, and 597.9-keV γ rays were doublets
with a γ or X ray. Thus, their intensities were evaluated by the following
analysis.
The 35.1-keV peak was a doublet of 151Ce and 151Pr γ rays. The γ intensity
associated with 151Ce was estimated by two independent methods. First, the
35.1-keV Ce peak count was obtained after subtracting the contribution from
the 35.2-keV Pr γ ray. The 35.2-keV Pr peak count was evaluated from the
experimental 22.5-keV Pr γ-ray counts and from their intensities reported by
Shibata et al.[7]: Iγ=12.8(13) for the 35.2-keV and Iγ=8.3(6) for the 22.5-
keV Pr γ ray. The intensity ratio of the 35.1-keV Ce to the doublet counts,
R = I(Ce)/(I(Ce) + I(Pr)), was found to be 48(14)%. Second, the Ce γ-ray
count was evaluated by analyzing the decay curve of the 35-keV multiplet.
The time-dependent peak counts were fitted by a three-component function:
two of the functions are exponential and correspond to the decay of Ce and
Pr, and third one corresponds to the growth-and-decay component of the Pr
γ ray. In this analysis, the half-life values for Ce and Pr were fixed at 1.76 s
and 18.9 s, respectively. From the least square fitting, the intensity ratio R
8
was found to be 43(2)%, which is consistent with the value obtained by the
first method. Therefore, the 35.1-keV Ce peak intensity relative to that of the
636.8-keV γ ray was evaluated to be 450(73) by averaging the values obtained
by the two methods. At this point, it should be noted that an additional anal-
ysis was performed to confirm the validity of our assumption that the half-life
of the 35.1-keV Ce peak is 1.76 s. In order to verify this assumption, a decay
curve containing only the 35.1-keV Ce γ ray was constructed after subtracting
the 35.2-keV Pr γ-ray counts. Here, the Pr contributions were evaluated using
the 22.5-keV γ-ray counts, as described above. The decay curve was well rep-
resented by a single-component exponential function (Fig. 4(b)), after which
a half-life value of 1.79(25) s was obtained. Therefore, we concluded that the
35.1-keV Ce peak decayed with the adopted half-life value of 1.76 s. In other
words, the excited state emitting the 35.1-keV γ ray has a considerably shorter
half-life than that of 151Ce (1.76 s). The discussion to be given in section 3.3
will refer to these results.
The 38.9-keV γ ray is a doublet with the Pm KαX ray. The KαX-ray count was
evaluated from the experimentally observed Pm Kβ2X-ray count, the intensity
ratio Kα/Kβ2 of 24.4(6) [1], and their detection efficiencies. After subtracting
the X-ray count, the relative intensity of the 38.9-keV γ ray was evaluated to
be 146(35).
The 597.9-keV Ce γ ray is a doublet with the 599.1-keV Pr γ transition.
Because the 598-keV Ce γ ray was coincident with the 39-keV γ ray, the
relative intensity of 17.2(44) was readily obtained from the spectrum gated by
the 39-keV γ ray. In addition, the intensity was also estimated by analyzing a
decay curve of this doublet. From this analysis, the intensity was found to be
14.8(46). This was consistent with the value evaluated from the coincidence
9
data. The averaged intensity of 16.1(32) was adopted for the 598-keV γ ray.
3.2 Internal conversion electron
A conversion electron spectrum was obtained in an energy range of ∼ 30 keV
to 1000 keV. Twenty transitions from the β− decay of 151Pr were clearly ob-
served, and their internal conversion coefficients were deduced as reported in
our previous paper [6]. However, the electron peaks associated with the β− de-
cay of 151Ce were not observed in this spectrum. This implies that γ transitions
from 151Ce have low multipolarities.
3.3 Long-lived excited state in 151Pr
The β-gate efficiency, which is the ratio of counts observed in the β-gated
spectrum to those observed in the singles, was deduced for each peak. The
β-gate efficiencies for most of the peaks were approximately 0.3, which was
consistent with the value obtained from the calibration measurements using
the β-decay isotopes of 93Sr and 93Rb. This implies that these transitions occur
due to β− decays and that the excited states emitting them have very short
life-time values.
A small β-gate efficiency was observed only for the 35-keV γ ray. The inset of
Fig. 3 shows that the 35-keV peak in the β-gated spectrum has significantly
reduced in comparison to that of the Nd KβX ray. It should be noted that
the 35-keV peak is a doublet of the 151Ce 35.1-keV and the 151Pr 35.2-keV
γ rays. After subtracting the contribution of 151Pr, which was evaluated by
analyzing the decay curve, the β-gate efficiency of the 151Ce 35.1-keV γ ray
10
was ascertained as 0.021(3). This value agrees with the β-gate efficiency of
0.016(2), which was obtained for the isomeric transition from 93mY in the
calibration measurement. Therefore, we conclude that a level de-excited by
the 35.1-keV γ ray has a long life. Unfortunately, the half-life of this level
could not be determined exactly in this study; No sloop due to the 35.1-keV
γ transition was observed in the time spectrum of the coincidence events. The
only manner in which the half-life can be described is that it is longer than
∼ 10 µs but considerably shorter than the β−decay half-life of 151Ce (1.76 s).
This is because the 35.1-keV γ ray decays with T1/2 ∼ 1.76 s, as described in
section 3.1; In other words, the 35-keV γ transition and the β− decay of 151Ce
are in radioactive equilibrium.
3.4 Decay scheme
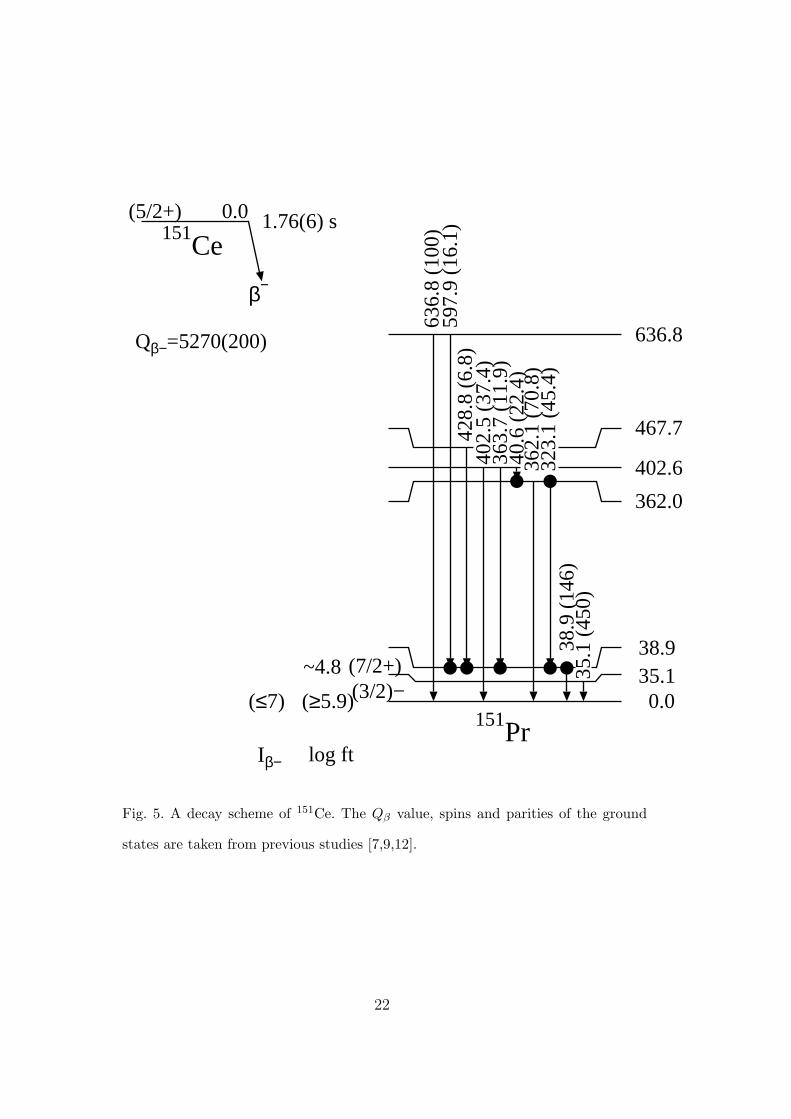
A new decay scheme of 151Ce was constructed on the basis of γ-ray energies,
intensities, half-lives and coincidence relationships (Fig. 5). All the levels ex-
cept for the 35.1-keV level were supported by γ-γ coincidence relations. The
35-keV γ-ray was placed as a transition from a long-lived 35-keV level to the
ground state because it was not coincident with any β rays, γ rays and con-
version electrons. The energy of the 362.1-keV γ ray was very similar to that
of the 362.0-keV level, which was established from 38.9-323.1 and 323.1-40.6
keV γ cascades. Thus, the 362-keV γ ray was placed between the 362-keV and
the ground level while no coincidence relation between the 41- and 362-keV γ
rays was observed.
11
4 Discussion
4.1 Comparison with previous studies
The 84.8- and 118.6-keV γ rays with a half-life of 1.02(6) s have been assigned
to the β− decay of 151Ce in Nuclear Data Sheets [2]. They were identified from
X-γ coincidence measurements for fission products of the spontaneous fission
of 252Cf. The 52.6- and 96.8-keV γ rays were also found from X-γ coincidences
for fission fragments of 252Cf and assigned as transitions from the β− decay
of 151Ce [2]. However, these four γ rays were not observed in our studies. Al-
though experimental methods in previous studies were able to determine the
atomic number, the identification of the mass number remains ambiguous.
This contrasts strikingly with our experiments using the on-line mass separa-
tor. Therefore, a possible explanation for this discrepancy is the assignment
of incorrect mass number in the previous studies. Another interpretation is
that an unknown isomeric state exists in 151Ce and that the β−decay of this
isomer feeds bands different from those observed in our experiments using the
235U(nth, f) reaction. Recent studies [8] appear to partially favor this argu-
ment; These studies investigated the fission products of 252Cf by using the
Gammasphere array and observed a 96.0-keV transition in a 151Pr γ sequence.
4.2 Log-ft values
From the systematics of N = 93 isotones, the 3/2−[521] and 5/2+[642] Nilsson
orbits are possible candidates for the ground state of 151Ce. Hoellinger et al.
[9] proposed the spin and the parity Iπ of 5/2+ for the ground state on the
12
basis of a level spacing of the rotational band observed in 151Ce. For 151Pr,
Iπ = (3/2)− was assigned to the ground state from the experimental log ft
values [7]. Thus, a β− decay from 151Ce to the ground state of 151Pr is the
first forbidden non-unique transition. This implies that a log ft value for this
β feeding is greater than 5.9 [10], i.e., the β transition probability is less than
7%. Here, we used the log f table [11] and a Qβ value of 5.27 MeV, which
was measured with a total absorption BGO spectrometer [12]. Subsequently,
the log ft values for excited levels in 151Pr were evaluated using the β feeding
intensities estimated from the γ intensity imbalance for each level. It should be
noted here that β transition intensities are not determined explicitly. This is
because multipolarities of γ rays, that is, the total intensities of the γ rays are
unknown. Thus, in this evaluation, various multipolarities, 1 ≤ l ≤ 2, were
assumed for γ rays in order to estimate the internal conversion coefficients
[13], i.e., the total γ transition probabilities. As expected, the log ft values
considerably vary with the assumed multipolarities. The log ft value for the
35-keV level, however, was approximately 4.8 for all calculation sets because
the 35.1-keV γ intensity is considerably larger than that of the others. This
small log ft value implies that the β feeding to the 35-keV level is an allowed
transition. Then, the Iπ of (3/2+, 5/2+, 7/2+) was assigned to the 35-keV
level. When the 35-keV level is a 3/2+, 5/2+, or 7/2+ state, the γ transition
to the (3/2)− ground state would be E1, E1, or M2, respectively. According to
the Weisskopf estimate [14], the total half-life of a 35-keV E1 transition is 3 ps
and that of M2 is 80 µs although the E1 and M2 transitions are frequently
hindered by orders of ∼ 5 and ∼ 1, respectively. The experimental results that
indicated that the 35-keV level has a long life appear to favor the Iπ of (7/2+)
for this level.
13
5 Conclusions
We have shown that the β-gated detection system installed to the KUR-ISOL
had a sufficient ability to identify isomeric transitions. Using this apparatus
and conventional γ and conversion electron detectors, a decay study on 151Ce
was performed; A decay scheme of 151Ce was newly proposed, and a long-lived
(& 10µs) excited level in 151Pr was identified at 35.1 keV. From the log ft value
and empirical rules, the spin and parity of (7/2+) were tentatively assigned to
this level.
Acknowledgment
We would like to thank Dr. E. Yoshida, Mr. T. Hanafusa, Mr. O. Suematsu,
and Ms. M. Hirano for their assistance in the early stages of this study.
This study was performed under the Research Collaboration Program of Re-
search Reactor Institute, Kyoto University. This work was partly supported
by Grants-in-Aid for Scientific Research (No. 12780386) from the Ministry of
Education, Science, Sports and Culture, Japan.
References
[1] R.B. Firestone and V.S. Shirley (Ed.), Table of Isotopes, John Wiley & Sons,
New York, 1996.
[2] B. Singh, Nucl. Data Sheets 80 (1997) 263.
[3] Y. Kojima, M. Shibata, A. Taniguchi, Y. Kawase, T. Hanafusa, E. Yoshida,
14
K. Shizuma, Proc. Int. Conf. on Nuclear Data for Science and Technology,
Tsukuba, 2001, pp.489-492.
[4] Y. Kojima, A. Taniguchi, M. Shibata, E. Oyama, T. Nishimura, K. Shizuma,
Y. Kawase, Eur. Phys. J. A 19 (2004) 77.
[5] A. Taniguchi, K. Okano, T. Sharshar, Y. Kawase, Nucl. Instr. and Meth. A 351
(1994) 378.
[6] Y. Kojima, M. Shibata, A. Taniguchi, T. Hanafusa, E. Yoshida, K. Shizuma,
Y. Kawase and S. Yamada, Eur. Phys. J. A 16 (2003) 331.
[7] M. Shibata, T. Ikuta, A. Taniguchi, A. Osa, A. Tanaka, H. Yamamoto,
K. Kawade, J.-Z. Ruan, Y. Kawase and K. Okano, J. Phys. Soc. Jpn. 63 (1994)
3263.
[8] J.K. Hwang, A.V. Ramayya, J.H. Hamilton, E.F. Jones, P.M. Gore, S.J. Zhu,
C.J. Beyer, J. Kormicki, X.Q. Zhang, L.K. Peker, B.R.S. Babu, T.N. Ginter,
G.M. Ter-Akopian, Yu.Ts. Oganessian, A.V. Daniel, W.C. Ma, P.G. Varmette,
J.O. Rasmussen, I.Y. Lee, J.D. Cole, R. Aryaeinejad, M.W. Drigert, M.A. Stoyer,
S.G. Prussin, R. Donangelo and H.C. Griffin, Phys. Rev. C 62 (2000) 044303.
[9] F. Hoellinger, N. Schulz, J.L. Durell, I. Ahmad, M. Bentaleb, M.A. Jones,
M. Leddy, E. Lubkiewicz, L.R. Morss, W.R. Phillips, A.G. Smith, W. Urban
and B.J. Varley, Phys. Rev. C 56 (1997) 1296.
[10] S. Raman and N.B. Gove, Phys. Rev. 7 (1973) 1995.
[11] N.B. Gove and M.J. Martin, Nucl. Data Tables 10 (1971) 205.
[12] M. Shibata, Y. Kojima, H. Uno, K. Kawade, A. Taniguchi, Y. Kawase,
S. Ichikawa, F. Maekawa and Y. Ikeda, Nucl. Instr. and Meth. A 459 (2001)
581.
15
[13] F. Rosel, H.M. Fries, K. Alder, and H.C. Pauli, Atom. Data and Nucl. Data
Tables 21 (1978) 91.
[14] J.M. Blatt and V.F. Weisskopf, Theoretical Nuclear Physics, John Wiley &
Sons, New York, 1952.
16
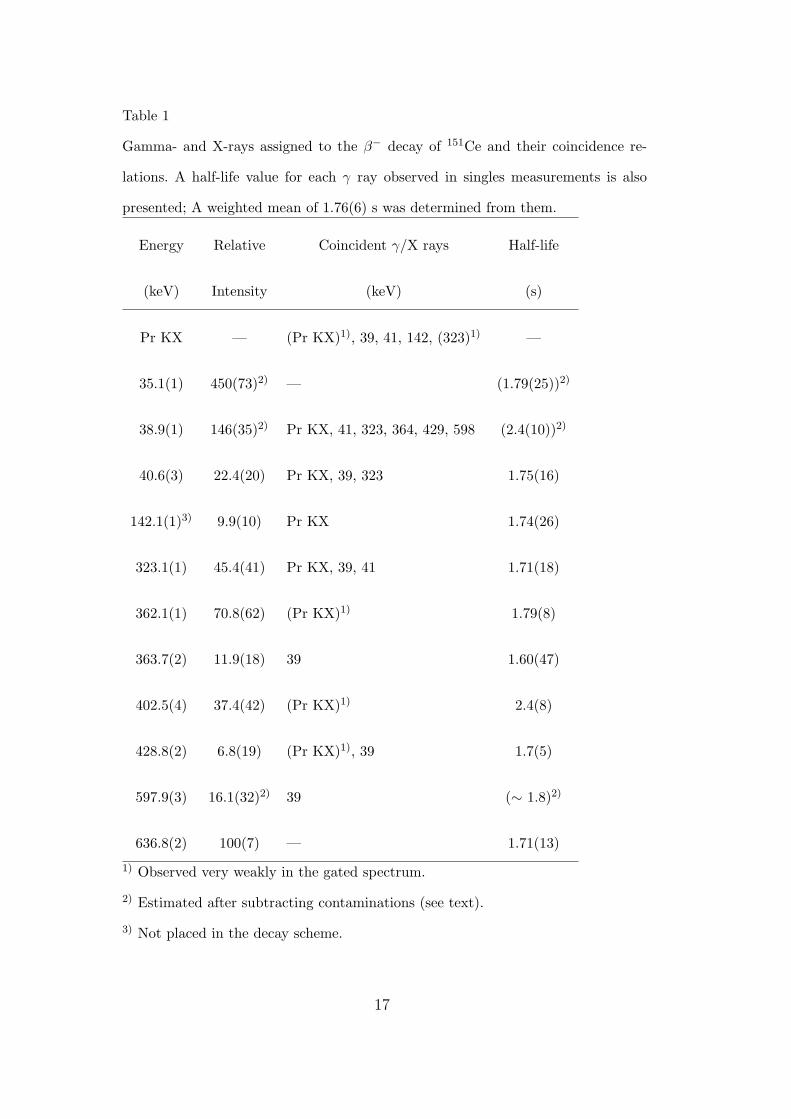
Table 1
Gamma- and X-rays assigned to the β− decay of 151Ce and their coincidence re-
lations. A half-life value for each γ ray observed in singles measurements is also
presented; A weighted mean of 1.76(6) s was determined from them.
Energy Relative Coincident γ/X rays Half-life
(keV) Intensity (keV) (s)
Pr KX — (Pr KX)1), 39, 41, 142, (323)1) —
35.1(1) 450(73)2) — (1.79(25))2)
38.9(1) 146(35)2) Pr KX, 41, 323, 364, 429, 598 (2.4(10))2)
40.6(3) 22.4(20) Pr KX, 39, 323 1.75(16)
142.1(1)3) 9.9(10) Pr KX 1.74(26)
323.1(1) 45.4(41) Pr KX, 39, 41 1.71(18)
362.1(1) 70.8(62) (Pr KX)1) 1.79(8)
363.7(2) 11.9(18) 39 1.60(47)
402.5(4) 37.4(42) (Pr KX)1) 2.4(8)
428.8(2) 6.8(19) (Pr KX)1), 39 1.7(5)
597.9(3) 16.1(32)2) 39 (∼ 1.8)2)
636.8(2) 100(7) — 1.71(13)
1) Observed very weakly in the gated spectrum.
2) Estimated after subtracting contaminations (see text).
3) Not placed in the decay scheme.
17
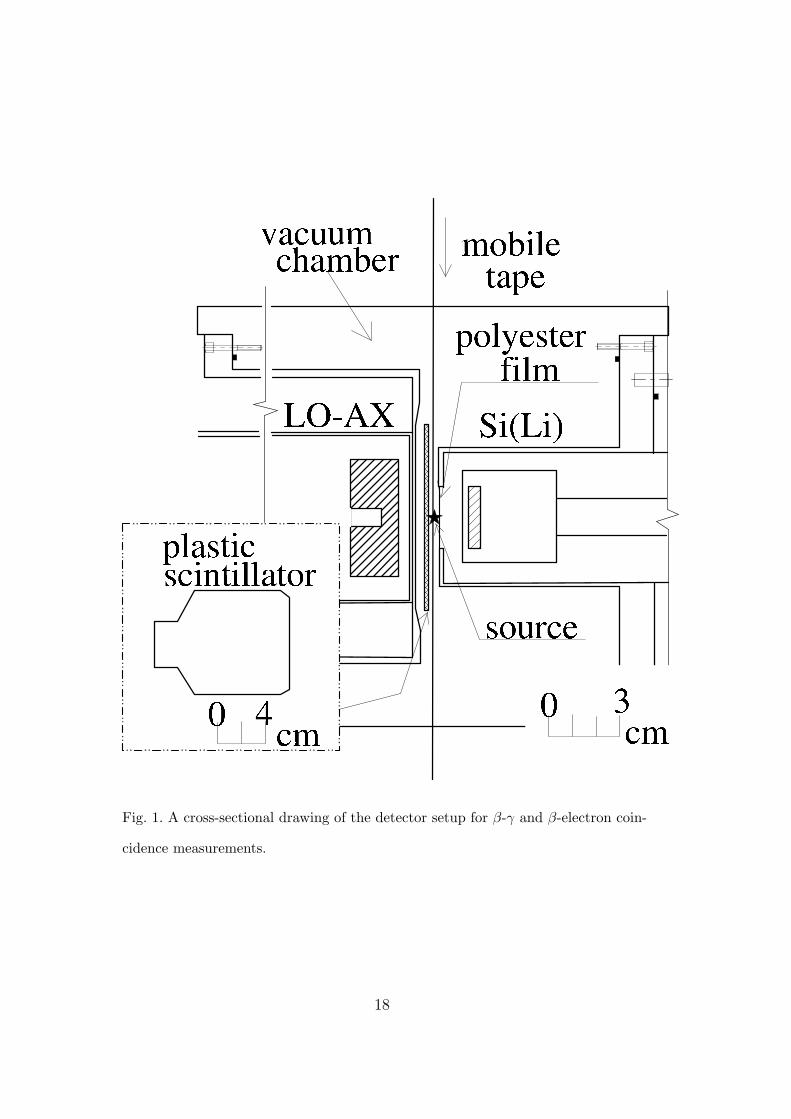
Fig. 1. A cross-sectional drawing of the detector setup for β-γ and β-electron coin-
cidence measurements.
18
0 2000 4000 6000 80000
0.2
0.4
0.6
0.893Sr
93Y
0.82 s 169
keV
I(γ+
ce)=
528(
29)
590
keV
ΣIγ=489(18)
Iγ=1
000Eβ1=
3325 keV
200 250
104
105
Energy / keV
Cou
nts
/ 0.2
5 ke
V
169
213
219
260
singles
β−gated
590 keV γ
169 keV γ
93Rb93Sr93mY93mY + 93Sr
Beta−ray maximum energy / keV
Bet
a−ga
te e
ffici
ency
Fig. 2. Partial γ ray spectra observed in the singles and β-gated mode, and the
β-gate efficiencies. The horizontal axis of the main figure means a β-ray maximum
energy to a level populating a γ ray of interest; For example, Eβ1 shown in a partial
decay scheme of 93Sr and 93mY [1] is the value for the 169-keV transition .
19
0 500 1000
104
106
108 30 40 50104
105
106
1500 20002000 2500 30001000
3000 3500 4000Channel Number (0.2 keV/ch)
Cou
nts
/ Cha
nnel
X−
ray
38.9
, 40.
6
323.
1
362.
136
3.7
402.
5
428.
8
(511
)
597.
9B
G
636.
8
BG
BG
BG B
GB
G
BG
x300
x50
x5
35.1
+
142.
1
Energy / keV
35.1
+
NdK
α38
.9+
Pm
Kα 40.6NdKβ
singlesβ−gated
PrK
α
Fig. 3. Gamma-ray singles spectrum measured with a short-coaxial HPGe detector
for a mass fraction 151+16. Gamma rays associated with the β− decay of 151Ce
are indicated with their energies in keV. Symbols of • and 4 mean γ rays from
the decay of 151Pr and 151Nd, respectively. An inset shows a low-energy part of γ
singles and a β-gated γ spectrum obtained in another experimental run.
20
104
105
0 1 2 3
35 keV doublet
362 keV
x 30
35 keV doublet
x 15 323 keV
Time / s
Cou
nts
637 keV
x 30
(1.79(8) s)
(1.71(13) s)
(1.99(28) s)
105
104
(a)
(b)
35 keV (Ce only) (1.79(25)s)
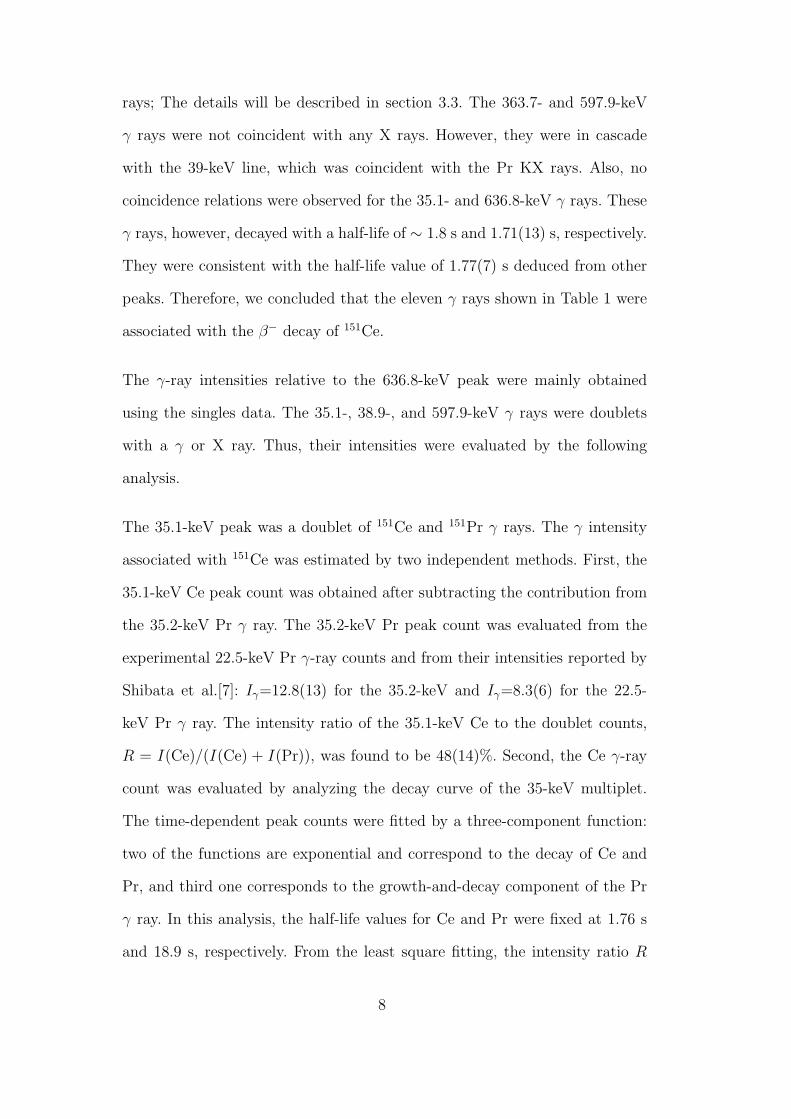
Fig. 4. (a) Decay curves of some γ rays from 151Ce. Closed and open marks mean
data obtained from singles and β-gated measurements, respectively. Curves for the
35-keV γ doublet are fitted by a three-component function while the others by a
single-component exponential one. (b) A decay curve containing only the 35-keV
Ce γ ray (see text).
21
38.9
362.0
402.6
467.7
636.8
0.0
636.
8 (1
00)
597.
9 (1
6.1)
428.
8 (6
.8)
402.
5 (3
7.4)
363.
7 (1
1.9)
40.6
(22
.4)
362.
1 (7
0.8)
323.
1 (4
5.4)
38.9
(14
6)
log ftIβ−
(3/2)−151Pr
(5/2+)151Ce
0.0 1.76(6) s
β−
Qβ−=5270(200)
(≤7) (≥5.9)35.1(7/2+)~4.8 35
.1 (
450)
Fig. 5. A decay scheme of 151Ce. The Qβ value, spins and parities of the ground
states are taken from previous studies [7,9,12].
22