Examples of Manuscript Components and …peer.berkeley.edu/pdf/ASCE 41_update_PEER_Report_02.doc ·...
172
Update to ASCE/SEI 41 Concrete Provisions Kenneth J. Elwood Department of Civil Engineering University of British Columbia Adolfo Matamoros Department of Civil and Environmental Engineering University of Kansas John W. Wallace Department of Civil and Environmental Engineering University of California Los Angeles Dawn Lehman Department of Civil and Environmental Engineering University of Washington Jon Heintz Applied Technology Council Andrew Mitchell Degenkolb Engineers Mark Moore Forell/Elsesser Michael Valley Magnusson Klemencic Associates Laura N. Lowes Department of Civil and Environmental Engineering University of Washington
Transcript of Examples of Manuscript Components and …peer.berkeley.edu/pdf/ASCE 41_update_PEER_Report_02.doc ·...
Update to ASCE/SEI 41 Concrete Provisions
Kenneth J. ElwoodDepartment of Civil EngineeringUniversity of British Columbia
Adolfo MatamorosDepartment of Civil and Environmental Engineering
University of Kansas
John W. WallaceDepartment of Civil and Environmental Engineering
University of CaliforniaLos Angeles
Dawn LehmanDepartment of Civil and Environmental Engineering
University of WashingtonJon Heintz
Applied Technology CouncilAndrew Mitchell
Degenkolb EngineersMark Moore
Forell/ElsesserMichael Valley
Magnusson Klemencic AssociatesLaura N. Lowes
Department of Civil and Environmental EngineeringUniversity of Washington
Craig ComartinCDComartin Inc.Jack P. Moehle
Department of Civil and Environmental EngineeringUniversity of California
Berkeley
ABSTRACT
A proposed supplement to ASCE/SEI 41 Seismic Rehabilitation of Existing
Buildings has been developed for the purpose of updating provisions related to existing
reinforced concrete buildings. Based on experimental evidence and empirical models,
the proposed supplement includes revisions to modeling parameters and acceptance
criteria for reinforced concrete beams, columns, structural walls, beam-column joints, and
slab-column frames. The revisions are expected to result in substantially more accurate
and, in most cases, more liberal assessments of the structural capacity of concrete
components in seismic retrofit projects.
INTRODUCTION
ASCE/SEI 41 (2007) is the latest in a series of documents developed to assist
engineers with the seismic assessment and rehabilitation of existing buildings (FEMA
273, 1997; FEMA 356, 2000). This series of documents provides a performance-based
engineering framework whereby deformation and force demands for different seismic
hazards are compared against deformation and force capacities for various performance
levels. When the predecessor documents were developed there were limited data
available on the performance of existing components, and reliability concepts were not
evenly applied in the development of the criteria. The resulting criteria, especially those
related to deformation capacities, tend to err on the conservative side (EERI/PEER,
2006). Anecdotal reports from practicing engineers suggest that when the criteria have
been applied to older reinforced concrete buildings, most do not pass the collapse
prevention limits set out in ASCE/SEI 41. Improvements to the criteria are needed to
promote more accurate assessments of building vulnerability and thereby reduce
unnecessary rehabilitation costs.
In an effort to utilize new information on the performance of concrete components to
improve ASCE/SEI 41 acceptance criteria, the Chair of the ASCE/SEI Seismic
Rehabilitation Standards Committee appointed an ad hoc committee to develop
recommended revisions to the ASCE/SEI 41 concrete provisions. In its work, the ad-hoc
committee aimed to incorporate the latest information from laboratory experiments on
concrete components and resulting empirical models. The committee also strove to
achieve a level of reliability in the recommended criteria that was consistent with the
intent of the ASCE/SEI 41 standard. The committee focused its attention on those criteria
that it deemed were most important to the outcome of building assessments made using
ASCE/SEI 41 and for which new data were available, avoiding other topics that would
have less impact on outcomes and lacked new experimental evidence. Proposed updates
include: effective stiffness models for beams, columns, and beam-column joints;
acceptance criteria and modeling parameters for columns, slab-column connections, and
walls; strength models for lap splices; criteria for post-tensioned slabs; and relaxed
confinement requirements for shear walls.
When the 2007 edition of ASCE/SEI 41 was published, the provisions for concrete
structures were essentially the same as those for its predecessor document FEMA 356.
When ASCE/SEI 41 adopts the recommendations summarized in this paper, also
scheduled for 2007, the resulting document will be known as ASCE/SEI 41 Supplement
1. To avoid confusion between ASCE/SEI 41 and its supplement in future readings, this
paper will refer to the existing provisions as FEMA 356. Proposed new provisions will be
referred to as “proposed” for ASCE/SEI 41 Supplement 1, or simply “proposed.”
PROPOSED MODIFICATIONS TO STIFFNESS MODELS
Effective stiffnesses should enable the engineer to estimate the building period and
the internal distribution of forces with sufficient accuracy. Elwood and Eberhard (2006)
demonstrated that FEMA 356 can significantly overestimate the stiffness for columns
with low axial loads. A major source of the discrepancy was that FEMA 356 did not
adequately account for flexibility resulting from slip of the longitudinal reinforcement
from adjacent beam-column joints or foundation elements.
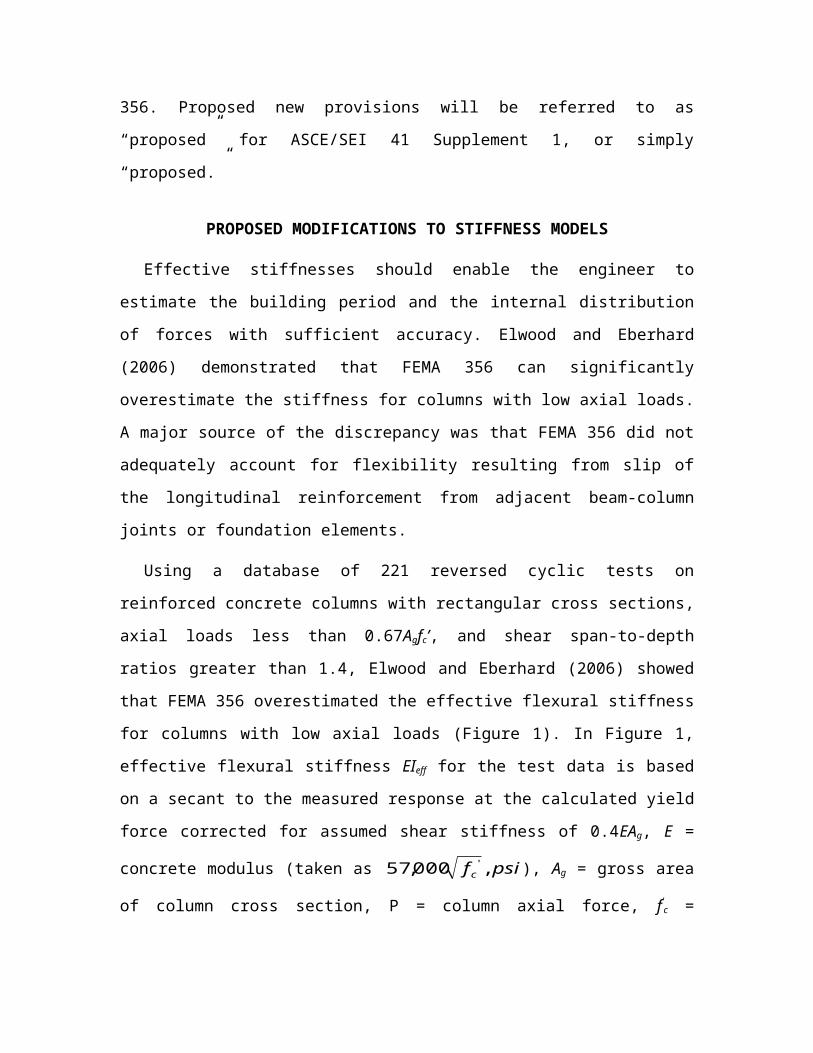
Using a database of 221 reversed cyclic tests on reinforced concrete columns with
rectangular cross sections, axial loads less than 0.67Agfc’, and shear span-to-depth ratios
greater than 1.4, Elwood and Eberhard (2006) showed that FEMA 356 overestimated the
effective flexural stiffness for columns with low axial loads (Figure 1). In Figure 1,
effective flexural stiffness EIeff for the test data is based on a secant to the measured
response at the calculated yield force corrected for assumed shear stiffness of 0.4EAg, E =
concrete modulus (taken as psif c ,000,57 ' ), Ag = gross area of column cross section, P =
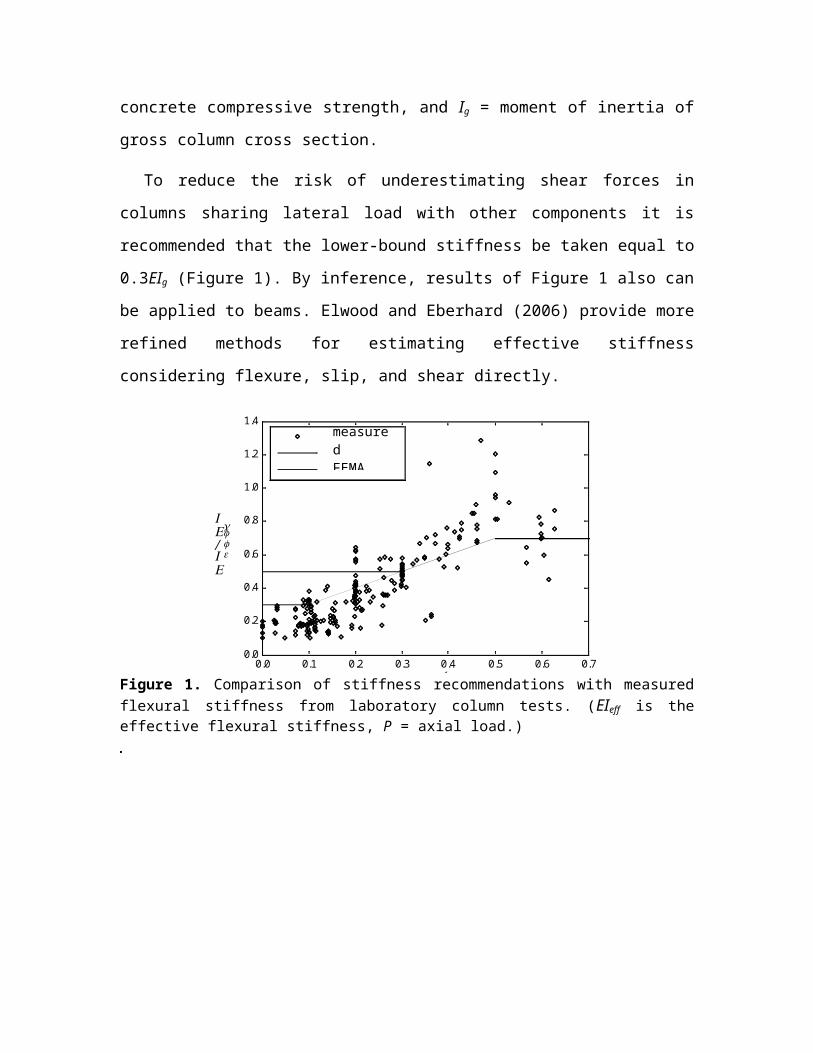
column axial force, f’c = concrete compressive strength, and Ig = moment of inertia of
gross column cross section.
To reduce the risk of underestimating shear forces in columns sharing lateral load
with other components it is recommended that the lower-bound stiffness be taken equal
to 0.3EIg (Figure 1). By inference, results of Figure 1 also can be applied to beams.
Elwood and Eberhard (2006) provide more refined methods for estimating effective
stiffness considering flexure, slip, and shear directly.
0.0 0.1 0.2 0.3 0.4 0.5 0.6 0.70.0
0.2
0.4
0.6
0.8
1.0
1.2
1.4
P/Agfc′
EI eff
/EI g
Figure 1. Comparison of stiffness recommendations with measured flexural stiffness from laboratory column tests. (EIeff is the effective flexural stiffness, P = axial load.)
Figure 2. Rigid end zones for beam-column joint modeling. (∑ ∑ nbnc MM , = sums of the nominal flexural strengths of the columns and beams, respectively, at the face of the joints.)
FEMA 356 further overestimates the stiffness of reinforced concrete moment frames
by recommending that beam-column joints “be represented as a stiff or rigid zone”.
Tests demonstrate that beam-column joints can experience significant shear deformations
even prior to yielding of the longitudinal reinforcement within the joint (Walker et al.,
2007). Effects of these shear deformations can be approximated by extending the beam
or column flexibility into the joint in the analytical model (Figure 2). (Effects of
reinforcement slip from joints are accounted for in the reduced effective flexural stiffness
described in the preceding paragraph.) This modeling technique was selected due to its
simplicity, ease of implementation in current structural analysis software, and acceptable
simulation of the test data. Test results (Walker et al. 2007; Leon, 1990; Beres et al.,
1992) show that the stiffness of the joint depends on the relative flexural strengths of the
beams and columns. As shown in Figure 2a, if the sum of nominal column flexural
measuredFEMA 356proposed
strengths (Mnc) is greater than 1.2 times the sum of nominal beam flexural strengths
(Mnb), the recommended model considers the beam flexibility to extend to the joint
centerline (for normal joint dimensions) with the column modeled as rigid within the
joint. If the column-to-beam strength ratio is less than 0.8, the recommended model has
rigid beam end zones with the column flexibility extending to the joint centerline (Figure
2b). Between these limits, half of the end zones of both beam and column elements are
modeled as rigid within the joint extents (Figure 2c).
0
20
40
60
80
100
120
140
0.0 0.5 1.0 1.5 2.0 2.5 3.0 3.5 4.0Drift (%)
Col
umn
Shea
r (ki
ps)
PEER-0850 PEER-1450PEER-2250 PEER-4150proposed FEMA 356
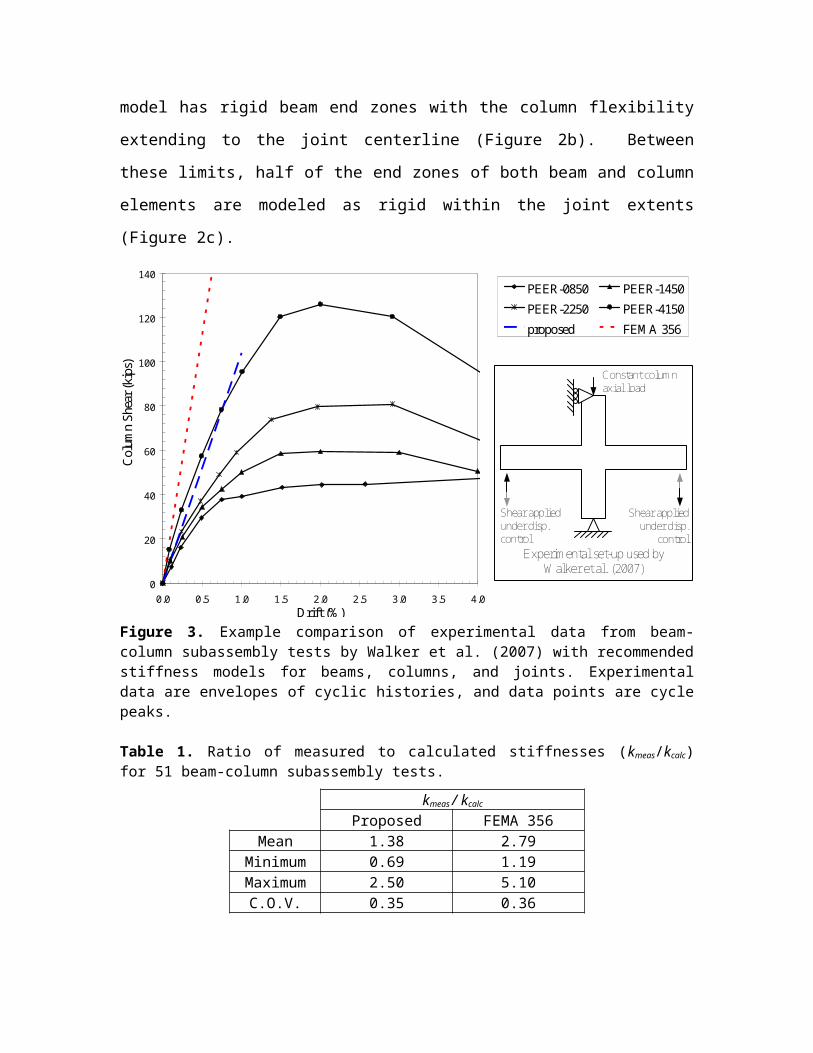
Figure 3. Example comparison of experimental data from beam-column subassembly tests by Walker et al. (2007) with recommended stiffness models for beams, columns, and joints. Experimental data are envelopes of cyclic histories, and data points are cycle peaks.
Table 1. Ratio of measured to calculated stiffnesses (kmeas/kcalc) for 51 beam-column subassembly tests.
kmeas / kcalc
Proposed FEMA 356Mean 1.38 2.79
Minimum 0.69 1.19Maximum 2.50 5.10
C.O.V. 0.35 0.36
Figure 3 illustrates effective stiffnesses calculated using the FEMA 356 models and
using the models recommended here, alongside test data reported by Walker et al. (2007).
Shear appliedunder disp.control
Shear appliedunder disp.
control
Constant columnaxial load
Experimental set-up used byWalker et al. (2007)
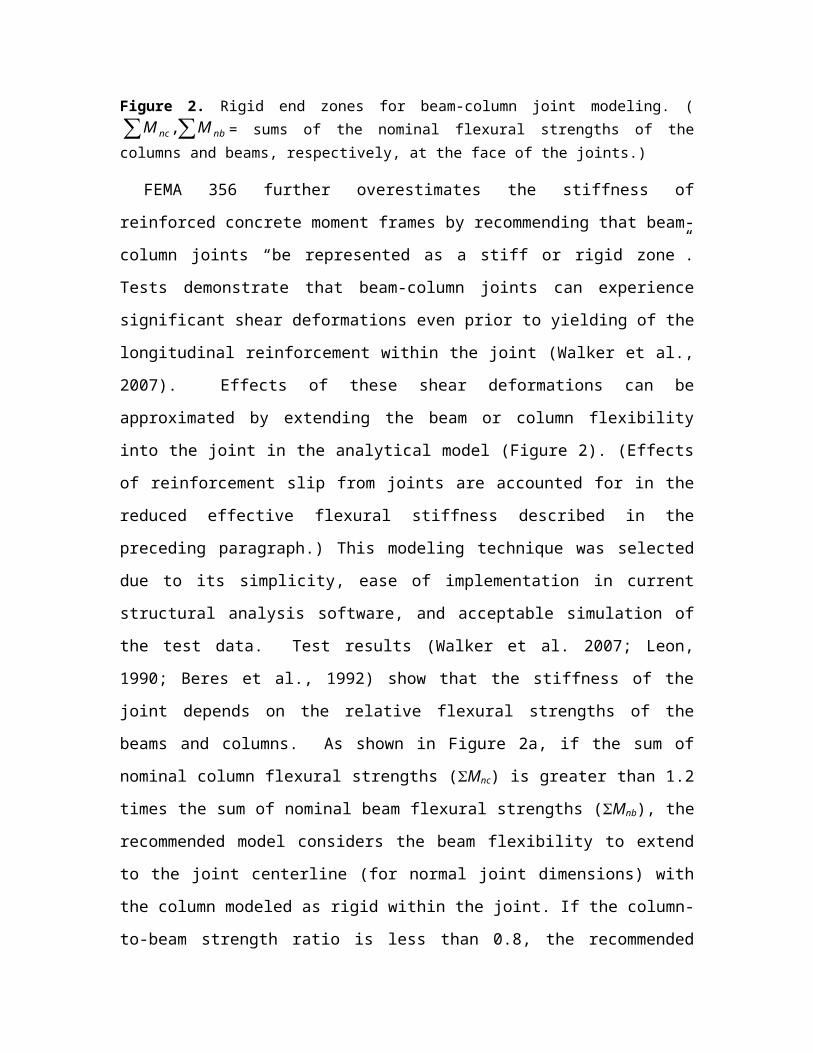
Table 1 compares the measured and calculated stiffnesses for 51 of the 57 beam-column
subassemblies from 13 test programs reported by Mitra and Lowes (2007); six tests by
Higashi and Owada (1969) were excluded because complete load-deformation histories
were not available for these tests. Measured stiffness was defined as the secant stiffness
to the load on the experimental load-deformation history corresponding to first yield of
beam longitudinal reinforcement. This yield load was determined by moment-curvature
analysis of the beams. For specimens that did not develop the yield load, the measured
stiffness was defined as the secant stiffness to the point of maximum strength. The results
indicate that the recommended stiffness models provide a much closer estimate of the
mean measured stiffness than do the FEMA 356 models. Both models, though, show
considerable dispersion.
PROPOSED REVISIONS TO DEVELOPMENT AND LAP-SPLICE
PROVISIONS
Older reinforced concrete components commonly have lap-spliced reinforcement or
developed straight or hooked bars that do not satisfy the development length
requirements in ACI 318-05. In such cases, the reinforcement may not be able to achieve
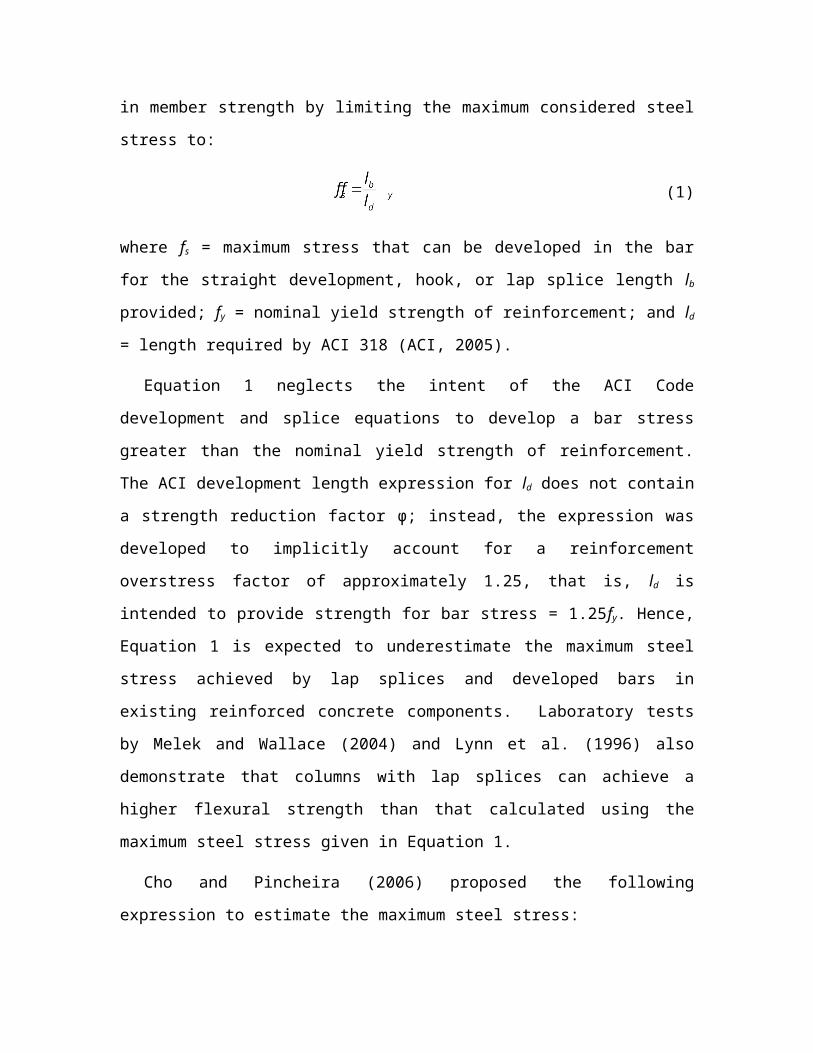
the full yield stress, thereby limiting the strength of the member. FEMA 356 accounts for
this reduction in member strength by limiting the maximum considered steel stress to:
(1)
where fs = maximum stress that can be developed in the bar for the straight development,
hook, or lap splice length lb provided; fy = nominal yield strength of reinforcement; and ld
= length required by ACI 318 (ACI, 2005).
Equation 1 neglects the intent of the ACI Code development and splice equations to
develop a bar stress greater than the nominal yield strength of reinforcement. The ACI
development length expression for ld does not contain a strength reduction factor φ;
instead, the expression was developed to implicitly account for a reinforcement overstress
factor of approximately 1.25, that is, ld is intended to provide strength for bar stress =
1.25fy. Hence, Equation 1 is expected to underestimate the maximum steel stress achieved
by lap splices and developed bars in existing reinforced concrete components.
Laboratory tests by Melek and Wallace (2004) and Lynn et al. (1996) also demonstrate
that columns with lap splices can achieve a higher flexural strength than that calculated
using the maximum steel stress given in Equation 1.
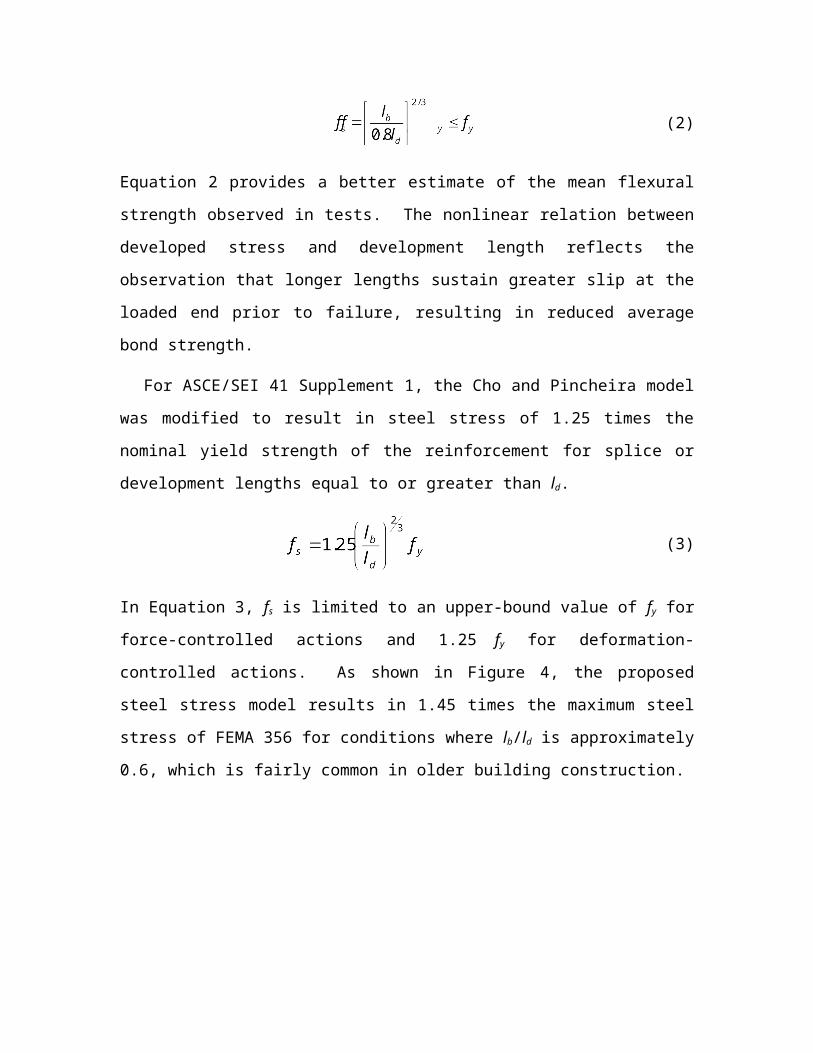
Cho and Pincheira (2006) proposed the following expression to estimate the
maximum steel stress:
(2)
Equation 2 provides a better estimate of the mean flexural strength observed in tests. The
nonlinear relation between developed stress and development length reflects the
observation that longer lengths sustain greater slip at the loaded end prior to failure,
resulting in reduced average bond strength.
For ASCE/SEI 41 Supplement 1, the Cho and Pincheira model was modified to result
in steel stress of 1.25 times the nominal yield strength of the reinforcement for splice or
development lengths equal to or greater than ld.
(3)
In Equation 3, fs is limited to an upper-bound value of fy for force-controlled actions and
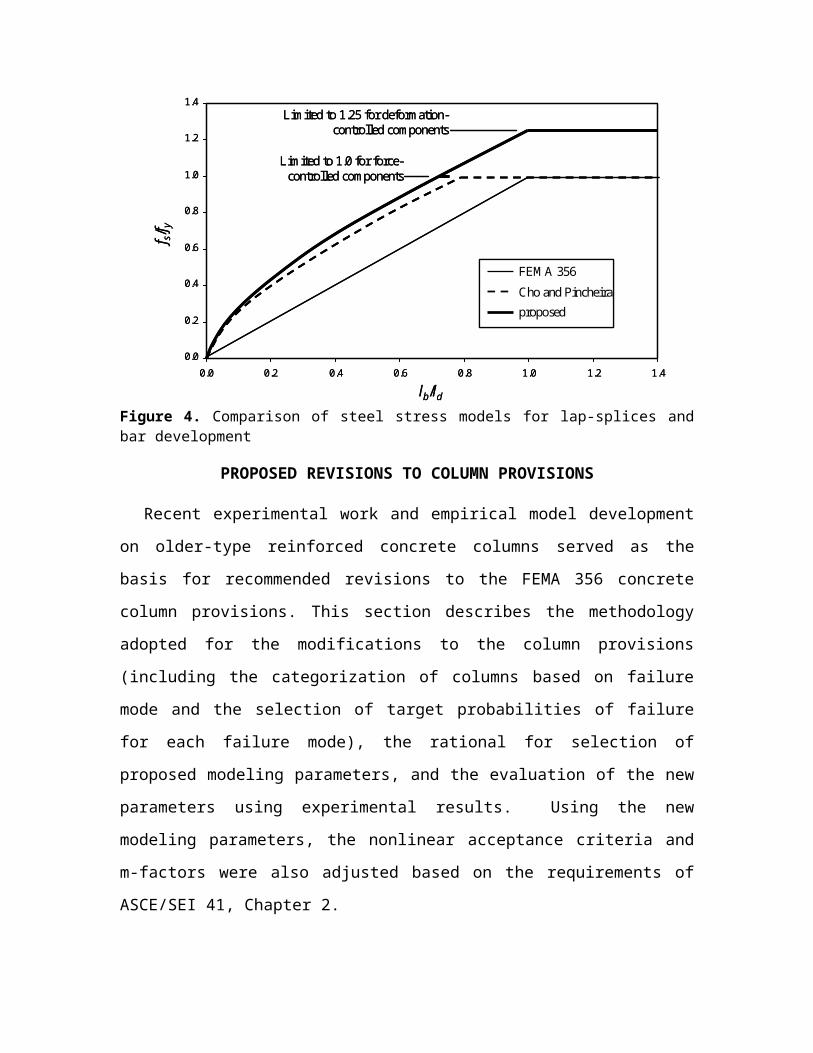
1.25 fy for deformation-controlled actions. As shown in Figure 4, the proposed steel
stress model results in 1.45 times the maximum steel stress of FEMA 356 for conditions
where lb/ld is approximately 0.6, which is fairly common in older building construction.
0.0
0.2
0.4
0.6
0.8
1.0
1.2
1.4
0.0 0.2 0.4 0.6 0.8 1.0 1.2 1.4
FEMA 356
Cho and Pincheiraproposed
Limited to 1.25 for deformation-controlled components
Limited to 1.0 for force-controlled components
lb/ld
f s/f y
0.0
0.2
0.4
0.6
0.8
1.0
1.2
1.4
0.0 0.2 0.4 0.6 0.8 1.0 1.2 1.4
FEMA 356
Cho and Pincheiraproposed
Limited to 1.25 for deformation-controlled components
Limited to 1.0 for force-controlled components
lb/ld
f s/f y
Figure 4. Comparison of steel stress models for lap-splices and bar development
PROPOSED REVISIONS TO COLUMN PROVISIONS
Recent experimental work and empirical model development on older-type reinforced
concrete columns served as the basis for recommended revisions to the FEMA 356
concrete column provisions. This section describes the methodology adopted for the
modifications to the column provisions (including the categorization of columns based on
failure mode and the selection of target probabilities of failure for each failure mode), the
rational for selection of proposed modeling parameters, and the evaluation of the new
parameters using experimental results. Using the new modeling parameters, the
nonlinear acceptance criteria and m-factors were also adjusted based on the requirements
of ASCE/SEI 41, Chapter 2.
FEMA 356, Table 6-8, classifies modeling parameters for reinforced concrete
columns according to whether they are “controlled by flexure,” “controlled by inadequate
development or splicing,” or subjected to high axial loads. Columns “controlled by
shear” had zero permissible plastic deformation and were evaluated using lower-bound
material strengths. A column is further categorized as “Conforming” or “Non-
conforming” according to the following definition:
A component is conforming if, within the flexural plastic hinge region, hoops are spaced at d/3, and if, for components of moderate
and high ductility demand, the strength provided by the hoops (V s) is at least three-fourths of the design shear. Otherwise, the component is considered nonconforming.
Since the development of FEMA 356, several experimental research programs (e.g.,
Sezen and Moehle, 2006; Yoshimura et al., 2004; Ousalem et al., 2004) have
demonstrated that many older-type columns are capable of sustaining limited plastic
deformation due to flexural yielding prior to shear failure (flexure-shear failure mode).
Furthermore, if subjected to low axial loads, such columns may be capable of sustaining
axial loads well beyond the point of apparent shear failure. Proposed revisions for
ASCE/SEI 41 Supplement 1 reflect these observations.
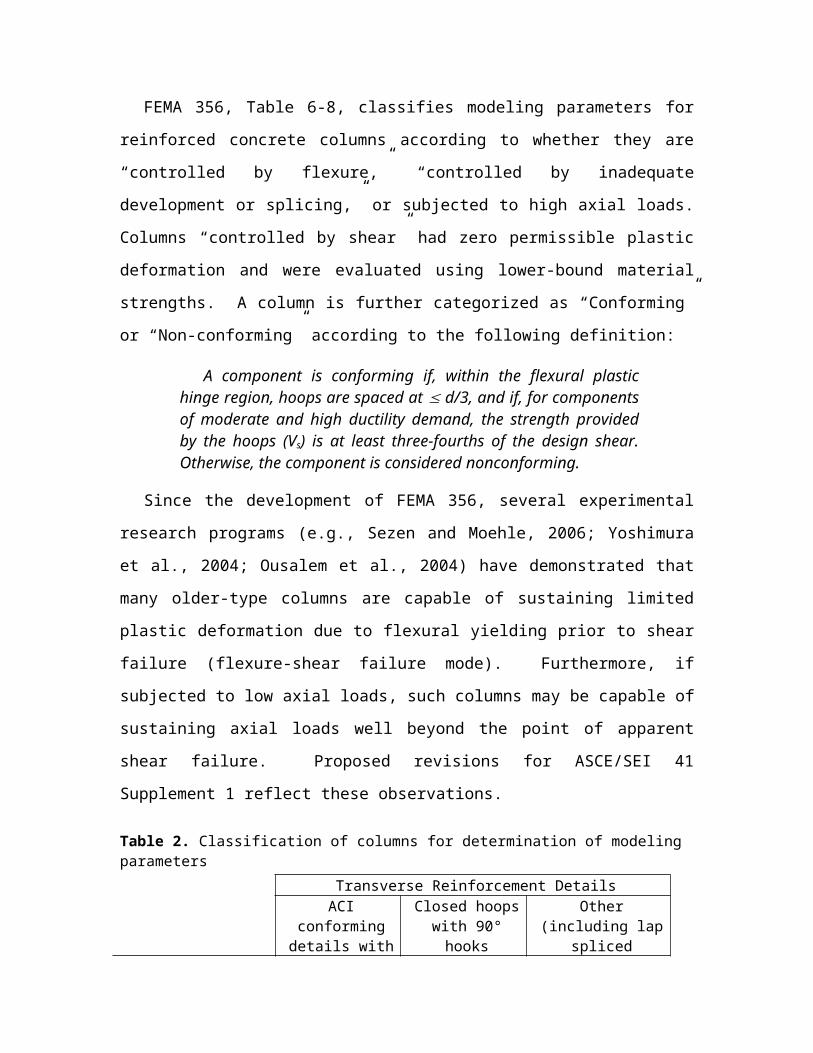
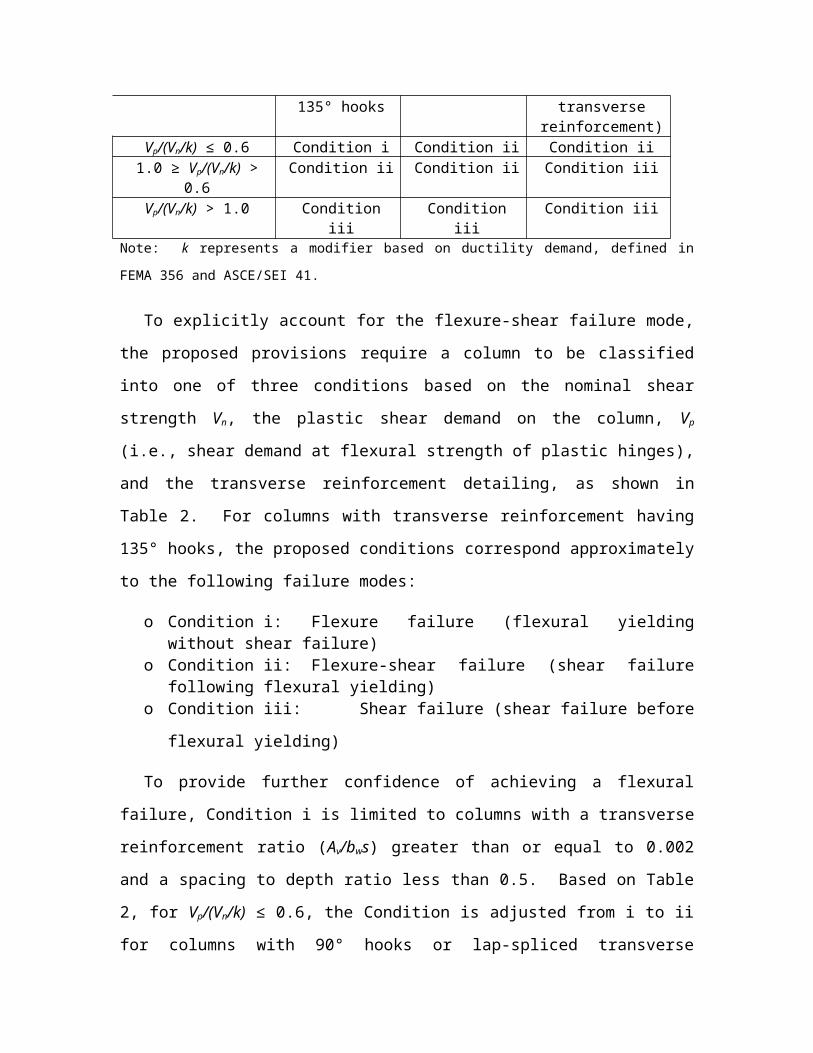
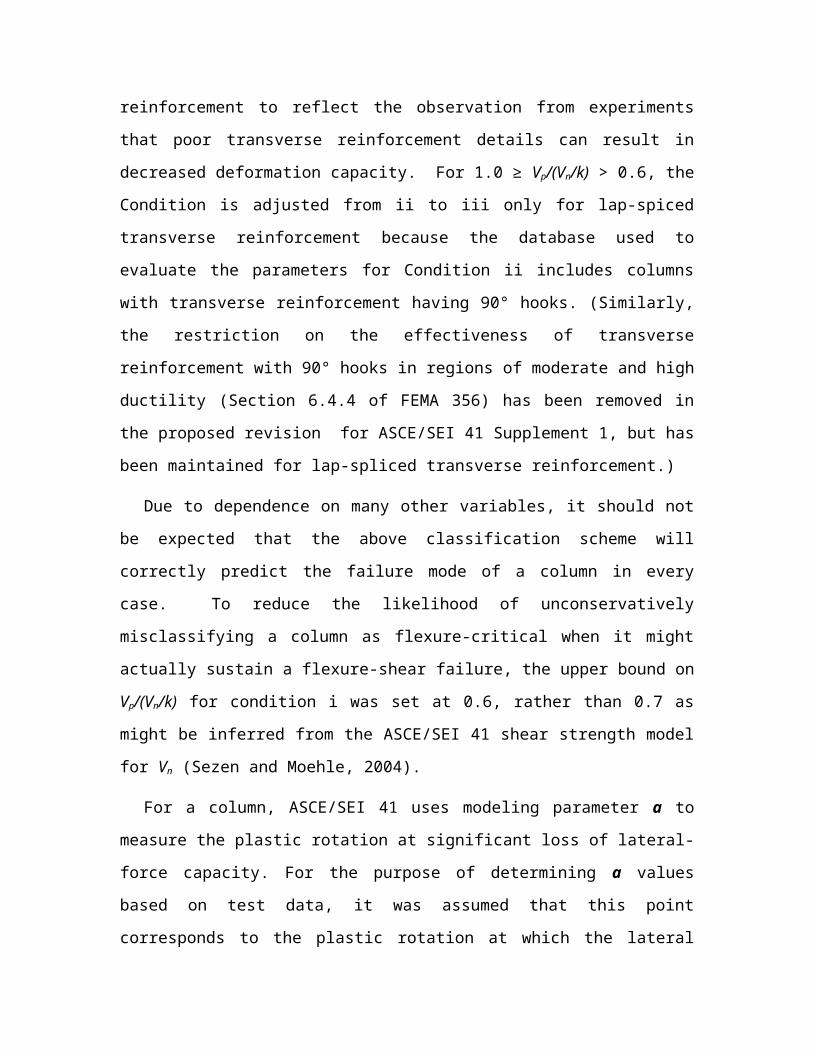
Table 2. Classification of columns for determination of modeling parametersTransverse Reinforcement Details
ACI conforming details with 135°
hooks
Closed hoops with 90° hooks
Other (including lap spliced transverse
reinforcement)Vp/(Vn/k) ≤ 0.6 Condition i Condition ii Condition ii
1.0 ≥ Vp/(Vn/k) > 0.6 Condition ii Condition ii Condition iiiVp/(Vn/k) > 1.0 Condition iii Condition iii Condition iii
Note: k represents a modifier based on ductility demand, defined in FEMA 356 and ASCE/SEI 41.
To explicitly account for the flexure-shear failure mode, the proposed provisions
require a column to be classified into one of three conditions based on the nominal shear
strength Vn, the plastic shear demand on the column, Vp (i.e., shear demand at flexural
strength of plastic hinges), and the transverse reinforcement detailing, as shown in Table
2. For columns with transverse reinforcement having 135° hooks, the proposed
conditions correspond approximately to the following failure modes:
o Condition i: Flexure failure (flexural yielding without shear failure)o Condition ii: Flexure-shear failure (shear failure following flexural yielding)o Condition iii: Shear failure (shear failure before flexural yielding)
To provide further confidence of achieving a flexural failure, Condition i is limited to
columns with a transverse reinforcement ratio (Av/bws) greater than or equal to 0.002 and
a spacing to depth ratio less than 0.5. Based on Table 2, for Vp/(Vn/k) ≤ 0.6, the Condition
is adjusted from i to ii for columns with 90° hooks or lap-spliced transverse
reinforcement to reflect the observation from experiments that poor transverse
reinforcement details can result in decreased deformation capacity. For 1.0 ≥ Vp/(Vn/k) >
0.6, the Condition is adjusted from ii to iii only for lap-spiced transverse reinforcement
because the database used to evaluate the parameters for Condition ii includes columns
with transverse reinforcement having 90° hooks. (Similarly, the restriction on the
effectiveness of transverse reinforcement with 90° hooks in regions of moderate and high
ductility (Section 6.4.4 of FEMA 356) has been removed in the proposed revision for
ASCE/SEI 41 Supplement 1, but has been maintained for lap-spliced transverse
reinforcement.)
Due to dependence on many other variables, it should not be expected that the above
classification scheme will correctly predict the failure mode of a column in every case.
To reduce the likelihood of unconservatively misclassifying a column as flexure-critical
when it might actually sustain a flexure-shear failure, the upper bound on Vp/(Vn/k) for
condition i was set at 0.6, rather than 0.7 as might be inferred from the ASCE/SEI 41
shear strength model for Vn (Sezen and Moehle, 2004).
For a column, ASCE/SEI 41 uses modeling parameter a to measure the plastic
rotation at significant loss of lateral-force capacity. For the purpose of determining a
values based on test data, it was assumed that this point corresponds to the plastic rotation
at which the lateral resistance has degraded to 80% of the measured peak shear force. For
columns expected to experience flexural failures (Condition i), such loss of lateral load
resistance can be caused by concrete crushing, bar buckling, and other flexural damage
mechanisms. For columns expected to experience shear failures, either after or before
flexural yielding (Conditions ii or iii, respectively), loss of lateral force resistance
commonly is associated with severe diagonal cracking or shear-compression failure
indicative of shear failure. Consistent with Chapter 2 of ASCE/SEI 41, modeling
parameter b measures the plastic rotation at axial-load failure.
Section 2.8 of ASCE/SEI 41 and FEMA 356 specifies that average deformation
capacities be used to define modeling parameters for undefined systems and components,
but it does not clearly state that average deformations were typically used in the
derivation of modeling parameters that are presented in the material chapters (such as
Table 6-8 for reinforced concrete columns). In fact, many of the tables for concrete
components in FEMA 356 provide deformation limits that are well below the average
deformation capacities observed in laboratory tests (EERI/PEER, 2006).
While mean or median estimates of the modeling parameters are generally desirable
to achieve the best estimate of the expected performance of a structure, it was considered
inappropriate to use mean or median estimates of the deformation capacities in the
revisions of Table 6-8 because, as will be illustrated later, considerable scatter exists in
results from concrete columns tested to lateral and axial-load failure. Instead, target
probabilities of failure were established based on judgment regarding the consequence of
each failure mode. (As a reference, a median estimate of the modeling parameter would
result in a probability of failure of 50%). Due to the potential catastrophic consequences
of axial-load failure, all b parameters (regardless of lateral-load failure mode) were
selected to achieve a probability of failure less than 15%. Due to the degradation of axial
capacity with the development of a shear-failure plane, the a values for columns that are
expected to fail in flexure-shear or shear (Conditions ii and iii, respectively) also were
selected to achieve a probability of failure less than 15%. Because columns experiencing
flexural failures are more likely to be able to maintain axial loads beyond initial loss of
lateral strength, the target probability of failure was relaxed for flexure-controlled
columns (Condition i), with a values selected to achieve a probability of failure less than
35%. Note that the target probabilities of failure given above do not consider the
uncertainty in the ground motion or in structural analysis. On the other hand, given the
low probability of exceedance for commonly selected design ground motions, the true
probability of failure over the life of an existing building is anticipated to be significantly
lower.
An iterative process was required to satisfy the target probabilities selected above.
Modeling parameters were initially selected based on existing drift capacity models for
concrete columns and the resulting probabilities of failure were assessed using a database
of laboratory tests; then, if necessary, the modeling parameters were updated to achieve a
closer agreement with the selected failure probabilities. The final selection of modelling
parameters and the assessment of the implied probabilities of failure based on test results
are presented in Figures 5 through 9.
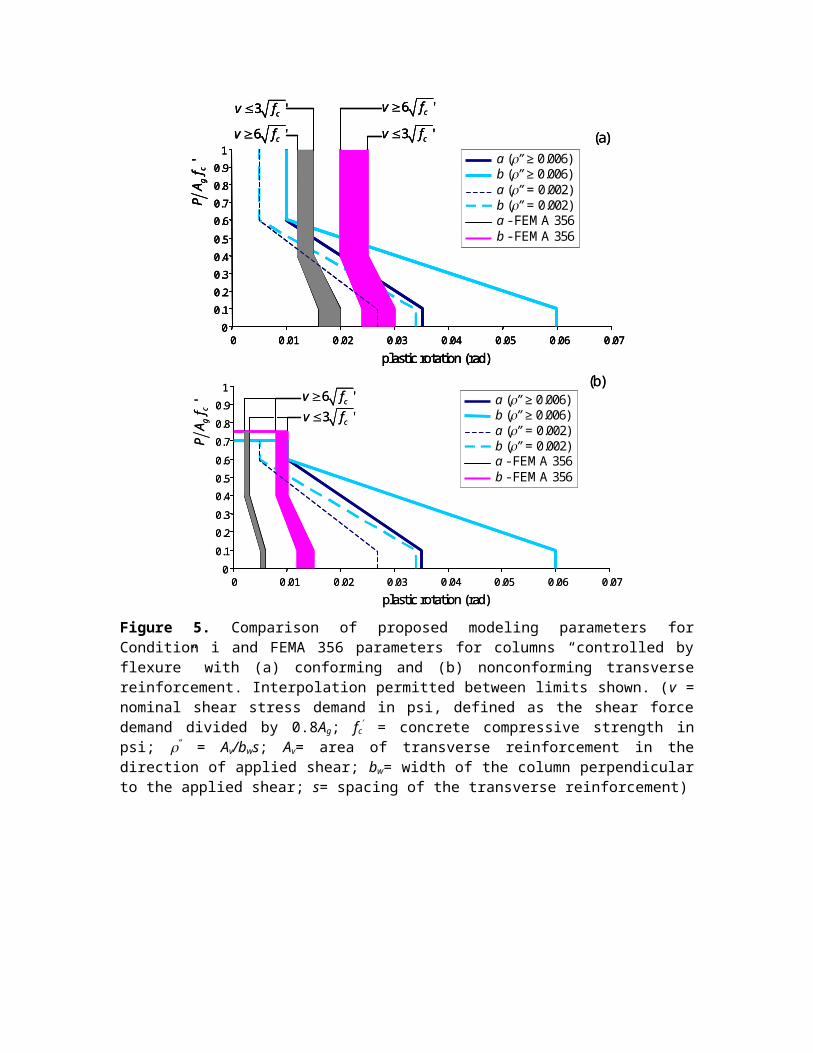
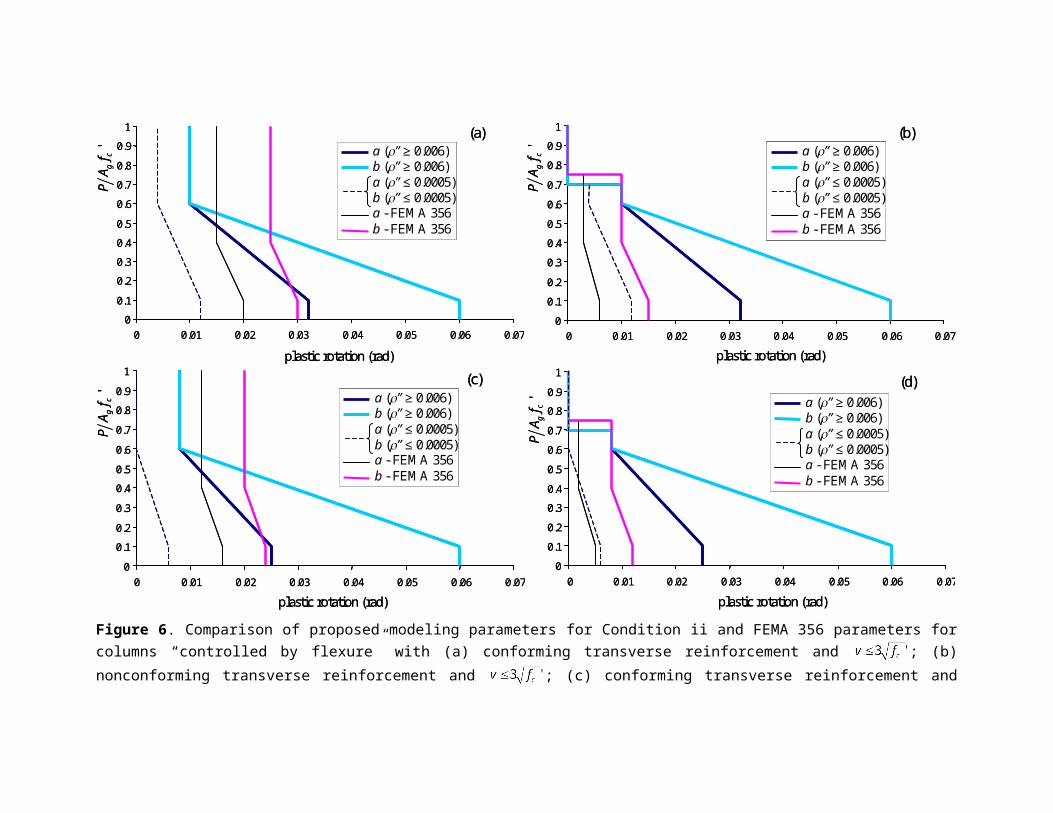
Figures 5 and 6 compare proposed modeling parameters a and b for Conditions i and
ii with those from FEMA 356 for columns “controlled by flexure.” The proposed
modeling parameters are considerably more liberal for columns with low axial loads and
conforming transverse reinforcement, and more restrictive for many columns with high
axial loads. Note that many columns classified as Condition ii, likely would have been
considered to be “controlled by shear” when applying the FEMA 356 provisions, and
hence the proposed parameters are relatively more liberal than suggested by the
comparisons in Figure 6.
0
0.1
0.2
0.3
0.4
0.5
0.6
0.7
0.8
0.9
1
0 0.01 0.02 0.03 0.04 0.05 0.06 0.07
plastic rotation (rad)
a (” ≥ 0.006)b (” ≥ 0.006)a (” = 0.002)b (” = 0.002)a - FEMA 356b - FEMA 356
'g
cP
Af
3 'cv f
6 'cv f3 'cv f
6 'cv f (a)
0
0.1
0.2
0.3
0.4
0.5
0.6
0.7
0.8
0.9
1
0 0.01 0.02 0.03 0.04 0.05 0.06 0.07
plastic rotation (rad)
a (” ≥ 0.006)b (” ≥ 0.006)a (” = 0.002)b (” = 0.002)a - FEMA 356b - FEMA 356
'g
cP
Af
3 'cv f
6 'cv f3 'cv f
6 'cv f
0
0.1
0.2
0.3
0.4
0.5
0.6
0.7
0.8
0.9
1
0 0.01 0.02 0.03 0.04 0.05 0.06 0.07
plastic rotation (rad)
a (” ≥ 0.006)b (” ≥ 0.006)a (” = 0.002)b (” = 0.002)a - FEMA 356b - FEMA 356
'g
cP
Af
3 'cv f
6 'cv f3 'cv f
6 'cv f (a)
0
0.1
0.2
0.3
0.4
0.5
0.6
0.7
0.8
0.9
1
0 0.01 0.02 0.03 0.04 0.05 0.06 0.07
plastic rotation (rad)
a (” ≥ 0.006)b (” ≥ 0.006)a (” = 0.002)b (” = 0.002)a - FEMA 356b - FEMA 356
'g
cP
Af 3 'cv f
6 'cv f(b)
0
0.1
0.2
0.3
0.4
0.5
0.6
0.7
0.8
0.9
1
0 0.01 0.02 0.03 0.04 0.05 0.06 0.07
plastic rotation (rad)
a (” ≥ 0.006)b (” ≥ 0.006)a (” = 0.002)b (” = 0.002)a - FEMA 356b - FEMA 356
a (” ≥ 0.006)b (” ≥ 0.006)a (” = 0.002)b (” = 0.002)a - FEMA 356b - FEMA 356
'g
cP
Af 3 'cv f
6 'cv f(b)
Figure 5. Comparison of proposed modeling parameters for Condition i and FEMA 356 parameters for columns “controlled by flexure” with (a) conforming and (b) nonconforming transverse reinforcement. Interpolation permitted between limits shown. (v = nominal shear stress demand in psi, defined as the shear force demand divided by 0.8Ag; fc
′ = concrete compressive strength in psi; ” = Av/bws; Av= area of transverse reinforcement in the direction of applied shear; bw= width of the column perpendicular to the applied shear; s= spacing of the transverse reinforcement)
0
0.1
0.2
0.3
0.4
0.5
0.6
0.7
0.8
0.9
1
0 0.01 0.02 0.03 0.04 0.05 0.06 0.07
plastic rotation (rad)
'g
cP
Af a (” ≥ 0.006)
b (” ≥ 0.006)a (” ≤ 0.0005)b (” ≤ 0.0005)a - FEMA 356b - FEMA 356
(a)
0
0.1
0.2
0.3
0.4
0.5
0.6
0.7
0.8
0.9
1
0 0.01 0.02 0.03 0.04 0.05 0.06 0.07
plastic rotation (rad)
'g
cP
Af a (” ≥ 0.006)
b (” ≥ 0.006)a (” ≤ 0.0005)b (” ≤ 0.0005)a - FEMA 356b - FEMA 356
a (” ≥ 0.006)b (” ≥ 0.006)a (” ≤ 0.0005)b (” ≤ 0.0005)a - FEMA 356b - FEMA 356
(a) (b)
0
0.1
0.2
0.3
0.4
0.5
0.6
0.7
0.8
0.9
1
0 0.01 0.02 0.03 0.04 0.05 0.06 0.07
plastic rotation (rad)
a (” ≥ 0.006)b (” ≥ 0.006)a (” ≤ 0.0005)b (” ≤ 0.0005)a - FEMA 356b - FEMA 356
'g
cP
Af
(b)
0
0.1
0.2
0.3
0.4
0.5
0.6
0.7
0.8
0.9
1
0 0.01 0.02 0.03 0.04 0.05 0.06 0.07
plastic rotation (rad)
a (” ≥ 0.006)b (” ≥ 0.006)a (” ≤ 0.0005)b (” ≤ 0.0005)a - FEMA 356b - FEMA 356
a (” ≥ 0.006)b (” ≥ 0.006)a (” ≤ 0.0005)b (” ≤ 0.0005)a - FEMA 356b - FEMA 356
'g
cP
Af
0
0.1
0.2
0.3
0.4
0.5
0.6
0.7
0.8
0.9
1
0 0.01 0.02 0.03 0.04 0.05 0.06 0.07
plastic rotation (rad)
(c)
'g
cP
Af a (” ≥ 0.006)
b (” ≥ 0.006)a (” ≤ 0.0005)b (” ≤ 0.0005)a - FEMA 356b - FEMA 356
0
0.1
0.2
0.3
0.4
0.5
0.6
0.7
0.8
0.9
1
0 0.01 0.02 0.03 0.04 0.05 0.06 0.07
plastic rotation (rad)
(c)
'g
cP
Af a (” ≥ 0.006)
b (” ≥ 0.006)a (” ≤ 0.0005)b (” ≤ 0.0005)a - FEMA 356b - FEMA 356
a (” ≥ 0.006)b (” ≥ 0.006)a (” ≤ 0.0005)b (” ≤ 0.0005)a - FEMA 356b - FEMA 356
plastic rotation (rad)
0
0.1
0.2
0.3
0.4
0.5
0.6
0.7
0.8
0.9
1
0 0.01 0.02 0.03 0.04 0.05 0.06 0.07
'g
cP
Af
(d)a (” ≥ 0.006)b (” ≥ 0.006)a (” ≤ 0.0005)b (” ≤ 0.0005)a - FEMA 356b - FEMA 356
plastic rotation (rad)
0
0.1
0.2
0.3
0.4
0.5
0.6
0.7
0.8
0.9
1
0 0.01 0.02 0.03 0.04 0.05 0.06 0.07
'g
cP
Af
(d)a (” ≥ 0.006)b (” ≥ 0.006)a (” ≤ 0.0005)b (” ≤ 0.0005)a - FEMA 356b - FEMA 356
a (” ≥ 0.006)b (” ≥ 0.006)a (” ≤ 0.0005)b (” ≤ 0.0005)a - FEMA 356b - FEMA 356
Figure 6. Comparison of proposed modeling parameters for Condition ii and FEMA 356 parameters for columns “controlled by flexure” with (a) conforming transverse reinforcement and ; (b) nonconforming transverse reinforcement and ; (c) conforming transverse
reinforcement and ; and (d) nonconforming transverse reinforcement and . Interpolation permitted between limits shown.
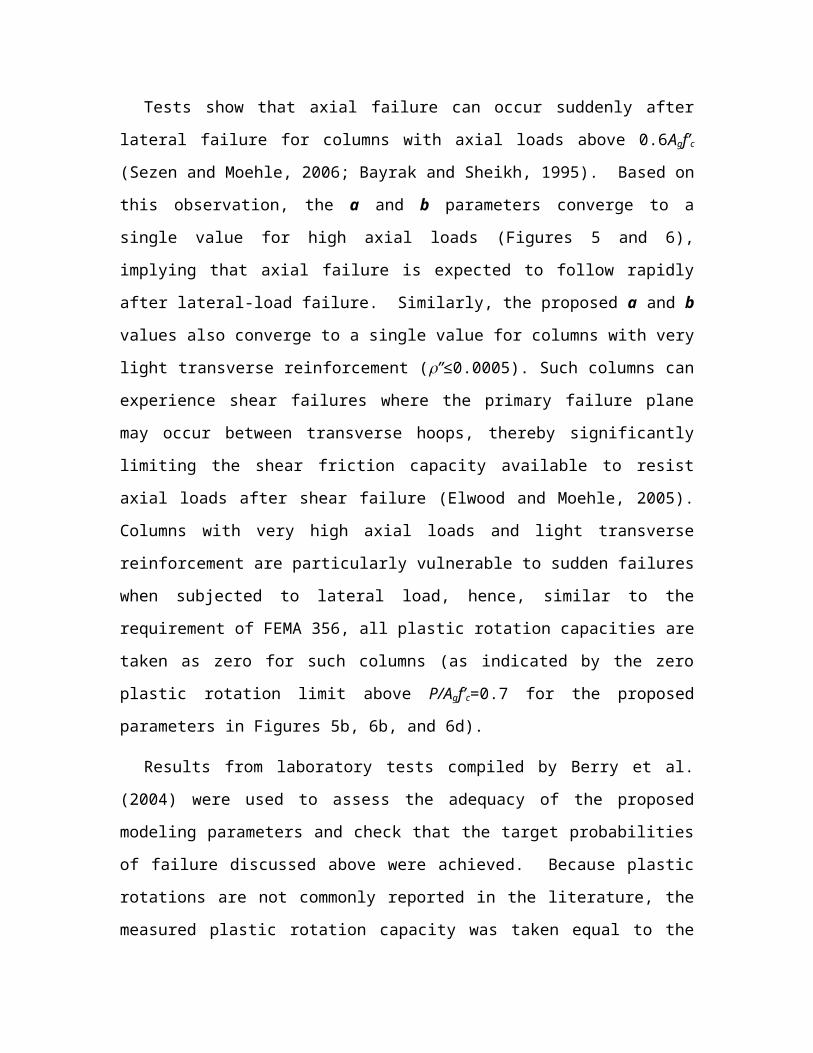
Tests show that axial failure can occur suddenly after lateral failure for columns with
axial loads above 0.6Agf’c (Sezen and Moehle, 2006; Bayrak and Sheikh, 1995). Based
on this observation, the a and b parameters converge to a single value for high axial loads
(Figures 5 and 6), implying that axial failure is expected to follow rapidly after lateral-
load failure. Similarly, the proposed a and b values also converge to a single value for
columns with very light transverse reinforcement (”≤0.0005). Such columns can
experience shear failures where the primary failure plane may occur between transverse
hoops, thereby significantly limiting the shear friction capacity available to resist axial
loads after shear failure (Elwood and Moehle, 2005). Columns with very high axial loads
and light transverse reinforcement are particularly vulnerable to sudden failures when
subjected to lateral load, hence, similar to the requirement of FEMA 356, all plastic
rotation capacities are taken as zero for such columns (as indicated by the zero plastic
rotation limit above P/Agf’c=0.7 for the proposed parameters in Figures 5b, 6b, and 6d).
Results from laboratory tests compiled by Berry et al. (2004) were used to assess the
adequacy of the proposed modeling parameters and check that the target probabilities of
failure discussed above were achieved. Because plastic rotations are not commonly
reported in the literature, the measured plastic rotation capacity was taken equal to the
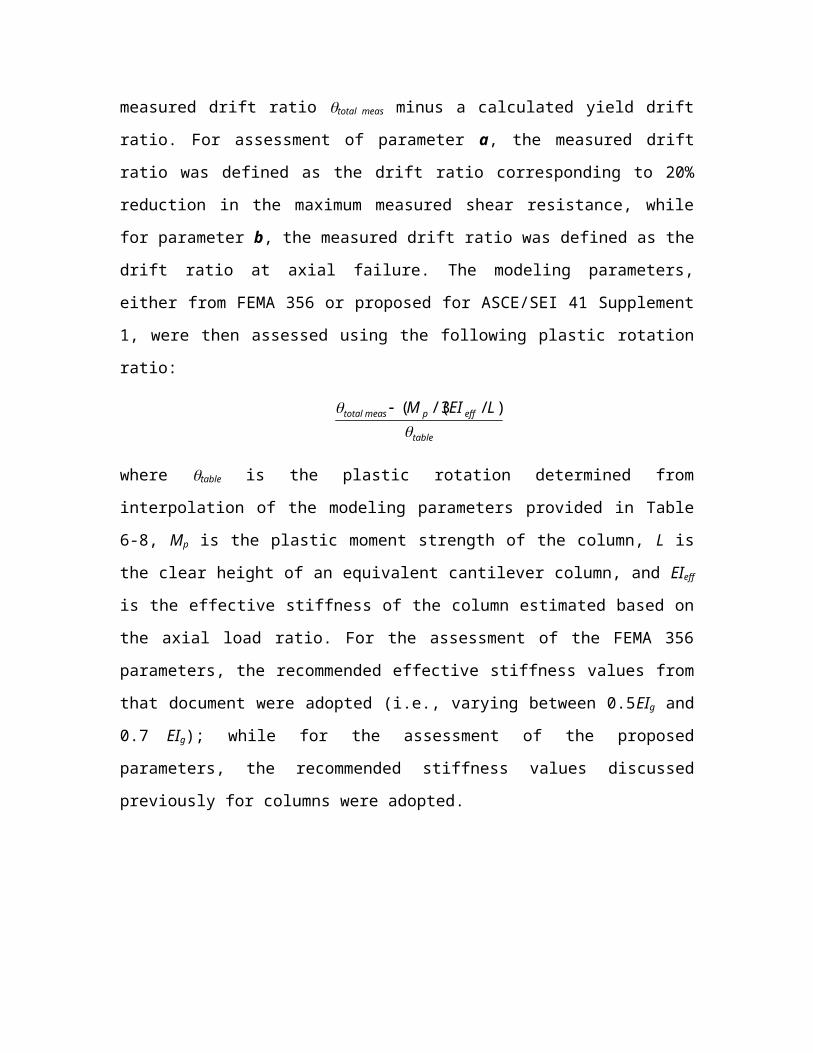
measured drift ratio total meas minus a calculated yield drift ratio. For assessment of
parameter a, the measured drift ratio was defined as the drift ratio corresponding to 20%
reduction in the maximum measured shear resistance, while for parameter b, the
measured drift ratio was defined as the drift ratio at axial failure. The modeling
parameters, either from FEMA 356 or proposed for ASCE/SEI 41 Supplement 1, were
then assessed using the following plastic rotation ratio:
table
effpmeastotal LEIM
)/3/((
where table is the plastic rotation determined from interpolation of the modeling
parameters provided in Table 6-8, Mp is the plastic moment strength of the column, L is
the clear height of an equivalent cantilever column, and EIeff is the effective stiffness of
the column estimated based on the axial load ratio. For the assessment of the FEMA 356
parameters, the recommended effective stiffness values from that document were adopted
(i.e., varying between 0.5EIg and 0.7 EIg); while for the assessment of the proposed
parameters, the recommended stiffness values discussed previously for columns were
adopted.
0
1
2
3
4
5
6
0.0 0.1 0.2 0.3 0.4 0.5 0.6 0.7
Condition i - proposed'controlled by flexure' - FEMA 356
`
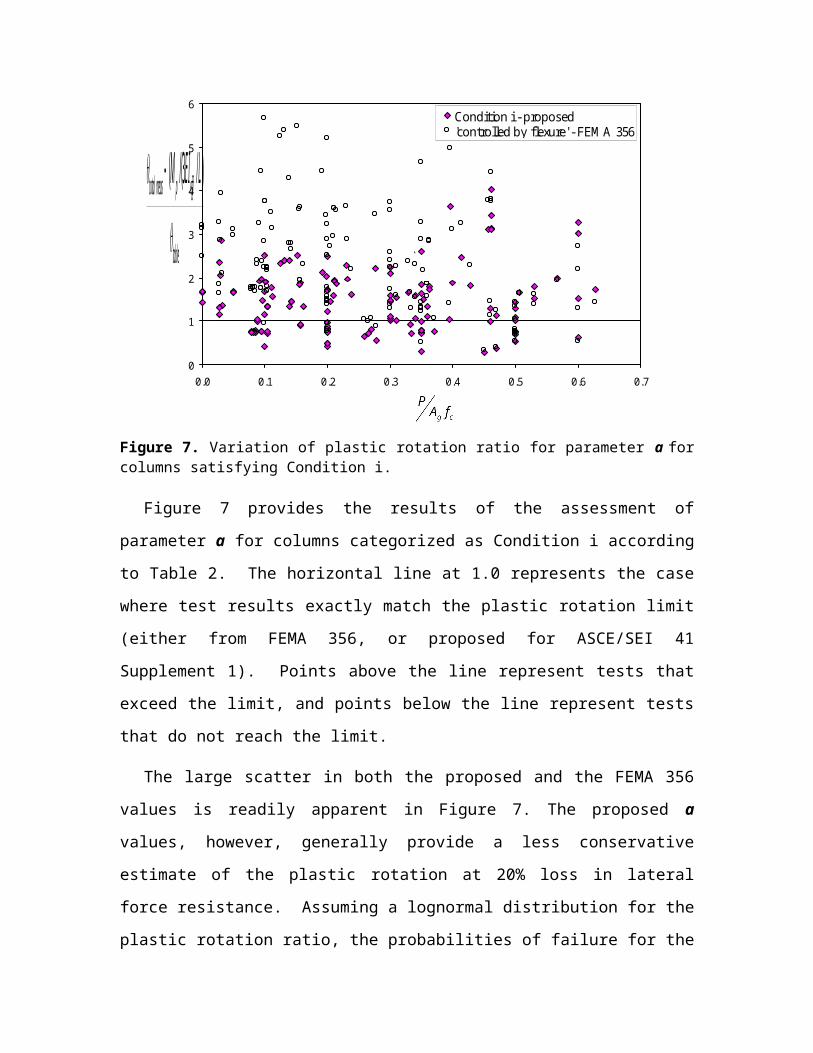
Figure 7. Variation of plastic rotation ratio for parameter a for columns satisfying Condition i.
Figure 7 provides the results of the assessment of parameter a for columns
categorized as Condition i according to Table 2. The horizontal line at 1.0 represents the
case where test results exactly match the plastic rotation limit (either from FEMA 356, or
proposed for ASCE/SEI 41 Supplement 1). Points above the line represent tests that
exceed the limit, and points below the line represent tests that do not reach the limit.
The large scatter in both the proposed and the FEMA 356 values is readily apparent
in Figure 7. The proposed a values, however, generally provide a less conservative
estimate of the plastic rotation at 20% loss in lateral force resistance. Assuming a
lognormal distribution for the plastic rotation ratio, the probabilities of failure for the
FEMA 356 and proposed values are 6% and 30%, respectively. While the FEMA 356
data points are generally very conservative, the results in Figure 7 indicate that as the
axial load increases the FEMA 356 limits become less conservative, an undesirable trend
considering the potentially higher consequences of failure for columns with high axial
load. This trend appears to be corrected in the results for the proposed values. Note that
( /(3 / )total meas p eff
table
M EI L
Figure 7 includes many columns that may not be considered typical of older reinforced
concrete buildings (i.e., they include modern seismic detailing). If a smaller subset
representative of older reinforced concrete buildings is considered, similar probabilities
of failure are attained. While the probability of failure for the proposed values satisfies
the target limit of 35% discussed previously, it is emphasized that this level of safety may
not be appropriate for the design of new buildings where further conservatism is
warranted given the limited incremental cost of achieving higher drift capacities.
0
2
4
6
8
10
12
14
16
0.0 0.1 0.2 0.3 0.4 0.5 0.6 0.7
Condition ii - proposed'controlled by flexure' - FEMA 356
Figure 8. Variation of plastic rotation ratio for parameter a for columns satisfying Condition ii.
Figure 8 provides the results for the assessment of parameter a for columns satisfying
Condition ii. The results indicate that the proposed values for parameter a are
considerably more accurate than those provided by FEMA 356, while still providing
sufficient conservatism. The associated probabilities of failure are 6% for the proposed
values and 0.1% for the FEMA 356 values. Because the probability of failure for the
proposed values is less than the target probability of 15%, it may be assumed that the
proposed values could be further relaxed; however, constraints on the value of parameter
a for Condition ii (i.e., it must be less than parameter b, and less than parameter a for
Condition i) resulted in the higher degree of conservatism. Because several columns
classified as Condition ii according to Table 1 may be considered as “controlled by
( /(3 / )total meas p eff
table
M EI L
shear” according to FEMA 356, the FEMA 356 procedure actually is more conservative
than implied by the results presented in Figure 8.
For columns expected to experience shear failure prior to flexural yielding (Condition
iii), the deformation at shear failure is given by the effective stiffness of the component
and the shear strength of the column. Significant plastic deformations cannot be relied
upon prior to shear failure; hence, parameter a has been set to zero. This assumption is
very conservative for some columns because the classification method according to Table
1 may result in some flexure-shear columns being classified as Condition iii and most
will have some limited plastic rotation capacity prior to shear failure.
0
1
2
3
4
5
6
7
8
9
10
0.0 0.1 0.2 0.3 0.4 0.5 0.6 0.7
Condition ii - proposed'controlled by flexure' - FEMA 356
Figure 9. Variation of plastic rotation ratio for parameter b for columns sustaining axial failures.
Limited data exist for the assessment of axial failure. A database of 28 columns
experiencing flexure-shear failures is used in Figure 9 to assess the proposed parameter b
values for Condition ii. The results suggest probabilities of failure of 13% for the
proposed values and 7% for the FEMA 356 values. Note that the proposed values
increase the conservatism for the sole data point with very high axial load. This was
considered desirable due to the likelihood for cascading failures when such high axial
loads are redistributed to neighboring elements. Again, it is noted that the FEMA 356
procedure is more conservative than implied by the results presented in Figure 9 because
( /(3 / )total meas p eff
table
M EI L
several of the columns used for this assessment would be considered as “controlled by
shear” according to FEMA 356.
Insufficient data exist to assess the probability of failure for parameter b for
Conditions i, iii, and iv (i.e., controlled by development or splicing); however, limited
test data suggest that the drift ratios for such columns will be greater than those for
flexure-shear columns (Melek and Wallace, 2004; Yoshimura et al., 2004), and, hence,
the b values for Condition ii are conservatively recommended for all conditions.
PROPOSED REVISIONS TO SLAB-COLUMN FRAME PROVISIONS
Modifications are proposed for slab-column frames, including guidance on modeling
approaches, updated modeling parameters, and updated acceptance values for reinforced
concrete and post-tensioned slab-column connections considering potential punching
shear failures.
Stiffness Modeling:
Various approaches can be used to model the load-deformation response of slab-
column frames. In the proposed update to the ASCE/SEI 41 supplement, guidance is
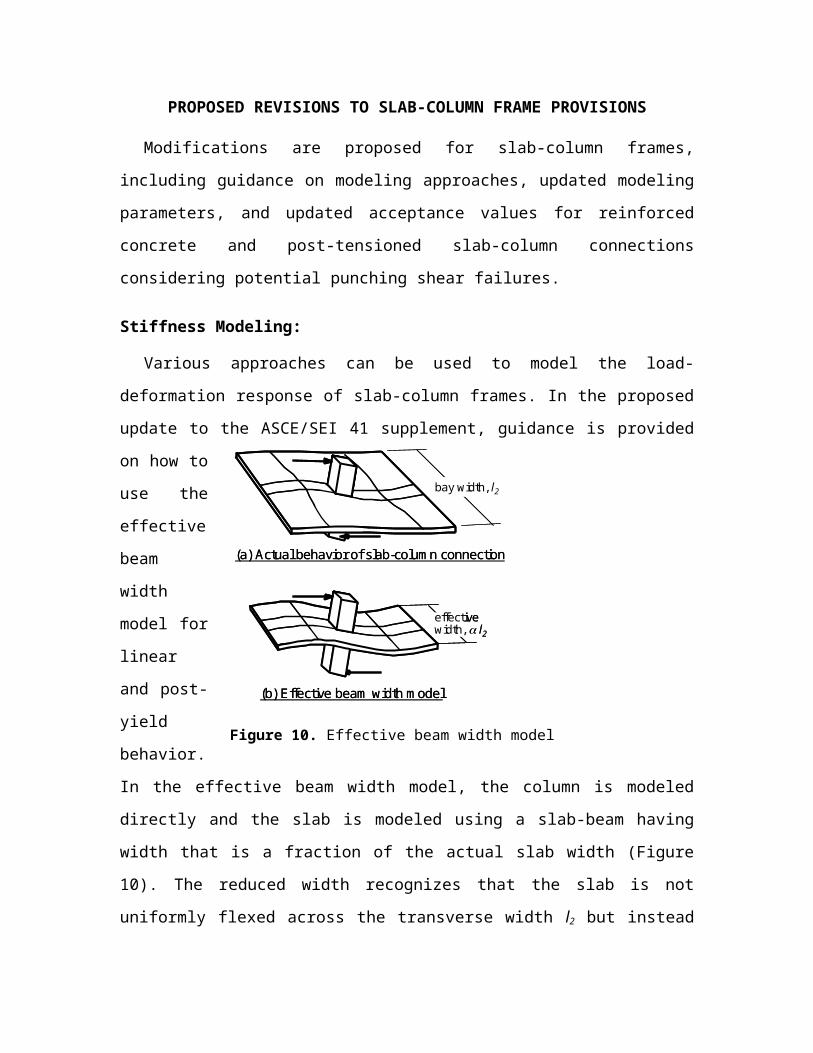
provided on how to use the effective beam width model for linear and post-yield
behavior. In
the effective
beam width
model, the
column is
modeled
directly and
the slab is
modeled
using a slab-
beam having
width that is
a fraction of the actual slab width (Figure 10). The reduced width recognizes that the slab
bay width, l2
effectivewidth, l2
(a) Actual behavior of slab-column connection
(b) Effective beam width model
bay width, l2
effectivewidth, l2
(a) Actual behavior of slab-column connection
(b) Effective beam width model
Figure 10. Effective beam width model
is not uniformly flexed across the transverse width l2 but instead has decreasing
participation with increasing transverse distance from the column (Figure 10a). Rather
than attempt to model this complex behavior directly, a beam effective width equal to l2
is defined that reproduces the actual slab-column connection stiffness. For a three-
dimensional system, slab-beams would frame into all four sides of an interior column.
The flexural rigidity of the effective width beam can be written as
(4)
where Ec is the concrete modulus of elasticity, Ieffective is the effective moment of inertia,
is the effective width factor, l2 is the length of span in the direction perpendicular to the
direction under consideration (as defined in Chapter 13 of ACI 318-05), and h is the slab
thickness. The term in brackets defines the gross-section moment of inertia for the
effective beam width l2. An additional factor is introduced to account for effects of
slab cracking.
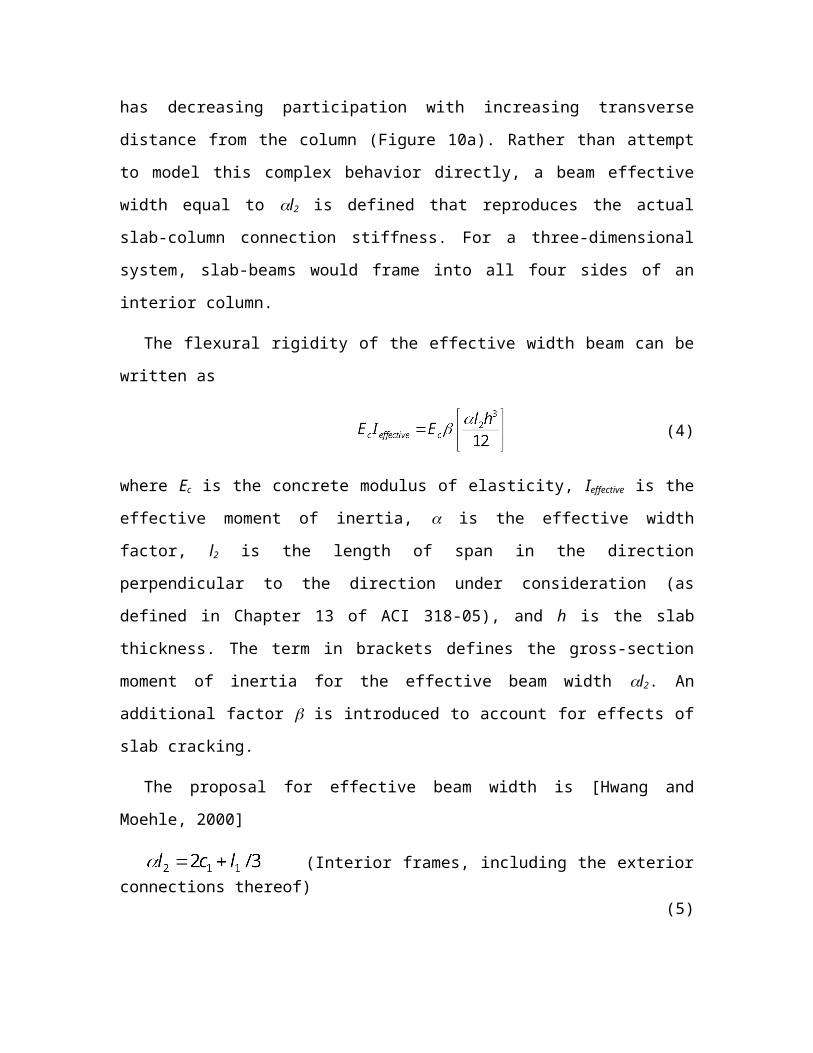
The proposal for effective beam width is [Hwang and Moehle, 2000]
(Interior frames, including the exterior connections thereof)(5)
(Exterior frames loaded parallel to the edge)
in which c1 is the column dimension parallel to the span and l1 is the center to center span
length in the direction under consideration (see ACI 318-05, Chapter 2, Notation and
Definitions). The effective width given by Equation 5 is applicable for slab-column frame
models in which the slab-beam is modeled as rigid along the depth of the column (that is,
the joint). Typical values for for interior frames vary between 1/2 to 3/4 for reinforced
concrete construction and 1/2 to 2/3 for post-tensioned construction. Values for exterior
frames transferring load parallel to the edge are about half those for interior connections.
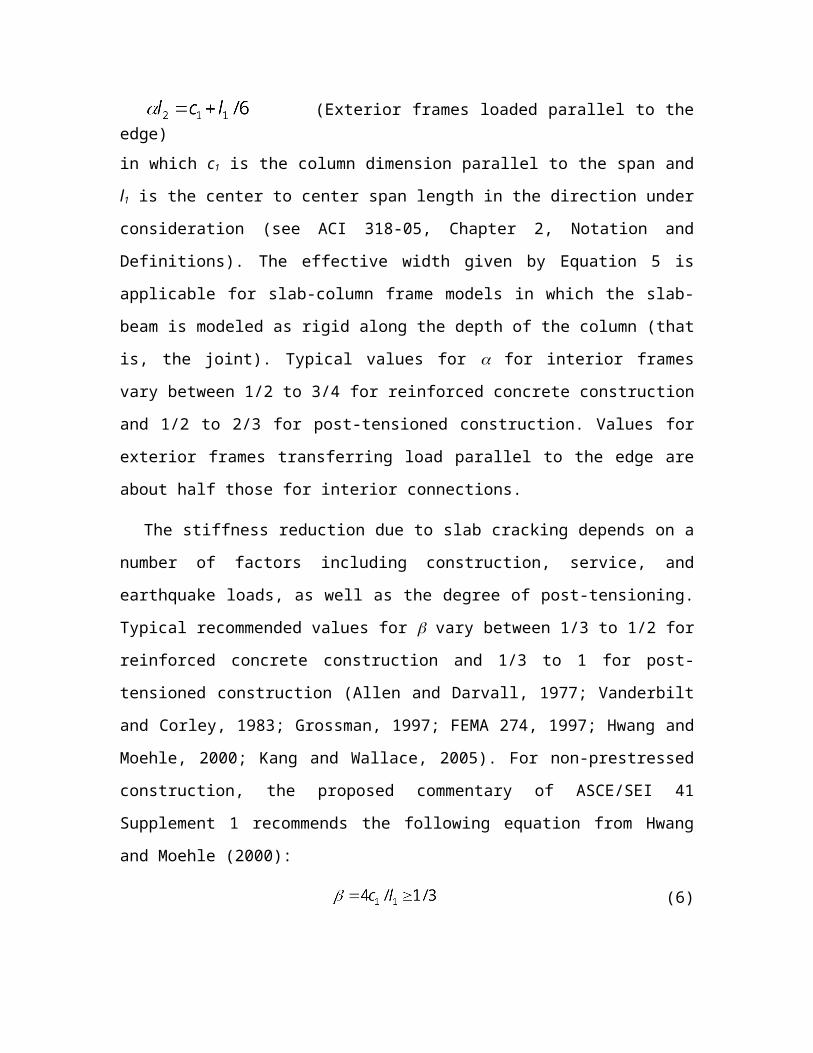
The stiffness reduction due to slab cracking depends on a number of factors including
construction, service, and earthquake loads, as well as the degree of post-tensioning.
Typical recommended values for vary between 1/3 to 1/2 for reinforced concrete
construction and 1/3 to 1 for post-tensioned construction (Allen and Darvall, 1977;
Vanderbilt and Corley, 1983; Grossman, 1997; FEMA 274, 1997; Hwang and Moehle,
2000; Kang and Wallace, 2005). For non-prestressed construction, the proposed
commentary of ASCE/SEI 41 Supplement 1 recommends the following equation from
Hwang and Moehle (2000):
(6)
For prestressed slabs, a larger value of is appropriate because of reduced cracking due
to prestressing. Following the work of Kang and Wallace (2005), = ½ is recommended
in the proposed commentary of ASCE/SEI 41 Supplement 1.
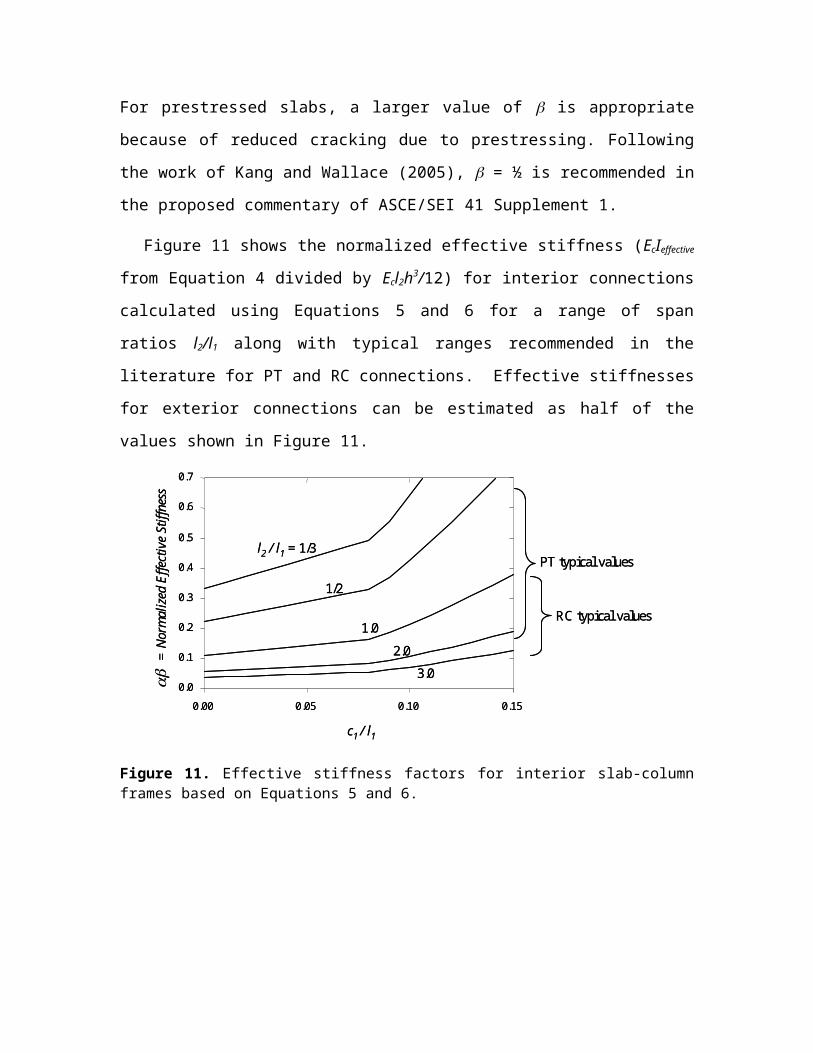
Figure 11 shows the normalized effective stiffness (EcIeffective from Equation 4 divided
by Ecl2h3/12) for interior connections calculated using Equations 5 and 6 for a range of
span ratios l2/l1 along with typical ranges recommended in the literature for PT and RC
connections. Effective stiffnesses for exterior connections can be estimated as half of the
values shown in Figure 11.
0.0
0.1
0.2
0.3
0.4
0.5
0.6
0.7
0.00 0.05 0.10 0.15
c1 / l1
=
Nor
mal
ized
Effe
ctiv
e St
iffne
ss
PT typical values
RC typical values
l2 / l1 = 1/3
1/2
1.0
2.0
3.00.0
0.1
0.2
0.3
0.4
0.5
0.6
0.7
0.00 0.05 0.10 0.15
c1 / l1
=
Nor
mal
ized
Effe
ctiv
e St
iffne
ss
PT typical values
RC typical values
l2 / l1 = 1/3
1/2
1.0
2.0
3.0
Figure 11. Effective stiffness factors for interior slab-column frames based on Equations 5 and 6.
M
M
Elastic slab beam
Elastic column
Column plastic hinge
Joint region
Plastic hinge or for torsional element
Elastic relation for slab beamor column
Torsional connection element
M
M
M
M
Elastic slab beam
Elastic column
Column plastic hinge
Joint region
Plastic hinge or for torsional element
Elastic relation for slab beamor column
Torsional connection element
column
csM
csM
conM
column
csM
csM
conM
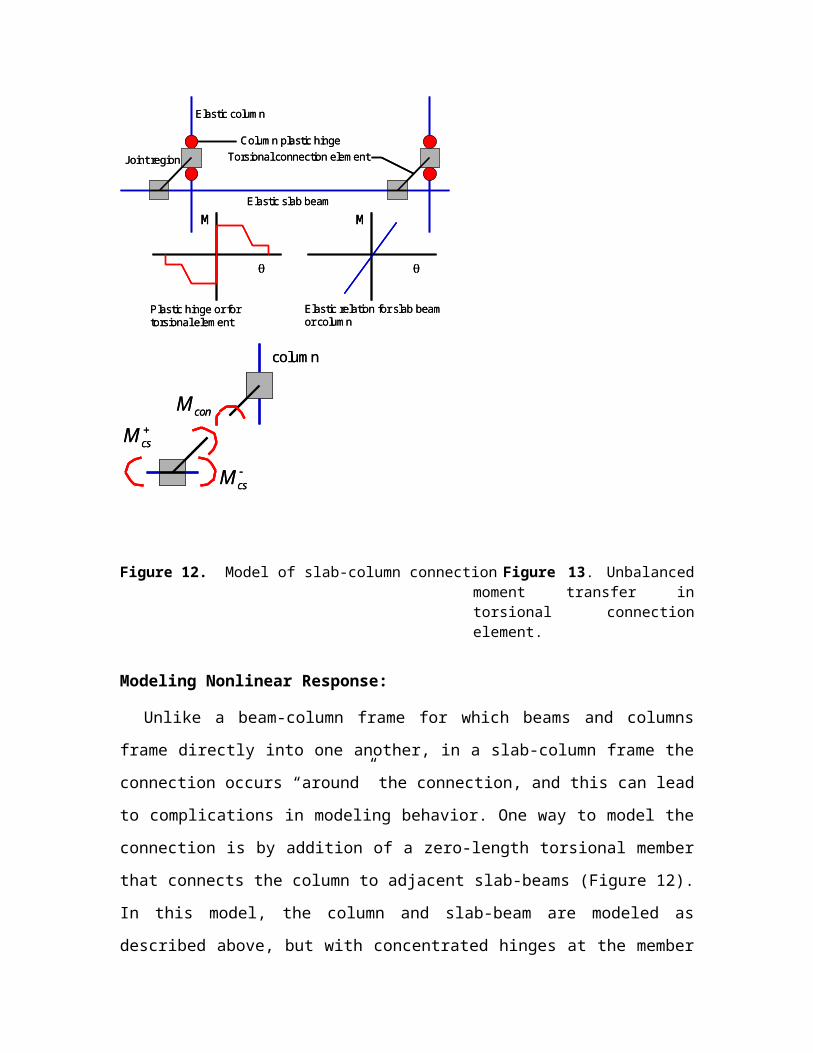
Figure 12. Model of slab-column connection Figure 13. Unbalanced moment transfer in torsional connection element.
Modeling Nonlinear Response:
Unlike a beam-column frame for which beams and columns frame directly into one
another, in a slab-column frame the connection occurs “around” the connection, and this
can lead to complications in modeling behavior. One way to model the connection is by
addition of a zero-length torsional member that connects the column to adjacent slab-
beams (Figure 12). In this model, the column and slab-beam are modeled as described
above, but with concentrated hinges at the member ends to represent the moment
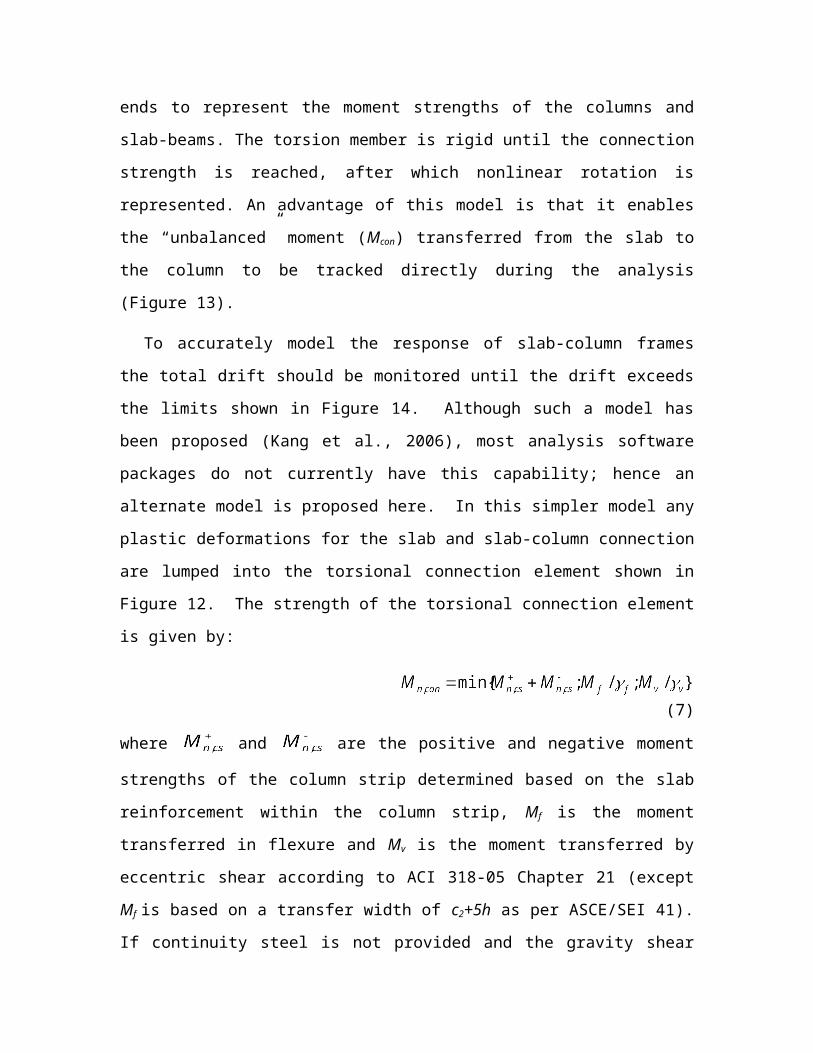
strengths of the columns and slab-beams. The torsion member is rigid until the
connection strength is reached, after which nonlinear rotation is represented. An
advantage of this model is that it enables the “unbalanced” moment (Mcon) transferred
from the slab to the column to be tracked directly during the analysis (Figure 13).
To accurately model the response of slab-column frames the total drift should be
monitored until the drift exceeds the limits shown in Figure 14. Although such a model
has been proposed (Kang et al., 2006), most analysis software packages do not currently
have this capability; hence an alternate model is proposed here. In this simpler model
any plastic deformations for the slab and slab-column connection are lumped into the
torsional connection element shown in Figure 12. The strength of the torsional
connection element is given by:
(7)
where and are the positive and negative moment strengths of the column
strip determined based on the slab reinforcement within the column strip, Mf is the
moment transferred in flexure and Mv is the moment transferred by eccentric shear
according to ACI 318-05 Chapter 21 (except Mf is based on a transfer width of c2+5h as
per ASCE/SEI 41). If continuity steel is not provided and the gravity shear ratio exceeds
0.6, the connection is considered force controlled and no plastic rotations are allowed in
the torsional connection element. All other connections are classified as deformation-
controlled, and the modeling parameters for the torsional connection element are defined
in the following paragraphs.
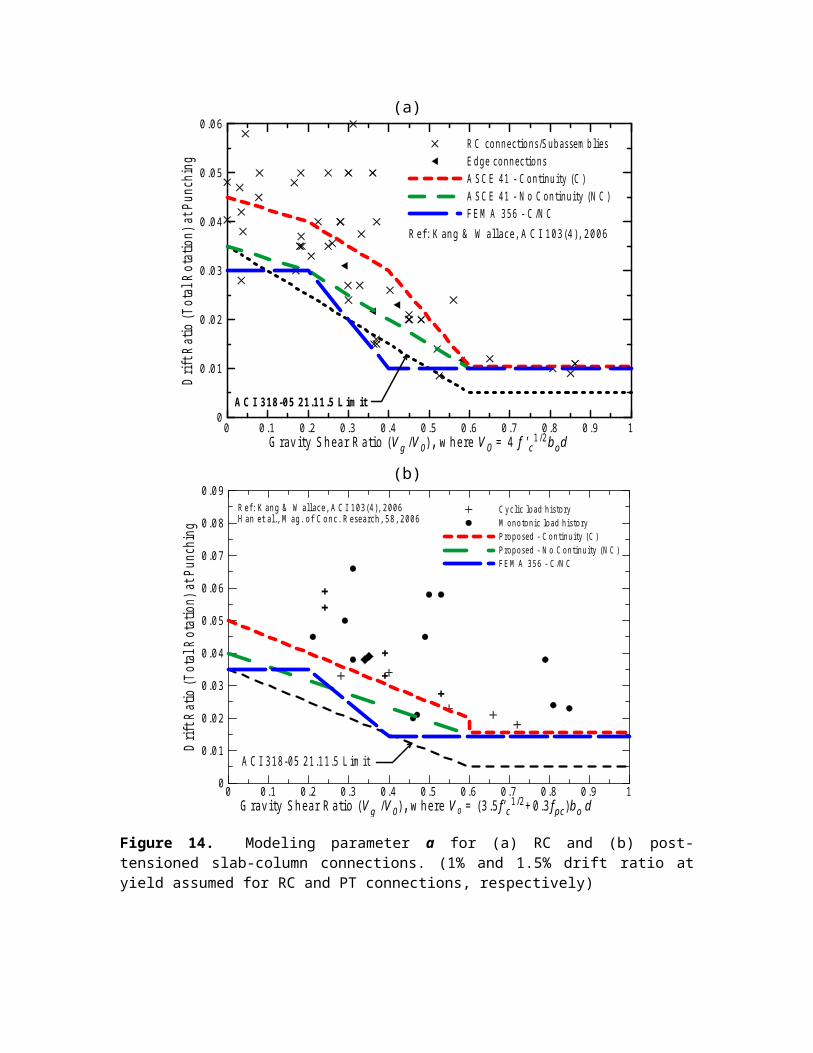
Nonlinear modeling parameters of slab-column frames proposed for ASCE/SEI 41
Supplement 1 are based primarily on test data for interior connections. Figure 14, where
the drift ratio at punching failure is plotted for a given gravity shear ratio, summarizes
these data. Because lateral drift ratio typically is reported for test data, plastic rotations
were derived from the test data assuming yield rotations of 0.01 and 0.015 radians for
reinforced concrete and post-tensioned slabs, respectively. The larger rotation value for
post-tensioned connections reflects the larger span-to-slab thickness ratios common for
this type of construction. Continuity reinforcement for reinforced concrete connections is
based on ACI-ASCE Committee 352 recommendations (ACI 352, 2002).
(a)
0 0.1 0.2 0.3 0.4 0.5 0.6 0.7 0.8 0.9 1G rav ity S h ea r R a tio (V g /V 0), w h e re V 0 = 4 f 'c
1 /2b od
0
0.01
0.02
0.03
0.04
0.05
0.06
Drif
t Rat
io (T
otal
Rot
atio
n) a
t Pun
chin
g
R C co n n ectio n s/S u b assem b lie sE d g e co n n ec tio n sA S C E 4 1 - C o n tin u ity (C )A S C E 4 1 - N o C o n tin u ity (N C )F E M A 3 5 6 - C /N C
A C I 3 18 -0 5 21 .11 .5 L im it
R ef: K an g & W allace , A C I 1 0 3 (4 ), 2 0 0 6
(b)
0 0.1 0.2 0.3 0.4 0 .5 0.6 0.7 0.8 0.9 1G ra v ity S h ea r R a tio (V g /V 0), w h ere V 0 = (3 .5 f'c
1 /2+ 0 .3 fp c)b o d
0
0.01
0.02
0.03
0.04
0.05
0.06
0.07
0.08
0.09
Drif
t Rat
io (T
otal
Rot
atio
n) a
t Pun
chin
g
C y c lic lo ad h is to ryM o n o to n ic lo ad h is to ryP ro p o sed - C o n tin u ity (C )P ro p o sed - N o C o n tin u ity (N C )F E M A 3 5 6 - C /N C
A C I 3 1 8 -05 21 .1 1 .5 L im it
R ef: K an g & W allace , A C I 1 0 3 (4 ), 2 0 06H an e t a l., M ag . o f C o n c . R esea rch , 5 8 , 2 0 0 6
Figure 14. Modeling parameter a for (a) RC and (b) post-tensioned slab-column connections. (1% and 1.5% drift ratio at yield assumed for RC and PT connections, respectively)
For connections with continuity reinforcement, proposed a-values for modeling
parameters are defined as approximate mean test values. Because of the higher potential
for collapse of connections without continuity reinforcement, proposed a-values for
connections without continuity reinforcement are defined as approximate mean minus
one standard deviation test values. Mean minus one standard deviation values give total
(i.e., yield plus plastic) rotation values that are close to the maximum drift values allowed
by ACI 318-05 for slabs without slab-shear reinforcement (Figure 14). Few data exist for
reinforced concrete connections subjected to gravity shear ratios greater than 0.6 and for
post-tensioned connections subjected to reversed cyclic loading. The residual strength
capacity for post-tensioned connections is based on test results reported by Qaisrani
(1993). Although relatively few tests have been reported for edge connections, the limited
data available suggest that the relationship between rotation and gravity shear ratio for
exterior connections is similar to the trend for interior connections (Kang and Wallace,
2006).
Consistent with Chapter 2 of ASCE/SEI 41, the b values for slab-column connections
were selected to represent plastic rotations at the loss of gravity load support. For slab-
column connections with no continuity steel, gravity load support is lost when punching
occurs, hence parameter b is set equal to parameter a for reinforced concrete and post-
tensioned concrete connections. Very limited data are available to determine appropriate
b values for slab-column connections with continuity steel, hence, values less than or
equal to the limits in FEMA 356 are proposed.
PROPOSED REVISIONS TO WALL PROVISIONS
The main goal of proposed changes to wall provisions of ASCE/SEI 41 (Section 6.7)
was to update the modeling and acceptance parameters for walls to make them more
consistent with observed behavior (EERI/PEER, 2006). Although the terms slender and
squat wall are not explicitly defined in Section 6.7 of ASCE/SEI 41, it is stated in Section
C6.7.1 of the commentary that walls should be considered slender (normally controlled
by flexure) if their aspect ratio (height/length) is greater than 3.0, and short or squat
(normally controlled by shear) if their aspect ratio is less than 1.5. Changes introduced in
the supplement include the addition of a load-deformation relationship for shear-
dominated walls, changes in performance and acceptance criteria for slender and squat
walls, changes in performance and acceptance criteria for columns under discontinuous
walls, and changes in the shear strength model for walls.
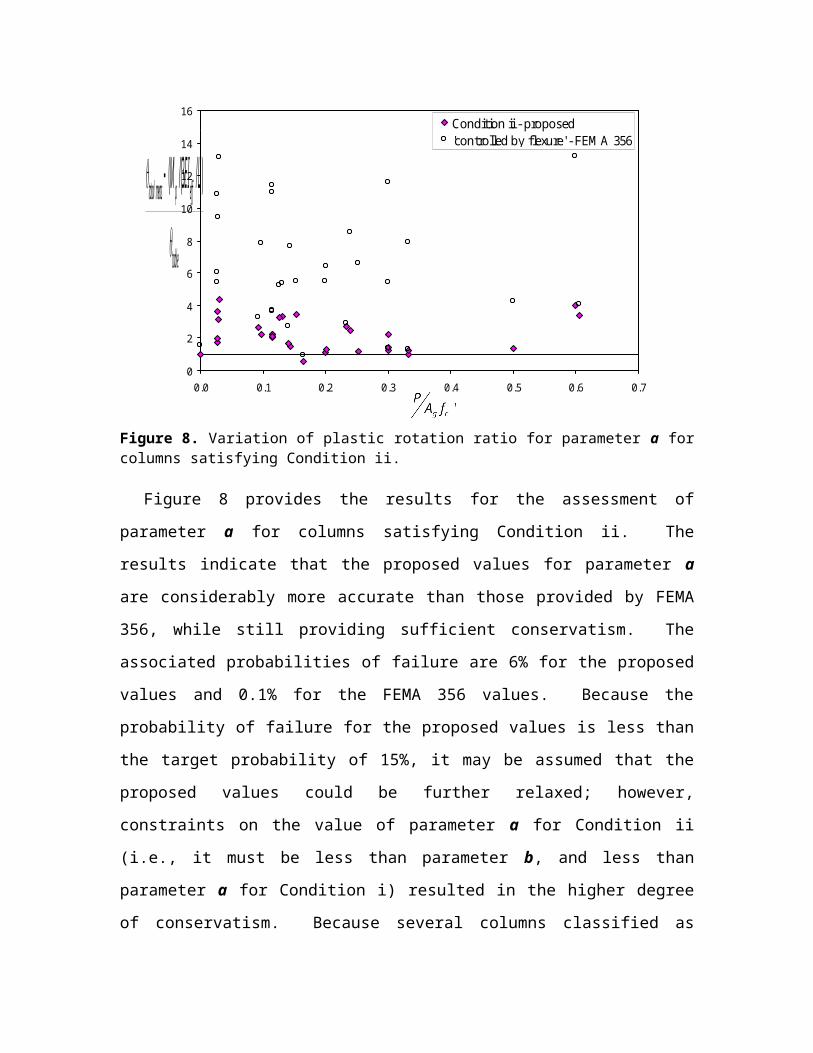
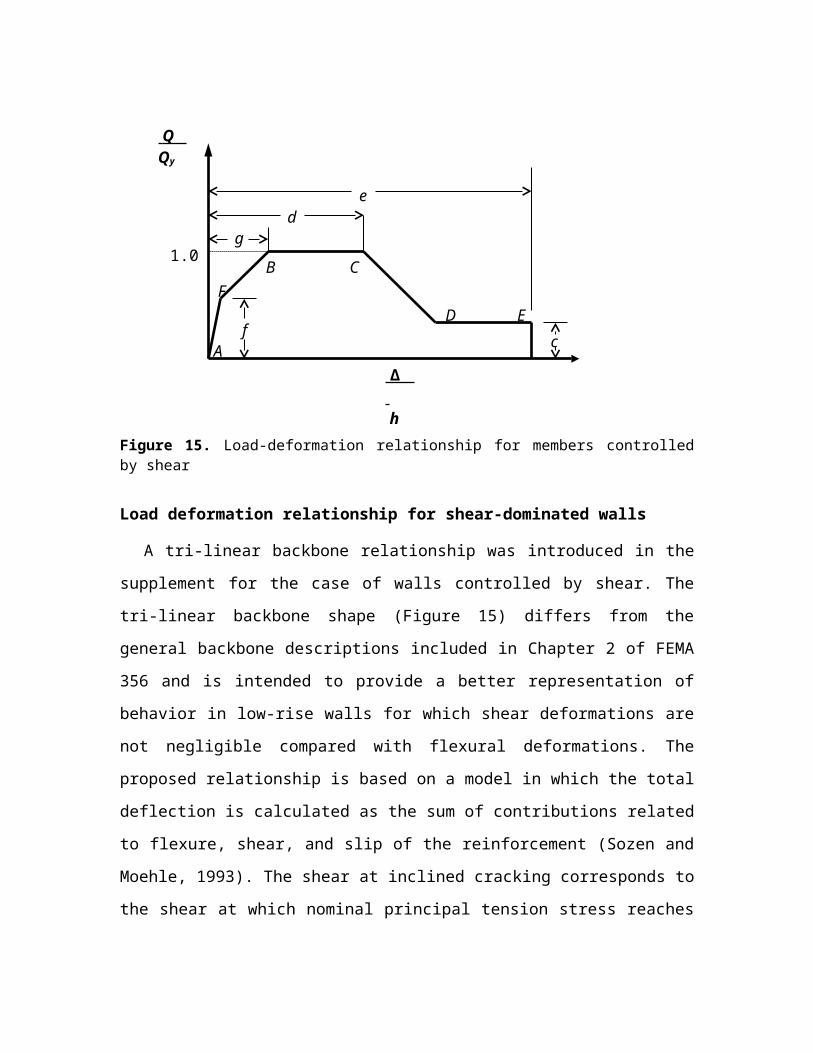
Figure 15. Load-deformation relationship for members controlled by shear
Load deformation relationship for shear-dominated walls
A tri-linear backbone relationship was introduced in the supplement for the case of
walls controlled by shear. The tri-linear backbone shape (Figure 15) differs from the
general backbone descriptions included in Chapter 2 of FEMA 356 and is intended to
provide a better representation of behavior in low-rise walls for which shear deformations
are not negligible compared with flexural deformations. The proposed relationship is
based on a model in which the total deflection is calculated as the sum of contributions
related to flexure, shear, and slip of the reinforcement (Sozen and Moehle, 1993). The
shear at inclined cracking corresponds to the shear at which nominal principal tension
stress reaches , psi (Sozen and Moehle, 1993). The deformations corresponding to
onset of yield and the onset lateral strength degradation are based on limited test data
(e.g., Hidalgo et al., 2002, Hirosawa, 1975).
c
Q Qy
1.0
A
B C
D Ef
F
de
g
∆ h
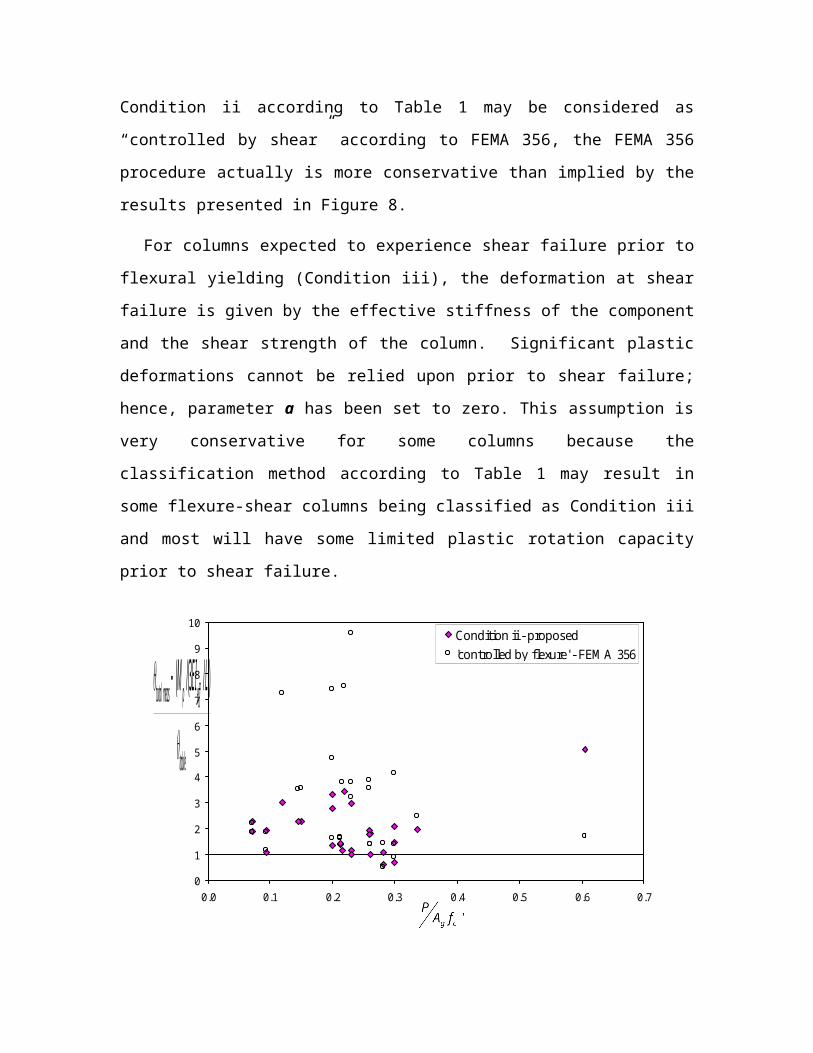
Figure 16. Load-deformation response for slender wall tested by Orakcal and Wallace (2006) with P = 0.07 fc’ Ag, shear span-to-depth ratio of approximately 3, and an average shear stress of
(in psi). Backbone curves shown correspond to walls with and average
shear stress of , psi. (C = “Confined” boundary, NC = “Not Confined” boundary according to FEMA 356)
Modeling and acceptance criteria
It was proposed that modeling and acceptance criteria for columns under
discontinuous walls be removed from Section 6.7 of ASCE/SEI 41. It was the opinion of
the committee that the revised modeling and acceptance criteria proposed for Section 6.4
(presented previously in this paper) adequately reflected the behavior of columns under
discontinuous walls, and that any direct reference to acceptance or modeling criteria for
these members in Section 6.7 would be superfluous.
Several changes were proposed to the modeling and acceptance criteria for walls
controlled by flexure. Values for parameters a and b specified in Tables 6.18 and 6.20
were found to be very conservative (EERI/PEER, 2006) compared with experimental
results of walls subjected to intermediate levels of shear stress (between and ,
psi) . Rather than change the parameters in the tables, the limiting average shear stress
was increased from to , psi to obtain a better match with experimental
results.
Experimental results (EERI/PEER, 2006) show that behavior of walls not fully
conforming to ACI 318 is adequately represented by modeling and acceptance criteria for
conforming elements in Tables 6.18 and 6.20 (an example is shown in Figure 16).
Consequently, for the purpose of evaluating the behavior of walls the proposed definition
of a confined boundary was changed from that having transverse reinforcement
conforming to ACI 318-05 to include boundary elements in which the amount of
transverse reinforcement exceeds 75% of that required in ACI 318-05, and spacing of
transverse reinforcement does not exceed 8db. In the proposed changes it also is
permitted to take modeling parameters and acceptance criteria as 80% of confined values
where boundary elements have at least 50% of the requirements given in ACI 318, and
spacing of transverse reinforcement does not exceed 8db. Otherwise, boundary elements
must be considered not confined.
Changes to acceptance and modeling criteria for walls controlled by shear also were
proposed to reflect experimental results (Hidalgo et al., 2002, Wallace et al., 2006,
EERI/PEER, 2006). While FEMA 356 had only one category encompassing all walls
regardless of axial load, proposed changes to Table 6.19 subdivide shear-controlled walls
into two categories; one for walls with low axial loads (e.g., Figure 17) and another for
walls with significant axial load demands (e.g., Figure 18). This change is based on tests
of pier walls carried out by Wallace et al. (2006) (e.g., Figure 18) that showed reduced
deformation capacity for axial loads equal to or greater than 0.05 fc’ Ag (Wallace et al.,
2006). The same tests showed negligible residual strength for walls with axial load
greater than 0.05 fc’ Ag, leading to additional proposed changes. Based on the tests by
Wallace et al. (2006) it was proposed that the residual strength coefficient for walls with
axial loads below 0.05 fc’ Ag be reduced from the value of 0.4 specified in FEMA 356 for
all walls controlled by shear to 0.2. Although experimental evidence substantiates a
residual strength coefficient of 0.4 for well-detailed squat walls with zero axial load, the
tests by Wallace et al. indicate that the residual strength may be significantly lower for
axial loads near 0.05 fc’ Ag, and for walls with poor detailing. Finally, it was proposed that
numerical acceptance criteria in Table 6-21 be adjusted so that m-factors for primary and
secondary components are more consistent with the definitions of life safety and collapse
prevention in Chapter 2.
-1 .5 -1.0 -0.5 0.0 0.5 1.0 1.5L a te ra l D isp la ce m e n t ( in .)
-100
-50
0
50
100
Shea
r For
ce (k
ips)
S p an d re l: W H 1 a-1 -06 " x 6 0 " x 6 0 " ta ll
T e st D a ta P ro p o sedF E M A 3 5 6
-0 .02 -0.01 0.00 0.01 0.02D rift (% )
Figure 17. Load-displacement response for wall specimen WH1a-1-0 by Wallace et al. (2006). The wall had shear span-to-depth ratio of 1, ρv = 0.25% ρh = 0.35%, and no axial load (v = vertical reinforcement ratio; v = horizontal reinforcement ratio). The FEMA 356 curve is calculated disregarding the ACI provision that requires two curtains of reinforcement. Nominal strengths for the FEMA 356 and proposed curves were calculated using ACI 318-05 strength equations with measured material strengths.
Figure 18. Load-displacement response for pier wall specimen WP1b-1-05 tested by Wallace et al. (2006). The wall had an axial load P = 0.05fc’Ag, a shear span-to-depth ratio of 0.44, ρv = 0.25%, and ρh = 0.35%. The FEMA 356 curve is calculated disregarding the ACI provision that requires two curtains of reinforcement. Nominal strengths for the FEMA 356 and proposed curves were calculated using ACI 318-05 strength equations with measured material strengths. The reinforcement ratio was assumed to be 0.15% (FEMA 356 minimum) in the calculations for strength due to inadequate anchorage of horizontal reinforcement.
( f y)M IN K S I
0
1
2
3
Vte
st /
Vn
(FE
MA
356
)O n e C u rta inT w o C u rta in s f y)m in= 0 .2 5 % * 60 K S I
f y)m in= 0 .1 5 % * 60 K S I
0 0.15 0.3 0.45 0.6
Figure 19. Ratio of measured to calculated strength according to ACI 318-05 for walls with one or two curtains of reinforcement. The minimum of the horizontal and vertical transverse reinforcement ratio ( minhv)) was used in the plot.
Calculated Strength
Two changes were proposed for calculation of wall strength. ACI 318-05 seismic
provisions require two curtains of reinforcement in walls having shear demand exceeding
, psi. The requirements in ACI 318-05 indicate that for walls in which hw/lw does
not exceed 2.0 the vertical reinforcement ratio shall not be less than the horizontal
reinforcement ratio. For that reason, when plotting experimental results and calculating
nominal shear strength for squat walls, the lower of the two ratios was used. Figure 19
shows the ratio of measured to calculated strength (using ACI 318-05) vs. the lower of
the vertical or horizontal reinforcement ratio for walls tested by various researchers
(Barda et al., 1977; Cardenas et al., 1980; Hidalgo et al., 2002; Hirosawa, 1975;
EERI/PEER, 2006). Two vertical lines are shown in Figure 19 corresponding to values of
of 0.09 and 0.15 ksi, where minh v). The value of 0.09 is the
minimum amount of reinforcement specified in FEMA 356 (0.15%) when they yield
strength of the reinforcement is 60 ksi, while the value of 0.15 corresponds to the
minimum amount of transverse reinforcement specified in Chapter 21 of ACI 318-05
(0.25%) also with a yield strength of 60 ksi. Consequently, points located to the right of
the aforementioned vertical lines correspond approximately to walls that met the
requirements for minimum amount of transverse reinforcement in FEMA 356 and ACI
318-05, respectively, and points to the left of the lines correspond to walls that did not.
The test data shows that the ratio of measured to calculated shear strength (using ACI
318-05) was similar for walls with one and two curtains of reinforcement (Figure 19),
even in cases when the requirement for the minimum amount of reinforcement was not
met. Based on this result it is proposed to allow ACI 318 strength provisions to be
applied even if the two-curtain requirement of ACI 318-05 is violated.
The second proposed change is to permit the use of expected material properties for
calculation of wall shear strength. Section 6.7.2.3 of FEMA 356 required the use of the
specified yield strength of the reinforcement for all shear strength calculations. Although
shear failures are commonly considered to be non-ductile failures, modeling parameters
and performance criteria in Tables 6-18 through 6-21 define the load-deformation
response of walls as deformation-controlled, with a stable deformation plateau beyond
yielding of the transverse or flexural reinforcement. Because there is no sudden loss in
resistance after yielding of the flexural or transverse reinforcement in the backbone
curves, it was concluded that there was no technical justification for calculating the
strength of these members in a manner different from other deformation-controlled
members.
-2.0 -1.0 0.0 1.0 2.0L ate ra l D isp lac e m en t ( in .)
-125
-100
-75
-50
-25
0
25
50
75
100
125
Shea
r For
ce (k
ips)
T es t D a ta F E M A 3 5 6 S ec tio n 2 .8A S C E 4 1 S u p # 1 S ec tio n 2 .8
Figure 20. Comparison of FEMA 356 and proposed ASCE/SEI 41 Supplement 1 backbone relations
PROPOSED REVISIONS FOR ALTERNATIVE MODELING PARAMETERS
AND ACCEPTANCE CRITERIA
The committee also proposed changes to ASCE/SEI 41 Section 2.8, which specifies
how to use testing to determine backbone relations “for elements, components, systems,
and materials for which structural modeling parameters and acceptance criteria are not
provided….” To provide greater flexibility in the application of the standard, it is
recommended to broaden this statement to allow the use of testing for cases where
information is provided in ASCE/SEI 41 Supplement 1, but more building-specific
information might be desired. The derivation of backbone relations from test results was
also redefined. As shown in Figure 20 for a lightly-reinforced wall segment, application
of FEMA 356, which defined the backbone curve through the intersection of the first
cycle for the ith deformation step and second cycle at the (i-1)th deformation step,
produces backbone relations that exaggerate the rate of strength degradation (similar
results have been observed for other components and materials). This exaggerated rate
can result in an over-estimation of earthquake deformation demands when used in
conjunction with commonly accepted analysis procedures (e.g., FEMA 440 [2005]). It is
proposed that the backbone curves be drawn through each point of peak displacement
during the first cycle of each increment of loading (or deformation), as shown in Figure
20.
PROPOSED REVISIONS TO GENERAL ACCEPTANCE CRITERIA
PROVISIONS
While the development of proposals for ASCE/SEI 41 Supplement 1 focused on
reinforced concrete behavior (Chapter 6), substantive changes in concrete acceptance
criteria revealed the need to revise and clarify the general description of acceptance
criteria in Chapter 2. This was needed to provide greater transparency in the actual
design intent of the provisions of ASCE/SEI 41, and to help maintain consistency
between different material chapters in the event of future revisions to acceptance criteria.
In FEMA 356, a component action is classified as force-controlled when its behavior
consists of elastic response, with or without limited plastic deformation, followed by a
sudden, brittle-type failure with negligible residual lateral strength. The classification of
all such actions as force-controlled can be overly conservative. For example, it prevents
the consideration of secondary components that lose lateral-force resistance in a brittle
manner, but still retain the ability to support gravity loads. Reinforced concrete columns
with low axial loads are an example of this type of component in which gravity loads can
be sustained at plastic rotations well beyond the onset of shear failure (see previous
discussion). Allowance for this type of behavior required modification of the definition
of acceptance criteria including changes to Figure 2-3 of FEMA 356, as shown in Figure
21. The proposed acceptance criteria are modified to include a potential plastic
deformation capacity beyond point 3, up to point 4, and the possibility of component
actions with Type 2 (d<2g) or Type 3 behavior to be classified as deformation-controlled.
Figure 21. Revised component force-deformation curves proposed for ASCE/SEI 41 Supplement 1.
CONCLUSIONS
Justification for proposed modifications to ASCE/SEI 41 modeling provisions and
acceptance criteria for concrete components is presented. Based on experimental
evidence, most of the acceptance criteria have been liberalized, allowing users to develop
more cost-effective retrofit solutions while still providing confidence in achieving the
specified performance objective. For example: for columns that typically govern the
deformation capacity of older reinforced concrete buildings the plastic rotation capacity
has increased by at least 50% depending on axial load and transverse reinforcement
details; for lap splices typical of older concrete buildings the proposed criteria allow a
steel stress that is approximately 45% higher than that allowed in FEMA 356; for slab-
column connections with continuity steel, the proposed provisions increase the allowable
drift ratios by up to 0.02 radians depending on the gravity shear ratio; for shear-controlled
walls with low axial load, the proposed provisions increase the CP allowable drift by
33%.
Where justified by experimental evidence, some acceptance criteria and modeling
parameters have been tightened. For example, full-scale laboratory tests on columns with
high axial loads and very light transverse reinforcement have shown that axial failure can
occur rapidly after shear failure, and the proposed provisions do not allow any plastic
rotations, regardless of the performance level.
Revision and clarification of the general description of acceptance criteria in Chapter
2 of ASCE/SEI 41 will permit consideration of secondary components that lose lateral-
force resistance in a brittle manner, but still retain the ability to support gravity loads.
This will also help maintain consistency between different material chapters in the event
of future revisions to acceptance criteria for steel, masonry and wood components.
Further studies on the concrete provisions of ASCE/SEI 41 should include refinement
of the modeling parameters and acceptance criteria for beam-column joints and beams.
ACKNOWLEDGMENTS
The modifications summarized above were undertaken by an ad hoc committee
established by Chris Poland, Chair of ASCE-SEI Seismic Rehabilitation Standards
Committee. Funding for the ad hoc committee meetings was provided by ASCE and
FEMA, while meeting facilities were provided by Degenkolb Engineers and the PEER
Center. Much of the research leading to the modifications described herein was
undertaken through funding from the PEER Center. All funding and support of the
activities of the ad hoc committee are gratefully acknowledged. Special thanks to Allin
Cornell, Marc Eberhard, Ron Hamburger, Ron Mayes, Robert Pekelnicky, Graham
Powell, and Y.K. Wen for their critical input before and during the deliberations of the ad
hoc committee.
REFERENCES
ACI 318, 2005, Building Code Requirements for Structural Concrete and Commentary,
American Concrete Institute, Farmington Hills, Michigan.
ACI 352, 2002, Recommendations for Design of Beam-Column Connections in Monolithic
Reinforced Concrete Structures: ACI 352R-02, American Concrete Institute, Farmington
Hills, MI, 37 pp.
Allen, F., and Darvall, P., 1977, “Lateral Load Equivalent Frame,” ACI Journal, American
Concrete Institute, Detroit, Michigan, V. 74, No.7, pp. 294-299.
ASCE/SEI 41, 2007, Seismic Rehabilitation of Existing Buildings, American Society of Civil
Engineers, Reston, Virginia.
Barda, F., Hanson, J.M., and Corley, W.G., 1977, “Shear Strength of low-Rise Walls with
Boundary Elements,” Reinforced Concrete Structures in Seismic Zones, SP-53, American
Concrete Institute, Farmington Hills, MI, pp. 149-202.
Bayrak, O. and Sheikh, S.A., 1995 “High Strength Concrete Columns under Simulated
Earthquake Loading”, ACI Structural Journal, American Concrete Institute, V. 94, No. 6, pp.
708-722.
Beres, A., White, R., and Gergely, P., 1992, “Seismic Behavior of Reinforced Concrete Frame
Structures with Nonductile Details: Part I – Summary of Experimental Findings of Full Scale
Beam-Column Joint Tests,” Report NCEER-92-0024, NCEER, State University of New York
at Buffalo.
Berry, M., Parrish, M., and Eberhard, M., 2004, “PEER Structural Performance Database User’s
Manual,” (www.ce.washington.edu/~peera1), Pacific Earthquake Engineering Research
Center, University of California, Berkeley.
Cardenas, A.E., Russell, H.G., and Corley, W.G., 1980, “Strength of Low-Rise Structural Walls,”
Reinforced Concrete Structures Subjected to Wind and Earthquake Forces, SP-63, American
Concrete Institute, pp. 221-241.
Cho, J.-Y, and Pincheira, J.A., 2006, “Inelastic Analysis of Reinforced Concrete Columns with
Short Lap Splices Subject to Reversed Cyclic Loads”, ACI Structural Journal, V. 103, No. 2,
pp. 280-290.
De Anda, L., Courtier, C., and Moehle, J.P., 2006 “Bond Strength of Prefabricated Epoxy-Coated
Reinforcement,” ACI Structural Journal, V. 103, No. 2, March 2006, pp. 226-234.
EERI/PEER, 2006, New Information on the Seismic Performance of Existing Concrete
Buildings, Seminar Notes, Earthquake Engineering Research Institute, Oakland, California.
Elwood, K.J. and Eberhard, M.O., 2006, Effective Stiffness of Reinforced Concrete Columns,
PEER Research Digest, No. 2006-1.
Elwood, K.J. and Moehle, J.P., 2005, “Axial Capacity Model for Shear-Damaged Columns,” ACI
Structural Journal, V. 102, No. 4, pp 578-587.
FEMA 273, 1997, NEHRP Guidelines for the Seismic Rehabilitation of Buildings, prepared by
the Building Seismic Safety Council for the Federal Emergency Management Agency,
Washington, D.C. (FEMA Publication No. 273).
FEMA 274, 1997, NEHRP Commentary on the Guidelines for Seismic Rehabilitation of
Buildings, prepared by the Building Seismic Safety Council for the Federal Emergency
Management Agency, Washington, D.C. (FEMA Publication No. 274).
FEMA 356, 2000, Prestandard and Commentary for the Seismic Rehabilitation of Buildings,
prepared by the American Society of Civil Engineers for the Federal Emergency
Management Agency, Washington, D.C. (FEMA Publication No. 356).
FEMA 440, 2005, Improvement of Nonlinear Static Seismic Analysis Procedures, Federal
Emergency Management Agency, 2005.
Grossman, J., 1997, Verification of Proposed Design Methodologies for Effective Width of Slabs
in SlabColumn Frames, ACI Structural Journal, V. 94, No. 2, pp. 181-196.
Hidalgo, P.A.; Ledezma, C.A.; Jordan, R.M., 2002, “Seismic behavior of squat reinforced
concrete shear walls,” Earthquake Spectra. V. 18, no. 2, pp. 287-308.
Hirosawa, M., 1975, “Past Experimental Results on Reinforced Concrete Shear Walls and
Analysis on Them,” Building Research Institute, Ministry of Construction, No. 6, 277 pp. (in
Japanese)
Hwang, S.-J., Moehle, J.P., 1993, “An experimental study of flat-plate structures under vertical
and lateral loads” UCB/EERC-93/03, Earthquake Engineering Research Center, University of
California, Berkeley, 278 pages.
Hwang, S.-J., Moehle, J.P., 2000, “Models for Laterally Load Slab-Column Frames,” ACI
Structural Journal, American Concrete Institute, Detroit, Michigan, V. 97, No.2, pp. 345-
353.
Goodsir, W. J., 1985, “The Design of Coupled Frame-Wall Structures for Seismic Actions,”
Research Report No. 85-8, Department of Civil Engineering, University of Canterbury,
Christchurch, New Zealand, 383 pp.
Kang, T.H-K.; Wallace, J.W., 2005, “Responses of flat plate systems subjected to simulated
earthquake loading,” ACI Structural Journal, V. 102 , No. 5, pp. 763 - 773.
Kang. T.H.-K.; Elwood, K.J.; Wallace, J.W., 2006, “Dynamic Tests and Modeling of RC and PT
Slab-Column Connections”, 8th US National Conference on Earthquake Engineering, San
Francisco, Paper 0362.
Leon, R.T., 1990, “Shear Strength and Hysteretic Behavior of Interior Beam-Column Joints”,ACI
Structural Journal, American Concrete Institute, V. 87, No. 1, pp. 3-11.
Luo, Y.H., Durrani, A.J., Conte, J.P., 1994, “Equivalent Frame Analysis of Flat Plate Buildings
for Seismic Loading,” Journal of Structural Engineering, American Society of Civil
Engineers, Reston, Virginia, V. 120, No.7, pp. 2137-2155.
Lynn, A.C., Moehle, J.P., Mahin, S.A., and Holmes, W.T., 1996, “Seismic Evaluation of Existing
Reinforced Concrete Columns,” Earthquake Spectra, Earthquake Engineering Research
Institute, V. 12, No. 4, pp. 715-739.
Massone, L.M., 2006, “RC Wall Shear – Flexure Interaction: Analytical and Experimental
Responses,” PhD Dissertation, University of California, Department of Civil &
Environmental Engineering, Los Angeles, California, 398 pp.
Melek, M., and Wallace, J.W., 2004, "Cyclic Behavior of Columns with Short Lap Splices,“ ACI
Structural Journal, V. 101, No. 6, pp. 802-811.
Ousalem, H., Kabeyasawa, T., and Tasai, A., 2004, “Evaluation of Ultimate Deformation
Capacity at Axial Load Collapse of Reinforced Concrete Columns,” Proceedings of 13th
World Conference on Earthquake Engineering, Paper No. 370.
Pecknold, D.A., 1975, “Slab Effective Width for Equivalent Frame Analysis,” ACI Journal,
American Concrete Institute, Detroit, Michigan, V. 72, No.4, pp. 294-299.
Qaisrani, A.-N., 1993, “Interior Post-Tensioned Flat-Plate Connections Subjected to Vertical and
Biaxial Lateral Loading,” PhD Dissertation, Department of Civil Engineering, University of
California-Berkeley, Berkeley, Calif., 284 pp.
Sezen, H. and Moehle, J.P., 2006 “Seismic Tests of Concrete Columns with Light Transverse
Reinforcement” ACI Structural Journal, American Concrete Institute, V. 103, No. 6, pp. 842-
849.
Sezen, H., and Moehle, J.P., 2004, “Shear Strength Model for Lightly Reinforced Concrete
Columns,” Journal of Structural Engineering, American Society of Civil Engineers, V. 130,
No. 11, pp. 1692-1703.
Sozen, M. A., and Moehle, J. P., 1993, “Stiffness of reinforced concrete walls resisting in-plane
shear,” Electric Power Research Institute, Research Project 3094-01, Final Report.
Vanderbilt, M.D., and Corley, W.G., 1983, “Frame Analysis of Concrete Buildings,” Concrete
International, American Concrete Institute, Detroit, Michigan, V. 5, No. 12, pp. 33-43.
Wallace, J., Massone, L., and Orackal, K., 2006, “St. Josephs Healthcare Orange, California SPC-
2 Upgrade: E/W Wing Component Test Program,” UCLA SEERL Report 2006/01,
Department of Civil and Environmental Engineering, University of California, Los Angeles,
10 pp.
Walker, S., Yeargin, C., Lehman, D.E., and Stanton, J., 2007, Seismic Performance of Non-
Ductile Reinforced Concrete Beam-Column Joints, ACI Structural Journal, American
Concrete Institute, accepted for publication.
Yoshimura, M., Takaine, Y., and Nakamura, T., 2004, “Axial Collapse of Reinforced Concrete
Columns,” Proceedings of 13th World Conference on Earthquake Engineering, Paper No.
1699.
APPENDIX A: PROPOSED REVISIONS TO ASCE/SEI 41 CHAPTER 2
2.4.4.3 Deformation-Controlled and Force-Controlled Actions
All actions shall be classified as either deformation-controlled or force-controlled using the component force versus deformation curves shown in Figure 2-3.
Nonlinear acceptance criteria and m-factors for deformation-controlled actions are defined in Chapters 4 through 8 of this standard. In cases where these values are not specified in the standard, component testing may be carried out in accordance to Section 2.8 to determine them. If m-factors and nonlinear acceptance criteria are not specified in the standard and component testing in accordance to Section 2.8 is not carried out, actions shall be considered to be force-controlled.
The Type 1 curve depicted in Figure 2-3 is representative of ductile behavior where there is an elastic range (points 0 to 1 on the curve) followed byand a plastic range (points 1 to 3), followed by loss of lateral-force-resisting capacity at point 3 and loss of vertical-force-resisting capacity at point 4.with non-negligible residual strength and ability to support gravity loads at point 3. The plastic range can have either a positive or negative post-elastic slope (points 1 to 2) and a strength-degraded region with non-negligible residual strength to resist lateral and gravity loads (points 2 to 3).The plastic range includes a strain hardening or softening range (points 1 to 2) and a strength-degraded range (points 2 to 3). Primary component actions exhibiting this behavior shall be classified as deformation-controlled if the strain-hardening or strain-softeningplastic range is such that d ≥ 2g; otherwise, they shall be classified as force-controlled. Secondary component actions exhibiting Type 1 this behavior shall be classified as deformation-controlled for any d/g ratio.
The Type 2 curve depicted in Figure 2-3 is representative of ductile behavior where there is an elastic range (points 0 to 1 on the curve) and a plastic range (points 1 to 23). The plastic range can have either a positive or negative post-elastic slope (points 1 to 3) followed by substantial loss of lateral-force-resisting capacity at point 3. Loss of vertical-force-resisting capacity takes place at the deformation associated with point 4.strength and loss of ability to support gravity loads beyond point 2. Primary and secondary component actions exhibiting this type of behavior shall be classified as deformation-controlled if the plastic range is such that e 2g; otherwise, they shall be classified as force-controlled. Secondary component actions exhibiting this behavior shall be classified as deformation-controlled if f 2g; otherwise, they shall be classified as force-controlled.
The Type 3 curve depicted in Figure 2-3 is representative of a brittle or nonductile behavior where there is an elastic range (points 0 to 1 on the curve) followed by loss of lateral-force-resisting capacity at point 3 and loss of vertical-force-resisting capacity at the deformation associated with point 4. strength and loss of ability to support gravity loads beyond point 1. Primary and secondary component actions exhibiting this displaying Type 3 behavior shall be classified as force-controlled. Secondary component
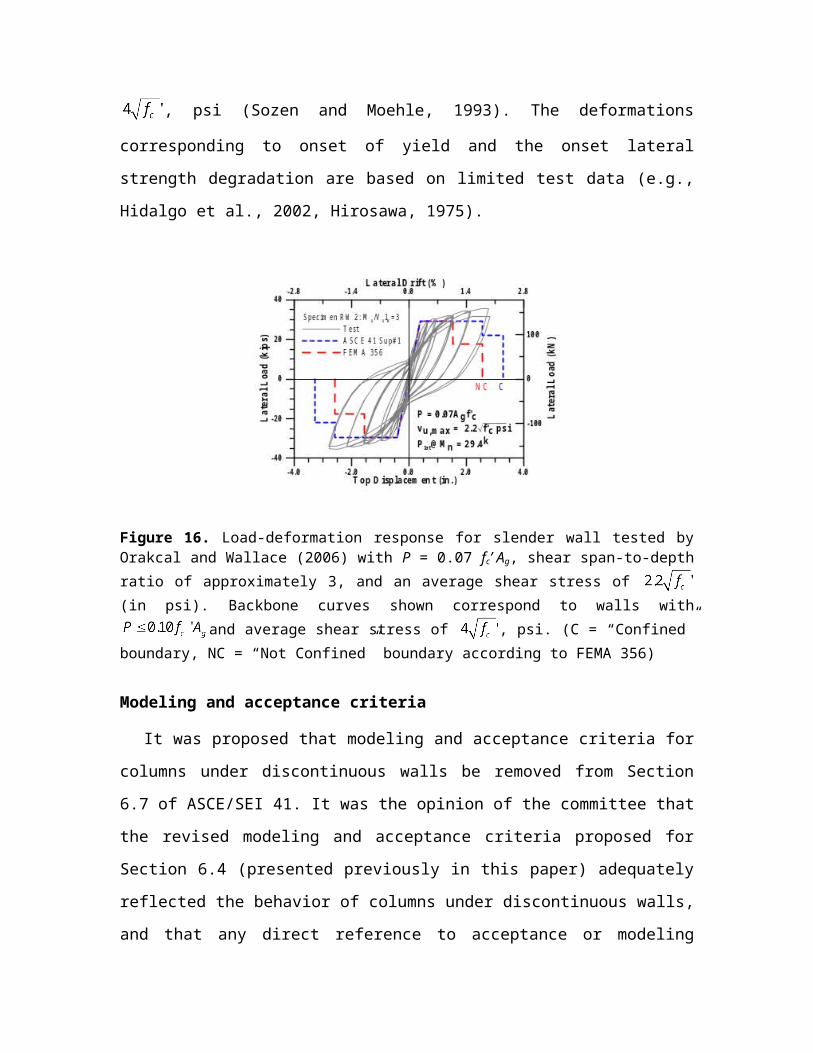
actions exhibiting this behavior shall be classified as deformation-controlled if f 2g; otherwise, they shall be classified as force-controlled.
C2.4.4.3 Deformation-Controlled and Force-Controlled Actions
Deformation-controlled actions may not be designated as such based on the discretion of the engineer. Deformation-controlled actions are defined in this standard by the designation of m-factors or nonlinear deformation capacities in Chapters 4 through 8, or alternatively, must be validated through testing in accordance with Section 2.8.
Acceptance criteria for primary components that exhibit Type 1 or Type 2 behavior typically are within the elastic or plastic ranges between points 0 and 2, depending on the performance level. Acceptance criteria for secondary components that exhibit Type 1 or Type 2 behavior can be within any of the performance ranges.
Acceptance criteria for primary and secondary components exhibiting Type 2 behavior will be within the elastic or plastic ranges, depending on the performance level.
Acceptance criteria for primary and secondary components exhibiting Type 3 behavior will always be within the elastic range. Acceptance criteria for secondary components exhibiting Type 3 behavior can be within any of the performance ranges.
Table C2-1 provides some examples of possible deformation- and force-controlled actions in common framing systems. Classification of deformation- or force-controlled actions are specified for foundation and framing components in Chapters 4 through 8.
A given component may have a combination of both deformation- and force-controlled actions.
In Figure 2-3, point 4 is defined by the nonlinear modeling parameters in Chapters 4 through 8,where c is equal to zero and b is greater than a (or e is greater than d). Alternatively, point 4 may be defined based on component testing in accordance with Section 2.8 of this standard. Loss of component vertical-force-resisting capacity occurs at Point F, which coincides with Point 4.
Classification as a deformation-controlled action is not up to the discretion of the user. Deformation-controlled actions have been defined in this standard by the designation of m-factors or nonlinear deformation capacities in Chapters 4 through 8. Where such values are not designated and component testing justifying Type 1 or Type 2 behavior is absent, actions are to be taken as force-controlled.
Figure C2-1 shows the generalized force versus deformation curves used throughout this standard to specify component modeling and acceptance criteria for deformation-controlled actions in any of the four basic material types. Linear response is depicted between point A (unloaded component) and an effective yield point B. The slope from point B to point C is typically a small percentage (0-10%) of the elastic slope, and is
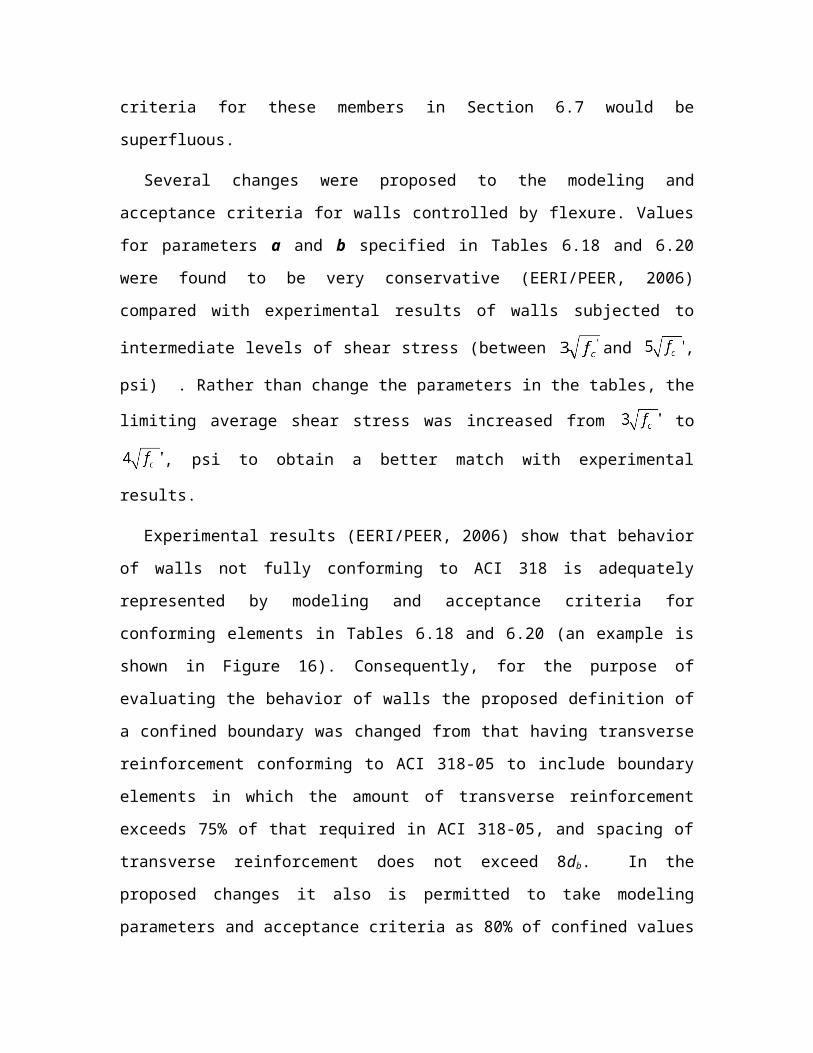
included to represent phenomena such as strain hardening. Point C has an ordinate that represents the strength of the component, and an abscissa value equal to the deformation at which significant lateral strength degradation begins (line CD). Beyond point D, the component responds with substantially reduced lateral strength to point E. At deformations greater than point E, the component lateral strength is essentially zero. The vertical-force-resisting capacity is maintained until point F. Deformations beyond point F should not be permitted unless there is an alternate load path for the gravity actions supported by that component.
The sharp transition as shown on idealized curves in Figure C2-1 between points C and D can result in computational difficulty and an inability to converge where used as modeling input in nonlinear computerized analysis software. In order to avoid this computational instability, a small slope (10 vertical to 1 horizontal) may be provided to the segment of these curves between points C and D.
For some components it is convenient to prescribe acceptance criteria in terms of deformation (such as or ), while for others it is more convenient to give criteria in terms of deformation ratios. To accommodate this, two types of idealized force vs. deformation curves are used in Figures C2-1 (a) and (b). Figure C2-1(a) shows normalized force (Q/Qy) versus deformation ( or ) and the parameters a, b, and c. Figure C2-1(b) shows normalized force (Q/Qy) versus deformation ratio ( / y, / y, or
/h) and the parameters d, e, and c. Elastic stiffnesses and values for the parameters a, b, c, d, and e that can be used for modeling components are given in Chapters 5 through 8. Acceptance criteria for deformation or deformation ratios for primary components (P) and secondary components (S) corresponding to the target Building Performance Levels of Collapse Prevention (CP), Life Safety (LS), and Immediate Occupancy (IO) as shown in Figure 2-1(c) are given in Chapters 5 through 8.
Figure 2-3 Component Force Versus Deformation Curves
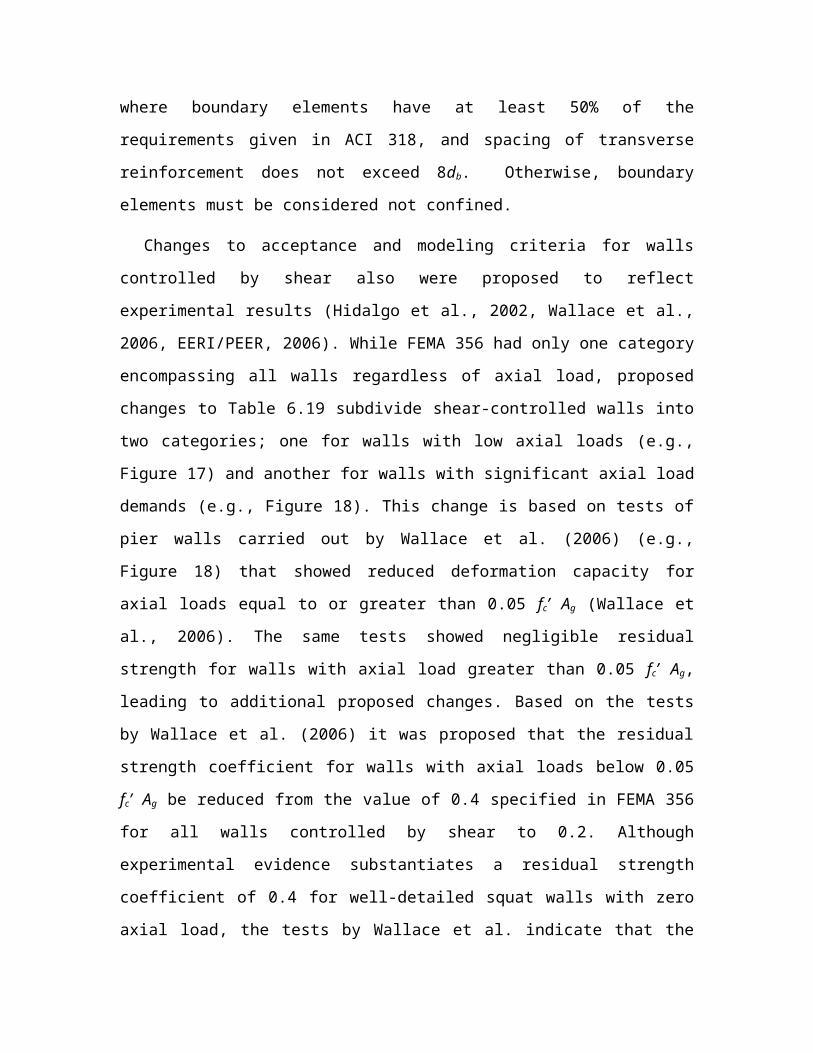
2.8 Alternative Modeling Parameters and Acceptance Criteria
For elements, components, systems, and materials for which structural modeling parameters and acceptance criteria are not provided in this standard, or for cases where such information is provided but more building specific information is desired, it shall be permitted to derive the required parameters and acceptance criteria using the experimentally obtained cyclic response characteristics of the subassembly, determined in accordance with this section. Approved independent review of this process shall be conducted.
2.8.1 Experimental Setup
Where relevant data on the inelastic force-deformation behavior for a structural subassembly are not available, or more relevant data are needed for a building specific condition, such data shall be obtained from experiments consisting of physical tests of representative subassemblies as specified in this section. Each subassembly shall be an identifiable portion of the structural element or component, the stiffness of which is required to be modeled as part of the structural analysis process. The objective of the experiment shall be to estimate the lateral-force-displacement relationships (stiffness) for the subassemblies at different loading increments, together with the strength and deformation capacities for the desired Structural Performance Levels. These properties shall be used in developing an analytical model of the structure to calculate its response to earthquake ground shaking and other hazards, and in developing acceptance criteria for strength and deformations. The limiting strength and deformation capacities shall be determined from the experimental program using the average values of a minimum of three tests performed for the same design configuration and test conditions.
The experimental setup shall replicate the construction details, support and boundary conditions, and loading conditions expected in the building. The loading shall consist of fully reversed cyclic loading at increasing displacement levels with the number of cycles and displacement levels based on expected response of the structure to the design earthquake. Increments shall be continued until the subassembly exhibits complete failure, characterized by the loss of lateral- and vertical-load resistance.
2.8.2 Data Reduction and Reporting
A report shall be prepared for each experiment. The report shall include the following:
1. Description of the subassembly being tested.
2. Description of the experimental setup, including:
2.1. Details on fabrication of the subassembly,
2.2. Location and date of testing,
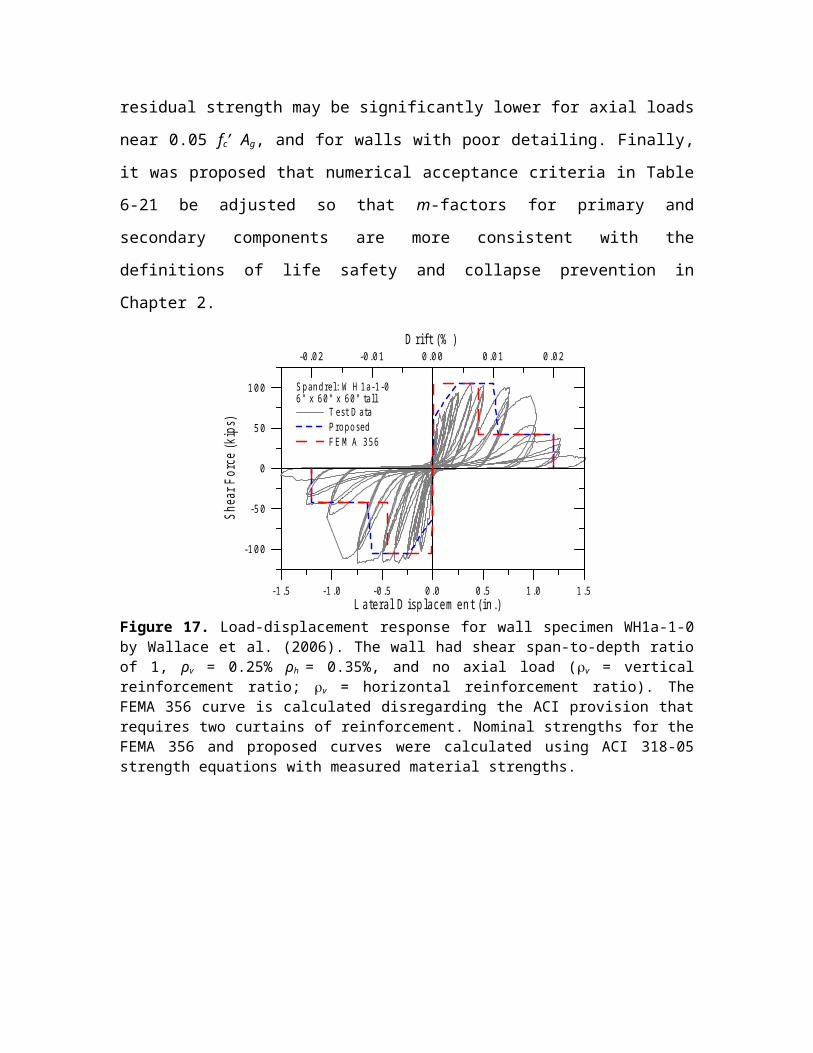
2.3. Description of instrumentation employed,
2.4. Name of the person in responsible charge of the test, and
2.5. Photographs of the specimen, taken prior to testing.
3. Description of the loading protocol employed, including:
3.1. Increment of loading (or deformation) applied,
3.2. Rate of loading application, and
3.3. Duration of loading at each stage.
4. Description, including photographic documentation, and limiting deformation value for all important behavior states observed during the test, including the following, as applicable:
4.1. Elastic range with effective stiffness reported,
4.2. Plastic range,
4.3. Onset of visible damage,
4.4. Loss of lateral-force-resisting capacity,
4.5. Loss of vertical-force-resisting capacity,
4.6. Force-deformation plot for the subassembly (noting the various behavior states), and
4.7. Description of limiting behavior states defined as the onset of specific damage mode, change in stiffness or behavior (such as initiation of cracking or yielding) and failure modes.
2.8.3 Design Parameters and Acceptance Criteria
The following procedure shall be followed to develop structural modeling parameters and acceptance criteria for subassemblies based on experimental data.
1. An idealized lateral-force-deformation pushover curve shall be developed from the experimental data for each experiment and for each direction of loading with unique behavior. The curve shall be plotted in a single quadrant (positive force versus positive deformation, or negative force versus negative deformation). In cases where deformation components (e.g., flexure, shear) are modeled separately, test instrumentation must be provided to enable force-deformation curves for each
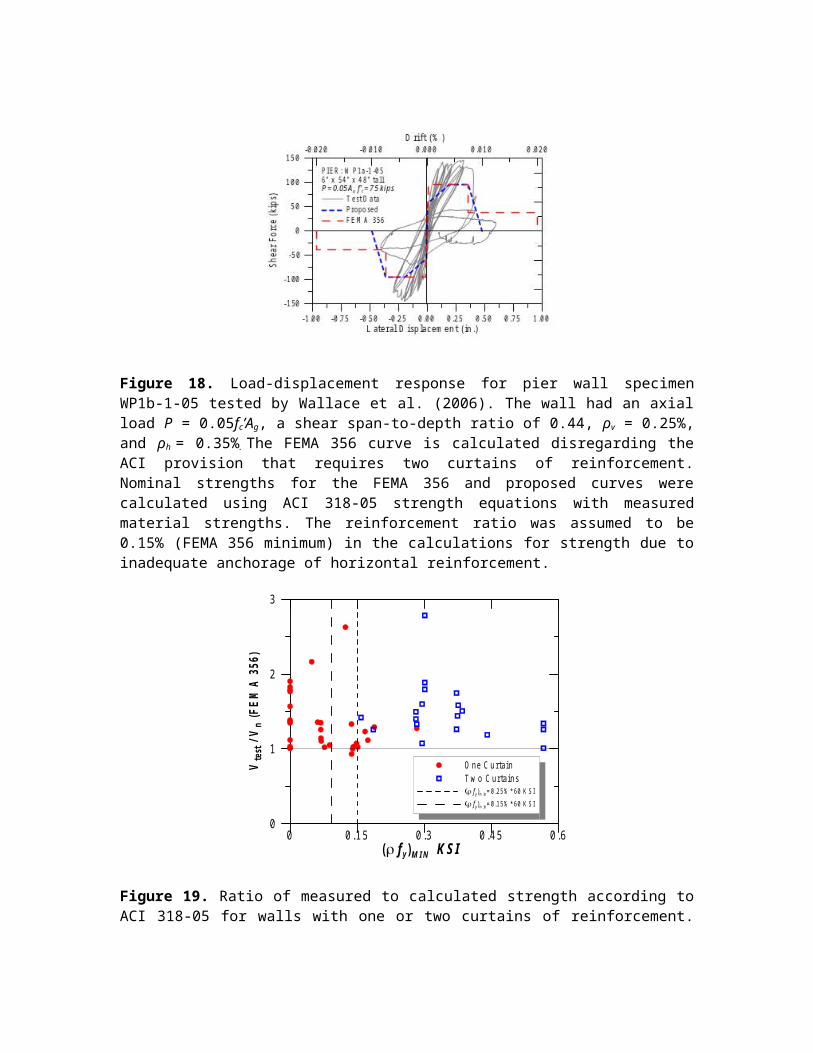
deformation component to be derived from the overall test force-deformation relations. The curves shall be constructed as follows:
1.1. The appropriate quadrant of data shall be taken from the lateral-force-deformation plot from the experimental report.
1.2. A smooth "backbone" curve shall be drawn through each point of peak displacement during the first cycle of each increment of loading (or deformation)the intersection of the first cycle curve for the (i)th deformation step with the second cycle curve of the (i-1)th deformation step, for all i steps, as indicated in Figure 2-4.
1.3. The backbone curve so derived shall be approximated by a series of linear segments, drawn to form a multi-segmented curve conforming to one of the types indicated in Figure 2-3.
2. The multilinear curves derived for all experiments involving the subassembly shall be compared and an average multilinear representation of the subassembly behavior shall be derived based on these curves. Each segment of the composite curve shall be assigned the average stiffness (either positive or negative) of the similar segments in the multilinear curves for the various experiments. Each segment on the composite curve shall terminate at the average of the deformation levels at which the similar segments of the multilinear curves for the various experiments terminate.
3. The stiffness of the subassembly for use in linear procedures shall be taken as the slope of the first segment of the composite curve. The composite multilinear force-deformation curve shall be used for modeling in nonlinear procedures.
4. For the purpose of determining acceptance criteria, subassembly actions shall be classified as being either force-controlled or deformation-controlled. Subassembly actions shall be classified as force-controlled unless any of the following apply.
4.1. The full backbone curve including strength degradation and residual strength is modeled; the composite multilinear force-deformation curve for the subassembly, determined in accordance with requirements in paragraph 2 above, conforms to either Type 1, or Type 2, or Type 3 as indicated in Figure 2-3; and the deformation parameter d is at least twice the deformation parameter g.
4.2 Bilinear modeling is performed in accordance with the simplified NSP procedure of Section 3.3.3.2.2; the composite multilinear force-deformation curve for the subassembly, determined in accordance with requirements in paragraph 2 above, conforms to either Type 1 or Type 2, as indicated in Figure 2-3; and the deformation parameter e is at least twice the deformation parameter g.
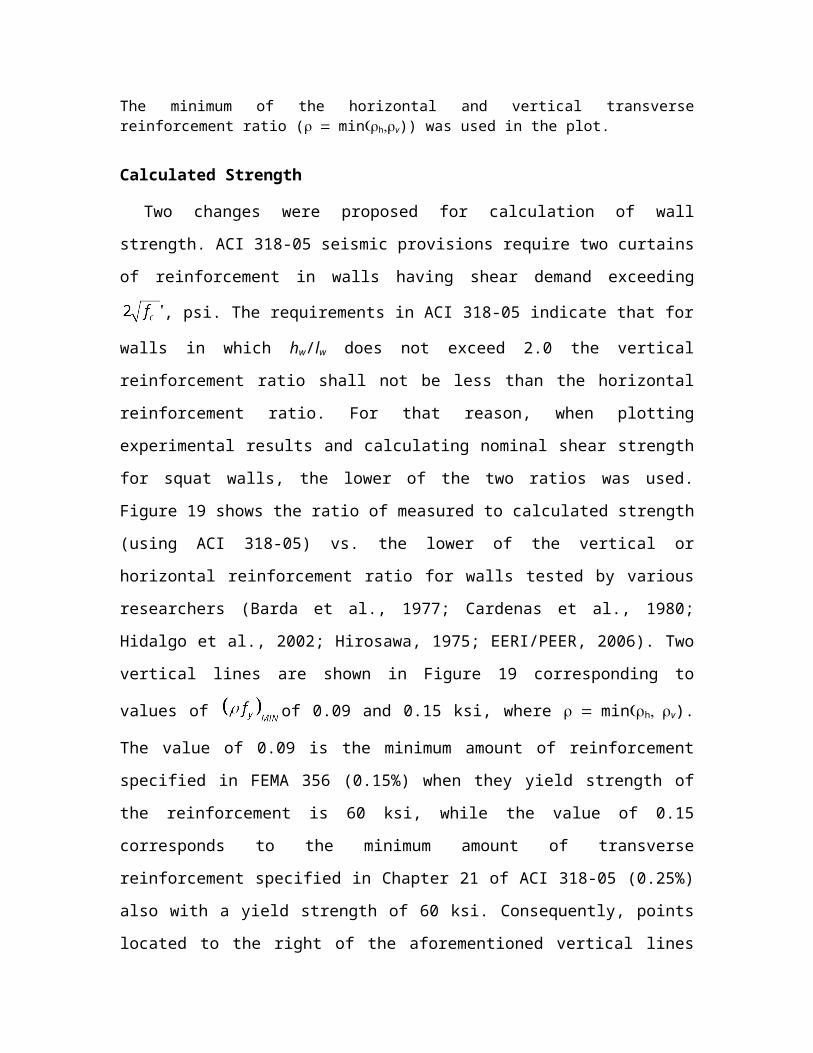
4.3 Secondary components in which the composite multilinear force-deformation curve for the subassembly, determined in accordance with requirements in paragraph 2 above, conforms to Type 1, as indicated in Figure 2-3.
5. The strength capacity, QCL, for force-controlled actions evaluated using either the linear or nonlinear procedures shall be taken as the mean minus one standard deviation strength Qy determined from the series of representative subassembly tests.
6. The acceptance criteria for deformation-controlled actions used in nonlinear procedures shall be the deformations corresponding with the following points on the curves of Figure 2-3:
6.1 Immediate Occupancy
The deformation at which permanent, visible damage occurred in the experiments but not greater than 0.67 times the deformation limit for Life Safety specified in 6.2.1.
6.2 Primary Components
- 6.2.1 Life Safety: 0.75 times the deformation at point 2 on the curves.
- 6.2.2 Collapse Prevention: The deformation at point 2 on the curves but not greater than 0.75 times the deformation at point 3.
6.3 Secondary Components
- 6.3.1 Life Safety: 0.75 times the deformation at point 3.
- 6.3.2 Collapse Prevention: 1.0 times the deformation at point 3 on the curve.
7. The m-factors used as acceptance criteria for deformation-controlled actions in linear procedures shall be determined as follows: (a) obtain the deformation acceptance criteria given in paragraph 6 above; (b) then obtain the ratio of this deformation to the deformation at yield, represented by the deformation parameter g in the curves shown in Figure 2-3; (c) then multiply this ratio by a factor 0.75 to obtain the acceptable m-factor.
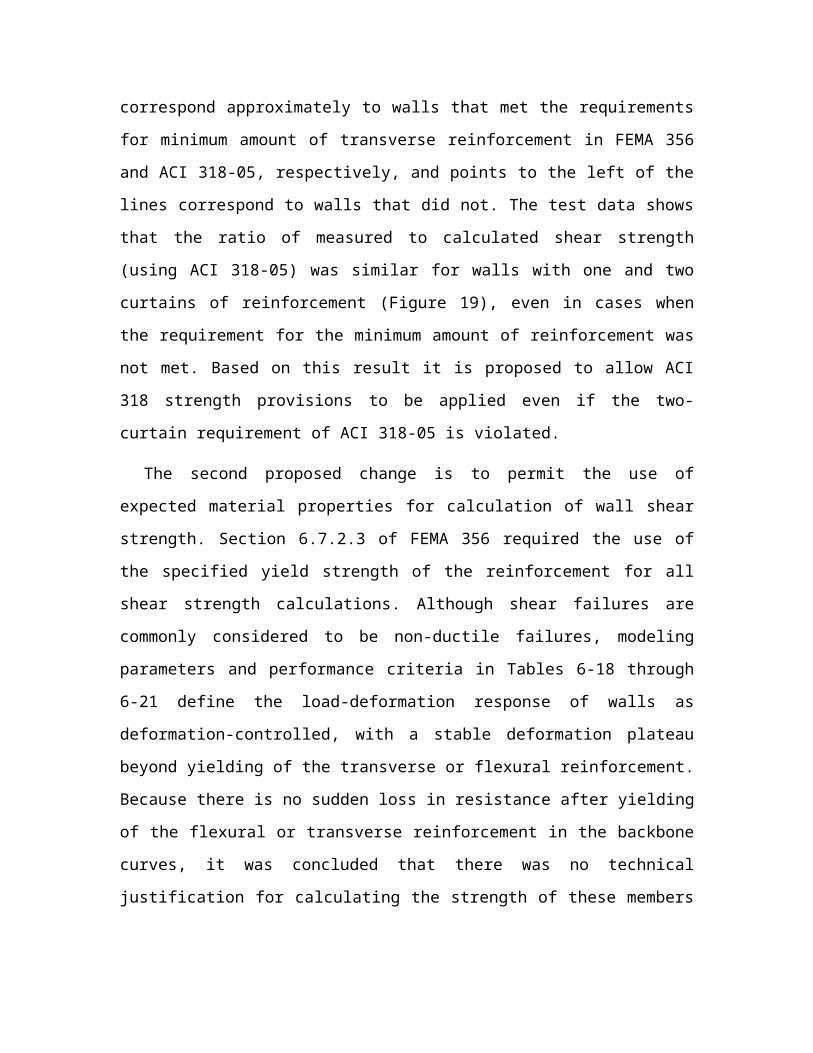
Figure 2-4 Backbone Curve for Experimental Data
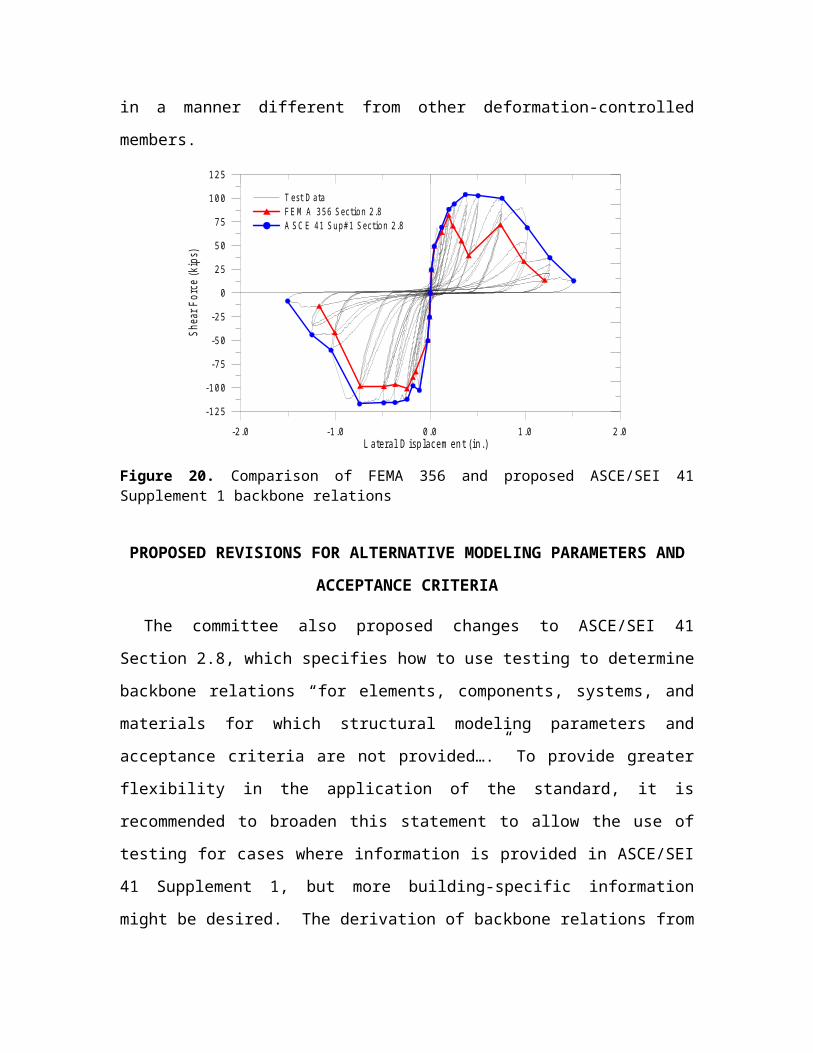
APPENDIX B: PROPOSED REVISIONS TO ASCE/SEI 41 CHAPTER 6
6.0 Concrete
6.1 Scope
This chapter sets forth requirements for the Systematic Rehabilitation of concrete components of the lateral-force-resisting system of an existing building. The requirements of this chapter shall apply to existing concrete components of a building system, rehabilitated concrete components of a building system, and new concrete components that are added to an existing building system. The provisions of this chapter do not apply to concrete encased steel composite components.
Section 6.2 specifies data collection procedures for obtaining material properties and performing condition assessments. Section 6.3 specifies general analysis and design requirements for concrete components. Sections 6.4, 6.5, 6.6, 6.7, 6.8, and 6.9 provide modeling procedures, component strengths, acceptance criteria, and rehabilitation measures for concrete and precast concrete moment frames, braced frames, and shear walls. Sections 6.10, 6.11, and 6.12 provide modeling procedures, strengths, acceptance criteria, and rehabilitation measures for concrete diaphragms and concrete foundation systems.
C6.1 Scope
Techniques for repair of earthquake-damaged concrete components are not included in this standard. The design professional is referred to FEMA 306, FEMA 307, and FEMA 308 for information on evaluation and repair of damaged concrete wall components.
Concrete encased steel composite components frequently behave as over-reinforced sections. This type of component behavior was not represented in the data sets used to develop the force-deformation modeling relationships and acceptance criteria in Chapter 6. Further, the concrete encasement is often provided for fire protection rather than for strength or stiffness, and typically lacks confinement reinforcement or the confinement reinforcement does not meet detailing requirements in the AISC Code (AISC 2005). The lack of adequate confinement may result in large dilation strains which exacerbate bond slip and, consequently, undermine the fundamental principle that plane sections remain plane.
The testing and rational analysis used to determine acceptance criteria for concrete encased steel composite components should include the effect of bond slip between steel and concrete, confinement ratio, confinement reinforcement detailing, kinematics, and appropriate strain limits.
6.2 Material Properties and Condition Assessment
No changes proposed for this section
6.3 General Assumptions and Requirements
6.3.1 Modeling and Design
6.3.1.1 General Approach
Seismic rehabilitation of concrete structural components of existing buildings shall comply with the requirements of ACI 318, except as otherwise indicated in this standard. Seismic evaluation shall identify brittle or low-ductility failure modes of force-controlled actions as defined in Section 2.4.4.
Evaluation of demands and capacities of reinforced concrete components shall include consideration of locations along the length where lateral and gravity loads produce maximum effects, where changes in cross-section or reinforcement result in reduced strength, and where abrupt changes in cross section or reinforcement, including splices, may produce stress concentrations, resulting in premature failure.
C6.3.1.1 General Approach
Brittle or low-ductility failure modes typically include behavior in direct or nearly-direct compression, shear in slender components and in component connections, torsion in slender components, and reinforcement development, splicing, and anchorage. It is recommended that the stresses, forces, and moments acting to cause these failure modes be determined from a limit-state analysis considering probable resistances at locations of nonlinear action.
6.3.1.2 Stiffness
Component stiffnesses shall be calculated considering shear, flexure, axial behavior and reinforcement slip deformations. Consideration shall be given to the state of stress on the component, the extent of cracking due to volumetric changes from temperature and shrinkage, and to deformation levels to which the component will be subjected under gravity and earthquake loading.
Table 6-5 Effective Stiffness Values Component Flexural Rigidity Shear Rigidity Axial Rigidity [Refer to end of chapter]
C6.3.1.2 Stiffness
For columns with low axial loads, deformations due to bar slip can account for as much as 50% of the total deformations at yield. The design professional is referred to Elwood and Eberhard (2006) for further guidance regarding calculation of effective stiffness of reinforced concrete columns to include the effects of flexure, shear and bar slip.
6.3.1.2.1 Linear Procedures
Where design actions are determined using the linear procedures of Chapter 3, component effective stiffnesses shall correspond to the secant value to the yield point of the component. The use of higher stiffnesses shall be permitted where it is demonstrated by analysis to be appropriate for the design loading. Alternatively, the use of effective stiffness values in Table 6-5 shall be permitted.
C6.3.1.2.1 Linear Procedures
The effective flexural rigidity values given in Table 6-5 for beams and columns account for the additional flexibility resulting from reinforcement slip within the beam-column joint or foundation prior to yielding. The values specified for columns were determined based on a database of 221 rectangular reinforced concrete column tests with axial loads less than 0.67Agfc’ and shear span-to-depth ratios greater than 1.4. Measured effective stiffnesses from the laboratory test data suggest that the effective flexural rigidity for low axial loads could be approximated as 0.2 EIg; however, considering the scatter in the effective flexural rigidity and to avoid under-estimating the shear demand on columns with low axial loads, 0.3 EIg is recommended in Table 6-5. In addition to axial load, the shear span-to-depth ratio of the column influences the effective flexural rigidity. A more refined estimate of the effective flexural rigidity can be determined by calculating the displacement at yield due to flexure, slip, and shear (Elwood and Eberhard, 2006).
Note that the modeling recommendations for beam-column joints (section 6.4.2.2.1) do not include the influence of reinforcement slip. When the effective stiffness values for beams and columns from Table 6-5 are used in combination with the modeling recommendations for beam-column joints, the overall stiffness is in close agreement with results from beam-column subassembly tests.
The effect of reinforcement slip can be accounted for by including rotational springs at the ends of the beam or column elements (Saatcioglu et al. 1992). If this modeling option is selected, the effective flexural rigidity of the column element should reflect only the flexibility due to flexural deformations. In this case, for axial loads less than 0.3 Agfc’, the effective flexural rigidity can be estimated as 0.5EIg, with linear interpolation to the value given in Table 6-5 for axial loads greater than 0.5 Agfc’.
Components with plain longitudinal reinforcement (without deformations) and axial loads less than 0.5 Agfc’ may have lower effective flexural rigidity values than those given in Table 6-5 due to the low bond stress between the concrete and steel.
6.3.1.2.2 Nonlinear Procedures
Where design actions are determined using the nonlinear procedures of Chapter 3, component load-deformation response shall be represented by nonlinear load-deformation relations. Linear relations shall be permitted where nonlinear response will
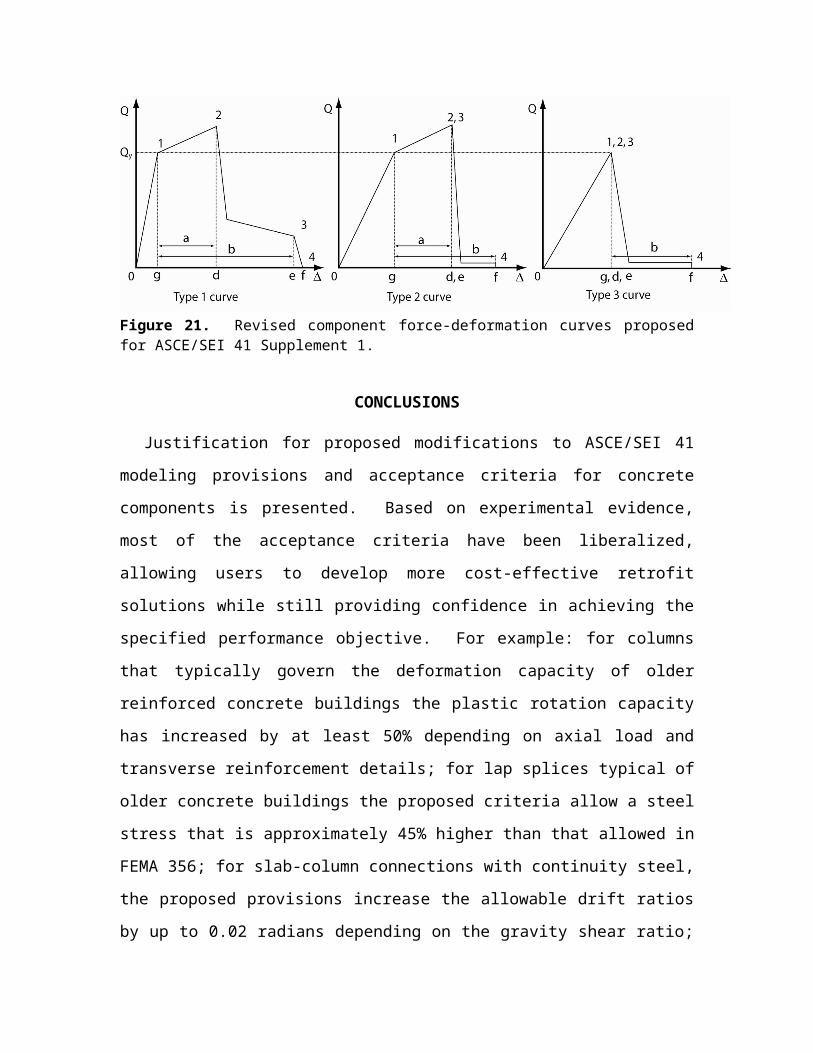
not occur in the component. The nonlinear load-deformation relation shall be based on experimental evidence or taken from quantities specified in Sections 6.4 through 6.12. For the Nonlinear Static Procedure (NSP), use of the generalized load-deformation relation shown in Figure 6-1 or other curves defining behavior under monotonically increasing deformation shall be permitted. For the Nonlinear Dynamic Procedure (NDP), load-deformation relations shall define behavior under monotonically increasing lateral deformation and under multiple reversed deformation cycles as specified in Section 6.3.2.1.
The generalized load-deformation relation shown in Figure 6-1 shall be described by linear response from A (unloaded component) to an effective yield B, then a linear response at reduced stiffness from point B to C, then sudden reduction in lateral load resistance to point D, then response at reduced resistance to E, and final loss of resistance thereafter. The slope from point A to B shall be determined according to Section 6.3.1.2.1. The slope from point B to C, ignoring effects of gravity loads acting through lateral displacements, shall be taken between zero and 10% of the initial slope unless an alternate slope is justified by experiment or analysis. Point C shall have an ordinate equal to the strength of the component and an abscissa equal to the deformation at which significant strength degradation begins. Representation of the load-deformation relation by points A, B, and C only (rather than all points A-E), shall be permitted if the calculated response does not exceed point C. Numerical values for the points identified in Figure 6-1 shall be as specified in Sections 6.4 through 6.12. Other load-deformation relations shall be permitted if justified by experimental evidence or analysis.
Figure 6-1 Generalized Force-Deformation Relations for Concrete Elements or Components [Refer to end of chapter]
C6.3.1.2.2 Nonlinear Procedures
Typically, the responses shown in Figure 6-1 are associated with flexural response or tension response. In this case, the resistance at Q/Qy = 1.0 is the yield value, and subsequent strain hardening accommodates strain hardening in the load-deformation relation as the member is deformed toward the expected strength. Where the response shown in Figure 6-1 is associated with compression, the resistance at Q/Qy = 1.0 typically is the value at which concrete begins to spall, and strain hardening in well-confined sections may be associated with strain hardening of the longitudinal reinforcement and the confined concrete. Where the response shown in Figure 6-1 is associated with shear, the resistance at Q/Qy = 1.0 typically is the value at which the design shear strength is reached, and no strain hardening follows.
The deformations used for the load-deformation relation of Figure 6-1 shall be defined in one of two ways, as follows:
(a) Deformation, or Type I In this curve, deformations are expressed directly using terms such as strain, curvature, rotation, or elongation. The parameters a and b shall
refer to those portions of the deformation that occur after yield; that is, the plastic deformation. The parameter c is the reduced resistance after the sudden reduction from C to D. Parameters a, b, and c are defined numerically in various tables in this chapter. Alternatively, it shall be permitted to determine the parameters a, b, and c directly by analytical procedures justified by experimental evidence.
(b) Deformation Ratio, or Type II In this curve, deformations are expressed in terms such as shear angle and tangential drift ratio. The parameters d and e refer to total deformations measured from the origin. Parameters c, d, and e are defined numerically in various tables in this chapter. Alternatively, it shall be permitted to determine the parameters c, d, and e directly by analytical procedures justified by experimental evidence.
Provisions for determining alternative modeling parameters and acceptance criteria based on experimental evidence are given in Section 2.8.
Displacement demands determined from nonlinear dynamic analysis are very sensitive to the rate of strength degradation included in the structural model. Unless there is experimental evidence of sudden strength loss for the particular component under consideration, use of a model with a sudden strength loss from point C to D in Figure 6-1 can result in an overestimation of the drift demands for a structural system and individual components. A more realistic model for many concrete components would have a linear degradation in resistance from point C to point E.
It is also noted that strength loss which occurs within a single cycle can result in dynamic instability of the structure, while strength loss which occurs between cycles is unlikely to cause such instability. The model shown in Figure 6-1 does not distinguish between these types of strength degradation, and may not accurately predict the displacement demands if the two forms of strength degradation are not properly accounted for.
6.3.1.3 Flanged Construction
In beams consisting of a web and flange that act integrally, the combined stiffness and strength for flexural and axial loading shall be calculated considering a width of effective flange on each side of the web equal to the smaller of: (1) the provided flange width, (2) eight times the flange thickness, (3) half the distance to the next web, or (4) one-fifth of the span for beams. Where the flange is in compression, both the concrete and reinforcement within the effective width shall be considered effective in resisting flexure and axial load. Where the flange is in tension, longitudinal reinforcement within the effective width and that is developed beyond the critical section shall be considered fully effective for resisting flexural and axial loads. The portion of the flange extending beyond the width of the web shall be assumed ineffective in resisting shear.
In walls, effective flange width shall be in accordance with Chapter 21 of ACI 318.
6.3.2 Strength and Deformability
6.3.2.1 General
Actions in a structure shall be classified as being either deformation-controlled or force-controlled, as defined in Section 2.4.4. Design strengths for deformation-controlled and force-controlled actions shall be calculated in accordance with Sections 6.3.2.2 and 6.3.2.3, respectively.
Components shall be classified as having low, moderate, or high ductility demands according to Section 6.3.2.4.
Where strength and deformation capacities are derived from test data, the tests shall be representative of proportions, details, and stress levels for the component and comply with requirements specified in Section 2.8.1.
The strength and deformation capacities of concrete members shall correspond to values resulting from earthquake loadings involving three fully reversed cycles to the design deformation level unless a larger or smaller number of deformation cycles is determined considering earthquake duration and the dynamic properties of the structure.
C6.3.2.1 General
Strengths and deformation capacities given in this chapter are for earthquake loadings involving three fully reversed deformation cycles to the design deformation levels, in addition to similar cycles to lesser deformation levels. In some cases-including some short-period buildings and buildings subjected to a long-duration design earthquake-a building may be expected to be subjected to additional cycles to the design deformation levels. The increased number of cycles may lead to reductions in resistance and deformation capacity. The effects on strength and deformation capacity of additional deformation cycles should be considered in design. Large earthquakes will cause additional cycles.
6.3.2.2 Deformation-Controlled Actions
Strengths used for deformation-controlled actions shall be taken as equal to expected strengths, QCE, obtained experimentally, or calculated using accepted principles of mechanics. Expected strength is defined as the mean maximum resistance expected over the range of deformations to which the concrete component is likely to be subjected. Where calculations are used to define expected strength, expected material properties shall be used. Unless other procedures are specified in this standard, procedures specified in ACI 318 to calculate design strengths shall be permitted except that the strength reduction factor, f shall be taken equal to unity. Deformation capacities for acceptance of deformation-controlled actions calculated by nonlinear procedures shall be as specified in Sections 6.4 to Section 6.12. For components constructed of lightweight concrete, QCE shall be modified in accordance with ACI 318 procedures for lightweight concrete.
C6.3.2.2 Deformation-Controlled Actions
Expected yield strength of reinforcing steel, as specified in this standard, includes consideration of material overstrength and strain hardening.
6.3.2.3 Force-Controlled Actions
Strengths used for force-controlled actions shall be taken as lower-bound strengths, QCL, obtained experimentally, or calculated using established principles of mechanics. Lower-bound strength is defined as the mean minus one standard deviation of resistance expected over the range of deformations and loading cycles to which the concrete component is likely to be subjected. Where calculations are used to define lower-bound strengths, lower-bound estimates of material properties shall be used. Unless other procedures are specified in this standard, procedures specified in ACI 318 to calculate design strengths shall be permitted, except that the strength reduction factor, f, shall be taken equal to unity. For components constructed of lightweight concrete, QCL shall be modified in accordance with ACI 318 procedures for lightweight concrete.
6.3.2.4 Component Ductility Demand Classification
Where procedures in this chapter require classification of component ductility demand, components shall be classified as having low, moderate, or high ductility demands, based on the maximum value of the demand capacity ratio (DCR) defined in Section 2.4.1 for linear procedures, or the calculated displacement ductility for nonlinear procedures in accordance with Table 6-6.
Table 6-6 Component Ductility Demand Classification [Refer to end of chapter]
6.3.3 Flexure and Axial Loads
Flexural strength and deformation capacity of members with and without axial loads shall be calculated according to the procedures of ACI 318 or by other approved methods. Strengths and deformation capacities of components with monolithic flanges shall be calculated considering concrete and developed longitudinal reinforcement within the effective flange width as defined in Section 6.3.1.3.
Strength and deformation capacities shall be determined considering available development of longitudinal reinforcement. Where longitudinal reinforcement has embedment or development length that is insufficient for development of reinforcement strength, flexural strength shall be calculated based on limiting stress capacity of the embedded bar as defined in Section 6.3.5.
Where flexural deformation capacities are calculated from basic principles of mechanics, reductions in deformation capacity due to applied shear shall be taken into consideration. Where using analytical models for flexural deformability that do not directly consider
effect of shear, and where design shear equals or exceeds , where f ′c is in psi and Aw is gross area of web in square inches, the design value shall not exceed eighty percent of the value calculated using the analytical model.
For concrete columns under combined axial load and biaxial bending, the combined strength shall be evaluated considering biaxial bending. Where using linear procedures, the design axial load, PUF, shall be calculated as a force-controlled action in accordance with Section 3.4. The design moments, MUD, shall be calculated about each principal axis in accordance with Section 3.4. Acceptance shall be based on the following equation:
(6-1)
where:
MUDx = design bending moment about x axis for axial load PUF, kip-in.
MUDy = design bending moment about y axis for axial load PUF, kip-in.
MCEx = expected bending moment strength about x axis, kip-in.
MCEy = expected bending moment strength about y axis, kip-in.
mx = m-factor for column for bending about x axis in accordance with Table 6-12
my = m-factor for column for bending about y axis in accordance with Table 6-12
Alternative approaches based on principles of mechanics shall be permitted.
C6.3.3 Flexure and Axial Loads
Laboratory tests indicate that flexural deformability may be reduced as co-existing shear forces increase. As flexural ductility demands increase, shear capacity decreases, which may result in a shear failure before theoretical flexural deformation capacities are reached. Caution should be exercised where flexural deformation capacities are determined by calculation. FEMA 306 is a resource for guidance regarding the interaction between shear and flexure.
6.3.3.1 Usable Strain Limits
Without confining transverse reinforcement, the maximum usable strain at the extreme concrete compression fiber shall not exceed 0.002 for components in nearly pure compression and 0.005 for other components unless larger strains are substantiated by experimental evidence and approved by the authority having jurisdiction. Maximum usable compressive strains for confined concrete shall be based on experimental evidence and shall consider limitations posed by fracture of transverse reinforcement, buckling of
longitudinal reinforcement, and degradation of component resistance at large deformation levels. Maximum compressive strains in longitudinal reinforcement shall not exceed 0.02, and maximum tensile strains in longitudinal reinforcement shall not exceed 0.05. Monotonic test results shall not be used to determine reinforcement strain limits. If experimental evidence is used to determine strain limits, the effects of spacing and size of transverse reinforcement and of low-cycle fatigue shall be included in the testing procedures, and results are subject to the approval of the authority having jurisdiction.
C6.3.3.1 Usable Strain LimitsThe reinforcement tensile strain limit is based on consideration of the effects of material properties and low-cycle fatigue. Low-cycle fatigue is influenced by spacing and size of transverse reinforcement and by strain history. Using extrapolated monotonic test results to develop tensile strains greater than those specified above is not recommended. The Caltrans Seismic Design Criteria (Caltrans 1999) recommends an ultimate tensile strain of 0.09 for #10 bars and smaller and 0.06 for #11 bars and larger, for ASTM A706 (Grade 60). A lower bound is selected here considering the variability in materials and details seen in existing structures.
6.3.4 Shear and Torsion
Strengths in shear and torsion shall be calculated according to ACI 318 except as modified in this standard.
Within yielding regions of components with moderate or high ductility demands, shear and torsional strength shall be calculated according to procedures for ductile components, such as the provisions in Chapter 21 of ACI 318. Within yielding regions of components with low ductility demands and outside yielding regions for all ductility demands, calculation of design shear strength using procedures for effective elastic response such as the provisions in Chapter 11 of ACI 318 shall be permitted.
Where the longitudinal spacing of transverse reinforcement exceeds half the component effective depth measured in the direction of shear, transverse reinforcement shall be assumed not more than 50% effective in resisting shear or torsion. Where the longitudinal spacing of transverse reinforcement exceeds the component effective depth measured in the direction of shear, transverse reinforcement shall be assumed ineffective in resisting shear or torsion. For beams and columns, in which perimeter hoops are either lap-spliced or have hooks that are not adequately anchored in the concrete core, transverse reinforcement shall be assumed not more than 50% effective in regions of moderate ductility demand and shall be assumed ineffective in regions of high ductility demand.
Shear friction strength shall be calculated according to ACI 318, taking into consideration the expected axial load due to gravity and earthquake effects. Where rehabilitation involves the addition of concrete requiring overhead work with dry-pack, the shear friction coefficient µ shall be taken as equal to 70% of the value specified by ACI 318.
6.3.5 Development and Splices of Reinforcement
Development of straight bars, hooked bars, and lap-spliced bars shall be calculated according to the provisions of ACI 318, with the following modifications:
1. Deformed straight bars, hooked bars, and lap-spliced bars shall meet the development requirements of Chapter 12 of ACI 318 except requirements for lap splices shall be the same as those for straight development of bars in tension without consideration of lap splice classifications.
2. Where existing deformed straight bars, hooked bars, and lap-spliced bars do not meet the development requirements of (1) above, the capacity of existing reinforcement shall be calculated using Equation (6-2):
(6-2)
but shall not exceed the expected or lower-bound yield strength, as applicable. In equation 6-2, where fs = maximum stress that can be developed in the bar for the straight development, hook development, or lap splice length lb provided; fy = lower bound yield strength of reinforcement; and ld = length required by Chapter 12 of ACI 318 for straight development, hook development, or lap splice length, except that required splice lengths may be taken as straight bar development lengths in tension. Where transverse reinforcement is distributed along the development length with spacing not exceeding one-third of the effective depth of the component, it shall be permitted to assume the reinforcement retains the calculated maximum stress to high ductility demands. For larger spacings of transverse reinforcement, the developed stress shall be assumed to degrade from fs at a ductility demand or DCR equal to 1.0 to 0.2fs at a ductility demand or DCR equal to 2.0.
3. Strength of deformed straight, discontinuous bars embedded in concrete sections or beam-column joints, with clear cover over the embedded bar not less than 3db, shall be calculated according to Equation (6-3):
(6-3)
where fs = maximum stress (in psi) that can be developed in an embedded bar having embedment length le (in inches), db = diameter of embedded bar (in inches), and fy = bar yield stress (in psi). Where fs is less than fy, and the calculated stress in the bar due to design loads equals or exceeds fs, the maximum developed stress shall be assumed to degrade from fs to 0.2fs at a ductility demand or DCR equal to 2.0. In beams with short bottom bar embedments into beam-column joints, flexural strength shall be calculated considering the stress limitation of Equation (6-3).
4. For plain straight bars, hooked bars, and lap-spliced bars, development and splice lengths shall be taken as twice the values determined in accordance with ACI 318 unless other lengths are justified by approved tests or calculations considering only the chemical bond between the bar and the concrete.
5. Doweled bars added in seismic rehabilitation shall be assumed to develop yield stress where all the following conditions are satisfied:
5.1 Drilled holes for dowel bars are cleaned with a stiff brush that extends the length of the hole.
5.2. Embedment length le is not less than 10db
5.3 Minimum spacing of dowel bars is not less than 4le and minimum edge distance is not less than 2le. Design values for dowel bars not satisfying these conditions shall be verified by test data. Field samples shall be obtained to ensure design strengths are developed in accordance with Section 6.3.
C6.3.5 Development and Splices of Reinforcement
Development requirements in accordance with Chapter 12 of ACI 318 will be applicable to development of bars in all components. Chapter 21 of ACI 318 provides development requirements that are only intended only for use in yielding components of reinforced concrete moment frames that comply with the cover and confinement provisions of Chapter 21. Chapter 12 permits reductions in lengths if minimum cover and confinement exist in an existing component.
Experimental tests by Melek and Wallace (2004) and Lynn (2001) have demonstrated that lap splices can achieve a higher flexural capacity than that calculated using the effective steel stress given in Equation (6-2). The possibility of a shear failure in lap-spliced columns may go undetected if the flexural capacity is underestimated. Cho and Pincheira (2006) suggest an alternative model for the effective steel stress in lap splice bars which provides a better estimate of the mean flexural strength observed in experimental tests. Equation 6-2 is a modified version of the model presented by Cho and Pincheira (2006). Equation 6-2 reflects the intent of the ACI Code development and splice equations to develop 1.25 times the nominal bar strength (referred in this document as the lower bound yield strength). The nonlinear relation between developed stress and development length reflects the effect of increasing slip, hence, reduced unit bond strength, for longer development lengths.
For buildings constructed prior to 1950, the bond strength developed between reinforcing steel and concrete may be less than present-day strength. Current equations for development and splices of reinforcement account for mechanical bond due to deformations present in deformed bars in addition to chemical bond. The length required to develop plain bars will be much greater than that required for deformed bars, and will be more sensitive to cracking in the concrete. Procedures for testing and assessment of
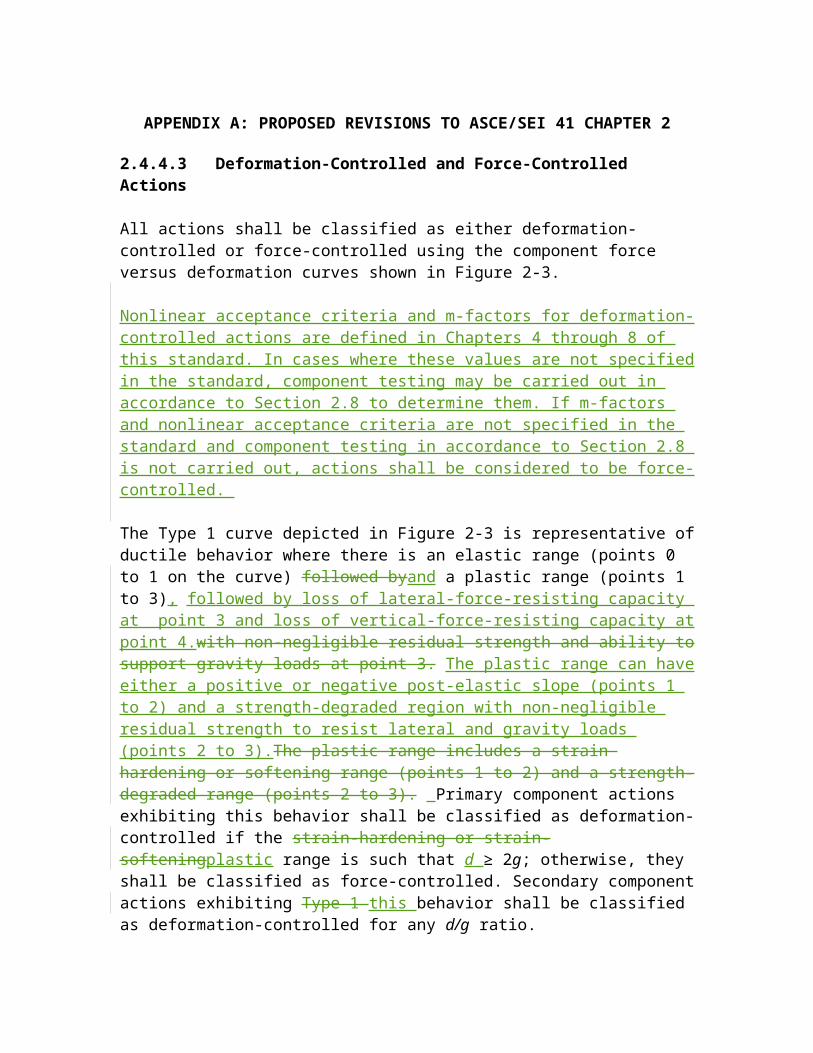
tensile lap splices and development length of plain reinforcing steel may be found in CRSI.
6.3.5.1 Square Reinforcing Bars
Square reinforcing bars in a building shall be classified as either twisted or straight. The developed strength of twisted square bars shall be as specified for deformed bars in Section 6.3.5, using an effective diameter calculated based on the gross area of the square bar. Straight square bars shall be considered as plain bars, and the developed strength shall be as specified for plain bars in Section 6.3.5.
6.3.6 Connections to Existing Concrete
Connections used to connect two or more components shall be classified according to their anchoring systems as cast-in-place or as post-installed.
6.3.6.1 Cast-In-Place Systems
Component actions on cast-in-place connection systems, including shear forces, tension forces, bending moments, and prying actions, shall be considered force-controlled. Lower-bound strength of connections shall be ultimate values as specified in an approved building code with f = 1.0.
The capacity of anchors placed in areas where cracking is expected shall be reduced by a factor of 0.5.
6.3.6.2 Drilled-In Anchors
Component actions on drilled-in anchor connection systems shall be considered force-controlled. The lower-bound capacity of drilled-in anchors shall be mean minus one standard deviation of ultimate values published in approved test reports.
6.3.6.3 Quality Assurance
Connections between existing concrete components and new components added to rehabilitate the structure shall be subject to the quality assurance provisions specified in Section 2.7. The design professional shall specify the required inspection and testing of cast-in-place and post-installed anchors as part of the Quality Assurance Plan.
6.3.7 Rehabilitation-General Requirements
Upon determining that concrete components in an existing building are deficient for the selected Rehabilitation Objective, these components shall be rehabilitated or replaced or the structure shall be otherwise rehabilitated so that the component is no longer deficient for the selected rehabilitation objective. If replacement of the component is selected, the new component shall be designed in accordance with this standard and detailed and
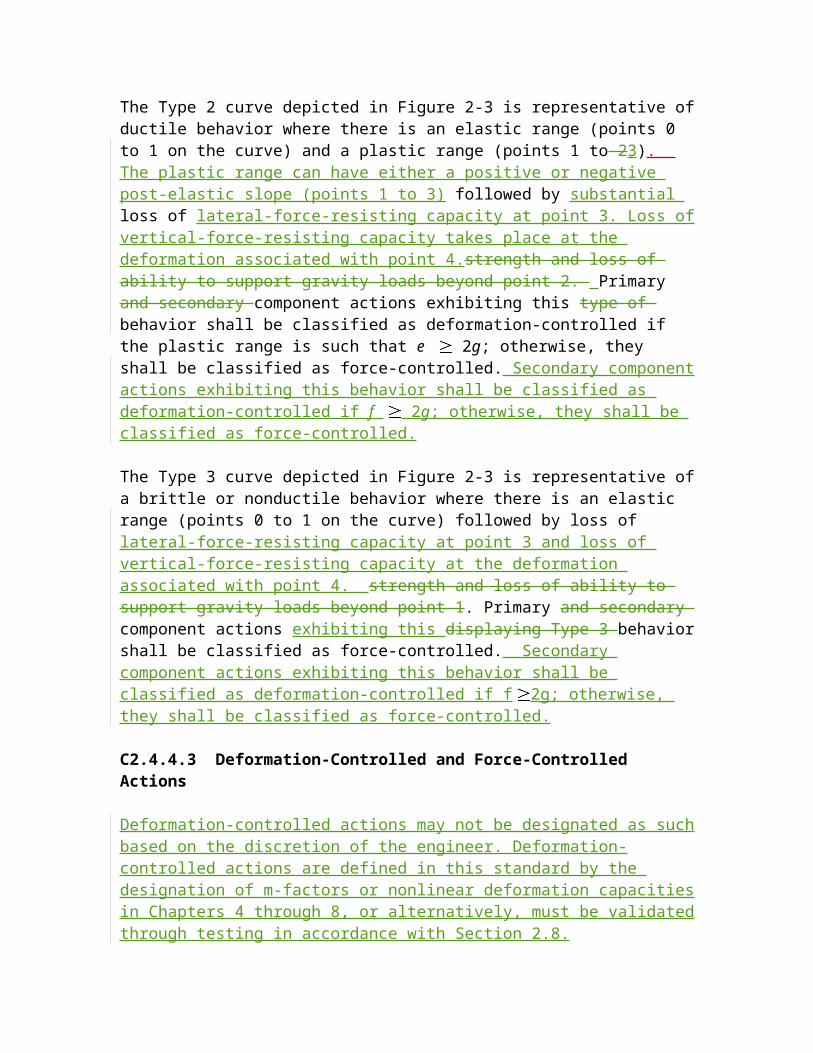
constructed in accordance with a building code approved by the authority having jurisdiction.
Rehabilitation measures shall be evaluated in accordance with the requirements of this standard, to assure that the completed rehabilitation achieves the selected Rehabilitation Objective. The effects of rehabilitation on stiffness, strength, and deformability shall be taken into account in an analytical model of the rehabilitated structure. The compatibility of new and existing components shall be checked at displacements consistent with the selected performance level.
Connections required between existing and new components shall satisfy the requirements of Section 6.3.6 and other requirements of this standard.
6.4 Concrete Moment Frames
6.4.1 Types of Concrete Moment Frames
Concrete moment frames shall be defined as elements comprising primarily horizontal framing components (beams and/or slabs), vertical framing components (columns) and joints connecting horizontal and vertical framing components. These elements resist lateral loads acting alone, or in conjunction with shear walls, braced frames, or other elements.
Frames that are cast monolithically, including monolithic concrete frames created by the addition of new material, shall meet the provisions of this section. Frames covered under this section include reinforced concrete beam-column moment frames, prestressed concrete beam-column moment frames, and slab-column moment frames. Precast concrete frames, concrete frames with infills, and concrete braced frames shall meet the provisions of Sections 6.5, 6.6, and 6.9, respectively.
6.4.1.1 Reinforced Concrete Beam-Column Moment Frames
Reinforced concrete beam-column moment frames shall satisfy the following conditions:
1. Framing components shall be beams (with or without slabs), columns, and their connections.
2. Beams and columns shall be of monolithic construction that provides for moment transfer between beams and columns.
3. Primary reinforcement in components contributing to lateral load resistance shall be nonprestressed.
Special Moment Frames, Intermediate Moment Frames, and Ordinary Moment Frames as defined in ASCE 7, shall be deemed to satisfy the above conditions. This classification
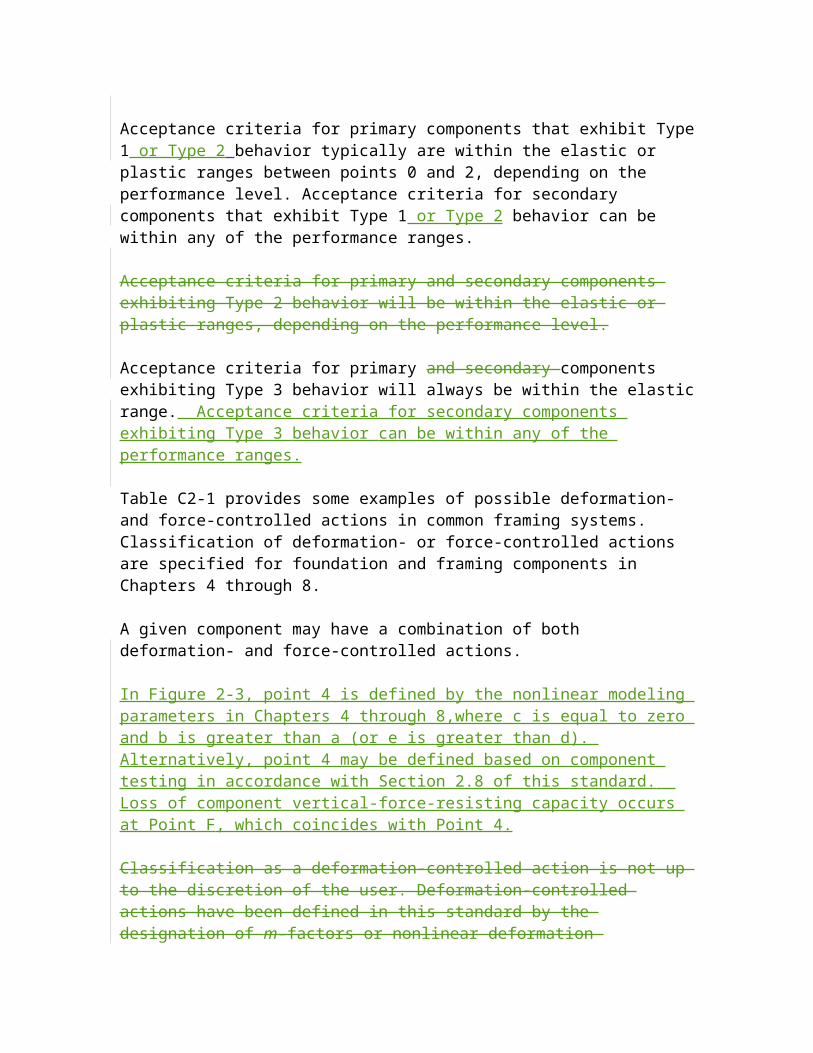
shall include existing construction, new construction, and existing construction that has been rehabilitated.
6.4.1.2 Post-Tensioned Concrete Beam- Column Moment Frames
Post-tensioned concrete beam-column moment frames shall satisfy the following conditions:
1. Framing components shall be beams (with or without slabs), columns, and their connections.
2. Frames shall be of monolithic construction that provides for moment transfer between beams and columns.
3. Primary reinforcement in beams contributing to lateral load resistance shall include post-tensioned reinforcement with or without mild reinforcement.
This classification shall include existing construction, new construction, and existing construction that has been rehabilitated.
6.4.1.3 Slab-Column Moment Frames
Slab-column moment frames shall satisfy the following conditions:
1. Framing components shall be slabs (with or without beams in the transverse direction), columns, and their connections.
2. Frames shall be of monolithic construction that provides for moment transfer between slabs and columns.
3. Primary reinforcement in slabs contributing to lateral load resistance shall include nonprestressed reinforcement, prestressed reinforcement, or both.
This classification shall include frames intended as part of the lateral-force-resisting system and frames not intended as part of the lateral-force-resisting system in the original design, including existing construction, new construction, and existing construction that has been rehabilitated.
6.4.2 Reinforced Concrete Beam-Column Moment Frames
6.4.2.1 General Considerations
The analytical model for a beam-column frame element shall represent strength, stiffness, and deformation capacity of beams, columns, beam-column joints, and other components of the frame, including connections with other elements. Potential failure in flexure, shear, and reinforcement development at any section along the component length shall be
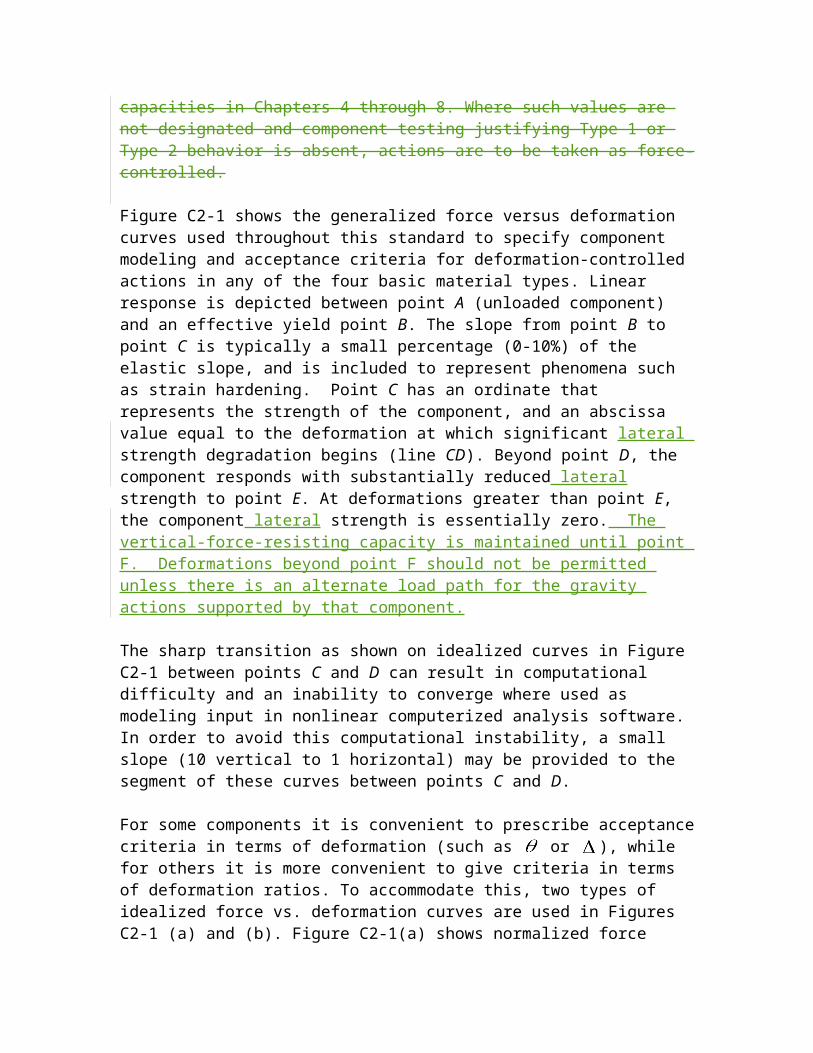
considered. Interaction with other elements, including nonstructural components, shall be included.
Analytical models representing a beam-column frame using line elements with properties concentrated at component centerlines shall be permitted. Where beam and column centerlines do not intersect, the effects of the eccentricity between centerlines of framing shall be taken into account. Where the centerline of the narrower component falls within the middle third of the adjacent framing component measured transverse to the framing direction; however, this eccentricity need not be considered. Where larger eccentricities occur, the effect shall be represented either by reductions in effective stiffness, strength, and deformation capacity, or by direct modeling of the eccentricity.
For modeling purposes, theThe beam-column joint in monolithic construction shall be represented as a stiff or rigid zone having horizontal dimensions equal to the column cross-sectional dimensions and vertical dimension equal to the beam depth, except that a wider joint shall be permitted where the beam is wider than the column and where justified by experimental evidence. The model of the connection between the columns and foundation shall be selected based on the details of the column-foundation connection and rigidity of the foundation-soil system in accordance with Section 6.12.
Action of the slab as a diaphragm interconnecting vertical components shall be represented. Action of the slab as a composite beam flange shall be considered in developing stiffness, strength, and deformation capacities of the beam component model, according to Section 6.3.1.3.
Inelastic action shall be restricted to those components and actions listed in Tables 6-7 through 6-9, except where it is demonstrated by experimental evidence and analysis that other inelastic action is acceptable for the selected performance level. Acceptance criteria shall be as specified in Section 6.4.2.4.
6.4.2.2 Stiffness for Analysis
6.4.2.2.1 Linear Static and Dynamic Procedures
Beams shall be modeled considering flexural and shear stiffnesses, including the effect of the slab acting as a flange in monolithic construction. Columns shall be modeled considering flexural, shear, and axial stiffnesses. Effective stiffnesses shall be computed according to Section 6.3.1.2. Where Joints joint stiffness is notshall be modeled as either explicitly, it shall be permitted to be modeled implicitly by adjusting a centerline model as follows:stiff or rigid components. Effective stiffnesses shall be according to Section 6.3.1.2.1. For Mnc/Mnb > 1.2, column offsets are rigid and beam offsets are not.2. For Mnc/Mnb < 0.8, beam offsets are rigid and column offsets are not.3. For 0.8 Mnc/Mnb 1.2, column and beam offsets are half rigid.
where:
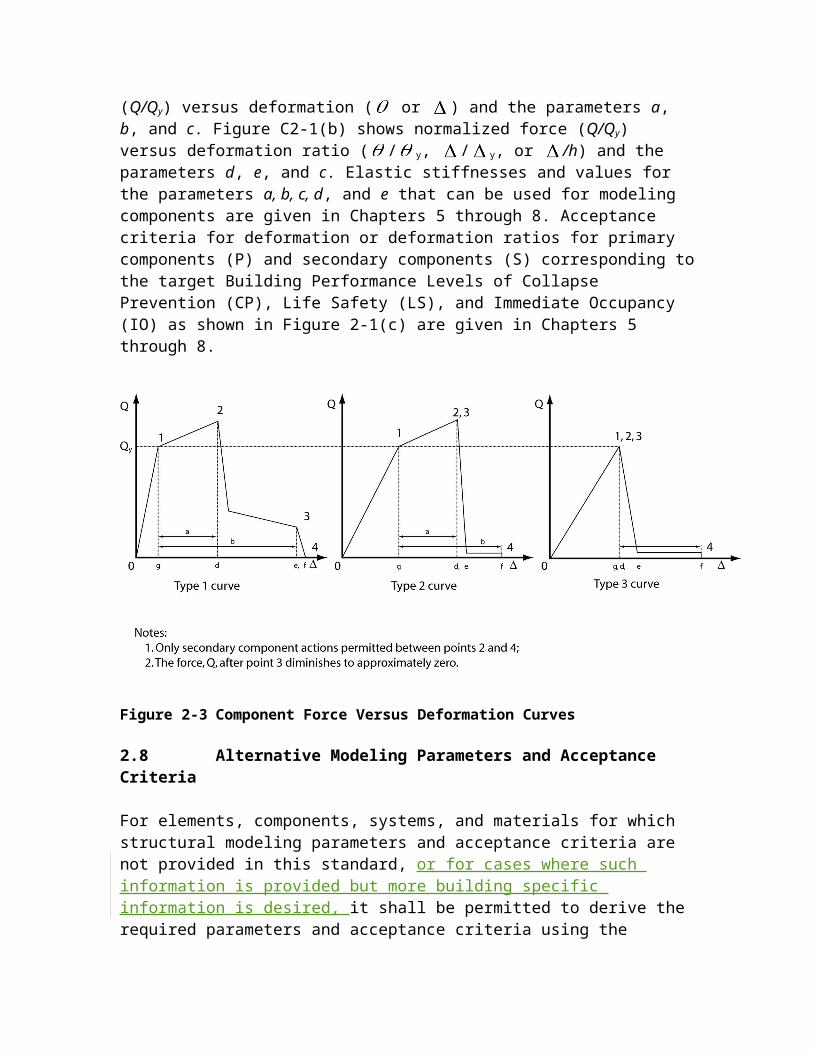
Mnc = the sum of nominal moment capacities of all columns framing into a jointMnb = the sum of nominal moment capacities of all beams framing into a joint
C6.4.2.2.1 Linear Static and Dynamic Procedures
Various approaches to explicitly model beam-column joints are available in the literature (e.g. Ghobarah and Biddah 1999; Lowes and Altoontash 2003). For simplicity, implementation in commercial structural analysis software, and agreement with calibration studies performed in the development of this standard, this section defines an implicit beam-column joint modeling technique using centerline models with semi-rigid joint offsets. Figure C6-1 shows an example of an explicit joint model and illustrates the implicit joint modeling approach. In the implicit joint model, only a portion of the beam and/or column within the geometric joint region is defined to be rigid. In typical commercial software packages, this portion can range from 0, in which case the model is a true centerline model, to 1.0, in which case the entire joint region is rigid. Note that this modeling approach only accounts for joint shear flexibility, and therefore appropriate stiffness values that include the flexibility resulting from bar slip should be used for the beams and/or columns. (see Section C6.3.1.2.1)
Figure C6-1 Beam-Column Joint Modeling (hatched portions are rigid)
6.4.2.2.2 Nonlinear Static Procedure
Nonlinear load-deformation relations shall follow the requirements of Section 6.3.1.2.
Beams and columns shall be modeled using concentrated plastic hinge models or distributed plastic hinge models. Other models whose behavior has been demonstrated to represent the behavior of reinforced concrete beam and column components subjected to lateral loading shall be permitted. The beam and column model shall be capable of representing inelastic response along the component length, except where it is shown by equilibrium that yielding is restricted to the component ends. Where nonlinear response is expected in a mode other than flexure, the model shall be established to represent these effects.
Monotonic load-deformation relations shall be according to the generalized load-deformation relation shown in Figure 6-1, except that different relations shall be permitted where verified by experiments. The overall load-deformation relation shall be established so that the maximum resistance is consistent with the design strength specifications of Sections 6.3.2 and 6.4.2.3.
For beams and columns, the generalized deformation in Figure 6-1 shall be either the chord rotation or the plastic hinge rotation. For beam-column joints, the generalized deformation shall be shear strain. Values of the generalized deformation at points B, C, and D shall be derived from experiments or rational analyses, and shall take into account the interactions between flexure, axial load, and shear.

Columns not controlled by inadequate splices (condition iv in Table 6-8) shall be classified based on Vn from Equation 6-4, the plastic shear capacity of the column, Vp (i.e. shear demand at flexural yielding of plastic hinges), and the transverse reinforcement detailing, as shown below.
Condition to be used in Table 6-8:Transverse Reinforcement Details
ACI conforming details with 135° hooks
Closed hoops with 90° hooks
Other (including lap spliced transverse reinforcement)
Vp/(Vn/k) ≤ 0.6 i* ii ii
1.0 ≥ Vp/(Vn/k) > 0.6 ii ii iii
Vp/(Vn/k) > 1.0 iii iii iii* To qualify for condition i, a column must have ” ≥ 0.002 and s/d ≤ 0.5 within the flexural plastic hinge region. Otherwise , the column shall be assigned to condition ii.
Table 6-7 Modeling Parameters and Numerical Acceptance Criteria for Nonlinear Procedures-Reinforced Concrete Beams [Refer to end of chapter]
Table 6-8 Modeling Parameters and Numerical Acceptance Criteria for Nonlinear Procedures-Reinforced Concrete Columns [Refer to end of chapter]
Table 6-9 Modeling Parameters and Numerical Acceptance Criteria for Nonlinear Procedures-Reinforced Concrete Beam-Column Joints [Refer to end of chapter]
Table 6-10 Values of g for Joint Strength Calculation [Refer to end of chapter]
C6.4.2.2.2 Nonlinear Static Procedure
The modeling parameters and acceptance criteria specified in Table 6-8 have been updated to reflect results from recent research on reinforced concrete columns. Section 6.4.2.2.2 provides the criteria to determine which condition in Table 6.8 should be used to select the modeling parameters and acceptance criteria. For columns with transverse reinforcement including 135° hooks, the specified conditions approximately correspond to the following failure modes:
o Condition i: Flexure failureo Condition ii: Flexure-shear failure (where yielding in flexure is expected prior to
shear failure)o Condition iii: Shear failure
The specified condition is adjusted downward by one condition level for columns with 90° hooks or lap spliced transverse reinforcement to reflect the observation from
experiments that poor transverse reinforcement details can result in decreased deformation capacity. The classification of columns based on Vp/(Vn/k) as described in Section 6.4.2.2.2 may be conservative for columns with Vp/(Vn/k) ≈ 1.0 or Vp/(Vn/k) < 0.7. Experimental evidence may be used to determine the expected failure mode and select the appropriate modeling parameters.
The acceptance criteria in Table 6-8 are determined based on the modeling parameters “a” and “b” and the requirements of Chapter 2. The following paragraphs describe the methodology for selecting the modeling parameters “a” and “b” in Table 6-8.
The modeling parameters in Table 6-8 define the plastic rotations according to Figure 6-1(a). As shown in Figure 6-1(a), modeling parameter “a” provides the plastic rotation at significant loss of lateral load capacity. For the purposes of determining “a” values based on test data, it was assumed that this point represented a 20% reduction in the lateral load resistance from the measured peak shear capacity. For columns expected to experience flexural failures (condition i), such loss of lateral load resistance can be caused by concrete crushing, bar buckling, and other flexural damage mechanisms. For columns expected to experience shear failures, either before or after flexural yielding (conditions ii or iii), loss of lateral load resistance is commonly caused by severe diagonal cracking indicative of shear damage. Consistent with Section 2.4.4.3, modeling parameter “b” provides an estimate of the plastic rotation at the loss of gravity load support (i.e. axial load failure). Experimental evidence suggests that axial load failure can occur suddenly after lateral load failure for columns with axial loads above 0.6Agf’c (Sezen and Moehle 2006; Bayrak and Sheikh 1995). Based on this observation, the “a” and “b” parameters in Table 6-8 converge to a single value for high axial loads.
To achieve an appropriate estimate of the deformation capacities, interpolation between the values given in Table 6-8 is required. For Condition ii, the interpolation is performed on three variables, and this can be done in any order.
Considerable scatter exists in results from reinforced concrete column tested to lateral load and axial load failure, making it inappropriate to specify median or mean values for the plastic rotations in Table 6-8. The goal in selecting the values for parameter “a” given in Table 6-8 was to achieve a high level of safety (probability of failure, Pf, less than 15%) for columns that may experience shear failures; but accept a slightly lower level of safety (Pf < 35%) for columns that are expected to experience flexural failures. Given the potential of collapse resulting from axial load failure of individual columns, a high level of safety (Pf < 15%) was also desired for parameter “b”. The target limits for the probabilities of failure given above were selected based on the judgment of the committee responsible for the development of Table 6-8.
To assess the degree of safety provided by Table 6-8, the tabulated values were interpolated and compared with data from laboratory tests on reinforced concrete columns appropriate for each of the conditions described above. Table C6-1 provides a summary of the results of this assessment. Note that the actual probabilities of failure achieved by the limits in Table 6-8 are considerably lower in many cases than the target
probabilities of failure given above. Insufficient data exists to assess the probability of failure for parameter “b” for Conditions i, iii, and iv; however, limited experimental evidence suggests that the drift ratios for such columns will be greater than those for flexure-shear columns (Melek and Wallace 2004; Yoshimura et al. 2004), and hence, the “b” values for Condition ii are conservatively used for all conditions.
Table C6-1: Database results for modeling parameters in Table 6-8 Modeling parameter Number
of testsMean(p meas/ p table) CoV (p meas/ p table) Probability of
failure*“a” for Condition i 141 1.44 0.50 30%
“a” for Condition ii 31 2.23 0.47 6%
“a” for Condition iii 34 4.66 0.48 0.1%
“b” for Condition ii 28 1.97 0.50 13%
* Assuming a lognormal distribution for (p meas/ p calc)
The database for modeling parameter “a” for Condition i only considered columns with ”≥ 0.002 and s/d ≤ 0.5, hence these limitations have been placed on the applicability of the modeling parameters for Condition i.
For columns expected to experience shear failure prior to flexural yielding (Condition iii), the deformation at shear failure is given by the effective stiffness of the component and the shear strength of the column (Vn/k from Equation 6-4). Significant plastic deformations cannot be relied upon prior to shear failure; hence, parameter “a” has been set to zero. This assumption is very conservative for some columns since the classification method in Section 6.4.2.2.2 may result in some flexure-shear columns being classified as Condition iii and most will have some limited plastic rotation capacity prior to shear failure. Note that except for columns with high axial loads and very light transverse reinforcement, deformations beyond shear failure are expected prior to axial load failure.
Elwood and Moehle (2005b) have demonstrated that the drift at axial failure decreases as the following non-dimensional parameter increases:
The database used to assess the probability of failure for parameter “b” included columns with ≤ 33. Caution should be used when applying the values from Table 6-8 to columns with > 33.
The probabilities of failure shown in Table C6-1 were determined by considering (p
meas/ p table) as a random variable with a lognormal distribution. Equation C6-1 shown below allows for the determination of the expected plastic rotation for a higher probability of failure, Pf new. (C6-1)where , is the coefficient of variation based on test data given in table C6-1 , Pf table is the probability of failure given in Table C6-1 and -1 is the inverse
standard normal cumulative distribution function (i.e. with a zero mean and unit standard deviation). The inverse standard normal cumulative distribution function, -1 , can be found in basic statistics textbooks and is available as a function in most spreadsheet programs.
Equation C6-1 can be used to establish the fragility curve (Figure C6-2) for the column which provides the probability of failure for a given normalized plastic rotation demand,
. Note that Pf is the probability of failure for a column given a plastic rotation demand equal to p. The probability of failure considering the uncertainty in the ground motion is much lower than Pf.
The databases used to assess the conservatism of the models consisted of rectangular columns subjected to unidirectional lateral loads parallel to one face of the column. Actual columns have configurations and loadings that differ from those used in the database columns, so that some additional scatter in results may be anticipated. In particular, it should be noted that bidirectional loading on corner columns is expected to result in lower drift capacities; however, limited data exists to assess the degree of reduction anticipated.
The design professional is referred to reports by Berry and Eberhard 2005; Elwood and Moehle 2005a; Elwood and Moehle 2005b; Fardis and Biskinis 2003; Biskinis et al., 2004; Panagiotakos and Fardis 2001; Lynn et al., 1996; Sezen 2002; and Elwood and Moehle, 2004 for further guidance regarding determination of modeling parameters and acceptance criteria for reinforced concrete columns.
Refer to Section C6.3.1.2 and C6.4.2.3.1 for discussion of alternative modeling parameters for reinforced concrete columns.Figure C6-3 illustrates the five beam-column joint classifications.
Figure C6-2: Fragility curve for column
Figure C6-3 Joint Classification (for response in the plane of the page)
6.4.2.2.3 Nonlinear Dynamic Procedure
For the NDP, the complete hysteretic behavior of each component shall be modeled using properties verified by experimental evidence. The use of the generalized load-deformation relation described by Figure 6-1 to represent the envelope relation for the analysis shall be permitted. Refer to Section 6.4.2.2.2 for the application of parameters in Table 6-8. Unloading and reloading properties shall represent significant stiffness and strength degradation characteristics.
6.4.2.3 Strength
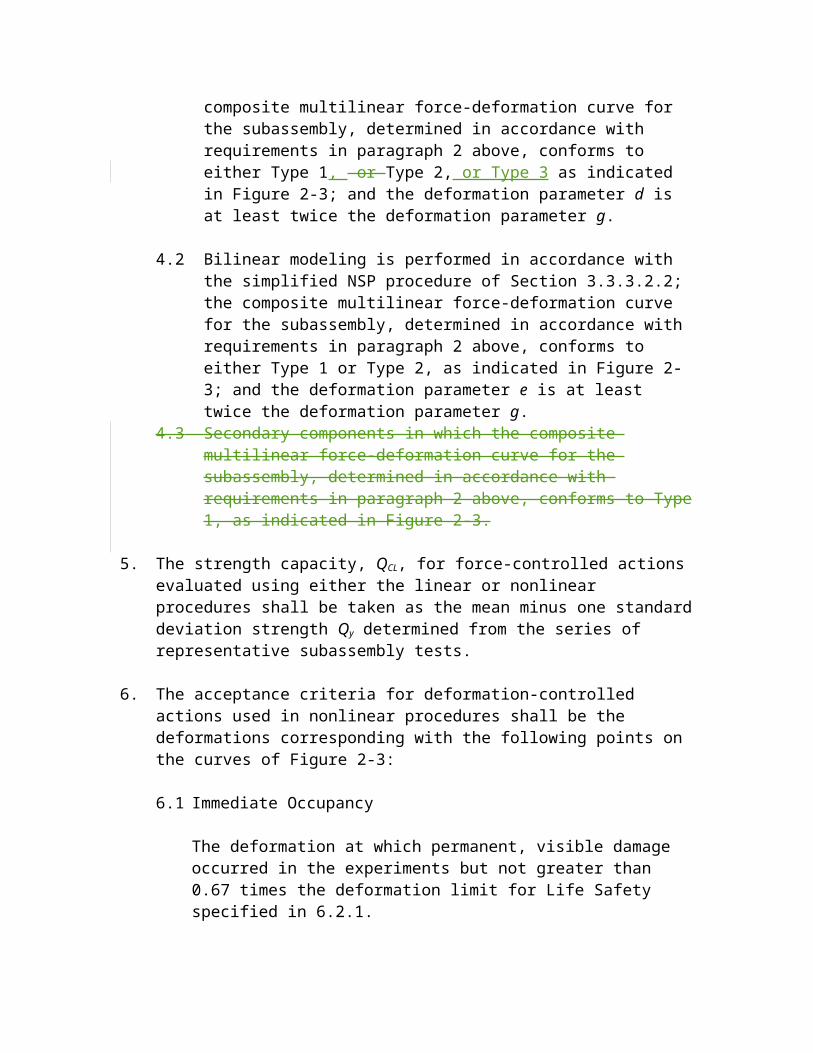
Component strengths shall be computed according to the general requirements of Sections 6.3.2 as modified in this section.
The maximum component strength shall be determined considering potential failure in flexure, axial load, shear, torsion, development, and other actions at all points along the length of the component under the actions of design gravity and earthquake load combinations.
6.4.2.3.1 Columns
For columns, the shear strength, Vn calculated according to Equation (6-4) shall be permitted.
(6-4)
in which k = 1.0 in regions where displacement ductility is less than or equal to 2, 0.7 in regions where displacement ductility is greater than or equal to 6, and varies linearly for displacement ductility between 2 and 6; = 0.75 for lightweight aggregate concrete and 1.0 for normal weight aggregate concrete; Nu = axial compression force in pounds (= 0 for tension force); M/Vd is the largest ratio of moment to shear times effective depth under design loadings for the column but shall not be taken greater than 4 or less than 2; d is the effective depth; and Ag is the gross cross-sectional area of the column. It shall be permitted to assume d = 0.8h, where h is the dimension of the column in the direction of shear. Where axial force is calculated from the linear procedures of Chapter 3, the maximum compressive axial load for use in Equation (6-4) shall be taken as equal to the value calculated using Equation (3-4) considering design gravity load only, and the minimum compression axial load shall be calculated according to Equation (3-18). Alternatively, limit analysis as specified in Section 3.4.2.1.2 shall be permitted to be used to determine design axial loads for use with the linear analysis procedures of Chapter 3. Alternative formulations for column strength that consider effects of reversed cyclic, inelastic deformations and that are verified by experimental evidence shall be permitted.
For columns satisfying the detailing and proportioning requirements of Chapter 21 of ACI 318, the shear strength equations of ACI 318 shall be permitted to be used.
C6.4.2.3.1 Columns
As discussed in C6.3.3, experimental evidence indicates that flexural deformability may be reduced as co-existing shear forces increase. As flexural ductility demands increase, shear capacity decreases, which may result in a shear failure before theoretical flexural deformationcapacities are reached. Caution should be exercised when flexural deformation capacities are determined by calculation.
The modeling parameters and acceptance criteria in Table 6-8 are generally conservative, and may be relaxed based on experimental evidence. The design professional is referred to reports by Berry and Eberhard 2005; Elwood and Moehle 2005a; Elwood and Moehle 2005b; Fardisand Biskinis 2003; Biskinis et al., 2004; Panagiotakos and Fardis 2001; Lynn et al., 1996; Sezen, 2002; and Elwood and Moehle, 2004 for further guidance regarding determination of modeling parameters and acceptance criteria for reinforced concrete columns.
Equation (6-4) provides an estimate of the mean observed shear strength for 51 rectangular reinforced concrete columns subjected to unidirectional lateral loads parallel to one face of the column (Sezen and Moehle, 2004). The coefficient of variation for the ratio of measured to calculated shear strength is 0.15. Elwood and Moehle (2005a) have demonstrated based on experimental evidence that Equation (6-4) does not provide a reliable estimate of the displacement ductility at shear failure.
6.4.2.3.2 Beam-Column Joints
For beam-column joints, the nominal cross-sectional area, Aj, shall be defined by a joint depth equal to the column dimension in the direction of framing and a joint width equal to the smallest of (1) the column width, (2) the beam width plus the joint depth, and (3) twice the smaller perpendicular distance from the longitudinal axis of the beam to the column side. Design forces shall be calculated based on development of flexural plastic hinges in adjacent framing members, including effective slab width, but need not exceed values calculated from design gravity and earthquake-load combinations. Nominal joint shear strength Vn shall be calculated according to the general procedures of ACI 318, as modified by Equation (6-5):
QCL = (6-5)
in which = 0.75 for lightweight aggregate concrete and 1.0 for normal weight aggregate concrete, Aj is the effective horizontal joint area with dimensions as defined above, and g is as defined in Table 6-10.
6.4.2.4 Acceptance Criteria
6.4.2.4.1 Linear Static and Dynamic Procedures
All actions shall be classified as being either deformation-controlled or force-controlled, as defined in Section 2.4.4 and indicated. In primary components, deformation-controlled actions shall be restricted to flexure in beams (with or without slab) and columns. In secondary components, deformation-controlled actions shall be restricted to flexure in beams (with or without slab), plus restricted actions in shear and reinforcement development, as identified in Tables 6-11 through 6-13. All other actions shall be defined as being force- controlled actions.
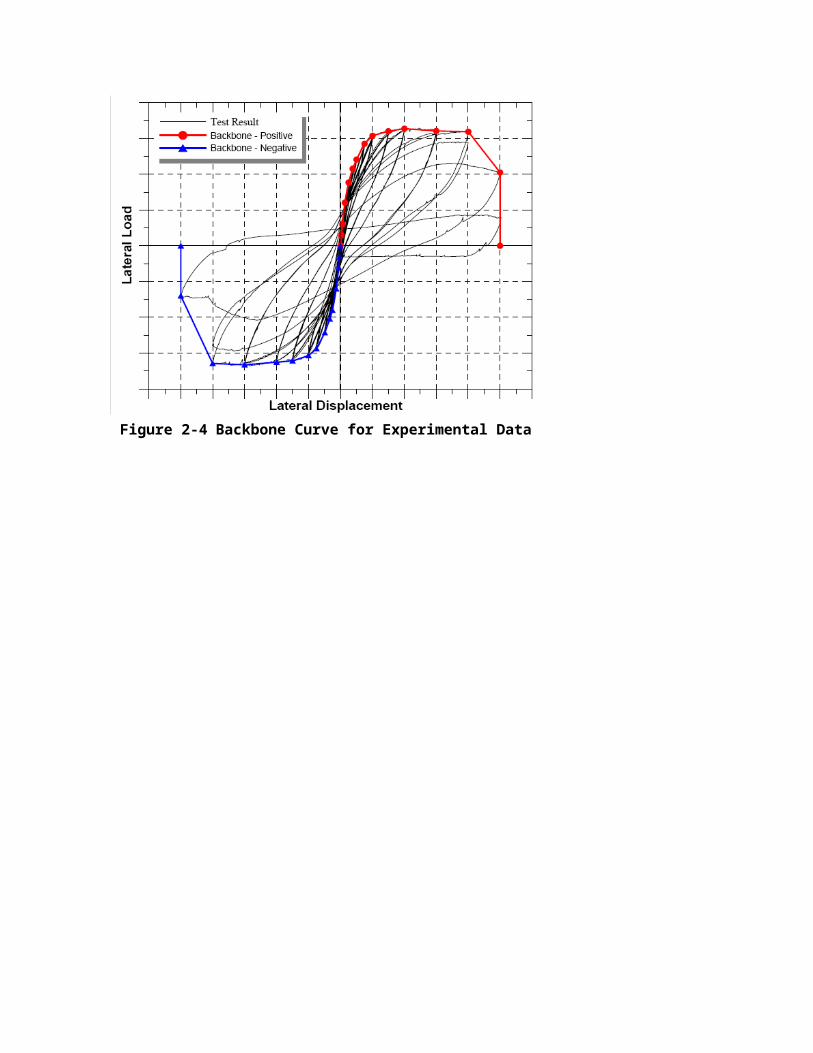
Design actions on components shall be determined as prescribed in Chapter 3. Where the calculated DCR values exceed unity, the following design actions shall be determined using limit analysis principles as prescribed in Chapter 3: (1) moments, shears, torsions, and development and splice actions corresponding to development of component strength in beams and columns; (2) joint shears corresponding to development of strength in adjacent beams and columns; and (3) axial load in columns and joints, considering likely plastic action in components above the level in question.
Design actions shall be compared with design strengths in accordance with Section 3.4.2.2. m-factors shall be selected from Tables 6-11 through 6-13. Those components that satisfy Equations (3-20) or (3-21), as applicable, shall comply with the performance criteria.
Where the average DCR of for columns at a level exceeds the average value of for beams at the same level, and exceeds the greater of 1.0 and m/2 for all columns, the level shall be defined as a weak story element. For weak story elements, one of the following shall be satisfied.
1. The check of average DCR values at the level shall be repeated, considering all primary and secondary components at the level with a weak story element. If the average of the DCR values for vertical components exceeds the average value for horizontal components at the level, and exceeds 2.0, the structure shall be reanalyzed using a nonlinear procedure, or the structure shall be rehabilitated to eliminate this deficiency.
2. The structure shall be reanalyzed using either the NSP or the NDP of Chapter 3.
3. The structure shall be rehabilitated to remove the weak story element.
6.4.2.4.2. Nonlinear Static and Dynamic Procedures
Calculated component actions shall satisfy the requirements of Section 3.4.3.2. Where the generalized deformation is taken as rotation in the flexural plastic hinge zone in beams and columns, the plastic hinge rotation capacities shall be as defined by Tables 6-7 and 6-8. Where the generalized deformation is shear distortion of the beam-column joint, shear angle capacities shall be as defined by Table 6-9. For columns designated as primary components and for which calculated design shear exceeds design shear strength, the permissible deformation for the Collapse Prevention Performance Level shall not exceed the deformation at which shear strength is calculated to be reached; the permissible deformation for the Life Safety Performance Level shall not exceed three quarters of that value. Where inelastic action is indicated for a component or action not listed in these tables, the performance shall be deemed unacceptable. Alternative approaches or values shall be permitted where justified by experimental evidence and analysis.
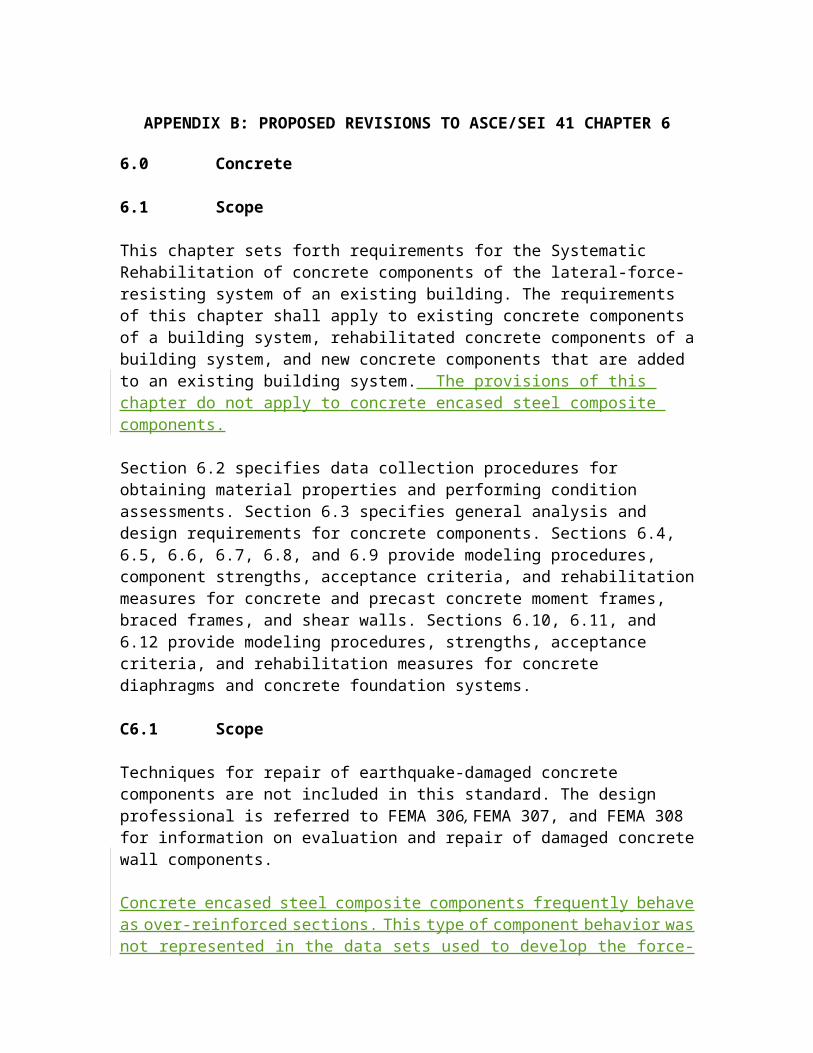
Table 6-11 Numerical Acceptance Criteria for Linear Procedures-Reinforced Concrete Beams [Refer to end of chapter]
Table 6-12 Numerical Acceptance Criteria for Linear Procedures-Reinforced Concrete Columns [Refer to end of chapter]
Table 6-13 Numerical Acceptance Criteria for Linear Procedures-Reinforced Concrete Beam-Column Joints [Refer to end of chapter]
C6.4.2.4.2 Nonlinear Static and Dynamic Procedures
Refer to Section C6.4.2.2.2 and C6.4.2.3.1 for discussion of alternative Table 6-8 and acceptance criteria for reinforced concrete columns.
6.4.2.5 Rehabilitation Measures
Concrete beam-column moment frame components that do not meet the acceptance criteria for the selected rehabilitation objective shall be rehabilitated. Rehabilitation measures shall meet the requirements of Section 6.3.7 and other provisions of this standard.
C6.4.2.5 Rehabilitation Measures
The following rehabilitation measures may be effective in rehabilitating reinforced concrete beam-column moment frames:
1. Jacketing existing beams, columns, or joints with new reinforced concrete, steel, or fiber wrap overlays. The new materials should be designed and constructed to act compositely with the existing concrete. Where reinforced concrete jackets are used, the design should provide detailing to enhance ductility. Component strength should be taken to not exceed any limiting strength of connections with adjacent components. Jackets should be designed to provide increased connection strength and improved continuity between adjacent components.
2. Post-tensioning existing beams, columns, or joints using external post-tensioned reinforcement. Post-tensioned reinforcement should be unbonded within a distance equal to twice the effective depth from sections where inelastic action is expected. Anchorages should be located away from regions where inelastic action is anticipated, and should be designed considering possible force variations due to earthquake loading.
3. Modification of the element by selective material removal from the existing element. Examples include: (1) where nonstructural components interfere with the frame, removing or separating the nonstructural components to eliminate the interference; (2) weakening, due to removal of concrete or severing of longitudinal reinforcement, to change response mode from a nonductile mode to a more ductile mode (e.g., weakening of beams to promote formation of a strong-column, weak-beam system); and (3) segmenting walls to change stiffness and strength.
4. Improvement of deficient existing reinforcement details. Removal of cover concrete for modification of existing reinforcement details should avoid damage to core concrete and the bond between existing reinforcement and core concrete. New cover concrete should be designed and constructed to achieve fully composite action with the existing materials.
5. Changing the building system to reduce the demands on the existing element. Examples include addition of supplementary lateral-force-resisting elements such as walls or buttresses, seismic isolation, and mass reduction.
6. Changing the frame element to a shear wall, infilled frame, or braced frame element by addition of new material. Connections between new and existing materials should be designed to transfer the forces anticipated for the design load combinations. Where the existing concrete frame columns and beams act as boundary components and collectors for the new shear wall or braced frame, these should be checked for adequacy, considering strength, reinforcement development, and deformability. Diaphragms, including ties and collectors, should be evaluated and, if necessary, rehabilitated to ensure a complete load path to the new shear wall or braced frame element.
6.4.3 Post-Tensioned Concrete Beam-Column Moment Frames
6.4.3.1 General Considerations
The analytical model for a post-tensioned concrete beam-column frame element shall be established following the criteria specified in Section 6.4.2.1 for reinforced concrete beam-column moment frames. In addition to potential failure modes described in Section 6.4.2.1, the analysis model shall consider potential failure of tendon anchorages.
The analysis procedures described in Chapter 3 shall apply to frames with post-tensioned beams satisfying the following conditions:
1. The average prestress, fpc, calculated for an area equal to the product of the shortest cross-sectional dimension and the perpendicular cross-sectional dimension of the beam, does not exceed the greater of 750 psi or f'c /12 at locations of nonlinear action.
2. Prestressing tendons do not provide more than one- quarter of the strength for both positive moments and negative moments at the joint face.
3. Anchorages for tendons are demonstrated to have performed satisfactorily for seismic loadings in compliance with the requirements of ACI 318. These anchorages occur outside hinging areas or joints, except in existing components where experimental evidence demonstrates that the connection will meet the performance objectives under design loadings.
Alternative procedures shall be provided where these conditions are not satisfied.
6.4.3.2 Stiffness
6.4.3.2.1 Linear Static and Dynamic Procedures
Beams shall be modeled considering flexural and shear stiffnesses, including the effect of the slab acting as a flange in monolithic and composite construction. Columns shall be modeled considering flexural, shear, and axial stiffnesses. Effective stiffnesses shall be computed according to Section 6.3.1.2. Joints stiffness shall be modeled as indicated in Section 6.4.2.2.1.either stiff or rigid components. Effective stiffnesses shall be according to Section 6.3.1.2.
6.4.3.2.2 Nonlinear Static Procedure
Nonlinear load-deformation relations shall comply with the requirements of Section 6.3.1.2 and the reinforced concrete frame requirements of Section 6.4.2.2.2.
Values of the generalized deformation at points B, C, and D in Figure 6-1 shall be either derived either from experiments or from approved rational analyses, and shall take into account the interactions between flexure, axial load, and shear. Alternatively, where the generalized deformation is taken as rotation in the flexural plastic hinge zone, and where the three conditions of Section 6.4.3.1 are satisfied, beam plastic hinge rotation capacities shall be as defined by Table 6-7. Columns and joints shall be modeled as described in Section 6.4.2.2.
6.4.3.2.3 Nonlinear Dynamic Procedure
For the NDP, the complete hysteretic behavior of each component shall be modeled using properties verified by experimental evidence. The relation of Figure 6-1 shall be taken to represent the envelope relation for the analysis. Unloading and reloading properties shall represent significant stiffness and strength degradation characteristics as influenced by prestressing.
6.4.3.3 Strength
Component strengths shall be computed according to the general requirements of Sections 6.3.2 and the additional requirements of Section 6.4.2.3. Effects of prestressing on strength shall be considered.
For deformation-controlled actions, prestress shall be assumed to be effective for the purpose of determining the maximum actions that may be developed associated with nonlinear response of the frame. For force-controlled actions, the effects on strength of prestress loss shall also be considered as a design condition, where these losses are possible under design load combinations including inelastic deformation reversals.
6.4.3.4 Acceptance Criteria
Acceptance criteria for post-tensioned concrete beam-column moment frames shall follow the criteria for reinforced concrete beam-column frames specified in Section 6.4.2.4.
Modeling parameters and acceptance criteria shall be based on Tables 6-7 through 6-9 and 6-11 through 6-13.
6.4.3.5 Rehabilitation Measures
Post-tensioned concrete beam-column moment frame components that do not meet the acceptance criteria for the selected Rehabilitation Objective shall be rehabilitated. Rehabilitation measures shall meet the requirements of Section 6.3.7 and other provisions of this standard.
C6.4.3.5 Rehabilitation Measures
The rehabilitation measures described in C6.54.2.5 for reinforced concrete beam-column moment frames may also be effective in rehabilitating post-tensioned concrete beam-column moment frames.
6.4.4 Slab-Column Moment Frames
6.4.4.1 General Considerations
The analytical model for a slab-column frame element shall represent strength, stiffness, and deformation capacity of slabs, columns, slab-column connections, and other components of the frame. The connection between the columns and foundation shall be modeled based on the details of the column-foundation connection and rigidity of the foundation-soil system. Potential failure in flexure, shear, shear-moment transfer (punching shear), and reinforcement development at any section along the component length shall be considered. Interaction with other components, including nonstructural components, shall be included. The effects of changes in cross section, slab openings, and interaction with structural and nonstructural components shall be considered.
The analytical model that represents the slab-column frame, using either line elements with properties concentrated at component centerlines or a combination of line elements (to represent columns) and plate-bending elements (to represent the slab), based on any of the following approaches, shall be permitted. An analytical model of the slab-column frame based on any of the following approaches shall be permitted.
1. An effective beam width model, in which the columns and slabs are represented by line elements that are rigidly interconnected at the slab-column jointconnection, and the width of the slab included in the model is adjusted to account for the flexibility of the slab-column connection. The effective width shall be calculated in accordance with the provisions of ACI 318.
2. An equivalent frame model in which the columns and slabs are represented by line elements, and the stiffness of either the column or slab elements is adjusted to account for the flexibility of the slab-column connection. that are interconnected by connection springs.
3. A finite element model in which the columns are represented by line elements and the slab is represented by plate-bending elements.
In any model, the effects of changes in cross section, including slab openings, shall be considered.
The connection between the columns and foundation shall be modeled based on the details of the column-foundation connection and rigidity of the foundation-soil system.
Action of the slab as a diaphragm interconnecting vertical elements shall be represented.In the design model, inelastic deformations in primary components shall be restricted to flexure in slabs and columns, plus nonlinear response in slab-column connections. Other inelastic deformations shall be permitted as part of the design in secondary components. Acceptance criteria shall be as specified in Section 6.4.4.4.
C6.4.4.1 General Considerations
The stiffness of a slab – column frame is highly dependent on the ratio of the column cross section dimensions (c1 and c2) to the slab plan dimensions (l1 and l2),
where: c1 = column dimension parallel to span, c2 = column dimension perpendicular to span, l1 = center to center span length in the direction under consideration, and l2 = center to center span length perpendicular to the direction under consideration.
Approaches for modeling slab-column frame systems differ primarily in how the stiffness of the slab is incorporated in the analytical model.
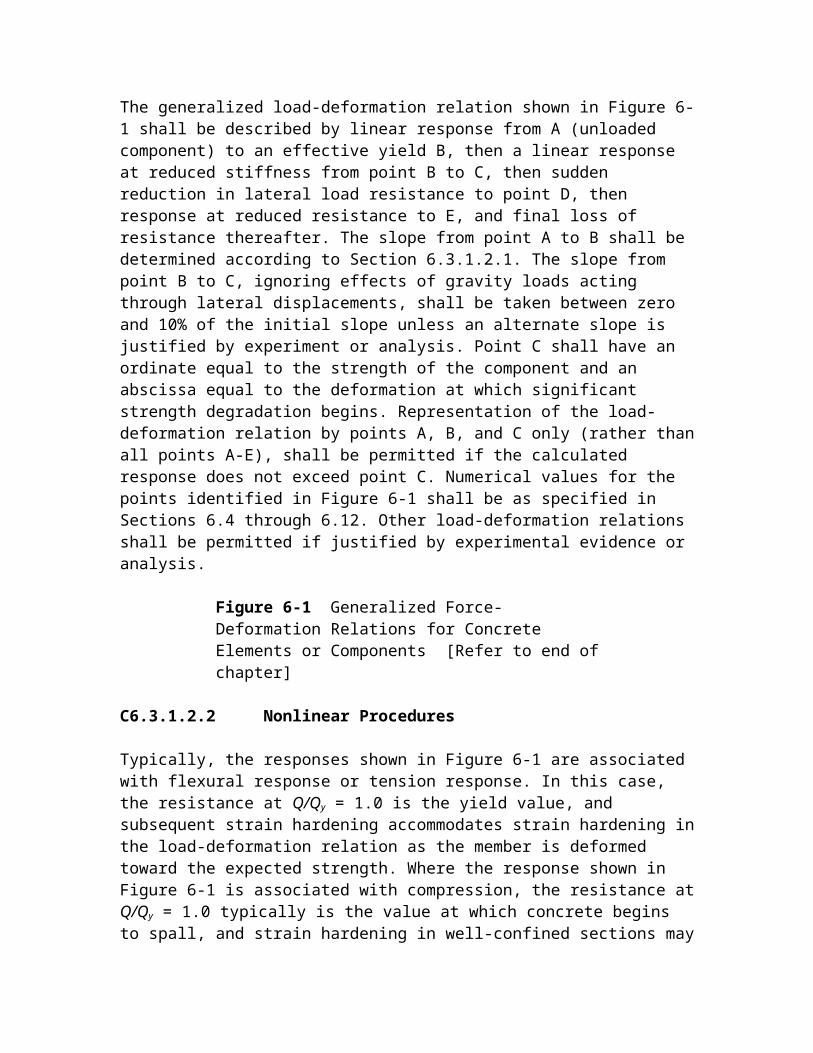
Effective beam model. An effective beam model (Pecknold, 1975) is one in which the width of the slab element is reduced to an effective width to adjust the elastic stiffness to more closely match measured values. Column behavior and slab-column moment and shear transfer are modeled separately.
Equivalent frame model. An equivalent frame model (Vanderbilt and Corley, 1983) is one in which shear and flexure in the slab beyond the width of the column are assumed to be transferred to the column through torsional elements perpendicular to the direction of the slab span. The flexibility of the torsional elements reduces the elastic stiffness of the overall frame. Torsional elements are lumped with the columns (typical) or the slab to produce a frame with equivalent stiffness, although it also is possible to model them separately. This approach is described in Chapter 13 of ACI 318.
Finite element model. A finite element model is one in which the distortion of the slab is modeled explicitly using finite elements.
Each of these approaches is considered acceptable for analytical modeling of slab-column frames, and all are currently used in practice. Research has shown that the effective beam approach tends to overestimate lateral stiffness, while the equivalent frame approach tends to underestimate lateral stiffness of slab-column systems responding in the elastic range (Hwang and Moehle, 2000). For either approach, the elastic stiffness should be reduced further to account for cracking in slab-column systems responding in the inelastic range (Hwang and Moehle, 2000; Luo, et al., 1994).
6.4.4.2 Stiffness
6.4.4.2.1 Linear Static and Dynamic Procedures
Slabs shall be modeled considering flexural, shear, and torsional (in the slab adjacent to the column) stiffnesses. Columns shall be modeled considering flexural, shear, and axial stiffnesses. Joints Slab-column connections shall be modeled as either stiff or rigid components. The effective stiffnesses of components shall be determined according to the general principles of Section 6.3.1.2, but adjustments on the basis of experimental evidence shall be permitted.
C6.4.4.2.1 Linear Static and Dynamic Procedures
Effective beam model. Guidance on determining effective slab width can be found in the literature. Allen and Darvall, 1977, provide tables of effective width coefficients for different combinations of plate aspect ratios (l1/l2) and column width-to-slab span ratios (c1/l1 or c2/l1). Research indicates that the effective width of exterior bays should be less than the effective width of interior bays due to the higher flexibility of one-sided slab-column connections at the end of a frame. Hwang and Moehle, 2000, provide equations for effective width that indicate the relationship between exterior and interior bays is
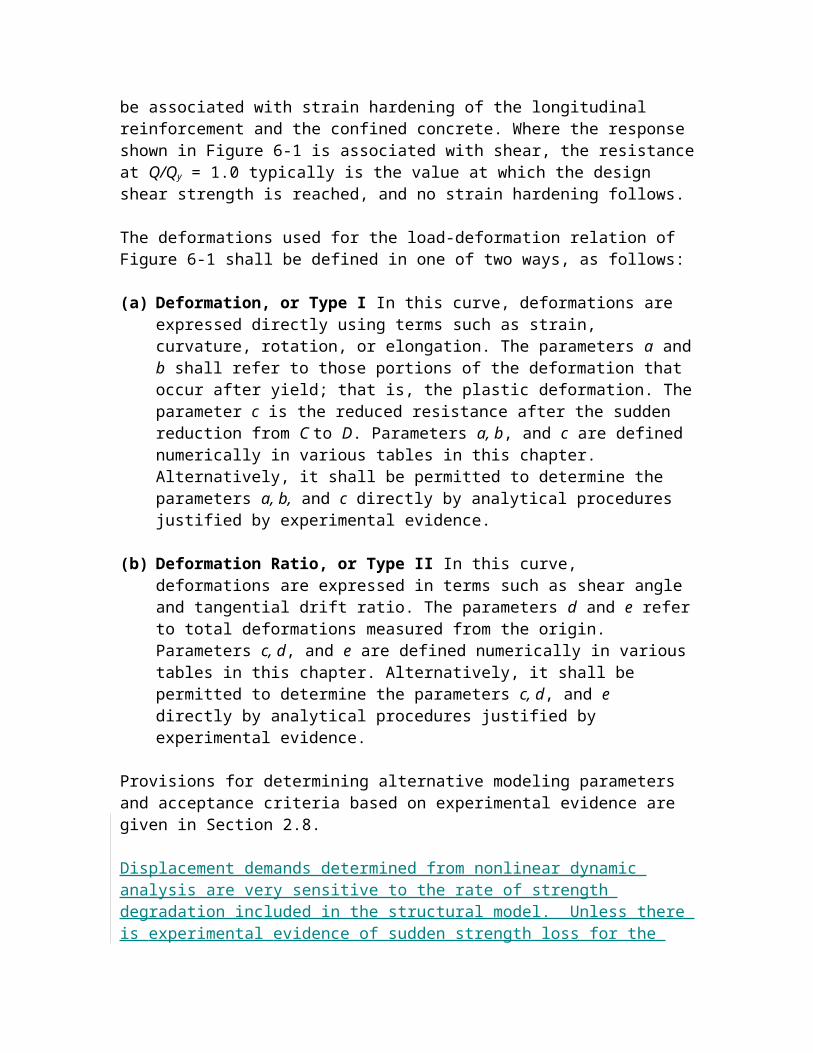
about one-half. The following equations can be used in lieu of tables from Allen and Darvall, 1977:
For interior bays: b = 2 c1 + l1/3For exterior bays: b = c1 + l1/6
where: b = effective slab width c1 = column dimension parallel to span l1 = center to center span length in the direction under consideration To account for cracking due to temperature, shrinkage, or nonlinear response, slab stiffness determined using gross section properties based on the above guidance should be reduced by an effective stiffness factor, . There is general agreement in the literature that = 1/3 is appropriate for non-prestressed slabs (Vanderbilt and Corley, 1983). Somewhat higher, yet conservative, values can be obtained using the following equation from Hwang and Moehle, 2000:
= 4 c1/ l1 >/= 1/3
For prestressed (post-tensioned) slabs it is generally agreed that higher values of are appropriate ( = 1/2) because of reduced cracking due to prestressing (Kang and Wallace, 2005).
Equivalent frame model. Column, slab-beam, and torsional connection element properties for the equivalent frame model are defined in Chapter 13 of ACI 318. To account for cracking due to temperature, shrinkage, or nonlinear response, the stiffness of the torsional connection element based on gross section properties defined in ACI 318 should be reduced by a factor of 1/3.
6.4.4.2.2 Nonlinear Static Procedure
Nonlinear load-deformation relations shall comply with the requirements of Section 6.3.1.2.
Nonlinear static models Slabs and columns shall be modeled using concentrated plastic hinge models, distributed plastic hinge models, or other models whose behavior has been demonstrated to adequately represent behavior of reinforced concrete slab and column components subjected to lateral loading. The model shall be capable of representing inelastic response along the component length, except where it is shown by equilibrium that yielding is restricted to the component ends. Slab-column connections shall be modeled separately from the slab and column components in order to identify potential failure in shear and moment transfer; alternatively, the potential for connection failure shall be otherwise checked as part of the analysis. Where nonlinear response is expected in a mode other than flexure, the model shall be established to represent these effects.
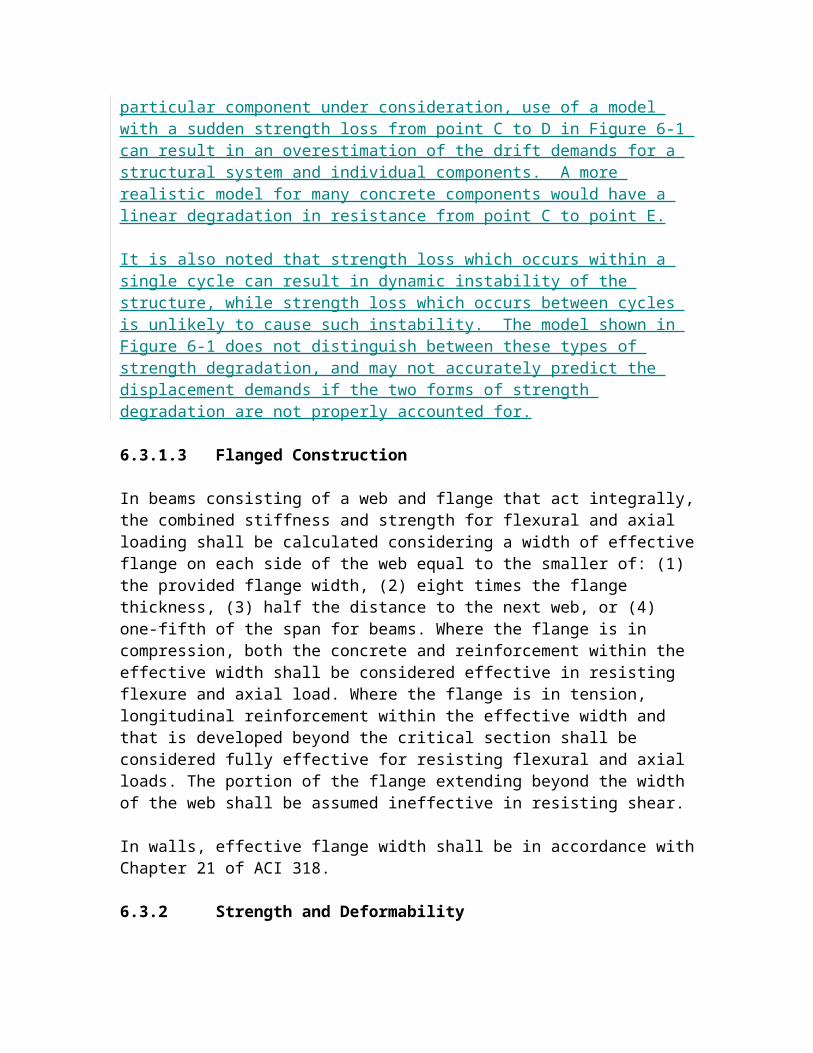
Monotonic Idealized load-deformation relations shall be modeled using according to the generalized relation shown in Figure 6-1. , with definitions according to Section 6.4.2.2.2. The overall load-deformation relation shall be established so that the maximum resistance is consistent with the design strength specifications of Sections 6.3.2 and 6.4.4.3. Where theFor columns, the generalized deformation shown in Figure 6-1 is shall be taken as the flexural plastic hinge rotation with parameters for the column, the plastic hinge rotation capacities shall be as defined by in Table 6-8. For slabs and slab-column connections, Where the generalized deformation shown in Figure 6-1 is shall be taken as the rotation of the slab-column connection, the plastic rotation with parameters capacities shall be as defined by in Table 6-14. Different relations shall be permitted where verified by experimentally obtained cyclic response relations of slab-column subassemblies.
C6.4.4.2.2 Nonlinear Static Procedure
The values provided in Table 6-14 are used to assess punching failures at slab – column connections. The information in Table 6-14 is based primarily on test data (Fig. C6-5) for interior connections summarized by Kang and Wallace (2006). Lateral drift ratio is typically reported for test data; therefore, plastic rotations were derived from the test data assuming column deformations were negligible and yield rotations of 0.01 and 0.015 radians for reinforced concrete and post-tensioned slabs, respectively. The larger rotation value for post-tensioned connections reflects the larger span-to-slab thickness ratios common for this type of construction. Continuity reinforcement for reinforced concrete connections is based on ACI –ASCE Committee 352 recommendations (Recommendations, 2002).
Plastic rotation values are approximately mean and mean minus one standard deviation values for connections with and without continuity reinforcement, respectively. Mean minus one standard deviation values give total (yield plus plastic) rotation values that are close to the maximum drift values allowed by ACI 318-05 S21.11.5 without the use of slab shear reinforcement. Few data exist for reinforced concrete connections subjected to gravity shear ratios greater than 0.6 and for post-tensioned connections subjected to reverse cyclic loading. The residual strength capacity for post-tensioned connections is based on test results reported by Qaisrani, 1993. Although relatively few tests have been reported for edge connections, the limited data available suggest that the relationship between rotation and gravity shear ratio for exterior connections is similar to the trend for interior connections.
Modeling of slab – column connections is commonly accomplished using “beam” elements to represent the slab and a rigid-plastic “torsional” member to represent the connection between the slab and the column (moment and shear transfer), as shown in Figure C6-4. If the punching capacity of the slab – column connection is insufficient to develop the nominal capacity for the developed slab flexural reinforcement provided within the column strip, then all yielding is assumed to occur in the torsional element using the modeling parameters provided in Table 6-14. For cases where yielding of slab reinforcement within the column strip is expected (i.e., strong connection), plastic rotations should be modeled only within the beam elements framing into the torsional
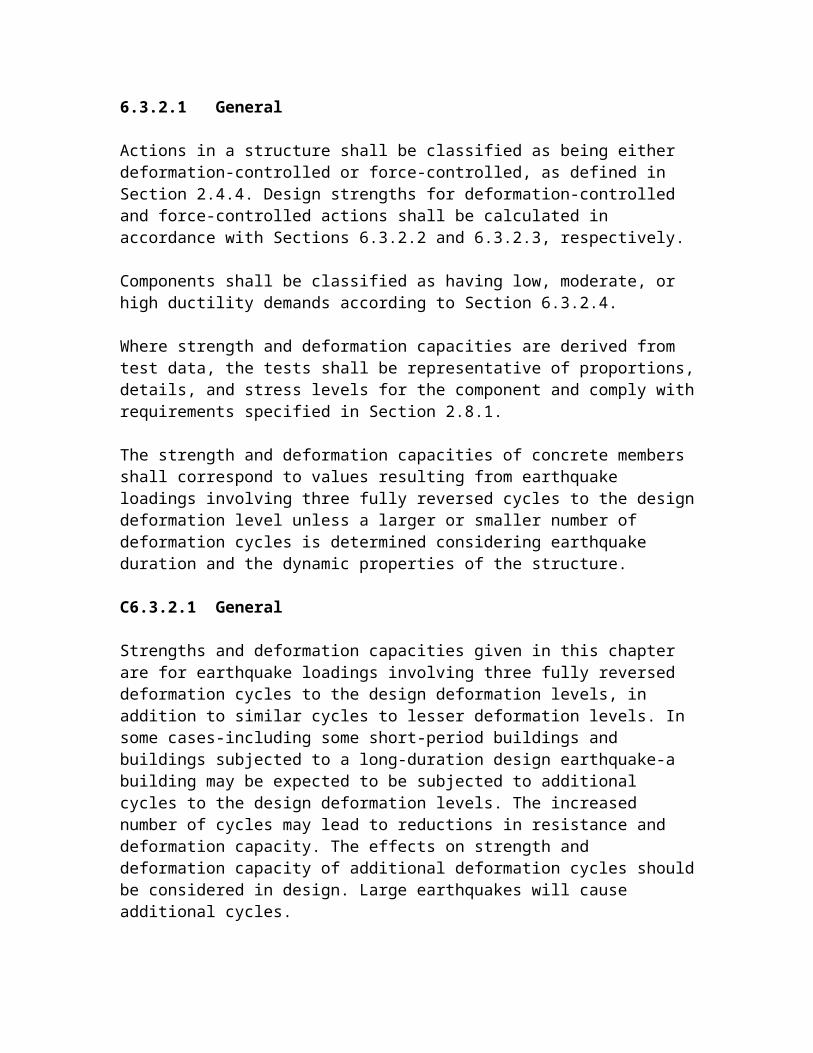
element (i.e., with plastic hinges with positive and negative nominal capacities) using the plastic rotation modeling parameters provided in Table 6-14 to define the plastic hinges at the beam ends.
Figure C6-4 Modeling of slab-column connection
6.4.4.2.3 Nonlinear Dynamic Procedure
The requirements of Sections 6.3.2 and 6.4.2.2.3 for reinforced concrete beam-column moment frames shall apply to slab-column moment frames.
6.4.4.3 Strength
Component strengths shall be computed according to the general requirements of Sections 6.4.2, as modified in this section. For columns, evaluation of shear strength according to Section 6.4.2.3 shall be permitted.
The maximum component strength shall be determined considering potential failure in flexure, axial load, shear, torsion, development, and other actions at all points along the length of the component under the actions of design gravity and earthquake load combinations. The strength of slab-column connections also shall be determined and incorporated in the analytical model.
The flexural strength of a slab to resist moment due to lateral deformations shall be calculated as MnCS - MgCS, where MnCS is the design flexural strength of the column strip and MgCS is the column strip moment due to gravity loads. MgCS shall be calculated according to the procedures of ACI 318 for the design gravity load specified in Chapter 3.
For columns, the evaluation of shear strength according to Section 6.4.2.3 shall be permitted.
Slab-column connections shall be investigated for potential failure in shear and moment transferShear and moment transfer strength of the slab-column connection shall be calculated considering the combined action of flexure, shear, and torsion acting in the slab at the connection with the column. The procedures described below shall be permitted to satisfy this requirement.
For interior connections without transverse beams, and for exterior connections with moment about an axis perpendicular to the slab edge, the shear and moment transfer strength calculated as the minimum of the following strengths shall be permitted:
1. The strength calculated considering eccentricity of shear on a slab critical section due to combined shear and moment, as prescribed in ACI 318.
2. The moment transfer strength equal to Mn/gf, where Mn = the sum of positive and negative flexural strengths of a section of slab between lines that are two and one-
half slab or drop panel thicknesses (2.5h) outside opposite faces of the column or capital; gf = the fraction of the moment resisted by flexure per ACI 318; and h = slab thickness.
For moment about an axis parallel to the slab edge at exterior connections without transverse beams, where the shear on the slab critical section due to gravity loads does not exceed 0.75Vc, or the shear at a corner support does not exceed 0.5 Vc, the moment transfer strength shall be permitted to be taken as equal to the flexural strength of a section of slab between lines that are a distance, c1, outside opposite faces of the column or capital. Vc is the direct punching shear strength defined by ACI 318.
C6.4.4.3 Strength
Alternative expressions for calculating moment transfer strength of interior and exterior slab-column connections can be found in Luo, et al., 1994, and detailed modeling recommendations for reinforced and post-tensioned concrete slab – column frames as well as comparisons with shake table tests can be found in Kang et al., 2006.
6.4.4.4 Acceptance Criteria
6.4.4.4.1 Linear Static and Dynamic Procedures
All component actions shall be classified as being either deformation-controlled or force-controlled, as defined in Section 2.4.4. In primary components, deformation-controlled actions shall be restricted to flexure in slabs and columns, and shear and moment transfer in slab-column connections. In secondary components, deformation-controlled actions shall also be permitted in shear and reinforcement development, as identified in Table 6-15. All other actions shall be defined as being force-controlled actions.
Design actions on components shall be determined as prescribed in Chapter 3. Where the calculated DCR values exceed unity, the following design actions shall be determined using limit analysis principles as prescribed in Chapter 3: (1) moments, shears, torsions, and development and splice actions corresponding to development of component strength in slabs and columns; and (2) axial load in columns, considering likely plastic action in components above the level in question.
Design actions shall be compared with design strengths in accordance with Section 3.4.2.2., m-factors for slab-column frame components shall be selected from Tables 6-12 and 6-15. Those components that satisfy Equations (3-20) and (3-21) shall satisfy the performance criteria. Components that reach their design strengths shall be further evaluated according to this section to determine performance acceptability.
Where the average of the DCRs for columns at a level exceeds the average value for slabs at the same level, and exceeds the greater of 1.0 and m/2, the element shall be defined as
a weak story element and shall be evaluated by the procedure for weak story elements described in Section 6.4.2.4.1.
6.4.4.4.2 Nonlinear Static and Dynamic Procedures
In the design model, inelastic Inelastic response shall be restricted to those components and actions listed in Tables 6-8 and 6-14, except where it is demonstrated by experimental evidence and analysis that other inelastic actions is are acceptable for the selected performance levels. Other actions shall be defined as force-controlled.
Calculated component actions shall satisfy the requirements of Chapter 3 Section 3.4.3.2. Maximum permissible inelastic deformations shall be as listed intaken from Tables 6-8 and 6-14. Where inelastic action is indicated for a component or action not listed in these tables, the performance shall be deemed unacceptable. Alternative approaches or values shall be permitted where justified by experimental evidence and analysis.
C6.4.4.4.2 Nonlinear Static and Dynamic Procedures
Refer to Section C6.4.4.2.2 for discussion of Table 6-14 and acceptance criteria for reinforced concrete slab-column connections. Refer to Section C6.4.2.2.2 for discussion of Table 6-8 and acceptance criteria for reinforced concrete columns.
6.4.4.5 Rehabilitation Measures
Reinforced concrete slab-column moment frame components that do not meet the acceptance criteria for the selected Rehabilitation Objective shall be rehabilitated. Rehabilitation measures shall meet the requirements of Section 6.3.7 and other provisions of this standard.
C6.4.4.5 Rehabilitation Measures
The rehabilitation measures described in C6.54.2.5 for reinforced concrete beam-column moment frames may also be effective in rehabilitating reinforced concrete slab-column moment frames.
Table 6-14 Modeling Parameters and Numerical Acceptance Criteria for Nonlinear Procedures-Two-way Slabs and Slab-Column Connections [Refer to end of chapter]
Table 6-15 Numerical Acceptance Criteria for Linear Procedures-Two-way Slabs and Slab-Column Connections [Refer to end of chapter]
6.5 Precast Concrete Frames
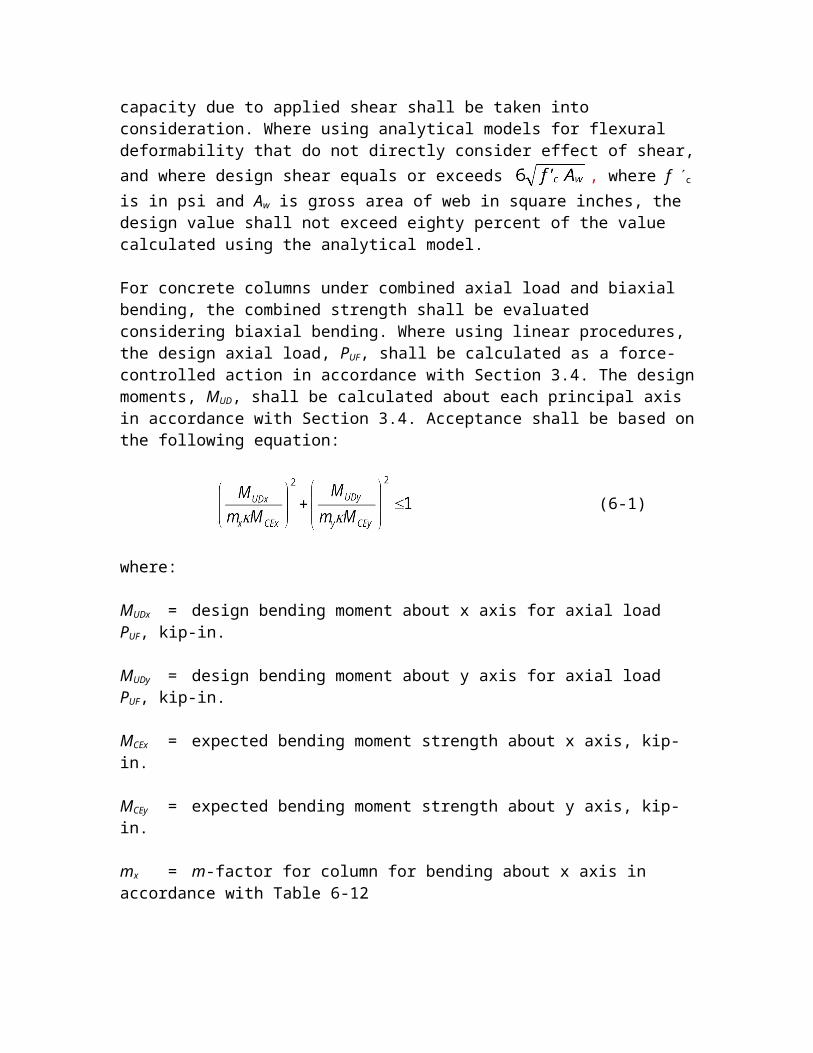
No changes proposed for this section
6.6 Concrete Frames with Infills
No changes proposed for this section
6.7 Concrete Shear Walls
6.7.1 Types of Concrete Shear Walls and Associated Components
The provisions of Section 6.7 shall apply to all shear walls in all types of structural systems that incorporate shear walls. This includes isolated shear walls, shear walls used in wall-frame systems, coupled shear walls, and discontinuous shear walls. Shear walls shall be permitted to be considered as solid walls if they have openings that do not significantly influence the strength or inelastic behavior of the wall. Perforated shear walls shall be defined as walls having a regular pattern of openings in both horizontal and vertical directions that creates a series of wall pier and deep beam components referred to as wall segments.
Coupling beams and columns that support discontinuous shear walls shall comply with provisions of Section 6.7.2 and. These special frame components associated with shear walls shall be exempted from the provisions for beams and columns of frame components covered in Section 6.4.
C6.7.1 Types of Concrete Shear Walls and Associated Components
Concrete shear walls are planar vertical elements or combinations of interconnected planar elements that serve as lateral-load-resisting elements in concrete structures. Shear walls (or wall segments) shall be considered slender if their aspect ratio (height/length) is >3.0, and shall be considered short or squat if their aspect ratio is <1.5. Slender shear walls are normally controlled by flexural behavior; short walls are normally controlled by shear behavior. The response of walls with intermediate aspect ratios is influenced by both flexure and shear.
Identification of component types in concrete shear wall elements depends, to some degree, on the relative strengths of the wall segments. Vertical segments are often termed wall piers, while horizontal segments may be called coupling beams or spandrels. The design professional is referred to FEMA 306 for additional information regarding the behavior of concrete wall components. Selected information from FEMA 306 has been reproduced in the commentary of this standard, in Table C6-1 2 and Figure C6-51 to clarify wall component identification.
Figure C6-1 5 Identification of Component Types in Concrete Shear Wall Elements (from FEMA 306) [Refer to end of chapter]
Table C6-1 2 Reinforced Concrete Shear Wall Component Types (from FEMA 306) [Refer to end of chapter]
6.7.1.1 Monolithic Reinforced Concrete Shear Walls and Wall Segments
Monolithic reinforced concrete shear walls shall consist of vertical cast-in-place elements, either uncoupled or coupled, in open or closed shapes. These walls shall have relatively continuous cross sections and reinforcement and shall provide both vertical and lateral force resistance, in contrast with infilled walls defined in Section 6.6.1.3.
Shear walls or wall segments with axial loads greater than 0.35 Po shall not be considered effective in resisting seismic forces. For the purpose of determining effectiveness of shear walls or wall segments, the use of axial loads based on a limit state analysis shall be permitted. The maximum spacing of horizontal and vertical reinforcement shall not exceed 18 inches. Walls with horizontal and vertical reinforcement ratios less than 0.0025, but with reinforcement spacings less than 18 inches, shall be permitted where the shear force demand does not exceed the reduced nominal shear strength of the wall calculated in accordance with Section 6.7.2.3.
C6.7.1.1 Monolithic Reinforced Concrete Shear Walls and Wall Segments
The wall reinforcement is normally continuous in both the horizontal and vertical directions, and bars are typically lap-spliced for tension continuity. The reinforcement mesh may also contain horizontal ties around vertical bars that are concentrated either near the vertical edges of a wall with constant thickness, or in boundary members formed at the wall edges. The amount and spacing of these ties is important for determining how well the concrete at the wall edge is confined, and thus for determining the lateral deformation capacity of the wall.
In general, slender reinforced concrete shear walls will be governed by flexure and will tend to form a plastic flexural hinge near the base of the wall under severe lateral loading. The ductility of the wall will be a function of the percentage of longitudinal reinforcement concentrated near the boundaries of the wall, the level of axial load, the amount of lateral shear required to cause flexural yielding, and the thickness and reinforcement used in the web portion of the shear wall. In general, higher axial load stresses and higher shear stresses will reduce the flexural ductility and energy absorbing capability of the shear wall. Short or squat shear walls will normally be governed by shear. These walls will normally have a limited ability to deform beyond the elastic range and continue to carry lateral loads. Thus, these walls are typically designed either as displacement-controlled components with low ductility capacities or as force-controlled components.
6.7.1.2 Reinforced Concrete Columns Supporting Discontinuous Shear Walls
Reinforced concrete columns supporting discontinuous shear walls shall be evaluated and rehabilitated to comply with the requirements of Section 6.7.2 6.4.2.
C6.7.1.2 Reinforced Concrete Columns Supporting Discontinuous Shear Walls
In shear wall buildings it is not uncommon to find that some walls are terminated either to create commercial space in the first story or to create parking spaces in the basement. In such cases, the walls are commonly supported by columns. Such designs are not recommended in seismic zones because very large demands may be placed on these columns during earthquake loading. In older buildings such columns will often have "standard" longitudinal and transverse reinforcement; the behavior of such columns during past earthquakes indicates that tightly spaced closed ties with well-anchored 135-degree hooks will be required for the building to survive severe earthquake loading.
6.7.1.3 Reinforced Concrete Coupling Beams
Reinforced concrete coupling beams used to link two shear walls together shall be evaluated and rehabilitated to comply with the requirements of Section 6.7.2.
C6.7.1.3 Reinforced Concrete Coupling Beams
The coupled walls are generally much stiffer and stronger than they would be if they acted independently. Coupling beams typically have a small span-to-depth ratio, and their inelastic behavior is normally affected by the high shear forces acting in these components. Coupling beams in most older reinforced concrete buildings will commonly have "conventional" reinforcement that consists of longitudinal flexural steel and transverse steel for shear. In some, more modern buildings, or in buildings where coupled shear walls are used for seismic rehabilitation, the coupling beams may use diagonal reinforcement as the primary reinforcement for both flexure and shear. The inelastic behavior of coupling beams that use diagonal reinforcement has been shown experimentally to be much better with respect to retention of strength, stiffness, and energy dissipation capacity than the observed behavior of coupling beams with conventional reinforcement.
6.7.2 Reinforced Concrete Shear Walls, Wall Segments, and Coupling Beams, and RC Columns Supporting Discontinuous Shear Walls
6.7.2.1 General Considerations
The analytical model for a shear wall element shall represent the stiffness, strength, and deformation capacity of the shear wall. Potential failure in flexure, shear, and reinforcement development at any point in the shear wall shall be considered. Interaction with other structural and nonstructural components shall be included.
Slender shear walls and wall segments shall be permitted to be modeled as equivalent beam-column elements that include both flexural and shear deformations. The flexural
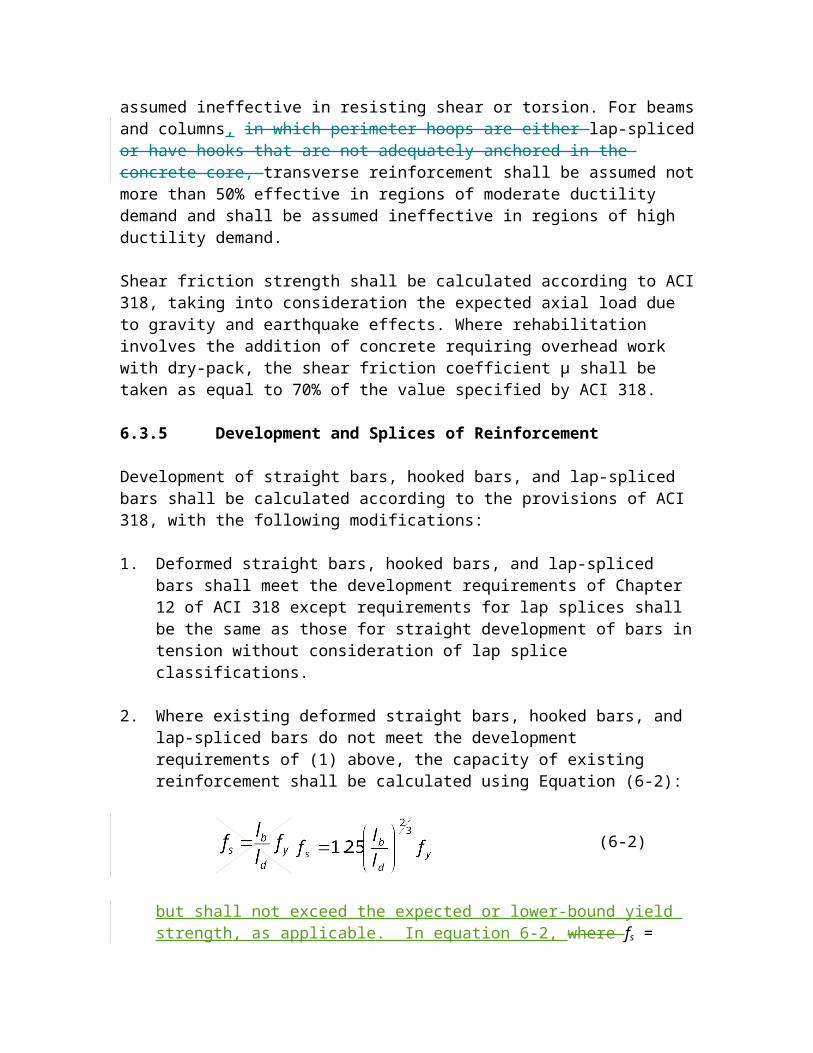
strength of beam-column elements shall include the interaction of axial load and bending. The rigid-connection zone at beam connections to this equivalent beam-column element shall represent the distance from the wall centroid to the edge of the wall. Unsymmetrical wall sections shall model the different bending capacities for the two loading directions.
A beam element that incorporates both bending and shear deformations shall be used to model coupling beams. The element inelastic response shall account for the loss of shear strength and stiffness during reversed cyclic loading to large deformations. For coupling beams that have diagonal reinforcement satisfying ACI 318, a beam element representing flexure only shall be permitted.
For columns supporting discontinuous shear walls, the model shall account for axial compression, axial tension, flexure, and shear response including rapid loss of resistance where this behavior is likely under design loadings. The diaphragm action of concrete slabs that interconnect shear walls and frame columns shall be represented in the model.
C6.7.2.1 General Considerations
For rectangular shear walls and wall segments with h/lw 2.5, and flanged wall sections with h/lw 3.5, either a modified beam-column analogy or a multiple-node, multiple-spring approach should be used. Because shear walls usually respond in single curvature over a story height, the use of one multiple-spring element per story should be permitted for modeling shear walls. Wall segments should be modeled with either the beam-column element or with a multiple-spring model with two elements over the length of the wall segment.
Coupling beams that have diagonal reinforcement satisfying FEMA 450 will commonly have a stable hysteretic response under large load reversals. Therefore, these members could adequately be modeled with beam elements used for typical frame analyses.
6.7.2.2 Stiffness
The effective stiffness of all the elements discussed in Section 6.7 shall be defined based on the material properties, component dimensions, reinforcement quantities, boundary conditions, and current state of the member with respect to cracking and stress levels. Alternatively, use of values for effective stiffness given in Table 6-5 shall be permitted. To obtain a proper distribution of lateral forces in bearing wall buildings, all of the walls shall be assumed to be either cracked or uncracked. In buildings where lateral load resistance is provided by either structural walls only, or a combination of walls and frame members, all shear walls and wall segments discussed in this section shall be considered to be cracked.
For coupling beams, the effective stiffness values given in Table 6-5 for nonprestressed beams shall be used unless alternative stiffnesses are determined by more detailed analysis. The effective stiffness of columns supporting discontinuous shear walls shall
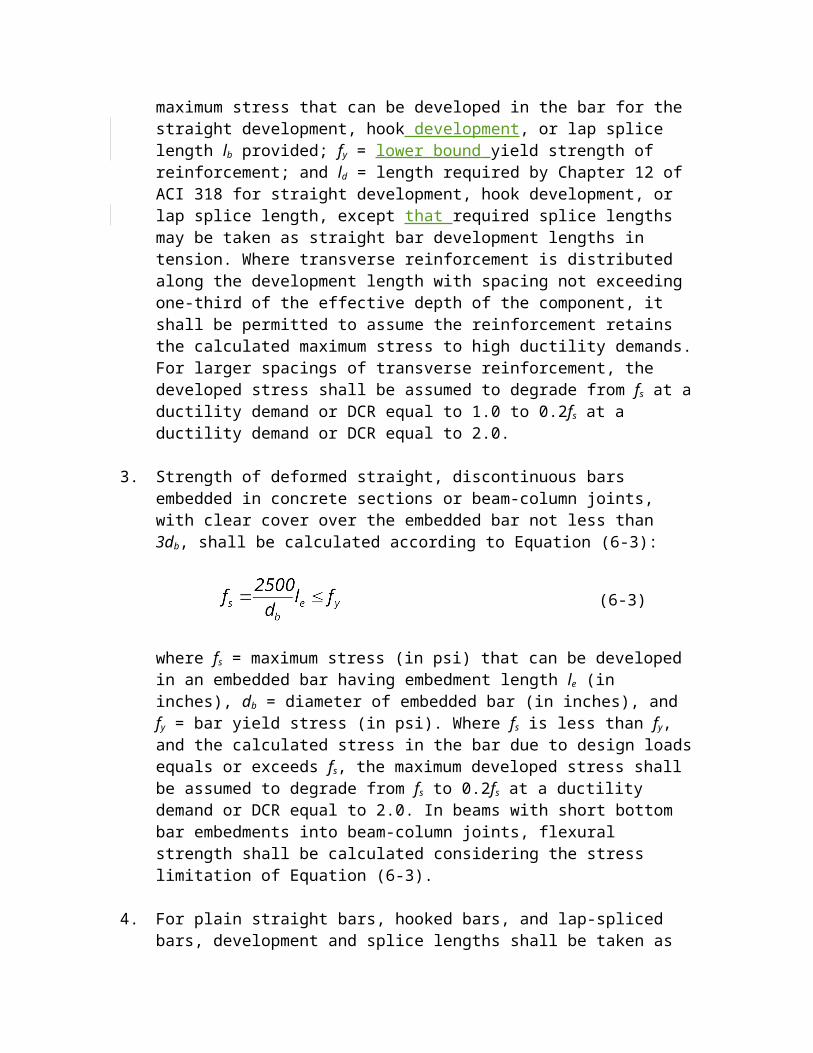
change between the values given for columns in tension and compression, depending on the direction of the lateral load being resisted by the shear wall.
6.7.2.2.1 Linear Static and Dynamic Procedures
Shear walls and associated components shall be modeled considering axial, flexural, and shear stiffness. For closed and open wall shapes, such as box, T, L, I, and C sections, the effective tension or compression flange widths shall be as specified in Section 6.3.1.3. The calculated stiffnesses to be used in analysis shall be in accordance with the requirements of Section 6.3.1.2.
Joints between shear walls and frame elements shall be modeled as stiff components or rigid components, as appropriate.
6.7.2.2.2 Nonlinear Static Procedure
Nonlinear load-deformation relations for use in analysis by nonlinear static and dynamic procedures shall comply with the requirements of Section 6.3.1.2.
Monotonic load-deformation relationships for analytical models that represent shear walls, wall elements, and coupling beams, and columns that support discontinuous shear walls shall be in accordance with the generalized relation shown in Figure 6-1.
For shear walls and wall segments having inelastic behavior under lateral loading that is governed by flexure, as well as columns supporting discontinuous shear walls, the following approach shall be permitted. The load-deformation relationship in Figure 6-1 shall be used with the x-axis of Figure 6-1 taken as the rotation over the plastic hinging region at the end of the member shown in Figure 6-2. The hinge rotation at point B in Figure 6-1 corresponds to the yield point, y, and shall be calculated in accordance with Equation (6-6):
(6-6)
where:
My = Yield moment capacity of the shear wall or wall segment
Ec = Concrete modulus
I = Member moment of inertia
lp = Assumed plastic hinge length
For analytical models of shear walls and wall segments, the value of lp shall be set equal to 0.5 times the flexural depth of the element, but less than one story height for shear
walls and less than 50% of the element length for wall segments. For columns supporting discontinuous shear walls, lp shall be set equal to 0.5 times the flexural depth of the component.
Figure 6-2 Plastic Hinge Rotation in Shear Wall where Flexure Dominates Inelastic Response [Refer to end of chapter]
Figure 6-3 Story Drift in Shear Wall where Shear Dominates Inelastic Response [Refer to end of chapter]
Values for the variables a, b, and c required to define the location of points C, D, and E in Figure 6-1(a), shall be as specified in Table 6-18.
Figure 6-4 Chord Rotation for Shear Wall Coupling Beams [Refer to end of chapter]
For shear walls and wall segments whose inelastic response is controlled by shear, the following approach shall be permitted. The load-deformation relationship in Figure 6-1(bc) shall be used, with the x-axis of Figure 6-1(bc) taken as lateral drift ratio. Alternatively, the load-deformation relationship in Figure 6-1(b) shall be permitted, with the x-axis of Figure 6-1(b) taken as lateral drift ratio. For shear walls, this drift shall be the story drift as shown in Figure 6-3. For wall segments, Figure 6-3 shall represent the member drift.
For coupling beams, the following approach shall be permitted. The load-deformation relationship in Figure 6-1(b) shall be used, with the x-axis of Figure 6-1(b) taken as the chord rotation as defined in Figure 6-4.
Values for the variables d, e, f, g and c required to find the points B, C, D, E, and E F in Figure 6-1(b) or Figure 6-1(c), shall be as specified in Table 6-19 for the appropriate members. Linear interpolation between tabulated values shall be used if the member under analysis has conditions that are between the limits given in the tables.
C6.7.2.2.2 Nonlinear Static Procedure
The recommended backbone shape and parameters provided for concrete shear walls differs from the general backbone description in Chapter 2. For walls with shear span-to depth ratios below 2.5, the load-deformation relationship in Figure 6-1 (c) provides a better representation of the behavior than that in Figure 6-1 (b). The reason is that in walls with low shear-span-to-depth ratios the deformations related to shear are not negligible compared with the deformations related to flexure. The proposed relationship is based on a model in which the total deflection is calculated as the sum of contributions of components related to flexure, shear, and slip of the reinforcement. The drift ratio and shear force corresponding to inclined cracking in Figure 6-1 (c) were obtained by simplifying expressions for principal stresses for a limiting concrete tensile strength of
approximately (Sozen and Moehle, 1993). Definition of the yield point and the lateral strength degradation point are based on limited test data (e.g., Hidalgo, 2002), as summarized by Wallace (EERI notes, 2006). Note that variables F, g, and f in Figure 6-1(c) are not the same as those used in Chapter 2.
6.7.2.2.3 Nonlinear Dynamic Procedure
For the NDP, the complete hysteretic behavior of each component shall be modeled using properties verified by experimental evidence. Use of the generalized load-deformation relation shown in Figure 6-1 to represent the envelope relation for the analysis shall be permitted. The unloading and reloading stiffnesses and strengths, and any pinching of the load-versus-rotation hysteresis loops, shall reflect the behavior experimentally observed for wall elements similar to the one under investigation.
6.7.2.3 Strength
Component strengths shall be computed according to the general requirements of Sections 6.3.2, with the additional requirements of this section. Strength shall be determined considering the potential for failure in flexure, shear, or development under combined gravity and lateral load.
Nominal flexural strength of shear walls or wall segments, Mn , shall be determined using the fundamental principles given in Chapter 10 of ACI 318. For calculation of nominal flexural strength, the effective compression and tension flange widths defined in Section 6.7.2.2 shall be used, except that the first limit shall be changed to one-tenth of the wall height. Where determining the flexural yield strength of a shear wall, as represented by point B in Figure 6-1(a), only the longitudinal steel in the boundary of the wall shall be included. If the wall does not have a boundary member, then only the longitudinal steel in the outer 25% of the wall section shall be included in the calculation of the yield strength. Where calculating the nominal flexural strength of the wall, as represented by point C in Figure 6-1(a), all longitudinal steel (including web reinforcement) shall be included in the calculation. For all moment strength calculations, the strength of the longitudinal reinforcement shall be taken as the expected yield strength to account for material overstrength and strain hardening, and the axial load acting on the wall shall include gravity loads as defined in Chapter 3.
The nominal shear strength of a shear wall or wall segment, Vn , shall be determined based on the principles and equations given in Chapter 21 of ACI 318, except that the restriction on the number of curtains of reinforcement shall not apply to existing walls.The nominal shear strength of columns supporting discontinuous shear walls shall be determined based on the principles and equations given in Chapter 21 of ACI 318. For all shear strength calculations, 1.0 times the specified reinforcement yield strength shall be used. There shall be no difference between the yield and nominal shear strengths, as represented by points B and C in Figure 6-1.
Where a shear wall or wall segment has a transverse reinforcement percentage, n , less than the minimum value of 0.0025 but greater than 0.0015 and reinforcement is spaced no greater than 18 inches, the shear strength of the wall shall be analyzed using the ACI 318 equations noted above. For transverse reinforcement percentages less than 0.0015, the contribution from the wall reinforcement to the shear strength of the wall shall be held constant at the value obtained using n = 0.0015.
Splice lengths for primary longitudinal reinforcement shall be evaluated using the procedures given in Section 6.3.5. Reduced flexural strengths shall be evaluated at locations where splices govern the usable stress in the reinforcement. The need for confinement reinforcement in shear wall boundary members shall be evaluated by the procedure in ACI 318 or other approved procedure.
The nominal flexural and shear strengths of coupling beams shall be evaluated using the principles and equations contained in Chapter 21 of ACI 318. The expected strength of longitudinal or diagonal reinforcement shall be used.
The nominal shear and flexural strengths of columns supporting discontinuous shear walls shall be evaluated as defined in Section 6.4.2.3.
C6.7.2.3 Strength
Data presented by Wood (1990) indicate that wall strength is insensitive to the quantity of transverse reinforcement where it drops below a steel ratio of 0.0015.
The need for confinement reinforcement in shear wall boundary members may be evaluated by the method recommended by Wallace (1994 and 1995) for determining maximum lateral deformations in the wall and the resulting maximum compression strains in the wall boundary.
Strength calculations based on ACI 318, excluding Chapter 22, assume a maximum spacing of wall reinforcement. No data is available to justify performance for walls that do not meet the maximum spacing requirements. If plain concrete is encountered in an existing building, Chapter 22 of ACI 318 can be used to derive capacities, while Section 2.8 of this standard can be used to develop acceptance criteria.
Chapter of the ACI 318 Code requires at least two curtains of reinforcement be used in a wall if Vu exceeds . Experimental results by Hidalgo et al. (2002) show that for relatively thin walls there is no significant difference between the strength of walls with one or two curtains of web reinforcement.
6.7.2.4 Acceptance Criteria
6.7. 2.4.1 Linear Static and Dynamic Procedures
Shear walls, wall segments, and coupling beams, and columns supporting discontinuous shear walls shall be classified as either deformation- or force-controlled, as defined in Section 2.4.4. For columns supporting discontinuous shear walls, deformation-controlled actions shall be restricted to flexure. In these other components, deformation-controlled actions shall be restricted to flexure or shear. All other actions shall be defined treated as being force-controlled actions.
The nominal flexural strength of a shear wall or wall segment shall be used to determine the maximum shear force in shear walls, and wall segments, and columns supporting discontinuous shear walls. For cantilever shear walls and columns supporting discontinuous shear walls, the design shear force shall be equal to the magnitude of the lateral force required to develop the nominal flexural strength at the base of the wall, assuming the lateral force is distributed uniformly over the height of the wall. For wall segments, the design force shall be equal to the shear corresponding to the development of the positive and negative nominal moment strengths at opposite ends of the wall segment.
Design actions (flexure, shear, axial, or force transfer at rebar anchorages and splices) on components shall be determined as prescribed in Chapter 3. Where determining the appropriate value for the design actions, proper consideration shall be given to gravity loads and to the maximum forces that can be transmitted considering nonlinear action in adjacent components. Design actions shall be compared with design strengths in accordance with Section 3.4.2.2. Table 6-20 and 6-21 specify m values for use in Equation (3-20). Alternate m values shall be permitted where justified by experimental evidence and analysis.
C6.7.2.4.1 Linear Static and Dynamic Procedures
For shear-controlled coupling beams, ductility is a function of the shear in the member as determined by the expected shear capacity of the member. In accordance with Section 6.3.2, expected strengths are calculated using the procedures specified in ACI 318. For coupling beams, Vc is nearly always zero.
6.7. 2.4.2 Nonlinear Static and Dynamic Procedures
In the design model, inelastic response shall be restricted to those components and actions listed in Tables 6-18 and 6-19, except where it is demonstrated that other inelastic actions are justified for the selected performance levels. For members experiencing inelastic behavior, the magnitude of other actions (forces, moments, or torque) in the member shall correspond to the magnitude of the action causing inelastic behavior. The magnitude of these other actions shall be shown to be below their nominal capacities.
Components experiencing inelastic response shall satisfy the requirements of Section 3.4.3.2, and the maximum plastic hinge rotations, drifts, or chord rotation angles shall not exceed the values given in Tables 6-18 and 6-19, for the selected performance level.
Linear interpolation between tabulated values shall be used if the member under analysis has conditions that are between the limits given in the tables.
Table 6-18 Modeling Parameters and Numerical Acceptance Criteria for Nonlinear Procedures-Members Controlled by Flexure [Refer to end of chapter]
Table 6-19 Modeling Parameters and Numerical Acceptance Criteria for Nonlinear Procedures-Members Controlled by Shear [Refer to end of chapter]
Table 6-20 Numerical Acceptance Criteria for Linear Procedures-Members Controlled by Flexure [Refer to end of chapter]
Table 6-21 Numerical Acceptance Criteria for Linear Procedures-Members Controlled by Shear [Refer to end of chapter]
6.7.2.5 Rehabilitation Measures
Reinforced shear walls, wall segments, coupling beams, and columns supporting discontinuous shear walls that do not meet the acceptance criteria for the selected Rehabilitation Objective shall be rehabilitated. Rehabilitation measures shall meet the requirements of Section 6.3.7 and other provisions of this standard.
C6.7.2.5 Rehabilitation Measures
The following measures may be effective in rehabilitating reinforced shear walls, wall segments, coupling beams, and reinforced concrete columns supporting discontinuous shear walls:
1. Addition of wall boundary components. Addition of boundary components may be an effective measure in strengthening shear walls or wall segments that have insufficient flexural strength. These members may be either cast-in-place reinforced concrete components or steel sections. In both cases, proper connections should be made between the existing wall and the added components. The shear capacity of the rehabilitated wall should be re-evaluated.
2. Addition of confinement jackets at wall boundaries. Increasing the confinement at the wall boundaries by the addition of a steel or reinforced concrete jacket may be an effective measure in improving the flexural deformation capacity of a shear wall. For both types of jackets, the longitudinal steel should not be continuous from story to story unless the jacket is also being used to increase the flexural capacity. The minimum thickness for a concrete jacket should be three inches. Carbon fiber
wrap should be permitted for improving the confinement of concrete in compression.
3. Reduction of flexural strength. Reduction in the flexural capacity of a shear wall to change the governing failure mode from shear to flexure may be an effective rehabilitation measure. It may be accomplished by saw-cutting a specified number of longitudinal bars near the edges of the shear wall.
4. Increased shear strength of wall. Increasing the shear strength of the web of a shear wall by casting additional reinforced concrete adjacent to the wall web may be an effective rehabilitation measure. The new concrete should be at least four inches thick and should contain horizontal and vertical reinforcement. The new concrete should be properly bonded to the existing web of the shear wall. The use of carbon fiber sheets, epoxied to the concrete surface, should also be permitted to increase the shear capacity of a shear wall.
5. Confinement jackets to improve deformation capacity of coupling beams and columns supporting discontinuous shear walls. The use of confinement jackets specified above as a rehabilitation measure for wall boundaries, and in Section 6.4 for frame elements, may also be effective in increasing both the shear capacity and the deformation capacity of coupling beams and columns supporting discontinuous shear walls.
6. Infilling between columns supporting discontinuous shear walls. Where a discontinuous shear wall is supported on columns that lack either sufficient strength or deformation capacity to satisfy design criteria, making the wall continuous by infilling the opening between these columns may be an effective rehabilitation measure. The infill and existing columns should be designed to satisfy all the requirements for new wall construction, including any strengthening of the existing columns required by adding a concrete or steel jacket for strength and increased confinement. The opening below a discontinuous shear wall should also be permitted to be "infilled" with steel bracing. The bracing members should be sized to satisfy all design requirements and the columns should be strengthened with a steel or a reinforced concrete jacket.
All of the above rehabilitation measures require an evaluation of the wall foundation, diaphragms, and connections between existing structural elements and any elements added for rehabilitation purposes.
6.8 Precast Concrete Shear Walls
No changes proposed for this section
6.9 Concrete-Braced Frames
No changes proposed for this section
6.10 Cast-in-Place Concrete Diaphragms
No changes proposed for this section
6.11 Precast Concrete Diaphragms
No changes proposed for this section
6.12 Concrete Foundation Components
No changes proposed for this section
Table 6-5 Effective Stiffness Values
Component Flexural Rigidity Shear Rigidity Axial RigidityBeams-nonprestressed 0.30.5EcIg 0.4EcAw -
Beams-prestressed EcIg 0.4EcAw -
Columns with compression due to design gravity loads 0.5 Agf'c
0.7EcIg 0.4EcAw EcAg
Columns with compression due to design gravity loads 0.3 0.1Agf'c or with tension
0.30.5EcIg 0.4EcAw EsAs
Beam-column joints See Section 6.4.2.2.1 EcAg
Walls-uncracked † (on inspection) 0.8EcIg 0.4EcAw EcAg
Walls-cracked † 0.5EcIg 0.4EcAw EcAg
Flat Slabs-nonprestressed See Section 6.54.4.2
0.4EcAg -
Flat Slabs-prestressed See Section 6.54.4.2
0.4EcAg -
Note: It shall be permitted to take Ig for T-beams as twice the value of Ig of the web alone. Otherwise, Ig shall be based on the effective width as defined in Section 6.3.1.3. For columns with axial compression falling between the limits provided, linear interpolation shall be permitted. AlternativelyIf interpolation is not performed; the more conservative effective stiffnesses shall be used.
† See Section 6.7.2.2
Table 6-7 Modeling Parameters and Numerical Acceptance Criteria for Nonlinear Procedures-Reinforced Concrete Beams
Conditions
Modeling Parameters3 Acceptance Criteria3, 4
Plastic Rotations Angle, radians
Residual Strength
Ratio
Plastic Rotations Angle, radians
Performance Level
IO
Component Type
Primary Secondary
a b c LS CP LS CP
i. Beams controlled by flexure1
Trans. Reinf.2
0.0 C 3 0.025 0.05 0.2 0.010 0.02 0.025 0.02 0.05
0.0 C 6 0.02 0.04 0.2 0.005 0.01 0.02 0.02 0.04
0.5 C 3 0.02 0.03 0.2 0.005 0.01 0.02 0.02 0.03
0.5 C 6 0.015 0.02 0.2 0.005 0.005 0.015 0.015 0.02
0.0 NC 3 0.02 0.03 0.2 0.005 0.01 0.02 0.02 0.03
0.0 NC 6 0.01 0.015 0.2 0.0015 0.005 0.01 0.01 0.015
0.5 NC 3 0.01 0.015 0.2 0.005 0.01 0.01 0.01 0.015
0.5 NC 6 0.005 0.01 0.2 0.0015 0.005 0.005 0.005 0.01
ii. Beams controlled by shear1
Stirrup spacing d /2 0.0030 0.02 0.2 0.0015 0.0020 0.0030 0.01 0.02
Stirrup spacing > d /2 0.0030 0.01 0.2 0.0015 0.0020 0.0030 0.005 0.01
iii. Beams controlled by inadequate development or splicing along the span1
Stirrup spacing d /2 0.0030 0.02 0.0 0.0015 0.0020 0.0030 0.01 0.02
Stirrup spacing > d /2 0.0030 0.01 0.0 0.0015 0.0020 0.0030 0.005 0.01
iv. Beams controlled by inadequate embedment into beam-column joint1
0.015 0.03 0.2 0.01 0.01 0.015 0.02 0.03
1. Where more than one of the conditions i, ii, iii, and iv occurs for a given component, use the minimum appropriate numerical value from the table.
2. "C" and "NC" are abbreviations for conforming and nonconforming transverse reinforcement. A component is conforming if, within the flexural plastic hinge region, hoops are spaced at d/3, and if, for components of moderate and high ductility demand, the strength provided by the hoops (Vs) is at least three-fourths of the design shear. Otherwise, the component is considered nonconforming.
3. Linear interpolation between values listed in the table shall be permitted.
4. Primary and secondary component demands shall be within secondary component acceptance criteria where the full backbone curve is explicitly modeled including strength degradation and residual strength in accordance with Section 3.4.3.2.
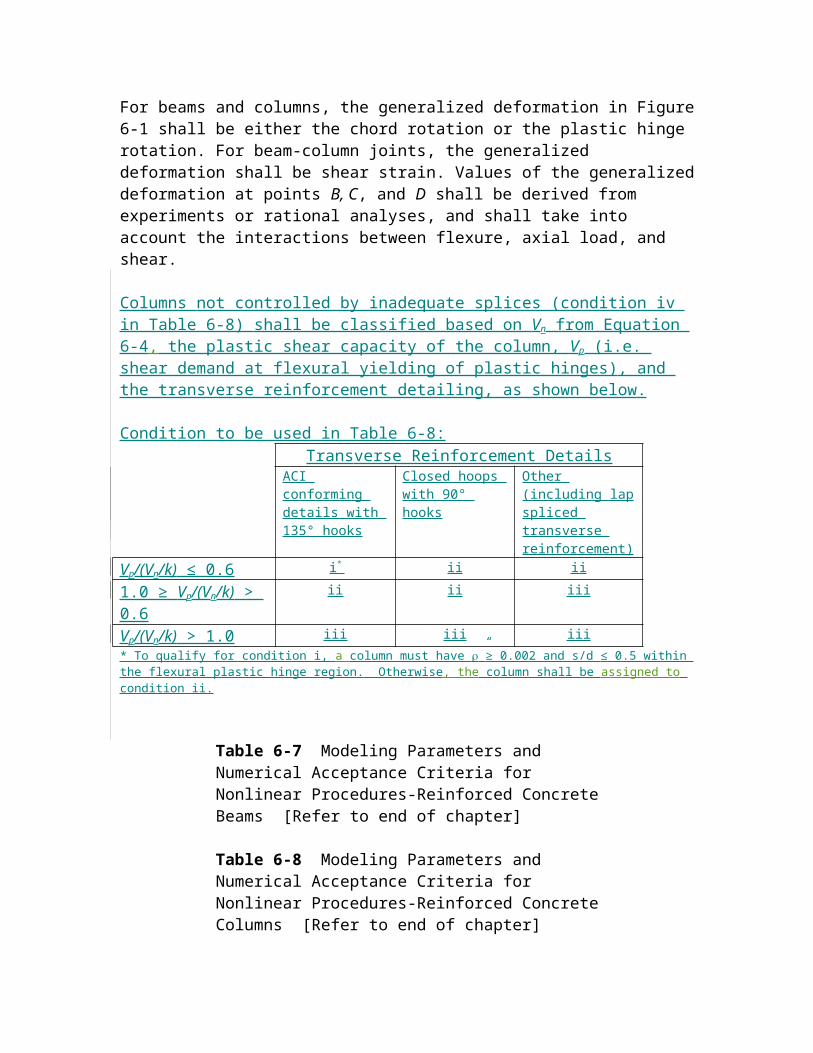
Table 6-8 Modeling Parameters and Numerical Acceptance Criteria for Nonlinear Procedures-Reinforced Concrete Columns
Conditions
Modeling Parameters4 Acceptance Criteria4, 6
Plastic Rotations Angle, radians
Residual Strength
Ratio
Plastic Rotations Angle, radians
Performance Level
IO
Component Type
Primary Secondary
a b c LS CP LS CP
i. Columns controlled by flexure1
Trans. Reinf.2
0.1 C 3 0.02 0.03 0.2 0.005 0.015 0.02 0.02 0.03
0.1 C 6 0.016 0.024 0.2 0.005 0.012 0.016 0.016 0.024
0.4 C 3 0.015 0.025 0.2 0.003 0.012 0.015 0.018 0.025
0.4 C 6 0.012 0.02 0.2 0.003 0.01 0.012 0.013 0.02
0.1 NC 3 0.006 0.015 0.2 0.005 0.005 0.006 0.01 0.015
0.1 NC 6 0.005 0.012 0.2 0.005 0.005 0.005 0.008 0.012
0.4 NC 3 0.003 0.01 0.2 0.002 0.002 0.003 0.006 0.01
0.4 NC 6 0.002 0.008 0.2 0.002 0.002 0.002 0.005 0.008
ii. Columns controlled by shear1, 3
All cases 5 - - - - - - .0030 .0040
iii. Columns controlled by inadequate development or splicing along the clear height1,3
Hoop spacing d /2 0.01 0.02 0.4 0.005 0.005 0.01 0.01 0.02
Hoop spacing > d /2 0.0 0.01 0.2 0.0 0.0 0.0 0.005 0.01
iv. Columns with axial loads exceeding 0.70Po1, 3
Conforming hoops over the entire length
0.015 0.025 0.02 0.0 0.005 0.01 0.01 0.02
All other cases 0.0 0.0 0.0 0.0 0.0 0.0 0.0 0.0
1. Where more than one of the conditions i, ii, iii, and iv occurs for a given component, use the minimum appropriate numerical value from the table.
2. "C" and "NC" are abbreviations for conforming and nonconforming transverse reinforcement. A component is conforming if, within the flexural plastic hinge region, hoops are spaced at d/3, and if, for components of moderate and high ductility demand, the strength provided by the hoops (Vs) is at least three-fourths of the design shear. Otherwise, the component is considered nonconforming.
3. To qualify, columns must have transverse reinforcement consisting of hoops. Otherwise, actions shall be treated as force-controlled.
4. Linear interpolation between values listed in the table shall be permitted.
5. For columns controlled by shear, see Section 6.4.2.4.2 for primary component acceptance criteria.
6. Primary and secondary component demands shall be within secondary component acceptance criteria where the full backbone curve is explicitly modeled including strength degradation and residual strength in accordance with Section 3.4.3.2.
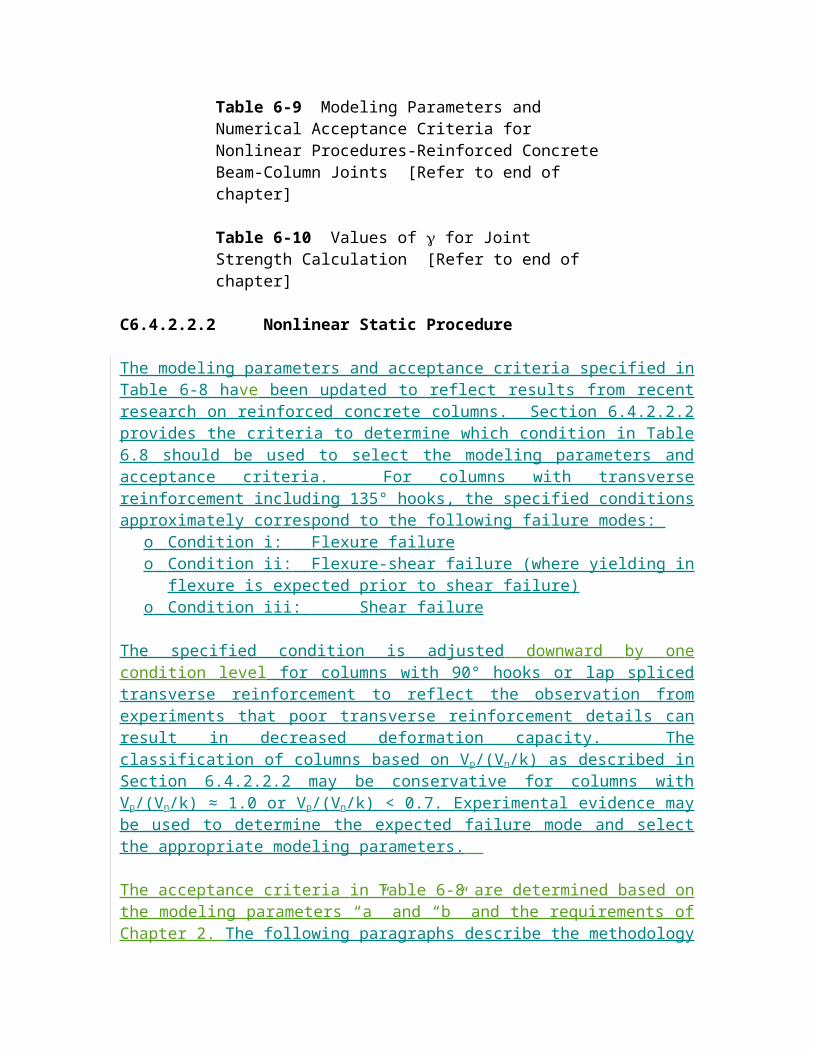
NEW
Table 6-8 Modeling Parameters and Numerical Acceptance Criteria for Nonlinear Procedures-Reinforced Concrete Columns
Conditions
Modeling Parameters3 Acceptance Criteria3, 4
Plastic Rotations Angle, radians
Residual Strength
Ratio
Plastic Rotations Angle, radiansPerformance Level
IO
Component TypePrimary Secondary
a b c LS CP LS CPCondition i. 1
0.1 0.006 0.035 0.060 0.2 0.005 0.026 0.035 0.045 0.060 0.6 0.006 0.010 0.010 0.0 0.003 0.008 0.009 0.009 0.010 0.1 0.002 0.027 0.034 0.2 0.005 0.020 0.027 0.027 0.034 0.6 0.002 0.005 0.005 0.0 0.002 0.003 0.004 0.004 0.005
Condition ii. 1
0.032 0.060 0.2 0.005 0.024 0.032 0.045 0.060 0.025 0.060 0.2 0.005 0.019 0.025 0.045 0.060 0.010 0.010 0.2 0.003 0.008 0.009 0.009 0.010 0.008 0.008 0.2 0.003 0.006 0.007 0.007 0.008 0.012 0.012 0.0 0.005 0.009 0.010 0.010 0.012 0.006 0.006 0.0 0.004 0.005 0.005 0.005 0.006 0.004 0.004 0.0 0.002 0.003 0.003 0.003 0.004 0.0 0.0 0.0 0.0 0.0 0.0 0.0 0.0
Condition iii. 1
0.0 0.060 0.0 0.0 0.0 0.0 0.045 0.060 0.0 0.008 0.0 0.0 0.0 0.0 0.007 0.008 0.0 0.006 0.0 0.0 0.0 0.0 0.005 0.006 0.0 0.0 0.0 0.0 0.0 0.0 0.0 0.0
Condition iv. Columns controlled by inadequate development or splicing along the clear height1
0.0 0.060 0.4 0.0 0.0 0.0 0.045 0.060 0.0 0.008 0.4 0.0 0.0 0.0 0.007 0.008 0.0 0.006 0.2 0.0 0.0 0.0 0.005 0.006 0.0 0.0 0.0 0.0 0.0 0.0 0.0 0.0
1. Refer to Section 6.4.2.2.2 for definition of conditions i, ii, and iii. Columns will be considered to be controlled by inadequate development or splices when the calculated steel stress at the splice exceeds the steel stress specified by Equation 6-2. Where more than one of the conditions i, ii, iii, and iv occurs for a given component, use the minimum appropriate numerical value from the table.
2. Where P > 0.7Agf’c, the plastic rotation angles shall be taken as zero for all performance levels unless columns have transverse reinforcement consisting of hoops with 135 degree hooks spaced at d/3 and the strength provided by the hoops (Vs) is at least three-fourths of the design shear. Axial load, P, shall be based on the maximum expected axial loads due to gravity and earthquake loads
3. Linear interpolation between values listed in the table shall be permitted.
4. Primary and secondary component demands shall be within secondary component acceptance criteria where the full backbone curve is explicitly modeled including strength degradation and residual strength in accordance with Section 3.4.3.2.
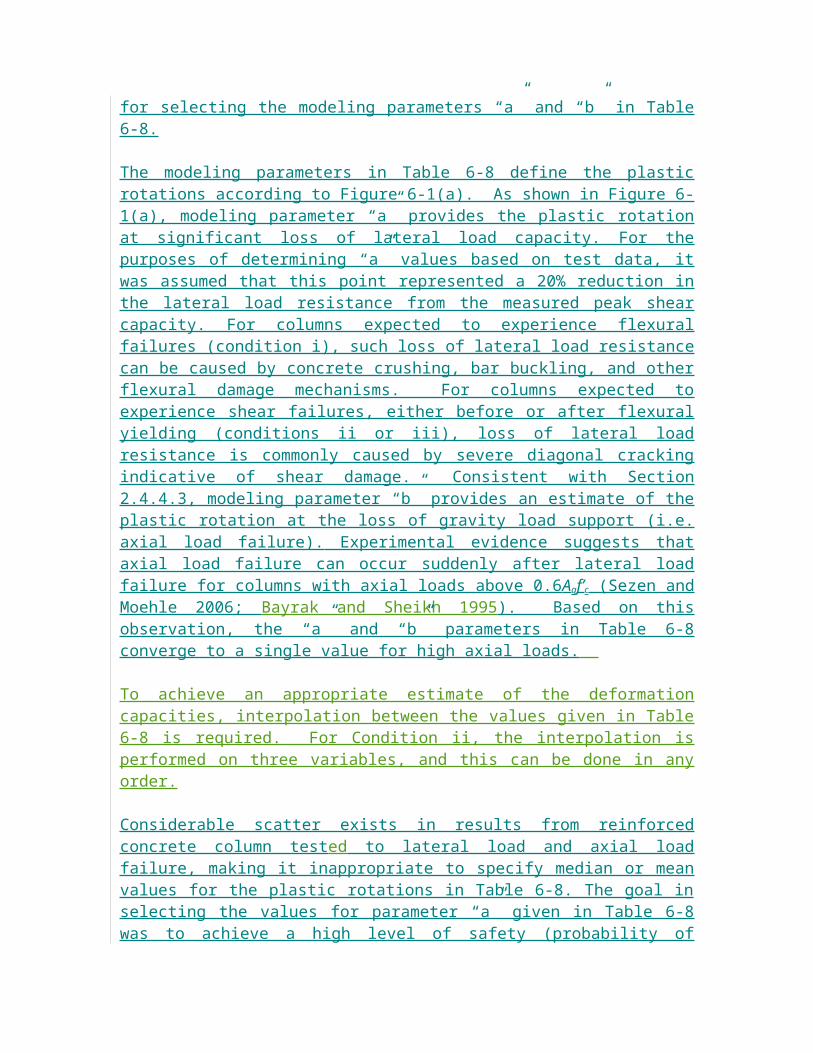
Table 6-9 Modeling Parameters and Numerical Acceptance Criteria for Nonlinear Procedures-Reinforced Concrete Beam-Column Joints
Conditions
Modeling Parameters4 Acceptance Criteria4, 5
Plastic Rotations Angle, radians
Residual Strength
Ratio
Plastic Rotations Angle, radians
Performance Level
IO
Component Type
Primary Secondary
a b c LS CP LS CP
i. Interior joints2, 3
Trans. Reinf. 1 3
0.1 C 1.2 0.015 0.03 0.2 0.0 0.0 0.0 0.02 0.03
0.1 C 1.5 0.015 0.03 0.2 0.0 0.0 0.0 0.015 0.02
0.4 C 1.2 0.015 0.025 0.2 0.0 0.0 0.0 0.015 0.025
0.4 C 1.5 0.015 0.02 0.2 0.0 0.0 0.0 0.015 0.02
0.1 NC 1.2 0.005 0.02 0.2 0.0 0.0 0.0 0.015 0.02
0.1 NC 1.5 0.005 0.015 0.2 0.0 0.0 0.0 0.01 0.015
0.4 NC 1.2 0.005 0.015 0.2 0.0 0.0 0.0 0.01 0.015
0.4 NC 1.5 0.005 0.015 0.2 0.0 0.0 0.0 0.01 0.015
ii. Other joints2, 3
Trans. Reinf.1 3
0.1 C 1.2 0.01 0.02 0.2 0.0 0.0 0.0 0.015 0.02
0.1 C 1.5 0.01 0.015 0.2 0.0 0.0 0.0 0.01 0.015
0.4 C 1.2 0.01 0.02 0.2 0.0 0.0 0.0 0.015 0.02
0.4 C 1.5 0.01 0.015 0.2 0.0 0.0 0.0 0.01 0.015
0.1 NC 1.2 0.005 0.01 0.2 0.0 0.0 0.0 0.0075 0.01
0.1 NC 1.5 0.005 0.01 0.2 0.0 0.0 0.0 0.0075 0.01
0.4 NC 1.2 0.0 0.0075 0.0- 0.0 0.0 0.0 0.005 0.0075
0.4 NC 1.5 0.0 0.0075 0.0- 0.0 0.0 0.0 0.005 0.00751. "C" and "NC" are abbreviations for conforming and nonconforming transverse reinforcement. A jointJoint transverse reinforcement is conforming
if hoops are spaced at hc/3 hc/2 within the joint. Otherwise, the componenttransverse reinforcement is considered nonconforming.2. P is the design axial force on the column above the joint calculated using limit-state analysis procedures in accordance with Section 6.4.2.4 and Ag
is the gross cross-sectional area of the joint.3. V is the design shear force and Vn is the shear strength for the joint. The shear strength shall be calculated according to Section 6.4.2.3. 4. Linear interpolation between values listed in the table shall be permitted.5. Primary and secondary component demands shall be within secondary component acceptance criteria where the full backbone curve is explicitly
modeled including strength degradation and residual strength in accordance with Section 3.4.3.2.
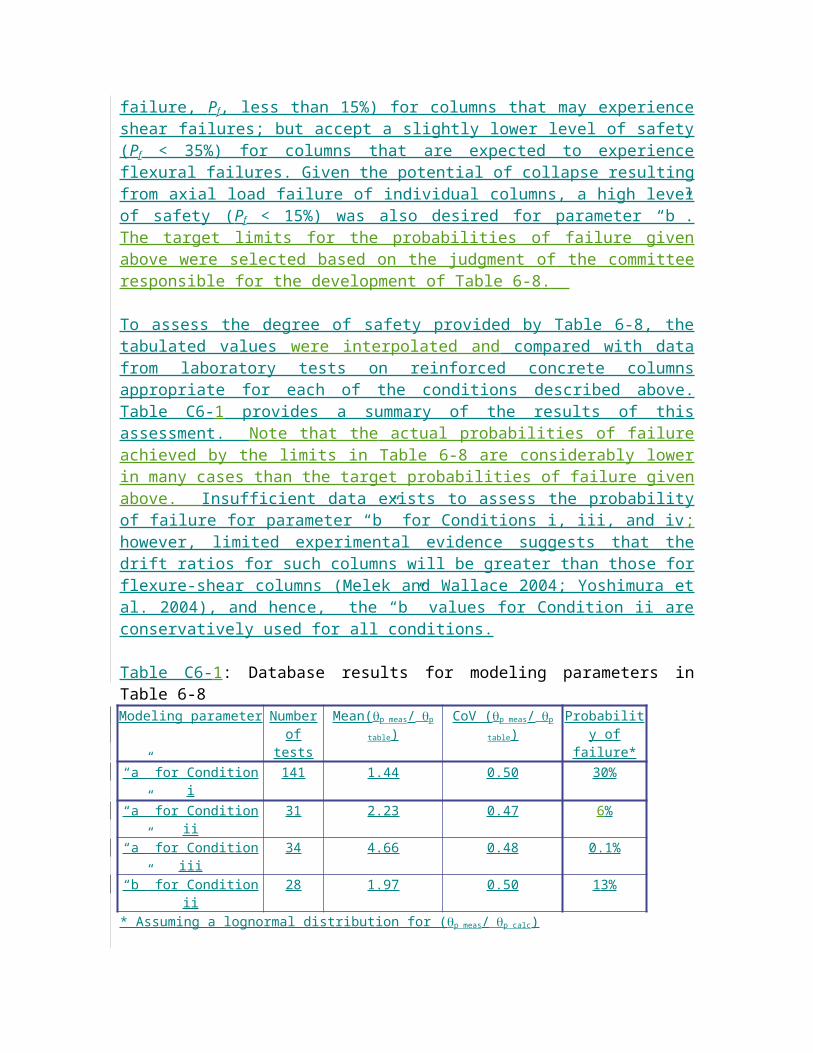
Table 6-10 Values of g for Joint Strength Calculation
Trans. Reinf.1 "
Value of g
Condition i: Interior Joints Condition ii: Other Joints
Interior joint with transverse
beams
Interior joint without
transverse beams
Exterior joint with transverse
beams
Exterior joint without
transverse beams
Knee joint with or without
transverse beams
<0.003 12 10 8 6 4
C 0.003 20 15 15 12 8
NC 12 10 8 6 4" = volumetric ratio of horizontal confinement reinforcement in the joint; 1. “C” and “NC” are abbreviations for conforming and nonconforming transverse reinforcements. Joint transverse reinforcement is conforming if
hoops are spaced at hc/2 within the joint. Otherwise, the transverse reinforcement is considered nonconforming.
Table 6-11 Numerical Acceptance Criteria for Linear Procedures-Reinforced Concrete Beams
Conditions
m-factors3
Performance Level
IO
Component Type
Primary Secondary
LS CP LS CP
i. Beams controlled by flexure1
Trans. Reinf.2
4
0.0 C 3 3 6 7 6 10 0.0 C 6 2 3 4 3 5 0.5 C 3 2 3 4 3 5 0.5 C 6 2 2 3 2 4 0.0 NC 3 2 3 4 3 5 0.0 NC 6 1.25 2 3 2 4 0.5 NC 3 2 3 3 3 4 0.5 NC 6 1.25 2 2 2 3
ii. Beams controlled by shear1
Stirrup spacing d /2 1.25 1.5 1.75 3 4Stirrup spacing > d /2 1.25 1.5 1.75 2 3
iii. Beams controlled by inadequate development or splicing along the span1
Stirrup spacing d /2 1.25 1.5 1.75 3 4Stirrup spacing > d /2 1.25 1.5 1.75 2 3
iv. Beams controlled by inadequate embedment into beam-column joint1
2 2 3 3 41. Where more than one of the conditions i, ii, iii, and iv occurs for a given component, use the minimum appropriate numerical value from the table.
2. "C" and "NC" are abbreviations for conforming and nonconforming transverse reinforcement. A component is conforming if, within the flexural plastic hinge region, hoops are spaced at d/3, and if, for components of moderate and high ductility demand, the strength provided by the hoops (Vs) is at least three-fourths of the design shear. Otherwise, the component is considered nonconforming.
3. Linear interpolation between values listed in the table shall be permitted.
4. V is the design shear force calculated using limit-state analysis procedures in accordance with Section 6.4.2.4.1.
Table 6-12 Numerical Acceptance Criteria for Linear Procedures-Reinforced Concrete Columns
Conditions
m-factors4
Performance Level
IO
Component Type
Primary Secondary
LS CP LS CPi. Columns controlled by flexure1
Trans. Reinf.2
0.1 C 3 2 3 4 4 5 0.1 C 6 2 2.4 3.2 3.2 4 0.4 C 3 1.25 2 3 3 4 0.4 C 6 1.25 1.6 2.4 2.4 3.2 0.1 NC 3 2 2 3 2 3 0.1 NC 6 2 2 2.4 1.6 2.4 0.4 NC 3 1.25 1.5 2 1.5 2 0.4 NC 6 1.25 1.5 1.75 1.5 1.75
ii. Columns controlled by shear1,3
Hoop spacing d /2,
or 0.1
- - - 2 3
Other cases - - - 1.5 2iii. Columns controlled by inadequate development or splicing along the clear height1,3
Hoop spacing d /2 1.25 1.5 1.75 3 4Hoop spacing > d /2 - - - 2 3iv. Columns with axial loads exceeding 0.70Po
1,3
Conforming hoops over the entire length 1 1 2 2 2All other cases - - - 1 11. Where more than one of the conditions i, ii, iii, and iv occurs for a given component, use the minimum appropriate numerical value from the table.2. "C" and "NC" are abbreviations for conforming and nonconforming transverse reinforcement. A component is conforming if, within the flexural
plastic hinge region, hoops are spaced at d/3, and if, for components of moderate and high ductility demand, the strength provided by the hoops (Vs) is at least three-fourths of the design shear. Otherwise, the component is considered nonconforming.
3. To qualify, columns must have transverse reinforcement consisting of hoops. Otherwise, actions shall be treated as force-controlled.4. Linear interpolation between values listed in the table shall be permitted.5. V is the design shear force calculated using limit-state analysis procedures in accordance with Section 6.4.2.4.1.6. P is the design axial force in the member. Alternatively, use of axial loads determined based on a limit state analysis shall be permitted.
6
6 5
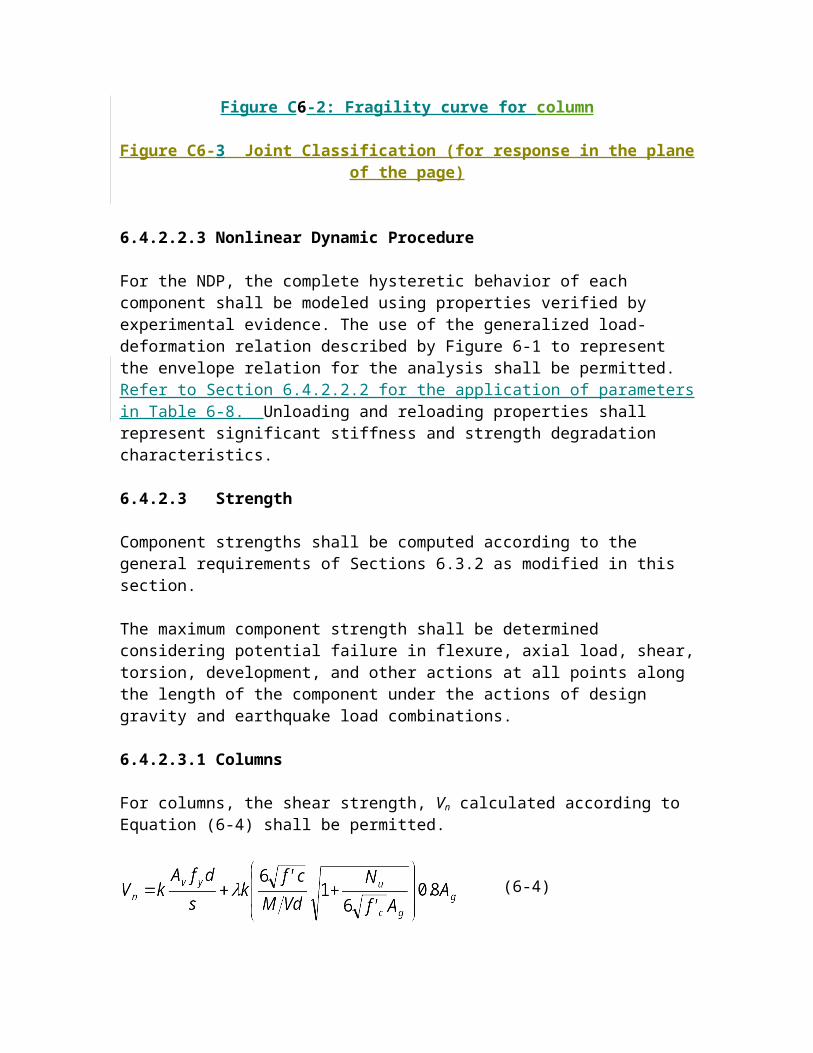
NEW
Table 6-12 Numerical Acceptance Criteria for Linear Procedures-Reinforced Concrete Columns
Conditions
m-factors3
Performance Level
IO
Component Type
Primary Secondary
LS CP LS CPCondition i. 1
0.1 0.006 2 2.5 3 4 5 0.6 0.006 1.25 1.8 1.9 1.9 2 0.1 0.002 2 2 2.6 2.6 3 0.6 0.002 1.1 1.1 1.2 1.2 1.4Condition ii. 1
2 4
2 2.5 3 4 5 2 2 2.5 4 5 1.25 1.8 1.9 1.9 2 1.25 1.5 1.6 1.6 1.8 1.2 1.3 1.4 1.4 1.6 1 1 1.1 1.1 1.2 1 1 1.1 1.1 1.2 1 1 1 1 1Condition iii. 1
0.1 0.006 1 1 1 4 5 0.6 0.006 1 1 1 1.6 1.8 0.1 0.002 1 1 1 1.1 1.2 0.6 0.002 1 1 1 1 1Condition iv. Columns controlled by inadequate development or splicing along the clear height1
0.1 0.006 1 1 1 4 5 0.6 0.006 1 1 1 1.6 1.8 0.1 0.002 1 1 1 1.1 1.2 0.6 0.002 1 1 1 1 1
2
2
2
1. Refer to Section 6.4.2.2.2 for definition of conditions i, ii, and iii. Columns will be considered to be controlled by inadequate development or splices when the calculated steel stress at the splice exceeds the steel stress specified by Equation 6-2. Where more than one of the conditions i, ii, iii, and iv occurs for a given component, use the minimum appropriate numerical value from the table.
2. Where P > 0.7Agf’c, the m-factor shall be taken as unity for all performance levels unless columns have transverse reinforcement consisting of hoops with 135 degree hooks spaced at d/3 and the strength provided by the hoops (Vs) is at least three-fourths of the design shear. P is the design axial force in the member. Alternatively, use of axial loads determined based on a limit state analysis shall be permitted.
3. Linear interpolation between values listed in the table shall be permitted.4. V is the design shear force calculated using limit-state analysis procedures in accordance with Section 6.4.2.4.1.

Table 6-13 Numerical Acceptance Criteria for Linear Procedures-Reinforced Concrete Beam- Column Joints
Conditions
m-factors4
Performance Level
IO
Component Type
Primary5 Secondary
LS CP LS CP
i. Interior joints2, 3
Trans. Reinf. 1
0.1 C 1.2 1- 1- 1- 3 4
0.1 C 1.5 1- 1- 1- 2 3
0.4 C 1.2 1- 1- 1- 3 4
0.4 C 1.5 1- 1- 1- 2 3
0.1 NC 1.2 1- 1- 1- 2 3
0.1 NC 1.5 1- 1- 1- 2 3
0.4 NC 1.2 1- 1- 1- 2 3
0.4 NC 1.5 1- 1- 1- 2 3
ii. Other joints2, 3
Trans. Reinf. 1
0.1 C 1.2 1- 1- 1- 3 4
0.1 C 1.5 1- 1- 1- 2 3
0.4 C 1.2 1- 1- 1- 3 4
0.4 C 1.5 1- 1- 1- 2 3
0.1 NC 1.2 1- 1- 1- 2 3
0.1 NC 1.5 1- 1- 1- 2 3
0.4 NC 1.2 1- 1- 1- 1.5 2.0
0.4 NC 1.5 1- 1- 1- 1.5 2.0
1. "C" and "NC" are abbreviations for conforming and nonconforming transverse reinforcements. A jointTransverse reinforcement is conforming if hoops are spaced at hc/3 hc/2 within the joint. Otherwise, the component transverse reinforcement is considered nonconforming.
2. P is the design axial force on the column above the joint calculated using limit-state analysis procedures in accordance with Section 6.4.2.4. Ag is the gross cross-sectional area of the joint.
3. V is the design shear force and Vn is the shear strength for the joint. The design shear force and shear strength shall be calculated according to Section 6.4.2.4.1 and Section 6.4.2.3, respectively.
4. Linear interpolation between values listed in the table shall be permitted.
5. For linear procedures, all primary joints shall be force-controlled; m-factors shall not apply.
Table 6-14 Modeling Parameters and Numerical Acceptance Criteria for Nonlinear Procedures-Two-way Slabs and Slab-Column Connections
Conditions
Modeling Parameters4 Acceptance Criteria4, 5
Plastic Rotation Angle, radians
Residual Strength
Ratio
Plastic Rotation Angle, radians
Performance Level
IO
Component Type
Primary Secondary
a b c LS CP LS CP
i. Slabs controlled by flexure, and slab-column connections1
2
Continuity Reinforcement3
0.2 Yes 0.02 0.05 0.2 0.01 0.015 0.02 0.03 0.05
0.4 Yes 0.0 0.04 0.2 0.0 0.0 0.0 0.03 0.04
0.2 No 0.02 0.02 - 0.01 0.015 0.02 0.015 0.02
0.4 No 0.0 0.0 - 0.0 0.0 0.0 0.0 0.0
ii. Slabs controlled by inadequate development or splicing along the span1
0.0 0.02 0.0 0.0 0.0 0.0 0.01 0.02
iii. Slabs controlled by inadequate embedment into slab-column joint1
0.015 0.03 0.2 0.01 0.01 0.015 0.02 0.03
1. Where more than one of the conditions i, ii, and iii occurs for a given component, use the minimum appropriate numerical value from the table.
2. Vg = the gravity shear acting on the slab critical section as defined by ACI 318; Vo = the direct punching shear strength as defined by ACI 318.
3. Under the heading "Continuity Reinforcement," use "Yes" where at least one of the main bottom bars in each direction is effectively continuous through the column cage. Where the slab is post-tensioned, use "Yes" where at least one of the post-tensioning tendons in each direction passes through the column cage. Otherwise, use "No."
1. Linear interpolation between values listed in the table shall be permitted.
2. Primary and secondary component demands shall be within secondary component acceptance criteria where the full backbone curve is explicitly modeled including strength degradation and residual strength in accordance with Section 3.4.3.2.
NEW
Table 6-14 Modeling Parameters and Numerical Acceptance Criteria for Nonlinear Procedures-Two-way Slabs and Slab-Column Connections
Conditions
Modeling Parameters5 Acceptance Criteria5, 6
Plastic Rotation Angle, radians
Residual Strength
Ratio
Plastic Rotation Angle, radians
Performance Level
IO
Component Type
Primary Secondary
a b c LS CP LS CP
i. Reinforced Concrete slab-column connections1
2
Continuity Reinforcement3
Yes 0.035 0.05 0.2 0.01 0.026 0.035 0.035 0.05 Yes 0.03 0.04 0.2 0.01 0.023 0.03 0.03 0.04 Yes 0.02 0.03 0.2 0 0.015 0.02 0.02 0.03
Yes 0 0.02 0 0 0 0 0 0.02 No 0.025 0.025 0 0.01 0.02 0.02 0.02 0.025 No 0.02 0.02 0 0.01 0.015 0.015 0.015 0.02 No 0.01 0.01 0 0 0.008 0.008 0.008 0.01 No 0 0 0 0 0 0 0 0 No 0 0 0 --4 --4 --4 --4 --4
ii. Post-Tensioned slab-column connections1
2
Continuity Reinforcement3
Yes 0.035 0.05 0.4 0.01 0.026 0.035 0.035 0.05 Yes 0.005 0.03 0.2 0 0.003 0.005 0.025 0.03 Yes 0 0.02 0.2 0 0 0 0.015 0.02 No 0.025 0.025 0 0.01 0.02 0.02 0.02 0.025 No 0 0 0 0 0 0 0 0 No 0 0 0 --4 --4 --4 --4 --4
iii. Slabs controlled by inadequate development or splicing along the span1
0 0.02 0 0 0 0 0.01 0.02
iv. Slabs controlled by inadequate embedment into slab-column joint1
0.015 0.03 0.2 0.01 0.01 0.015 0.02 0.03
1. Where more than one of the conditions i, ii, iii, and iv occurs for a given component, use the minimum appropriate numerical value from the table.
2. Vg = the gravity shear acting on the slab critical section as defined by ACI 318; Vo = the direct punching shear strength as defined by ACI 318.3. Under the heading "Continuity Reinforcement", use "Yes" where the area of effectively continuous main bottom bars passing through the
column cage in each direction is greater than or equal to 0.5Vg/(ffy). Where the slab is post-tensioned, use "Yes" where at least one of the post-tensioning tendons in each direction passes through the column cage. Otherwise, use "No".
4. Action shall be treated as force-controlled5. Linear interpolation between values listed in the table shall be permitted.6. Primary and secondary component demands shall be within secondary component acceptance criteria where the full backbone curve is explicitly modeled
including strength degradation and residual strength in accordance with Section 3.4.3.2.
Table 6-15 Numerical Acceptance Criteria for Linear Procedures-Two-way Slabs and Slab-Column Connections
Conditions
m-factors4
Performance Level
IO
Component Type
Primary Secondary
LS CP LS CP
i. Slabs controlled by flexure, and slab-column connections1
2 Continuity Reinforcement3
0.2 Yes 2 2 3 3 4
0.4 Yes 1 1 1 2 3
0.2 No 2 2 3 2 3
0.4 No 1 1 1 1 1
ii. Slabs controlled by inadequate development or splicing along the span1
- - - 3 4
iii. Slabs controlled by inadequate embedment into slab-column joint1
2 2 3 3 4
1. Where more than one of the conditions i, ii, and iii occurs for a given component, use the minimum appropriate numerical value from the table.
2. Vg = the gravity shear acting on the slab critical section as defined by ACI 318; Vo = the direct punching shear strength as defined by ACI 318.
3. Under the heading "Continuity Reinforcement," use "Yes" where at least one of the main bottom bars in each direction is effectively continuous through the column cage. Where the slab is post-tensioned, use "Yes" where at least one of the post-tensioning tendons in each direction passes through the column cage. Otherwise, use "No."
4. Linear interpolation between values listed in the table shall be permitted.
NEW Table 6-15 Numerical Acceptance Criteria for Linear Procedures-
Two-way Slabs and Slab-Column Connections
Conditions
m-factors5
Performance Level
IO
Component Type
Primary Secondary
LS CP LS CP
i. Reinforced Concrete slab-column connections1
2 Continuity Reinforcement3
Yes 2 2.75 3.5 3.5 4.5 Yes 1.5 2.5 3 3 3.75 Yes 1 2 2.25 2.25 3
Yes 1 1 1 1 2.25 No 2 2.25 2.25 2.25 2.75 No 1.5 2 2 2 2.25 No 1 1.5 1.5 1.5 1.75 No 1 1 1 1 1 No --4 --4 --4 --4 --4
ii. Post-Tensioned slab-column connections1
2 Continuity Reinforcement3
Yes 1.5 2 2.5 2.5 3.25 Yes 1 1 1 2 2.25 Yes 1 1 1 1.5 1.75 No 1.25 1.75 1.75 1.75 2 No 1 1 1 1 1 No --4 --4 --4 --4 --4
iii. Slabs controlled by inadequate development or splicing along the span1
--4 --4 --4 3 4
iv. Slabs controlled by inadequate embedment into slab-column joint1
2 2 3 3 41. Where more than one of the conditions i, ii, iii, and iv occurs for a given component, use the minimum appropriate numerical value from the
table.
2. Vg = the gravity shear acting on the slab critical section as defined by ACI 318; Vo = the direct punching shear strength as defined by ACI 318.
3. Under the heading "Continuity Reinforcement", use "Yes" where the area of effectively continuous main bottom bars passing through the column cage in each direction is greater than or equal to 0.5Vg/(ffy). Where the slab is post-tensioned, use "Yes" where at least one of the post-tensioning tendons in each direction passes through the column cage. Otherwise, use "No".
4. Action shall be treated as force-controlled.
5. Linear interpolation between values listed in the table shall be permitted.
Table 6-18 Modeling Parameters and Numerical Acceptance Criteria for Nonlinear Procedures-R/C Shear Walls and Associated Components Controlled by Flexure
Conditions
Plastic Hinge Rotation (radians)
Residual Strength
Ratio
Acceptable Plastic Hinge Rotation4 5,5 6
(radians)
Performance Level
IO
Component Type
Primary Secondary
a b c LS CP LS CP
i. Shear walls and wall segments
Confined Boundary1
0.1 34 Yes 0.015 0.020 0.75 0.005 0.010 0.015 0.015 0.020 0.1 6 Yes 0.010 0.015 0.40 0.004 0.008 0.010 0.010 0.015 0.25 34 Yes 0.009 0.012 0.60 0.003 0.006 0.009 0.009 0.012 0.25 6 Yes 0.005 0.010 0.30 0.0015 0.003 0.005 0.005 0.010 0.1 34 No 0.008 0.015 0.60 0.002 0.004 0.008 0.008 0.015 0.1 6 No 0.006 0.010 0.30 0.002 0.004 0.006 0.006 0.010 0.25 34 No 0.003 0.005 0.25 0.001 0.002 0.003 0.003 0.005 0.25 6 No 0.002 0.004 0.20 0.001 0.001 0.002 0.002 0.004
ii. Columns supporting discontinuous shear walls Transverse reinforcement2
Conforming 0.010 0.015 0.20 0.003 0.007 0.010 n.a. n.a.
Nonconforming 0.0 0.0 0.0 0.0 0.0 0.0 n.a. n.a.
iii. Shear wall coupling beams3 4
Longitudinal reinforcement and transverse reinforcement2 3
Conventional longitudinal reinforcement with conforming transverse reinforcement
3 0.025 0.050 0.75 0.010 0.02 0.025 0.025 0.050 6 0.020 0.040 0.50 0.005 0.010 0.020 0.020 0.040
Conventional longitudinal reinforcement with nonconforming transverse reinforcement
3 0.020 0.035 0.50 0.006 0.012 0.020 0.020 0.035
6 0.010 0.025 0.25 0.005 0.008 0.010 0.010 0.025
Diagonal reinforcement n.a. 0.030 0.050 0.80 0.006 0.018 0.030 0.030 0.050
1. A boundary element shall be considered confined where transverse reinforcement exceeds 75% of the requirements given in ACI 318 and spacing of transverse reinforcement does not exceed 8db. It shall be permitted to take modeling parameters and acceptance criteria as 80% of confined values where boundary elements have at least 50% of the requirements given in ACI 318 and spacing of transverse reinforcement does not exceed 8db. Otherwise, boundary elements shall be considered not confined.
2. Conventional longitudinal reinforcement consists of top and bottom steel parallel to the longitudinal axis of the coupling beam. Conforming transverse reinforcement consists of: (a) closed stirrups over the entire length of the coupling beam at a spacing d/3, and (b) strength of closed stirrups Vs 3/4 of required shear strength of the coupling beam.
3. For secondary coupling beams spanning <8'-0", with bottom reinforcement continuous into the supporting walls, secondary values shall be permitted to be doubled.
4. Primary and secondary component demands shall be within secondary component acceptance criteria where the full backbone curve is explicitly modeled including strength degradation and residual strength in accordance with Section 3.4.3.2.
5. Linear interpolation between values listed in the table shall be permitted.1. A boundary element shall be considered confined where transverse reinforcement exceeds 75% of the requirements given in ACI 318 and spacing of transverse reinforcement does not exceed 8db. It shall be permitted to take modeling parameters and acceptance criteria as 80% of confined values where boundary elements have at least 50% of the requirements given in ACI 318 and spacing of transverse reinforcement does not exceed 8db. Otherwise, boundary elements shall be considered not confined.Requirements for a confined boundary are the same as those given in ACI 318.
2. Requirements for conforming transverse reinforcement in columns are: (a) hoops over the entire length of the column at a spacing d/2, and (b) strength of hoops Vs required shear strength of column.
3. Conventional longitudinal reinforcement consists of top and bottom steel parallel to the longitudinal axis of the coupling beam. Conforming transverse reinforcement consists of: (a) closed stirrups over the entire length of the coupling beam at a spacing d/3, and (b) strength of closed stirrups Vs 3/4 of required shear strength of the coupling beam..
4. For secondary coupling beams spanning <8'-0", with bottom reinforcement continuous into the supporting walls, secondary values shall be permitted to be doubled.
5. Primary and secondary component demands shall be within secondary component acceptance criteria where the full backbone curve is explicitly modeled including strength degradation and residual strength in accordance with Section 3.4.3.2.
6. Linear interpolation between values listed in the table shall be permitted.
Table 6-19 Modeling Parameters and Numerical Acceptance Criteria for Nonlinear Procedures-R/C Shear Walls and Associated Components Controlled by Shear
Conditions
Total Drift Ratio (%), or Chord
Rotation (radians)1
Residual Strength
Ratio
Acceptable Total Drift (%) or Chord5 Rotation (radians)1
Performance Level
IO
Component Type
Primary Secondary
d e c LS CP LS CP
i. Shear walls and wall segments
All shear walls and wall segments2 0.75 2.0 0.40 0.40 0.60 0.75 0.75 1.5
ii. Shear wall coupling beams4
Longitudinal reinforcement and transverse reinforcement3
Conventional longitudinal reinforcement with conforming transverse reinforcement
3 0.02 0.030 0.600.006 0.015 0.020 0.020 0.030
6 0.016 0.024 0.300.005 0.012 0.016 0.016 0.024
Conventional longitudinal reinforcement with nonconforming transverse reinforcement
3 0.012 0.025 0.400.006 0.008 0.010 0.010 0.020
6 0.008 0.014 0.20
0.004 0.006 0.007 0.007 0.0121. For shear walls and wall segments, use drift; for coupling beams, use chord rotation; refer to Figures 6-3 and 6-4.
2. For shear walls and wall segments where inelastic behavior is governed by shear, the axial load on the member must be 0.15 Ag fc'; otherwise, the member must be treated as a force-controlled component.
3. Conventional longitudinal reinforcement consists of top and bottom steel parallel to the longitudinal axis of the coupling beam. Conforming transverse reinforcement consists of: (a) closed stirrups over the entire length of the coupling beam at a spacing d/3, and (b) strength of closed stirrups Vs 3/4 of required shear strength of the coupling beam.
4. For secondary coupling beams spanning <8'-0", with bottom reinforcement continuous into the supporting walls, secondary values shall be permitted to be doubled.
5. Primary and secondary component demands shall be within secondary component acceptance criteria where the full backbone curve is explicitly modeled including strength degradation and residual strength in accordance with Section 3.4.3.2.
NEW Table 6-19 Modeling Parameters and Numerical Acceptance Criteria for Nonlinear Procedures-
R/C Shear Walls and Associated Components Controlled by Shear
Conditions
Total Drift Ratio (%), or
Chord Rotation (radians)1
Strength Ratio
Acceptable Total Drift (%) or Chord5 Rotation (radians)1
Performance Level
IO
Component Type
Primary Secondary
d e g c f LS CP LS CP
i. Shear walls and wall segments22
1.0 2.0 0.4 0.20 0.6 0.40 0.75 1.0 1.5 2.0
0.75 1.0 0.4 0.0 0.6 0.40 0.600.55 0.75 0.75 1.0
ii. Shear wall coupling beams4
Longitudinal reinforcement and transverse reinforcement3
Conventional longitudinal reinforcement with conforming transverse reinforcement
3 0.02 0.030 0.600.006 0.015 0.020 0.020 0.030
6 0.016 0.024 0.300.005 0.012 0.016 0.016 0.024
Conventional longitudinal reinforcement with nonconforming transverse reinforcement
3 0.012 0.025 0.400.006 0.008 0.010 0.010 0.020
6 0.008 0.014 0.20
0.004 0.006 0.007 0.007 0.0121. For shear walls and wall segments, use drift; for coupling beams, use chord rotation; refer to Figures 6-3 and 6-4.
2. For shear walls and wall segments where inelastic behavior is governed by shear, the axial load on the member must be 0.15 Ag fc'; otherwise, the member must be treated as a force-controlled component.
3. Conventional longitudinal reinforcement consists of top and bottom steel parallel to the longitudinal axis of the coupling beam. Conforming transverse reinforcement consists of: (a) closed stirrups over the entire length of the coupling beam at a spacing d/3, and (b) strength of closed stirrups Vs 3/4 of required shear strength of the coupling beam.
4. For secondary coupling beams spanning <8'-0", with bottom reinforcement continuous into the supporting walls, secondary values shall be permitted to be doubled.
5. Primary and secondary component demands shall be within secondary component acceptance criteria where the full backbone curve is explicitly modeled including strength degradation and residual strength in accordance with Section 3.4.3.2.
Table 6-20 Numerical Acceptance Criteria for Linear Procedures- R/C Shear Walls and Associated Components Controlled by Flexure
Conditions
m-factors76
Performance Level
IO
Component Type
Primary Secondary
LS CP LS CP
i. Shear walls and wall segments
65
54
Confined Boundary1
0.1 34 Yes 2 4 6 6 8 0.1 6 Yes 2 3 4 4 6 0.25 34 Yes 1.5 3 4 4 6 0.25 6 Yes 1.25 2 2.5 2.5 4 0.1 34 No 2 2.5 4 4 6 0.1 6 No 1.5 2 2.5 2.5 4 0.25 34 No 1.25 1.5 2 2 3 0.25 6 No 1.25 1.5 1.75 1.75 2
ii. Columns supporting discontinuous shear walls
Transverse reinforcement2
Conforming 1 1.5 2 n.a. n.a.
Nonconforming 1 1 1 n.a. n.a.
iii. Shear wall coupling beams43 Longitudinal reinforcement and transverse reinforcement32
54 Conventional longitudinal reinforcement with conforming transverse reinforcement
3 2 4 6 6 9
6 1.5 3 4 4 7Conventional longitudinal reinforcement with nonconforming transverse reinforcement
3 1.5 3.5 5 5 8
6 1.2 1.8 2.5 2.5 4
Diagonal reinforcement n.a. 2 5 7 7 10
1. A boundary element shall be considered confined where transverse reinforcement exceeds 75% of the requirements given in ACI 318 and spacing of transverse reinforcement does not exceed 8db. It shall be permitted to take modeling parameters and acceptance criteria as 80% of confined values where boundary elements have at least 50% of the requirements given in ACI 318 and spacing of transverse reinforcement does not exceed 8db. Otherwise, boundary elements shall be considered not confined.Requirements for a confined boundary are the same as those given in ACI 318.
2. Requirements for conforming transverse reinforcement in columns are: (a) hoops over the entire length of the column at a spacing d/2, and (b) strength of hoops Vs required shear strength of column.
32. Conventional longitudinal reinforcement consists of top and bottom steel parallel to the longitudinal axis of the coupling beam. Conforming transverse reinforcement consists of: (a) closed stirrups over the entire length of the coupling beam at a spacing d/3, and (b) strength of closed stirrups Vs 3/4 of required shear strength of the coupling beam.
34. For secondary coupling beams spanning <8'-0", with bottom reinforcement continuous into the supporting walls, secondary values shall be permitted to be doubled.
45. V is the design shear force calculated using limit-state analysis procedures in accordance with Section 6.7.2.4.
56. P is the design axial force in the member. Alternatively, use of axial loads determined based on a limit state analysis shall be permitted. 67. Linear interpolation between values listed in the table shall be permitted.
Table 6-21 Numerical Acceptance Criteria for Linear Procedures- R/C Shear Walls and Associated Components Controlled by Shear
Conditions
m-factors
Performance Level
IO
Component Type
Primary Secondary
LS CP LS CP
i. Shear walls and wall segments1
All shear walls and wall segments1 22 22.5 3 24.5 36
1.5 2 3 3 4
ii. Shear wall coupling beams3
Longitudinal reinforcement and transverse reinforcement2
4
Conventional longitudinal reinforcement with conforming transverse reinforcement
3 1.5 3 4 4 6 6 1.2 2 2.5 2.5 3.5
Conventional longitudinal reinforcement with nonconforming transverse reinforcement
3 1.5 2.5 3 3 4 6 1.2 1.2 1.5 1.5 2.5
1. The shear shall be considered to be a force-controlled action for shear walls and wall segments where inelastic behavior is governed by shear and the design axial load is greater than 0.15 Ag f ′c. It shall be permitted to calculate the axial load based on a limit state analysis.
2. Conventional longitudinal reinforcement consists of top and bottom steel parallel to the longitudinal axis of the coupling beam. Conforming transverse reinforcement consists of: (a) closed stirrups over the entire length of the coupling beam at a spacing d/3, and (b) strength of closed stirrups Vs 3/4 of required shear strength of the coupling beam.
3. For secondary coupling beams spanning <8'-0", with bottom reinforcement continuous into the supporting walls, secondary values shall be permitted to be doubled.
4. V is the design shear force calculated using limit-state analysis procedures in accordance with Section 6.7.2.4.1.
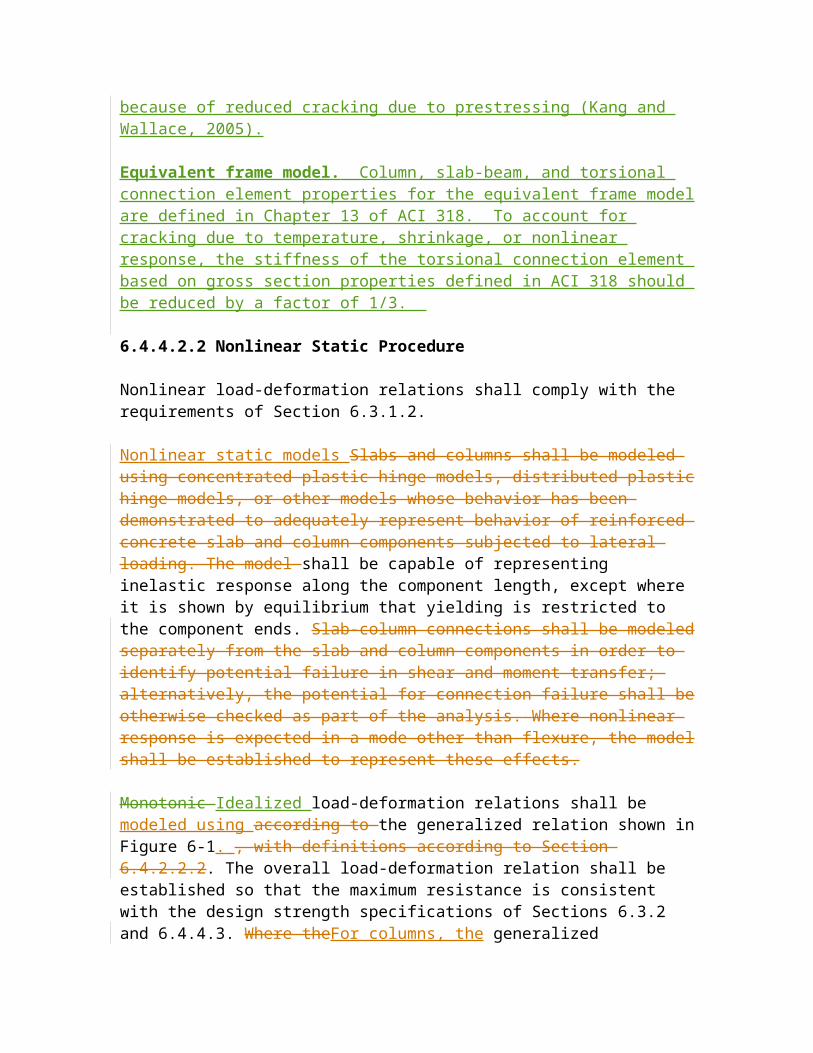
Figure 6-1 Generalized Force-Deformation Relations for Concrete Elements or Components
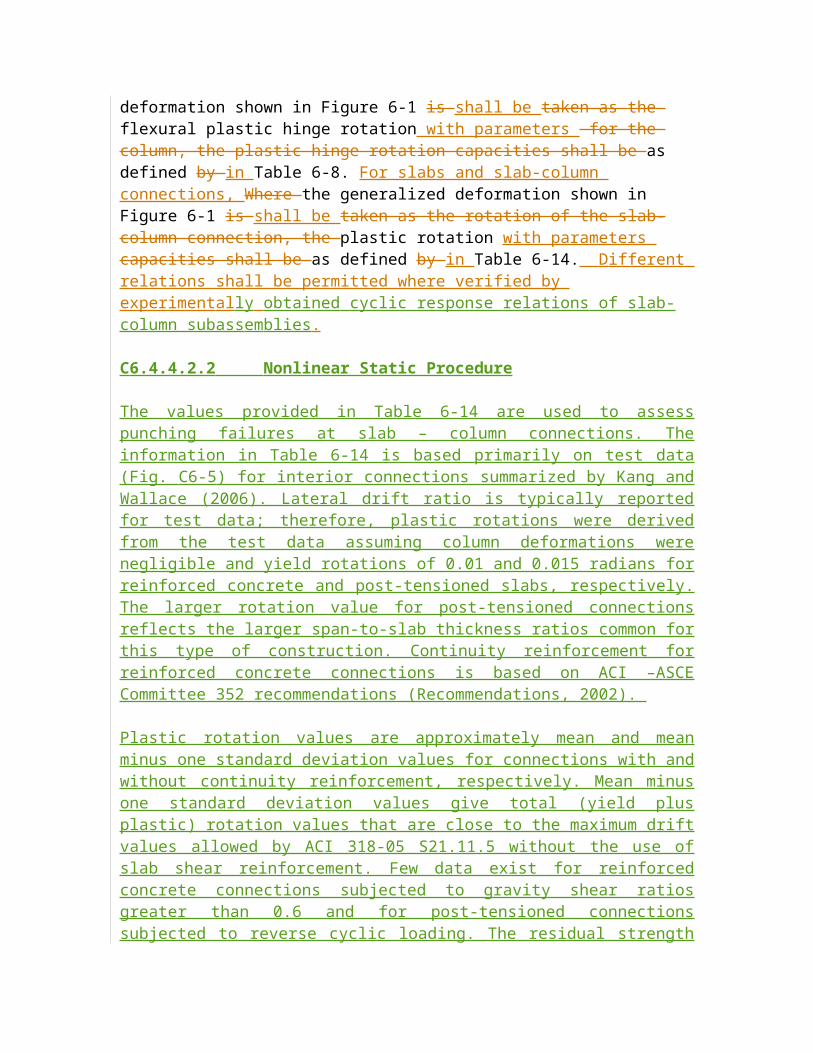
Figure C6-1 Beam-Column Joint Modeling (hatched portions are rigid)
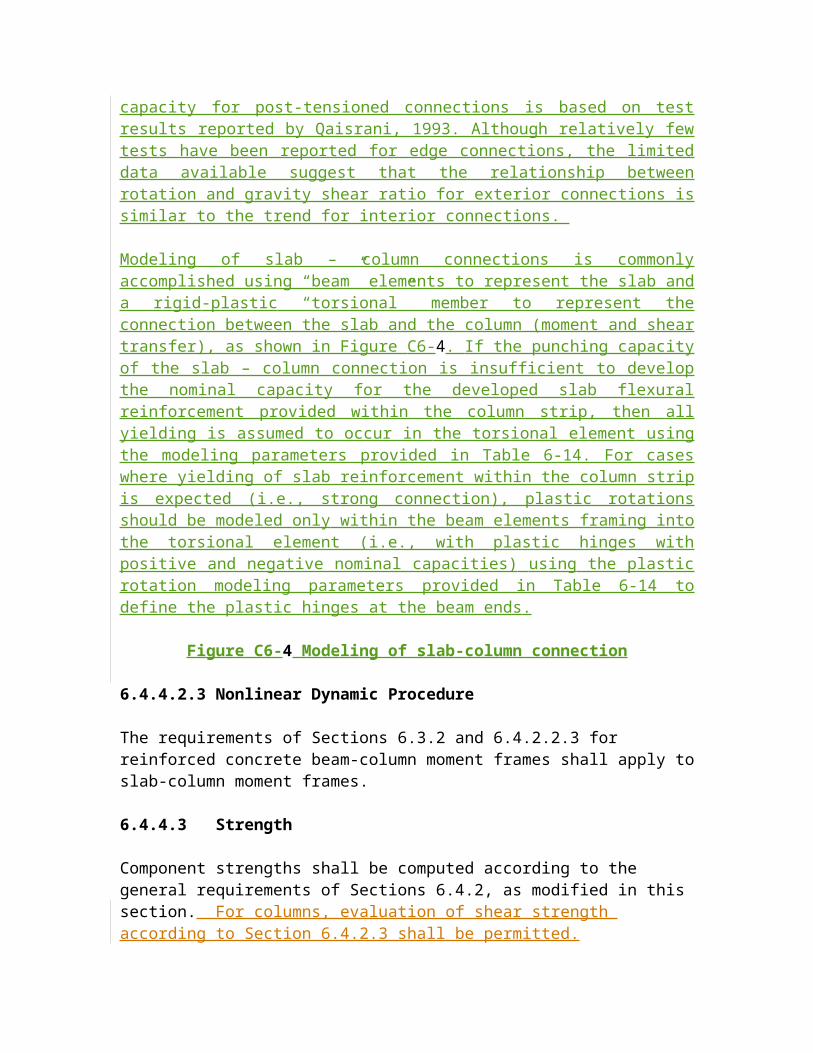
Figure C6-2 Fragility curve
p /p table
Pf
Pf table
Figure C6-3 Joint Classification (for response in the plane of the page)
Figure C6-4 Modeling of slab-column connection


![Pion-Nucleon Scattering and the NN CouplingConstant in the ...Chiral models, such as the cloudy bag models [4], contain pions in additions to quarks, and therefore also contain elementary](https://static.fdocument.org/doc/165x107/5ff9e2f54f2fc0639c435f4f/pion-nucleon-scattering-and-the-nn-couplingconstant-in-the-chiral-models-such.jpg)