
Example 1 of econometric analysis: the Market Model · Example 1 of econometric analysis: the...
24
Example 1 of econometric analysis: the Market Model Susan Thomas IGIDR, Bombay 18 November, 2008 Susan Thomas Example 1 of econometric analysis: the Market Model
Transcript of Example 1 of econometric analysis: the Market Model · Example 1 of econometric analysis: the...
Example 1 of econometric analysis: the MarketModel
Susan ThomasIGIDR, Bombay
18 November, 2008
Susan Thomas Example 1 of econometric analysis: the Market Model
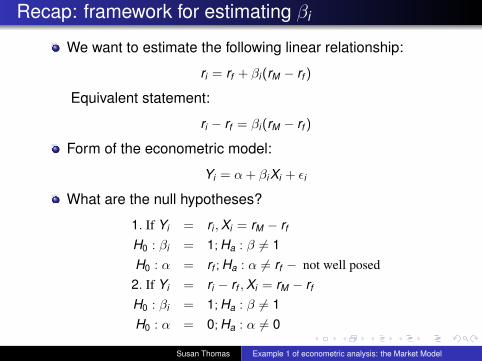
Recap: framework for estimating βi
We want to estimate the following linear relationship:
ri = rf + βi(rM − rf )
Equivalent statement:
ri − rf = βi(rM − rf )
Form of the econometric model:
Yi = α+ βiXi + εi
What are the null hypotheses?
1. If Yi = ri ,Xi = rM − rf
H0 : βi = 1; Ha : β 6= 1H0 : α = rf ; Ha : α 6= rf − not well posed
2. If Yi = ri − rf ,Xi = rM − rf
H0 : βi = 1; Ha : β 6= 1H0 : α = 0; Ha : α 6= 0
Susan Thomas Example 1 of econometric analysis: the Market Model
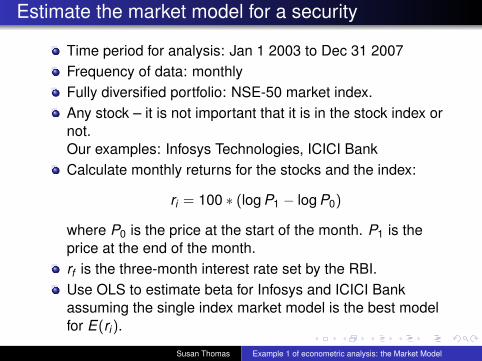
Estimate the market model for a security
Time period for analysis: Jan 1 2003 to Dec 31 2007Frequency of data: monthlyFully diversified portfolio: NSE-50 market index.Any stock – it is not important that it is in the stock index ornot.Our examples: Infosys Technologies, ICICI BankCalculate monthly returns for the stocks and the index:
ri = 100 ∗ (log P1 − log P0)
where P0 is the price at the start of the month. P1 is theprice at the end of the month.rf is the three-month interest rate set by the RBI.Use OLS to estimate beta for Infosys and ICICI Bankassuming the single index market model is the best modelfor E(ri).
Susan Thomas Example 1 of econometric analysis: the Market Model
Regression results for ICICI Bank returns
Susan Thomas Example 1 of econometric analysis: the Market Model
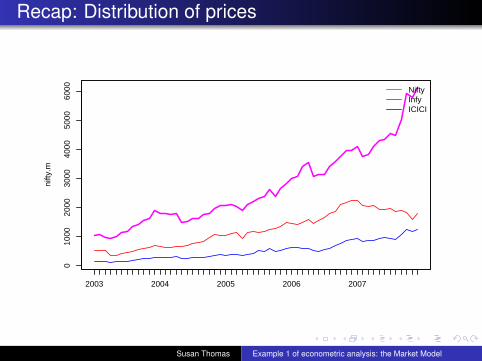
Recap: Distribution of prices
2003 2004 2005 2006 2007
010
0020
0030
0040
0050
0060
00
nifty
.m
NiftyInfyICICI
Susan Thomas Example 1 of econometric analysis: the Market Model
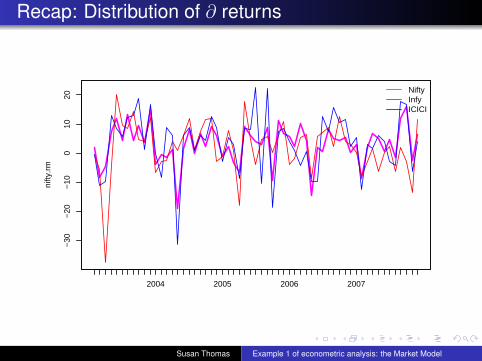
Recap: Distribution of ∂ returns
2004 2005 2006 2007
−30
−20
−10
010
20
nifty
.rm
NiftyInfyICICI
Susan Thomas Example 1 of econometric analysis: the Market Model
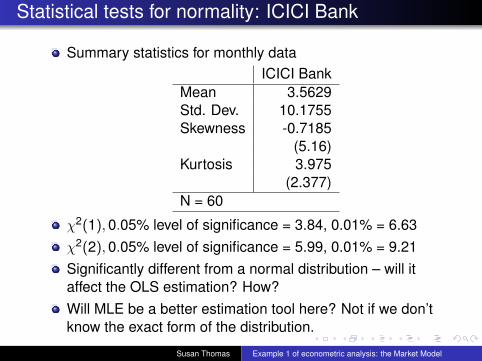
Statistical tests for normality: ICICI Bank
Summary statistics for monthly dataICICI Bank
Mean 3.5629Std. Dev. 10.1755Skewness -0.7185
(5.16)Kurtosis 3.975
(2.377)N = 60
χ2(1),0.05% level of significance = 3.84, 0.01% = 6.63χ2(2),0.05% level of significance = 5.99, 0.01% = 9.21Significantly different from a normal distribution – will itaffect the OLS estimation? How?Will MLE be a better estimation tool here? Not if we don’tknow the exact form of the distribution.
Susan Thomas Example 1 of econometric analysis: the Market Model
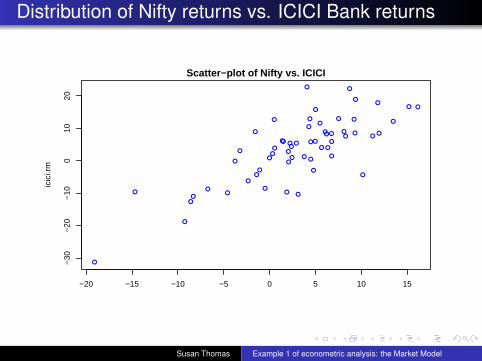
Distribution of Nifty returns vs. ICICI Bank returns
●
●●
●
●
●
●●
●
●
●
●
●
●
●
●
●
●
●
●●
●
●
●
●
●
●
●●
●
●
●
●
●●
●
●
●
●
● ●
●
●
●
●●
●
●
●
●●
●
●
●●
●●
●
●
−20 −15 −10 −5 0 5 10 15
−30
−20
−10
010
20Scatter−plot of Nifty vs. ICICI
icic
i.rm
Susan Thomas Example 1 of econometric analysis: the Market Model
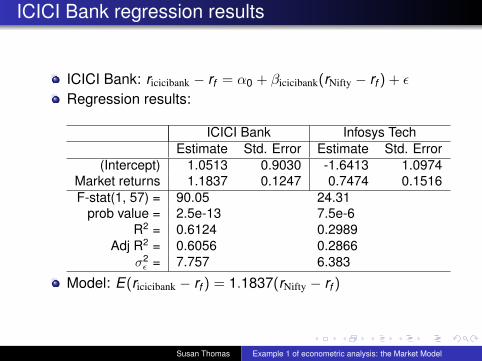
ICICI Bank regression results
ICICI Bank: ricicibank − rf = α0 + βicicibank(rNifty − rf ) + ε
Regression results:
ICICI Bank Infosys TechEstimate Std. Error Estimate Std. Error
(Intercept) 1.0513 0.9030 -1.6413 1.0974Market returns 1.1837 0.1247 0.7474 0.1516F-stat(1, 57) = 90.05 24.31
prob value = 2.5e-13 7.5e-6R2 = 0.6124 0.2989
Adj R2 = 0.6056 0.2866σ2
ε = 7.757 6.383
Model: E(ricicibank − rf ) = 1.1837(rNifty − rf )
Susan Thomas Example 1 of econometric analysis: the Market Model

Interpreting the regression results
On average, ICICI Bank price move by 1.2% when themarket returns are 1%.In comparison: on average, Infosys returns move 0.75%with a 1% move in the market portfolio.Market returns captures 61% of the variation in ICICI Bankreturns.But it captures only 30% of variation in InfosysTechnologies.
Susan Thomas Example 1 of econometric analysis: the Market Model
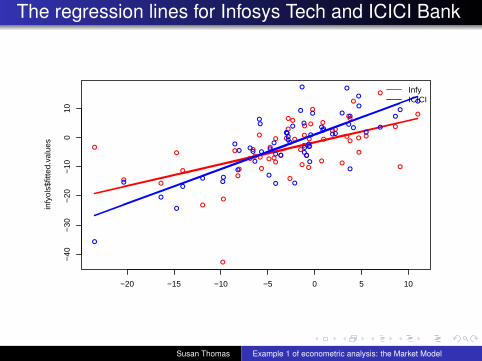
The regression lines for Infosys Tech and ICICI Bank
−20 −15 −10 −5 0 5 10
−40
−30
−20
−10
010
infy
ols$
fitte
d.va
lues
●
●
●
●
●
●●
●
●●
●
●
●●
●
●
●
●
●
●
● ●
●●
●
●
●
●
●
●
●●
●
●
●
●●
●●
●
●●
●
●
●
●●
●
●
●
●
●
●
●
●
●
●
●
●
●
●●
●
●
●
●●
●
●
●
●
●
●
●
●
●
●
●
●
●
●
●
●
●
●
●
●●
●
●
●
●
●●
●
●
●
●
● ●
●
●
●
●●
●
●
●
●●
●●
●
●
●●
●
●
InfyICICI
Susan Thomas Example 1 of econometric analysis: the Market Model
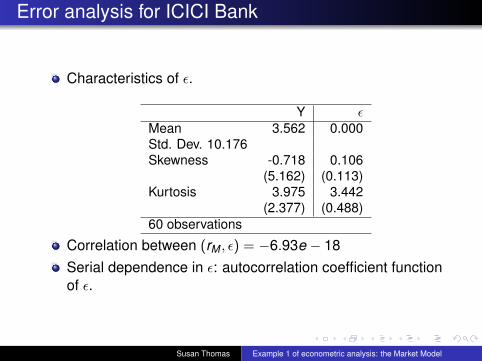
Error analysis for ICICI Bank
Characteristics of ε.
Y εMean 3.562 0.000Std. Dev. 10.176Skewness -0.718 0.106
(5.162) (0.113)Kurtosis 3.975 3.442
(2.377) (0.488)60 observations
Correlation between (rM , ε) = −6.93e − 18Serial dependence in ε: autocorrelation coefficient functionof ε.
Susan Thomas Example 1 of econometric analysis: the Market Model
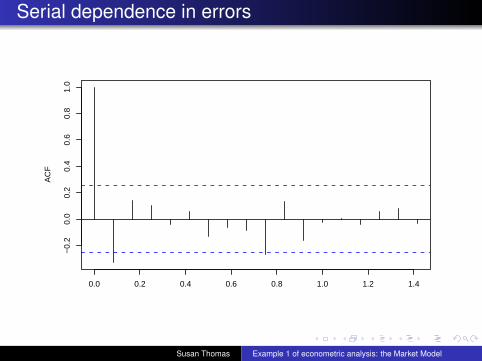
Serial dependence in errors
0.0 0.2 0.4 0.6 0.8 1.0 1.2 1.4
−0.
20.
00.
20.
40.
60.
81.
0
AC
F
Susan Thomas Example 1 of econometric analysis: the Market Model
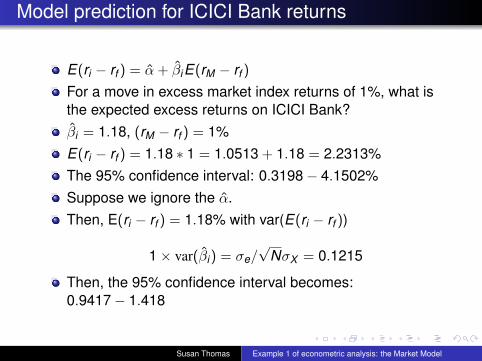
Model prediction for ICICI Bank returns
E(ri − rf ) = α̂+ β̂iE(rM − rf )
For a move in excess market index returns of 1%, what isthe expected excess returns on ICICI Bank?β̂i = 1.18, (rM − rf ) = 1%E(ri − rf ) = 1.18 ∗ 1 = 1.0513 + 1.18 = 2.2313%The 95% confidence interval: 0.3198− 4.1502%Suppose we ignore the α̂.Then, E(ri − rf ) = 1.18% with var(E(ri − rf ))
1× var(β̂i) = σe/√
NσX = 0.1215
Then, the 95% confidence interval becomes:0.9417− 1.418
Susan Thomas Example 1 of econometric analysis: the Market Model
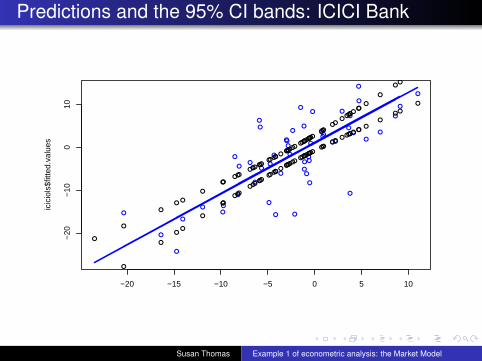
Predictions and the 95% CI bands: ICICI Bank
−20 −15 −10 −5 0 5 10
−20
−10
010
icic
iols
$fitt
ed.v
alue
s
●
●
●
●
●
●
●●
●
●
●
●
●
●
●●
●
●
●
●
●
●
●
●
●
●
●●
●
●
●
●
●●
●
●
●
●
● ●
●
●
●
●●
●
●
●
●●
●
●
●
●
●●
●
●
●
●
●
●
●
●
●
●
●
●
●
●
●●
●
●
●
●
●
●
●
●
●
●
●
●
●
●
●
●●
●
●
●
●
●
●
●
●
●
●
●
●
●●
●
●
●
●
●
●
●
●
●
●
●
●
●
●●
●
●
●
●
●
●
●
●
●
●
●
●●
●
●
●
●
●
●
●
●
●
●
●
●
●
●
●
●●
●
●
●
●
●
●
●
●
●
●
●
●
●●
●
●
●
●
●
●
●
●
●
●
●
●
●
●
Susan Thomas Example 1 of econometric analysis: the Market Model
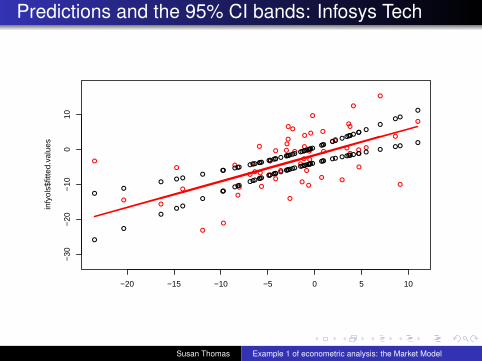
Predictions and the 95% CI bands: Infosys Tech
−20 −15 −10 −5 0 5 10
−30
−20
−10
010
infy
ols$
fitte
d.va
lues
●
●
●
●
●
●●
●
●●
●
●
●●
●
●
●
●
●
●
● ●
●●
●
●
●
●
●
●
●●
●
●
●
●
●
●
●
●
●●
●
●
●
●●
●
●
●
●
●
●
●
●
●
●
●
●
●
●
●
●
●
●
●
●
●
●
●
●
●●
●
●
●
●
●
●
●
●●
●
●
●
●
●
●●●
●
●
●
●●
●
●
●
●
●●
●
●●●
●
●
●
●
●●
●
●
●
●
●
●
●
●
●
●
●
●
●
●
●
●
●
●
●
●●
●
●
●
●
●
●
●
●
●
●
●
●
●
●
●
●●
●
●
●
●●
●
●
●
●
●●
●
●●●
●●
●
●
●●
●
●
●
●
●
●
●
Susan Thomas Example 1 of econometric analysis: the Market Model
HW: Model prediction for Infosys Technologies
HW: For the same period data, what is the E(ri − rf ) forInfosys Technologies?What is the 95% CI for the prediction with and without theα?Find the monthly returns that Infosys Technologies actuallyobtained in January 2008.How well did the model’s 95% prediction fare?
Susan Thomas Example 1 of econometric analysis: the Market Model
Transformation of the data and implicationon the results
Susan Thomas Example 1 of econometric analysis: the Market Model

Changing the scale of the dependent variable
We have the model: Yt = α+ βXt + utWhat if we accidentally create Yt∗ = 1000Yt and run theregression instead?Impact: New equation on Yt∗ = 1000Yt
⇒ Yt∗ = 1000(α + βXt + ut)
= 1000α + 1000βXt + 1000ut
⇒ Yt∗ = α′+ β′iXt + ut∗
⇒ α̂′ = 1000α̂
β̂′ = 1000β̂
σ̂u∗t= 1000σut
The impact on the regression results:Standard error of regression ×1000Standard error of regression co-efficient ×1000But t-stats, R2, F-stats are not changed because they areratios. Scale measures cancel out.
Conclusion: When Yt is changed by K, values of ALLrequired co-efficients by K.
Susan Thomas Example 1 of econometric analysis: the Market Model
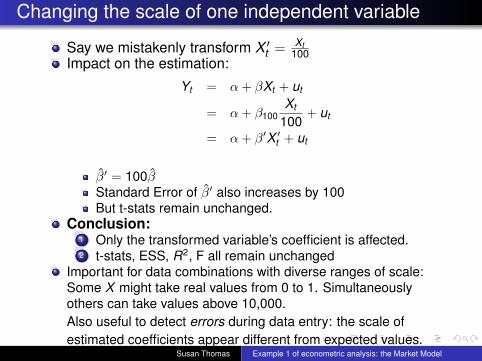
Changing the scale of one independent variable
Say we mistakenly transform X ′t = Xt100
Impact on the estimation:
Yt = α+ βXt + ut
= α+ β100Xt
100+ ut
= α+ β′X ′t + ut
β̂′ = 100β̂Standard Error of β̂′ also increases by 100But t-stats remain unchanged.
Conclusion:1 Only the transformed variable’s coefficient is affected.2 t-stats, ESS, R2, F all remain unchanged
Important for data combinations with diverse ranges of scale:Some X might take real values from 0 to 1. Simultaneouslyothers can take values above 10,000.Also useful to detect errors during data entry: the scale ofestimated coefficients appear different from expected values.
Susan Thomas Example 1 of econometric analysis: the Market Model
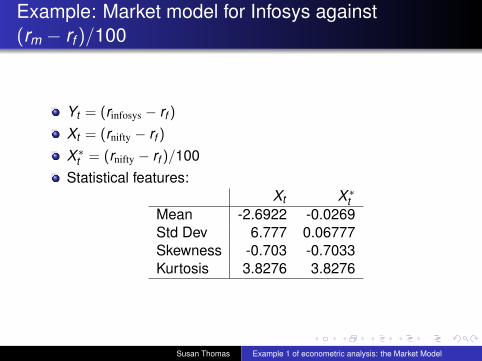
Example: Market model for Infosys against(rm − rf )/100
Yt = (rinfosys − rf )
Xt = (rnifty − rf )
X ∗t = (rnifty − rf )/100Statistical features:
Xt X ∗tMean -2.6922 -0.0269Std Dev 6.777 0.06777Skewness -0.703 -0.7033Kurtosis 3.8276 3.8276
Susan Thomas Example 1 of econometric analysis: the Market Model
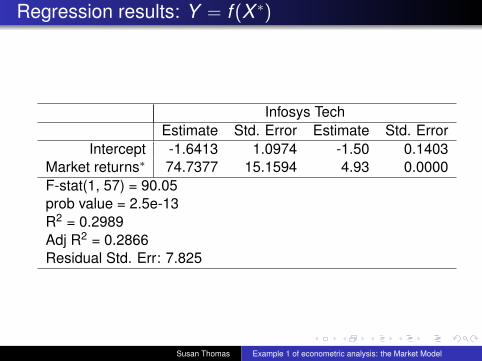
Regression results: Y = f (X ∗)
Infosys TechEstimate Std. Error Estimate Std. Error
Intercept -1.6413 1.0974 -1.50 0.1403Market returns∗ 74.7377 15.1594 4.93 0.0000F-stat(1, 57) = 90.05prob value = 2.5e-13R2 = 0.2989Adj R2 = 0.2866Residual Std. Err: 7.825
Susan Thomas Example 1 of econometric analysis: the Market Model
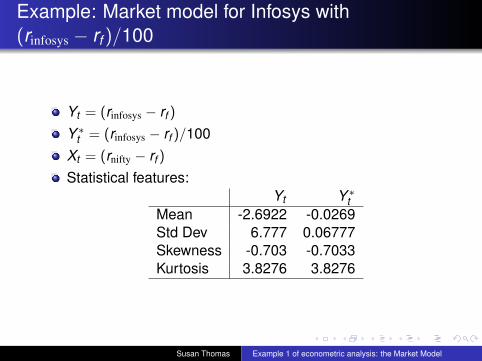
Example: Market model for Infosys with(rinfosys − rf )/100
Yt = (rinfosys − rf )
Y ∗t = (rinfosys − rf )/100Xt = (rnifty − rf )
Statistical features:Yt Y ∗t
Mean -2.6922 -0.0269Std Dev 6.777 0.06777Skewness -0.703 -0.7033Kurtosis 3.8276 3.8276
Susan Thomas Example 1 of econometric analysis: the Market Model

Regression results: Y = f (X ∗)
Infosys TechEstimate Std. Error Estimate Std. Error
Intercept -1.6413 1.0974 -1.50 0.1403Market returns∗ 74.7377 15.1594 4.93 0.0000F-stat(1, 57) = 90.05prob value = 2.5e-13R2 = 0.2989Adj R2 = 0.2866Residual Std. Err: 7.825
Susan Thomas Example 1 of econometric analysis: the Market Model