Entry Games in Exogenous Sunk Costs Industries (Sutton ... · Entry Games in Exogenous Sunk Costs...
22
1 Entry Games in Exogenous Sunk Costs Industries (Sutton, Chapter 2) Structure-Conduct-Performance Paradigm: Models one-way chain of causation Concentration to Performance, treating Conduct as a ‘Black Box’ New Industrial Economics: 1) Explicitly models Conduct 2) Allows for market structure to be Endogenous What determines market structure? Sutton (1991) – predictions that generalise across a broad range of industries “Benchmark”: Traditional Limit Theorem which ⇒ 0 , → ∞ → ion Concentrat m Equilibriu The MS As σ
Transcript of Entry Games in Exogenous Sunk Costs Industries (Sutton ... · Entry Games in Exogenous Sunk Costs...
1
Entry Games in Exogenous Sunk Costs Industries (Sutton, Chapter 2)
Structure-Conduct-Performance Paradigm: Models one-way chain of causation Concentration to Performance, treating Conduct as a ‘Black Box’ New Industrial Economics:
1) Explicitly models Conduct 2) Allows for market structure to be
Endogenous What determines market structure? Sutton (1991) – predictions that generalise across a broad range of industries “Benchmark”: Traditional Limit Theorem which ⇒
0, →∞→ ionConcentratmEquilibriuTheMSAsσ
2
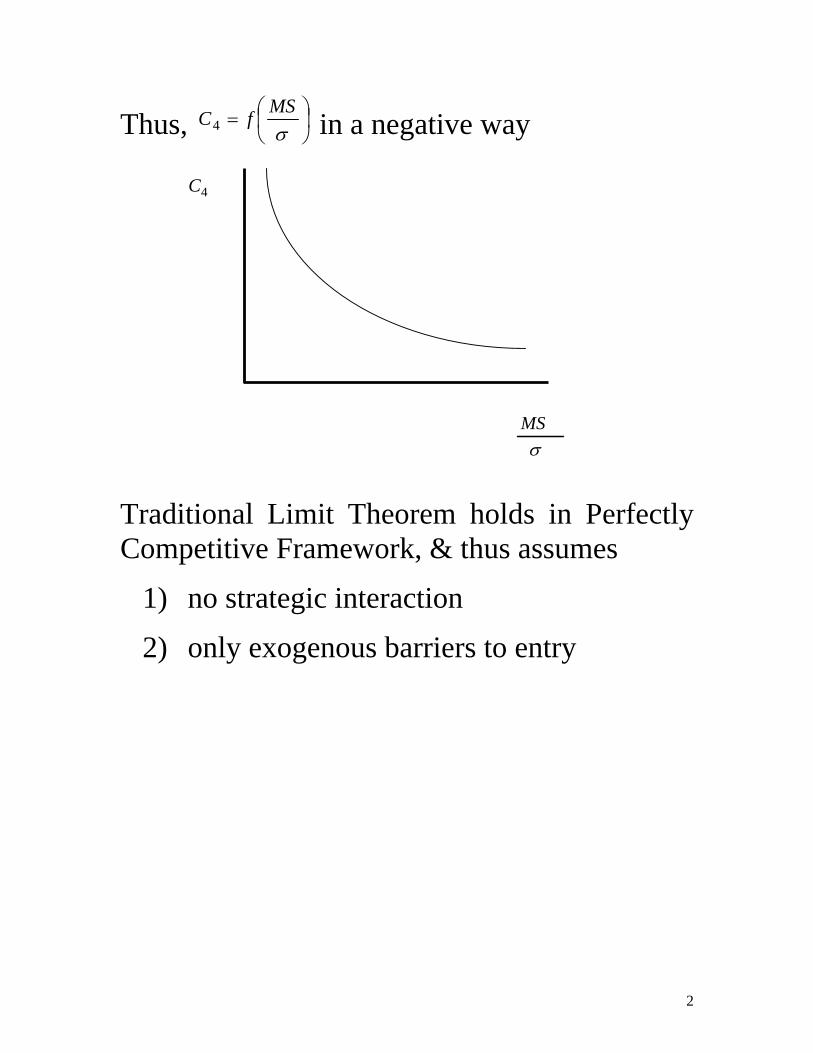
Thus, ⎟⎠⎞
⎜⎝⎛=σ
MSfC4 in a negative way Traditional Limit Theorem holds in Perfectly Competitive Framework, & thus assumes
1) no strategic interaction
2) only exogenous barriers to entry
4C
σMS
3
Entry: Exogenous Sunk Costs
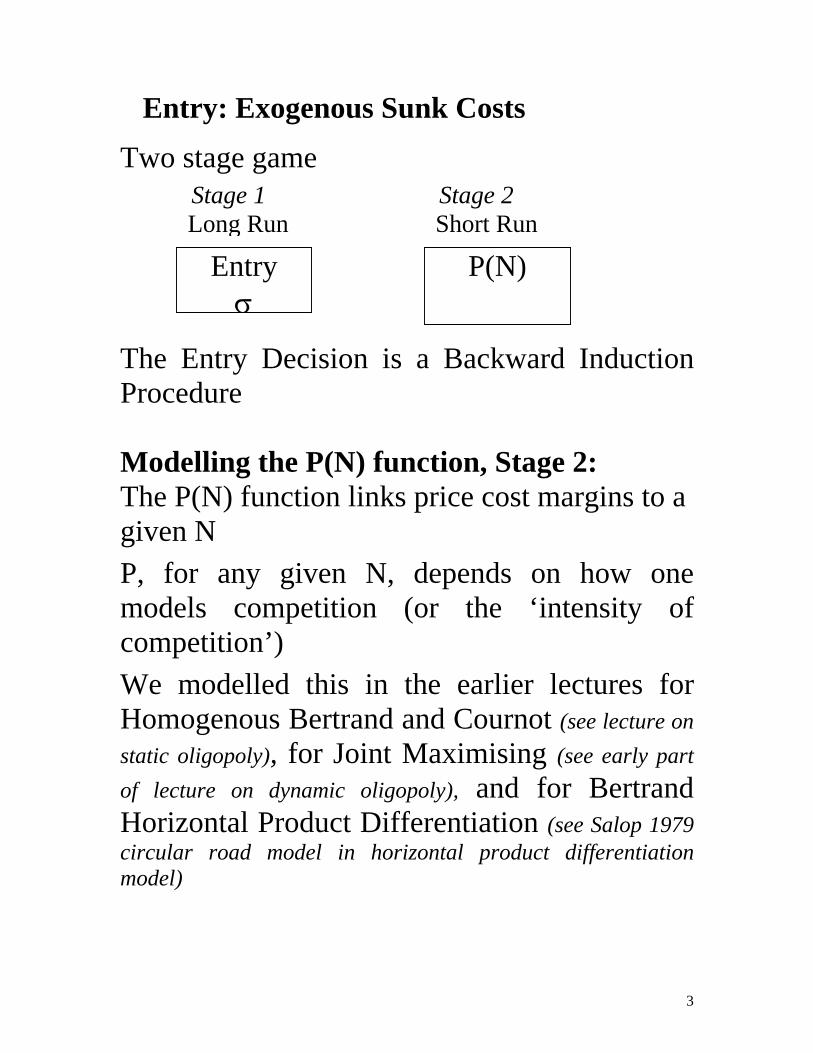
Two stage game
The Entry Decision is a Backward Induction Procedure
Modelling the P(N) function, Stage 2: The P(N) function links price cost margins to a given N P, for any given N, depends on how one models competition (or the ‘intensity of competition’) We modelled this in the earlier lectures for Homogenous Bertrand and Cournot (see lecture on static oligopoly), for Joint Maximising (see early part of lecture on dynamic oligopoly), and for Bertrand Horizontal Product Differentiation (see Salop 1979 circular road model in horizontal product differentiation model)
Stage 1 Long Run
Stage 2 Short Run
Entry σ
P(N)
4
Modelling Entry, Stage 1:
Enter with exogenous sunk cost σ
Entry occurs as long as the expost entry profit > sunk costs of entry
Last firm enters where expost entry profit = σ
5
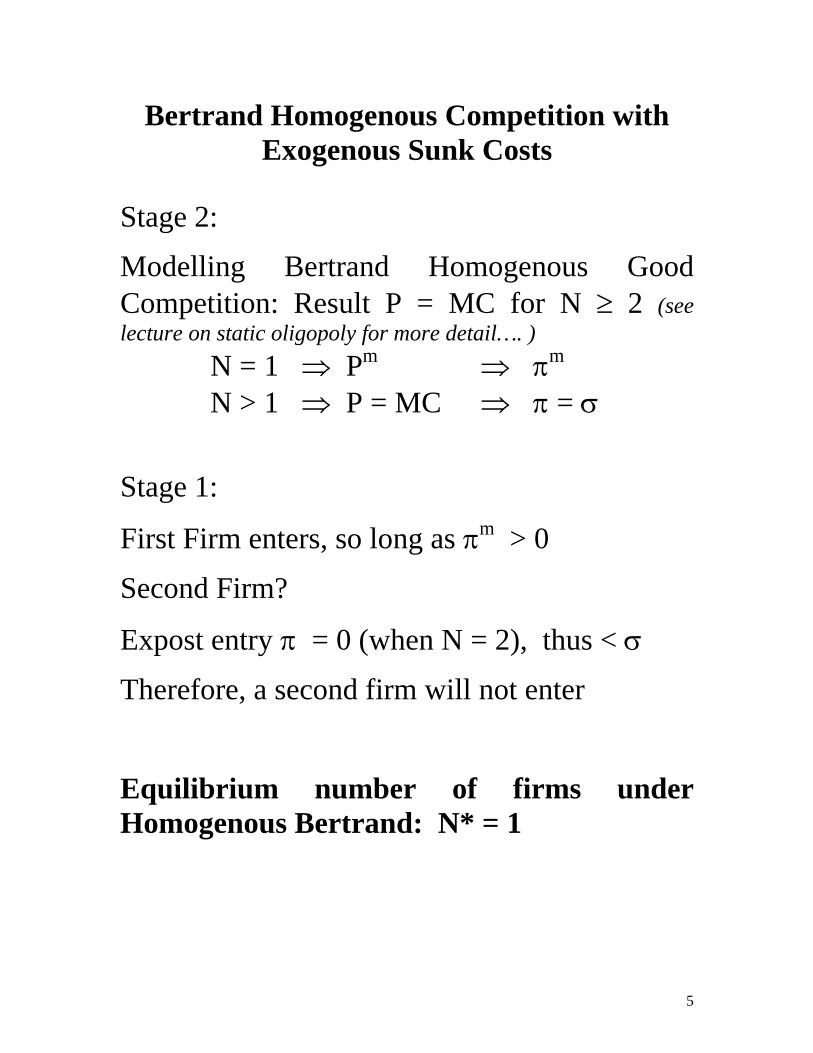
Bertrand Homogenous Competition with Exogenous Sunk Costs
Stage 2:
Modelling Bertrand Homogenous Good Competition: Result P = MC for N ≥ 2 (see lecture on static oligopoly for more detail…. )
N = 1 ⇒ Pm ⇒ πm N > 1 ⇒ P = MC ⇒ π = σ
Stage 1:
First Firm enters, so long as πm > 0
Second Firm?
Expost entry π = 0 (when N = 2), thus < σ
Therefore, a second firm will not enter
Equilibrium number of firms under Homogenous Bertrand: N* = 1
6
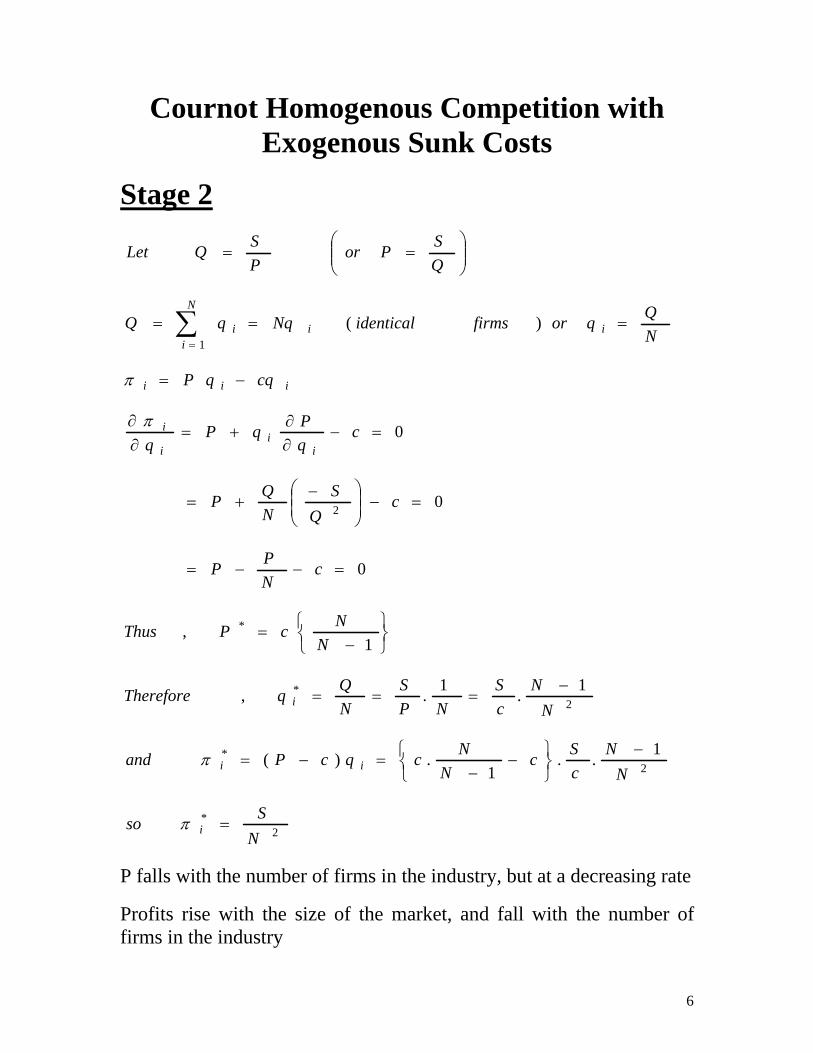
Cournot Homogenous Competition with Exogenous Sunk Costs
Stage 2
2*
2*
2*
*
2
1
1..1
.)(
1.1.,
1,
0
0
0
)(
NSso
NN
cSc
NNcqcPand
NN
cS
NPS
NQqTherefore
NNcPThus
cNPP
cQ
SNQP
cqPqP
q
cqqP
NQqorfirmsidenticalNqqQ
QSPor
PSQLet
i
ii
i
ii
i
i
iii
i
N
iii
=
−
⎭⎬⎫
⎩⎨⎧ −
−=−=
−===
⎭⎬⎫
⎩⎨⎧
−=
=−−=
=−⎟⎟⎠
⎞⎜⎜⎝
⎛ −+=
=−∂∂
+=∂∂
−=
===
⎟⎟⎠
⎞⎜⎜⎝
⎛==
∑=
π
π
π
π
P falls with the number of firms in the industry, but at a decreasing rate
Profits rise with the size of the market, and fall with the number of firms in the industry
7
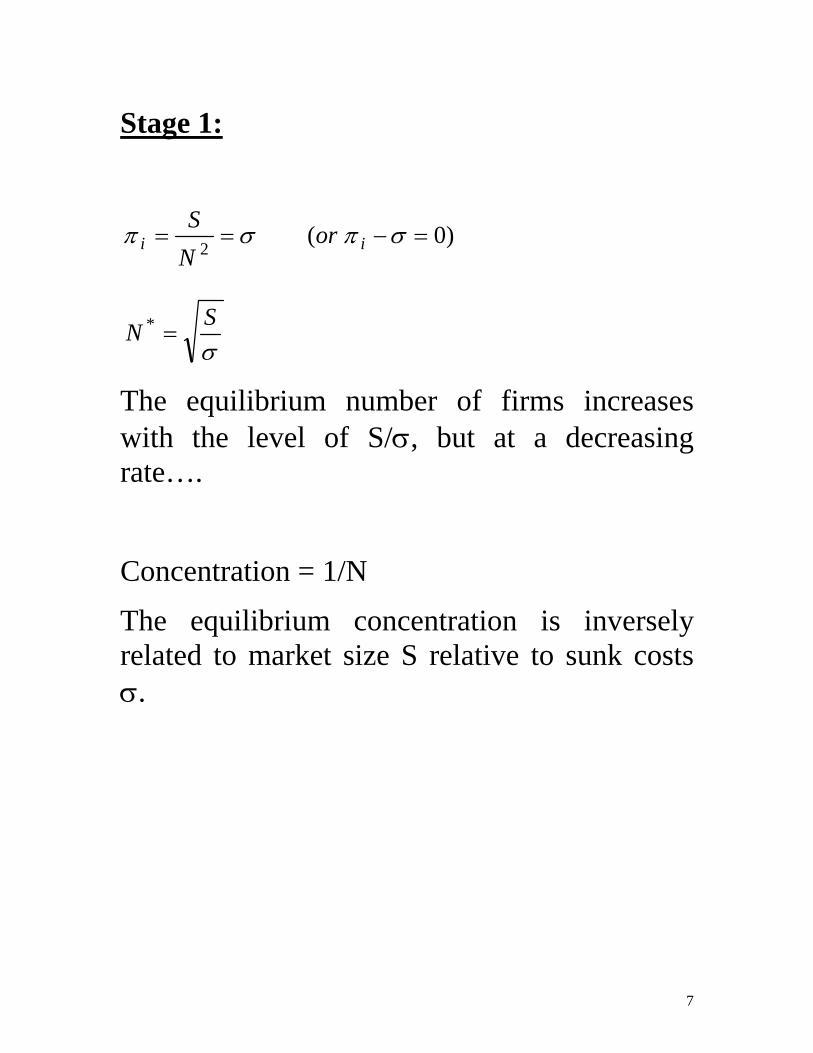
Stage 1:
σ
σπσπ
SN
orNS
ii
=
=−==
*
2)0(
The equilibrium number of firms increases with the level of S/σ, but at a decreasing rate….
Concentration = 1/N
The equilibrium concentration is inversely related to market size S relative to sunk costs σ.
8
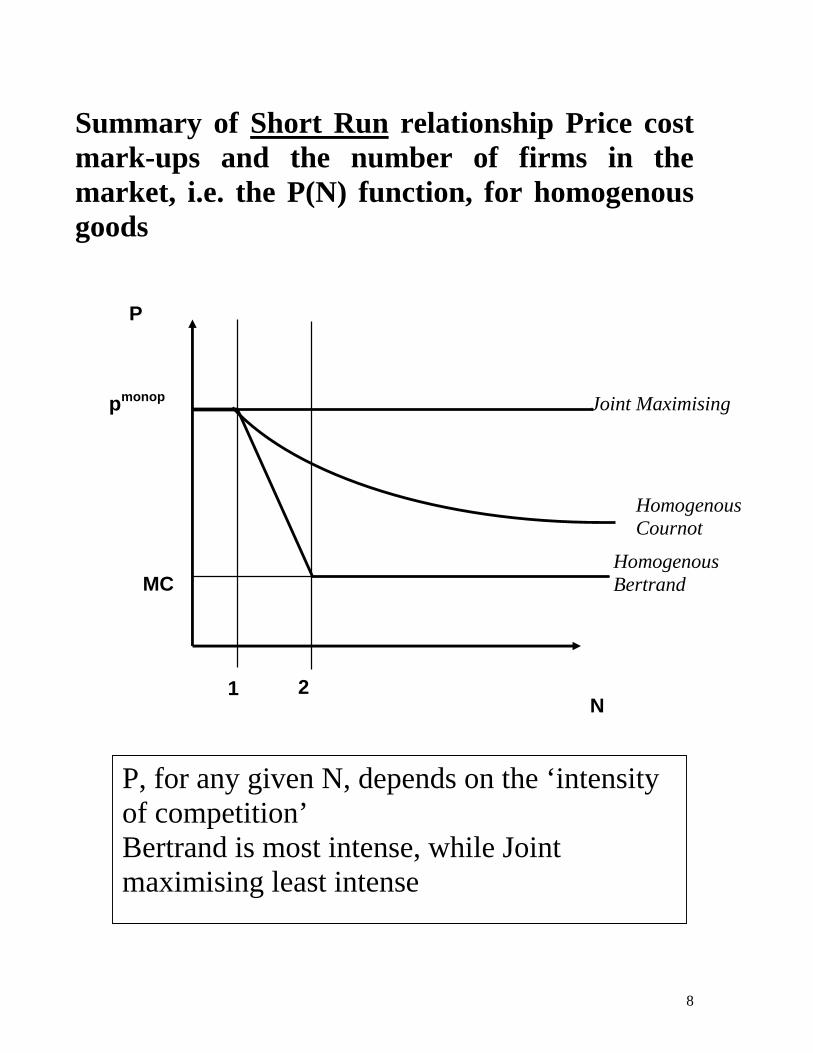
Summary of Short Run relationship Price cost mark-ups and the number of firms in the market, i.e. the P(N) function, for homogenous goods
P
N
MC
pmonop
1
Homogenous Bertrand
Homogenous Cournot
Joint Maximising
2
P, for any given N, depends on the ‘intensity of competition’ Bertrand is most intense, while Joint maximising least intense
9
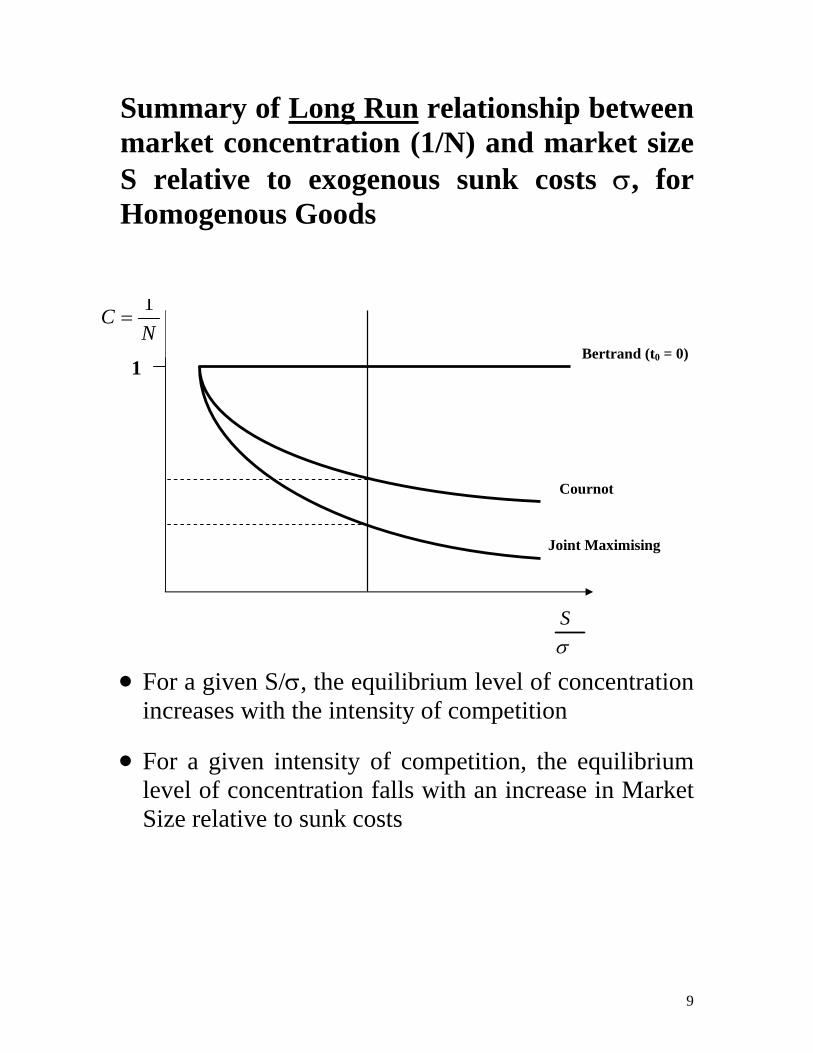
Summary of Long Run relationship between market concentration (1/N) and market size S relative to exogenous sunk costs σ, for Homogenous Goods
• For a given S/σ, the equilibrium level of concentration increases with the intensity of competition
• For a given intensity of competition, the equilibrium level of concentration falls with an increase in Market Size relative to sunk costs
σS
NC 1=
1 Bertrand (t0 = 0)
Cournot
Joint Maximising
10
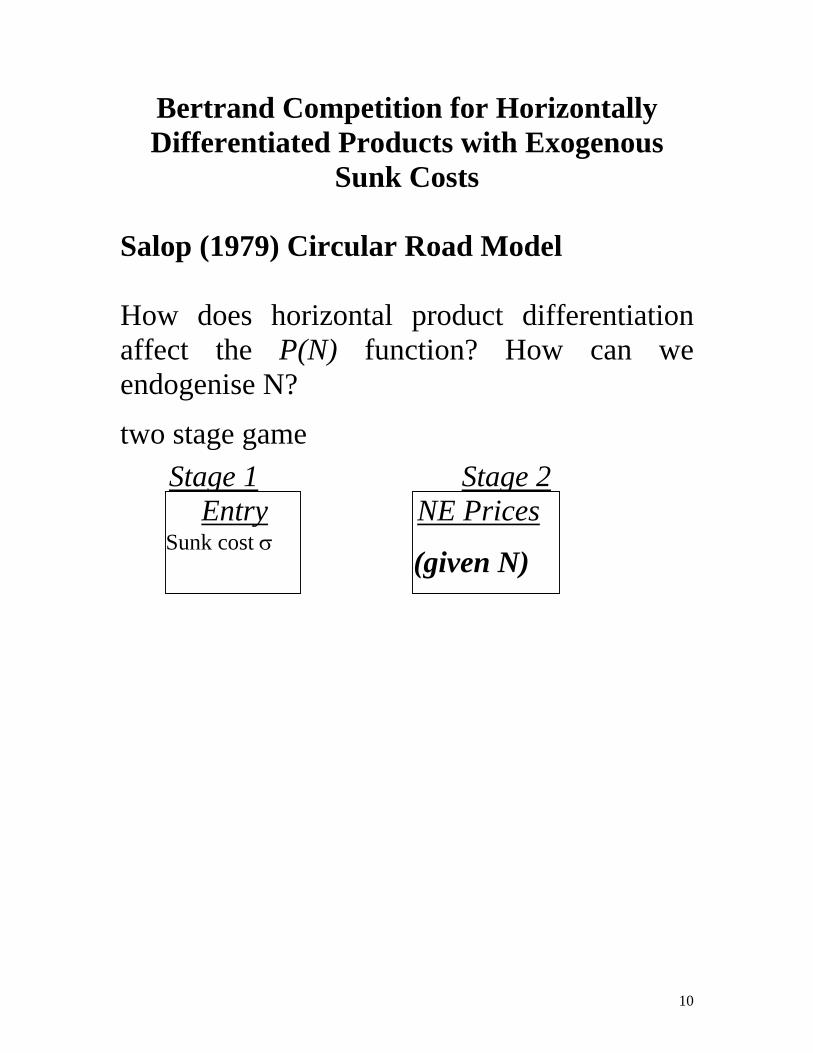
Bertrand Competition for Horizontally Differentiated Products with Exogenous
Sunk Costs Salop (1979) Circular Road Model How does horizontal product differentiation affect the P(N) function? How can we endogenise N?
two stage game
Stage 1 Stage 2Entry
Sunk cost σ
NE Prices
(given N)
11
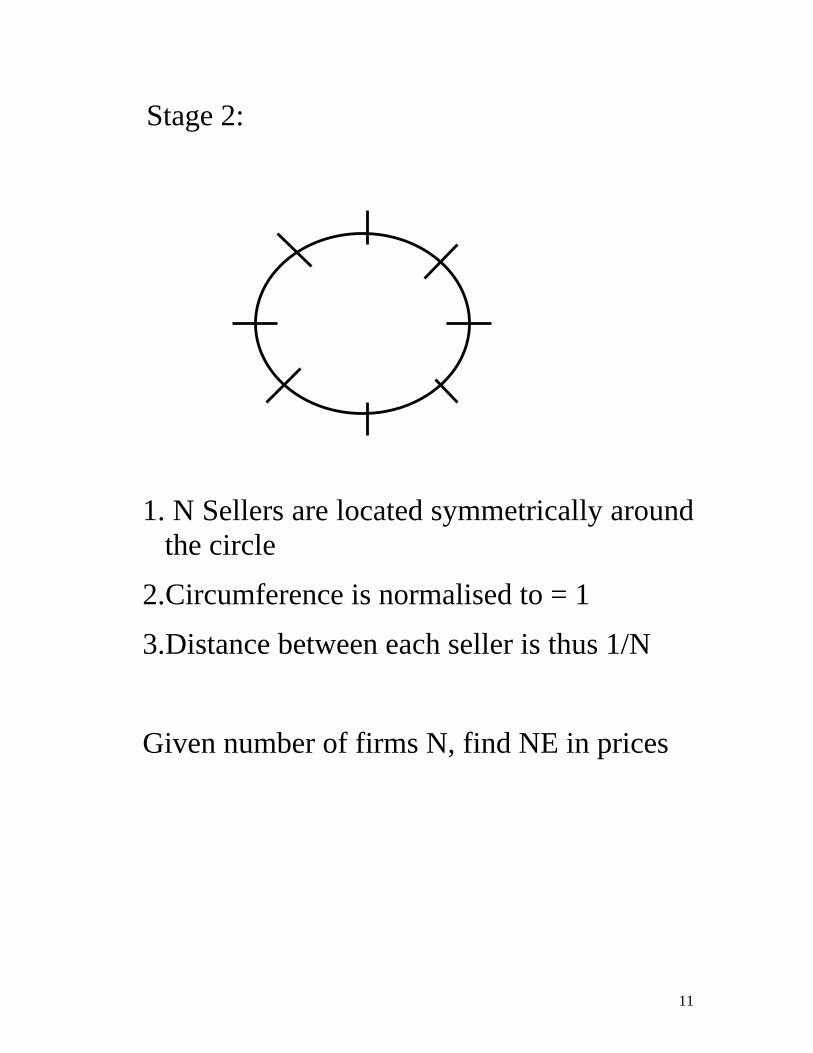
Stage 2:
1. N Sellers are located symmetrically around the circle
2. Circumference is normalised to = 1
3. Distance between each seller is thus 1/N
Given number of firms N, find NE in prices
12
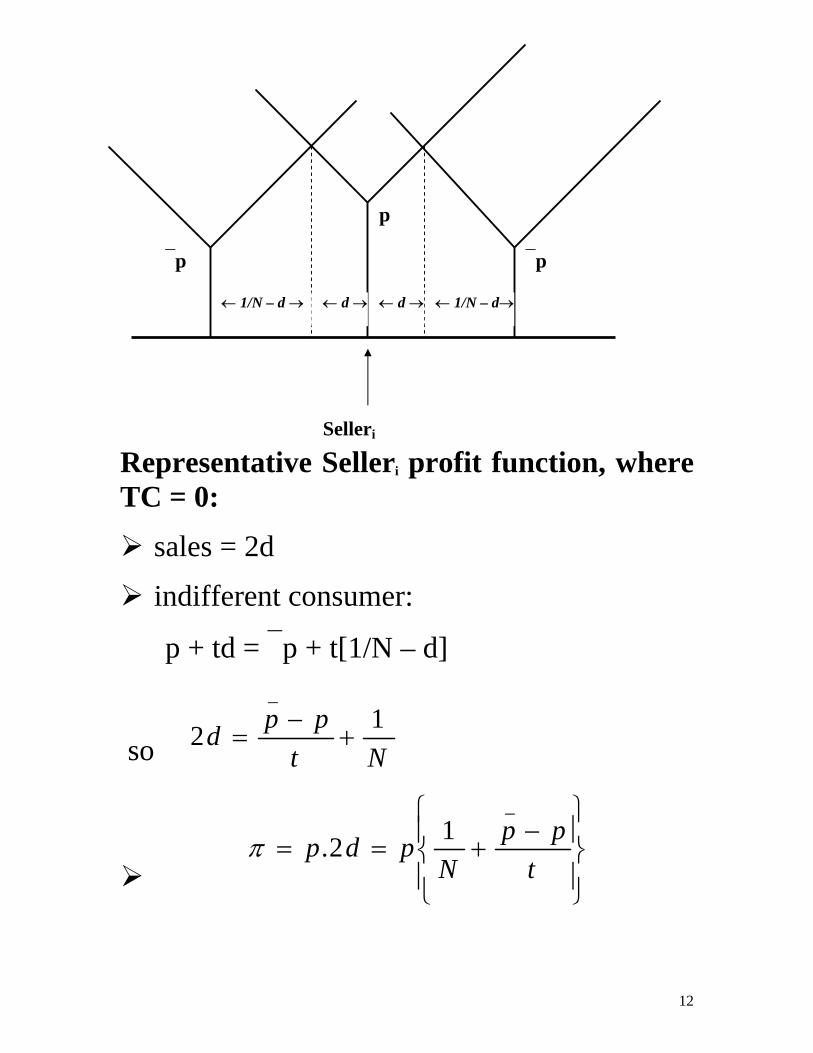
Representative Selleri profit function, where TC = 0:
sales = 2d
indifferent consumer:
p + td = ⎯p + t[1/N – d]
so Ntppd 12
_
+−
=
⎪⎭
⎪⎬⎫
⎪⎩
⎪⎨⎧
−+==
tpp
Npdp
_12.π
⎯p ⎯p
p
← d → ← d →← 1/N – d → ← 1/N – d→
Selleri
13
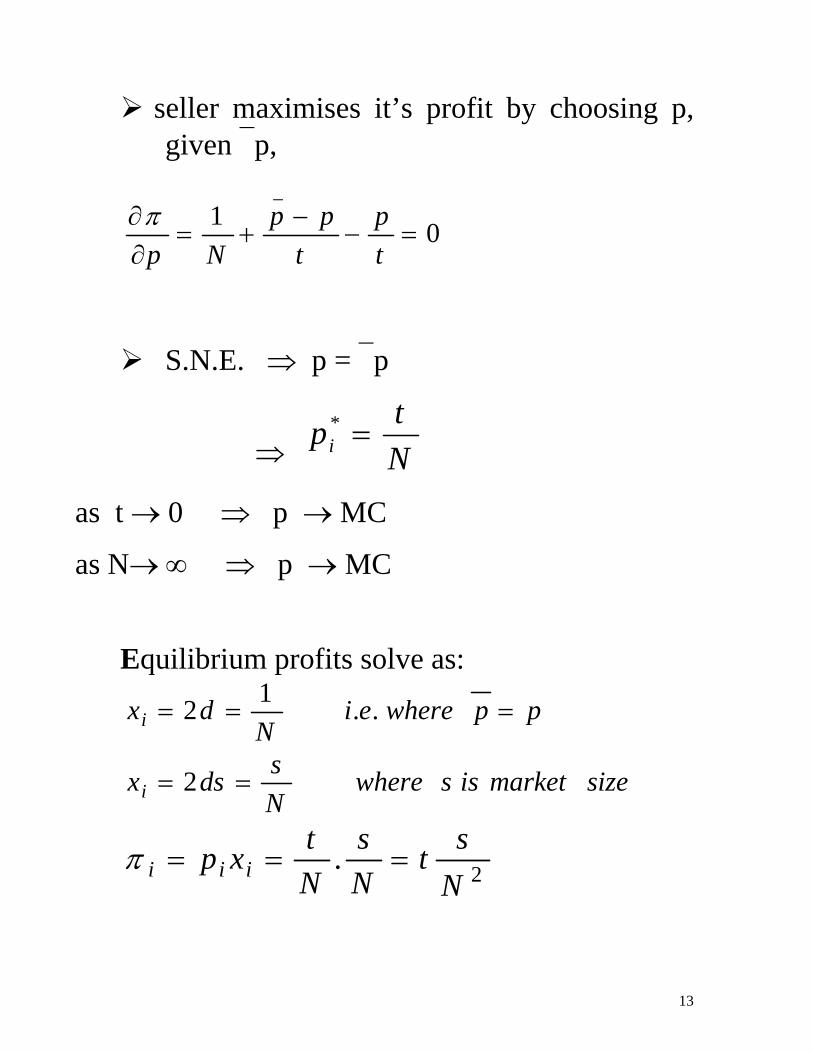
seller maximises it’s profit by choosing p, given ⎯p,
01_
=−−
+=∂∂
tp
tpp
Npπ
S.N.E. ⇒ p = ⎯p
⇒ Ntpi =
*
as t → 0 ⇒ p → MC
as N→ ∞ ⇒ p → MC
Equilibrium profits solve as:
ppwhereeiN
dxi === ..12
sizemarketisswhereNsdsxi == 2
2.Nst
Ns
Ntxp iii ===π
14
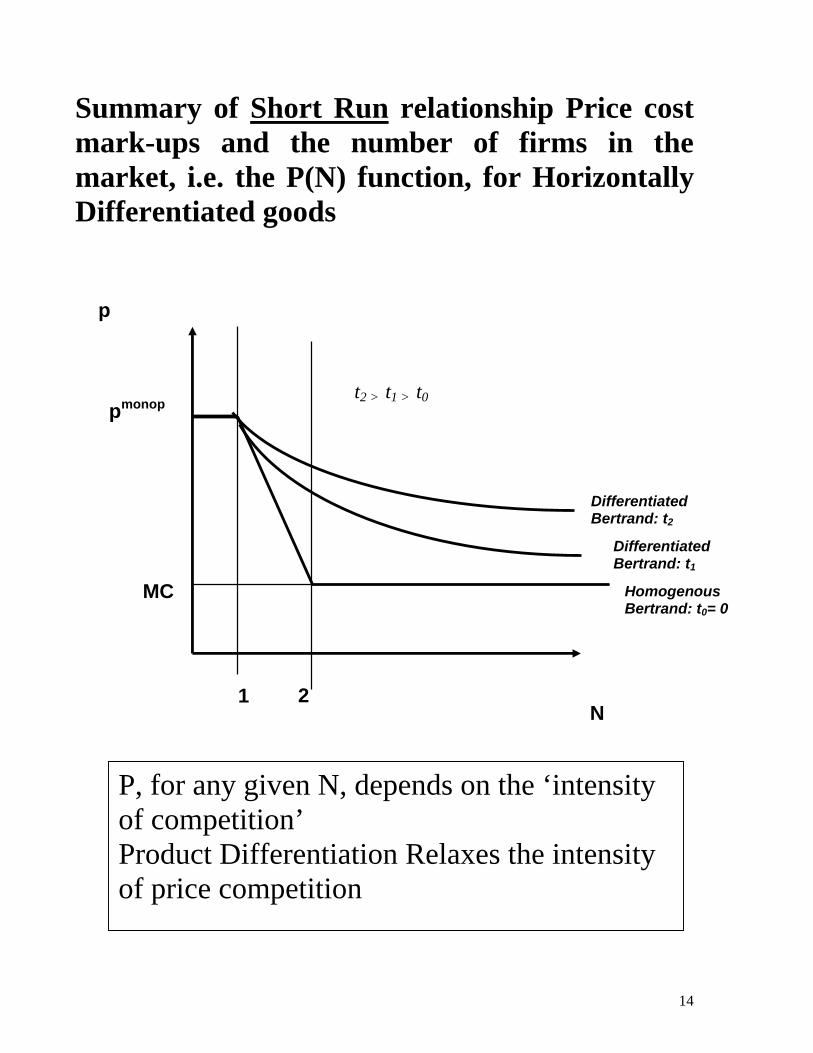
Summary of Short Run relationship Price cost mark-ups and the number of firms in the market, i.e. the P(N) function, for Horizontally Differentiated goods
p
N
MC
pmonop
1
Homogenous Bertrand: t0= 0
Differentiated Bertrand: t1
Differentiated Bertrand: t2
t2 > t1 > t0
2
P, for any given N, depends on the ‘intensity of competition’ Product Differentiation Relaxes the intensity of price competition
15
Recall, the P(N) function that links price cost margins to a given N P, for any given N, depends on the ‘intensity of competition’ (Bertrand is most intense) Horizontal Product Differentiation relaxes the intensity of competition
16
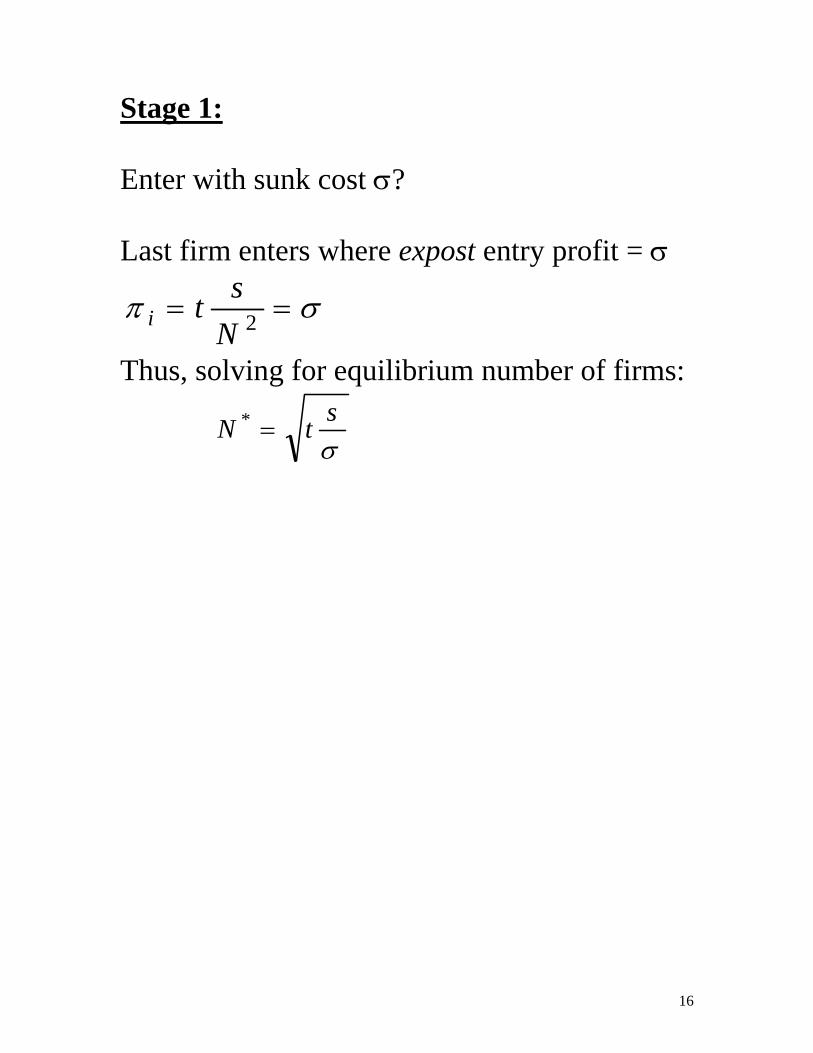
Stage 1: Enter with sunk cost σ? Last firm enters where expost entry profit = σ
σπ == 2Nsti
Thus, solving for equilibrium number of firms:
σstN =*
17
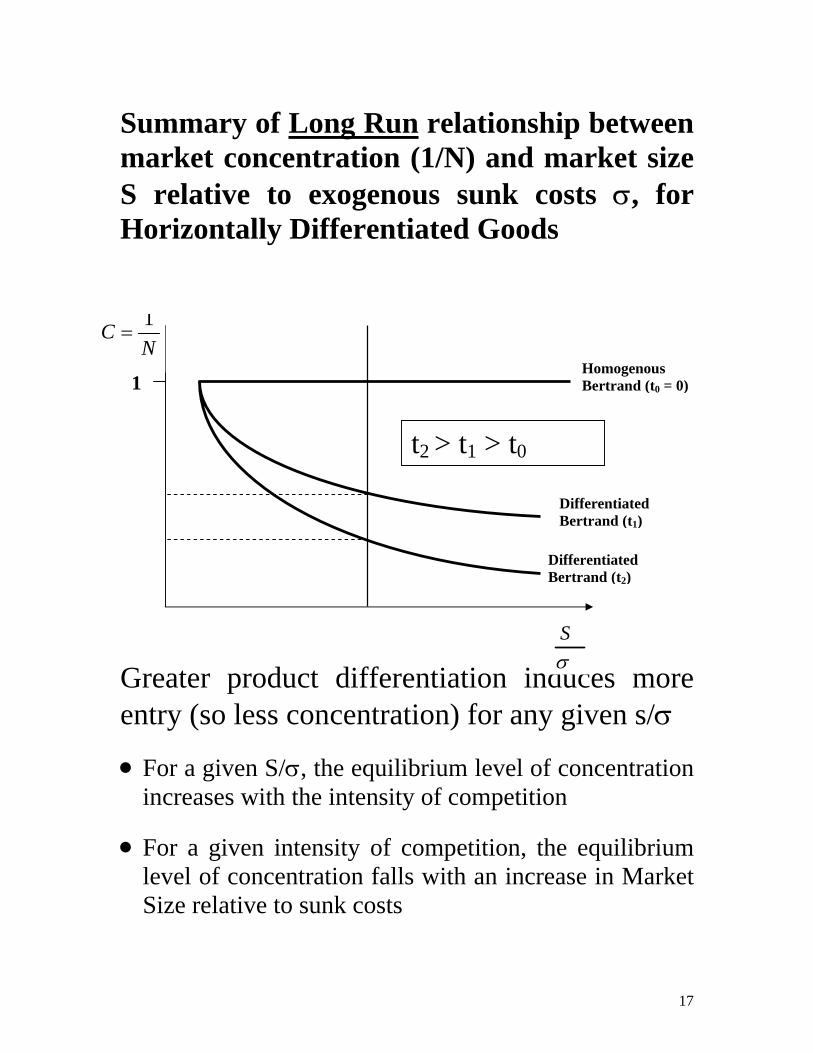
Summary of Long Run relationship between market concentration (1/N) and market size S relative to exogenous sunk costs σ, for Horizontally Differentiated Goods Greater product differentiation induces more entry (so less concentration) for any given s/σ
• For a given S/σ, the equilibrium level of concentration increases with the intensity of competition
• For a given intensity of competition, the equilibrium level of concentration falls with an increase in Market Size relative to sunk costs
σS
NC 1=
1 Homogenous Bertrand (t0 = 0)
Differentiated Bertrand (t1)
Differentiated Bertrand (t2)
t2 > t1 > t0
18
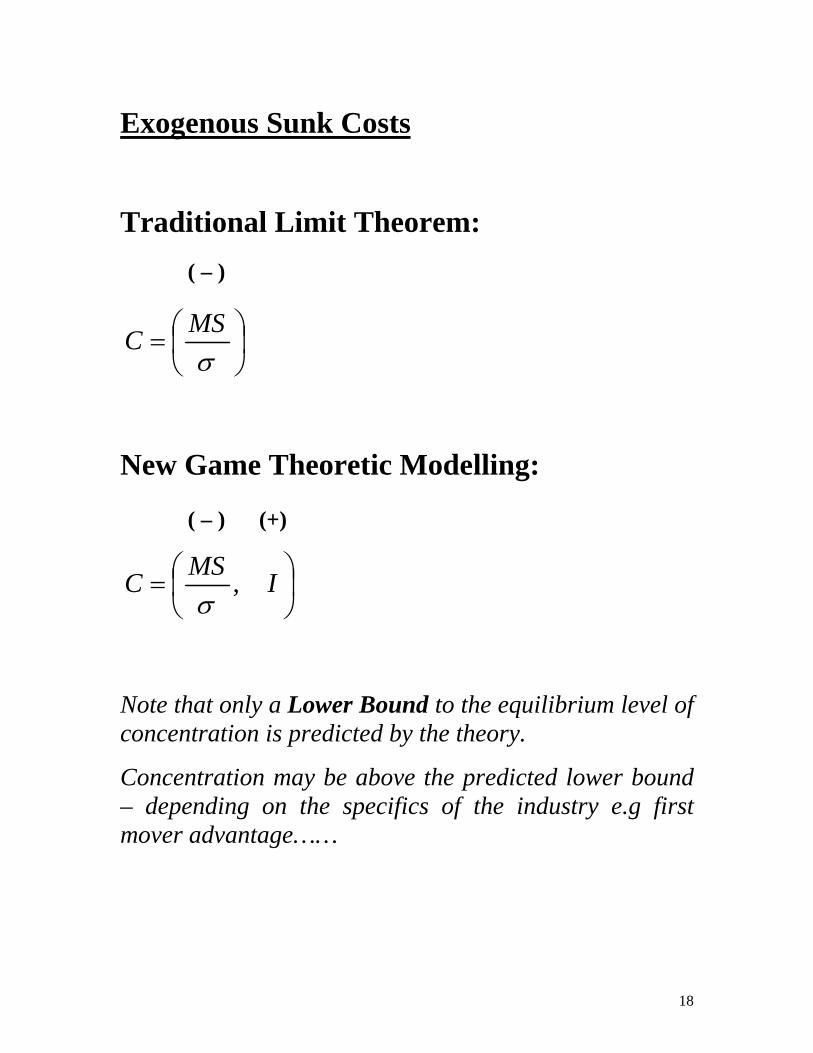
Exogenous Sunk Costs
Traditional Limit Theorem:
⎟⎠⎞
⎜⎝⎛=σ
MSC
New Game Theoretic Modelling:
⎟⎠⎞
⎜⎝⎛= IMSC ,σ
Note that only a Lower Bound to the equilibrium level of concentration is predicted by the theory.
Concentration may be above the predicted lower bound – depending on the specifics of the industry e.g first mover advantage……
( – )
( – ) (+)
19
Note that while in the short-run, an industry may fall below the lower bound to concentration, this is not possible in the long run.
For any given market size relative to sunk costs, if concentration is below the predicted lower bound this implies that there are too many firms in the industry. Prices are not high enough to sustain a normal rate of return on sunk costs incurred. This results in the forced exit of firms, or mergers/acquisitions – thereby reducing N and increasing concentration levels back up to (or above) the predicted lower bound
20
The Salt and Sugar Case Studies (Sutton, Chapter 6)
Objective: examine the long run evolution of market structure for the salt and sugar industries using theoretical framework above. Both Salt and Sugar industries were initially highly fragmented. Today they are highly concentrated.
Theoretical Predictions: market will become more concentrated where there is (i) a decrease in market size relative to sunk costs or (ii) an increase in the intensity of competition
21
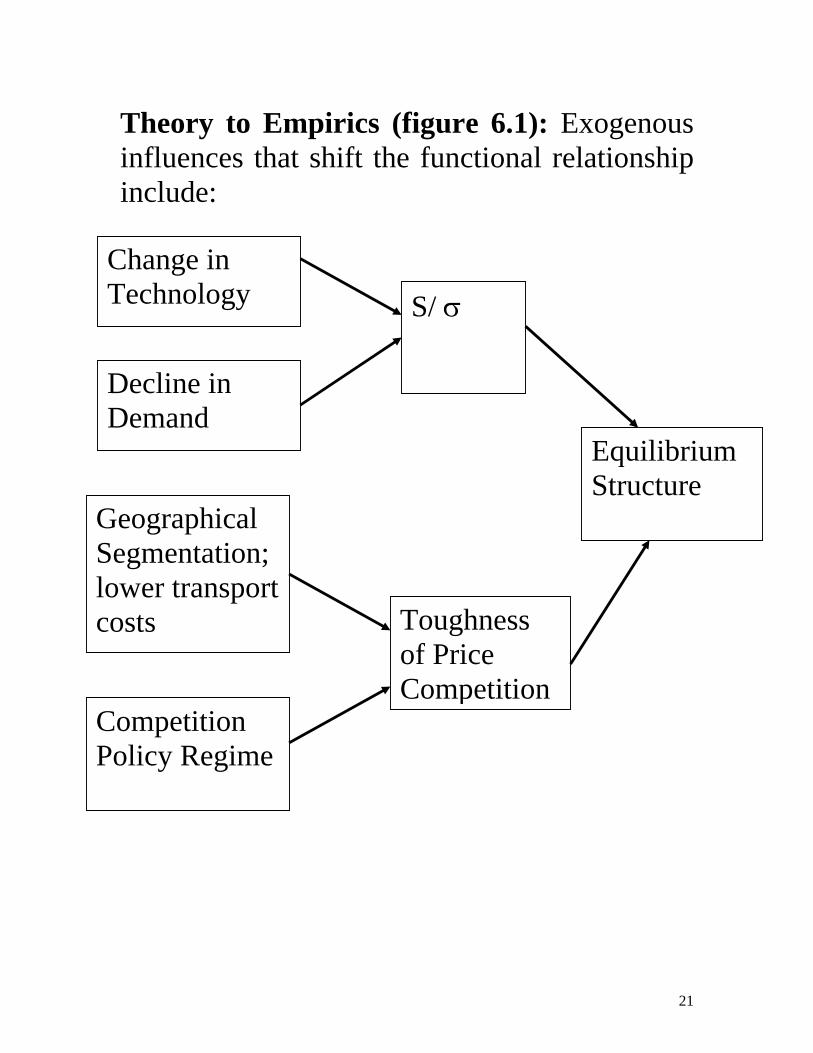
Theory to Empirics (figure 6.1): Exogenous influences that shift the functional relationship include:
Change in Technology S/ σ
Decline in Demand
Geographical Segmentation; lower transport costs
Competition Policy Regime
Toughness of Price Competition
Equilibrium Structure
22
Cases: Salt: highly concentrated in all countries (tough competition policy indicates tough price competition) Sugar: concentration reflects nature of competition policy US: strict policy Europe: relaxed Japan: relaxed pre-1914 Salt and Sugar: • homogenous good, tough price competition • Theory predicts a concentrated structure • Intense price competition resulted in
attempts to collude • Price coordination in fragmented and
homogenous good industry is hard to maintain
• Concentrated structure emerged as a result of firm exit/mergers/acquisitions

![Heat Integration Chapt. 10. Costs Heat Exchanger Purchase Cost – C P =K(Area) 0.6 Annual Cost –C A =i m [ΣC p,i + ΣC P,A,j ]+sF s +(cw)F cw i m =return.](https://static.fdocument.org/doc/165x107/56649f165503460f94c2b934/heat-integration-chapt-10-costs-heat-exchanger-purchase-cost-c-p-karea.jpg)