
ENERGY AUDIT GUIDE - PART B - ΚΑΠΕ · 2005-04-27 · ENERGY AUDIT GUIDE - PART B 1 ENERGY AUDIT...
33
Transcript of ENERGY AUDIT GUIDE - PART B - ΚΑΠΕ · 2005-04-27 · ENERGY AUDIT GUIDE - PART B 1 ENERGY AUDIT...
ENERGY AUDIT GUIDE - PART B
1
ENERGY AUDIT GUIDEPART B: SYSTEM RETROFITS FOR ENERGY EFFICIENCY
CCEENNTTRREE FFOORR RREENNEEWWAABBLLEE EENNEERRGGYY SSOOUURRCCEESS
ATHENSMAY 2000
COMMUNITY INITIATIVE

The present edition constitutes part of a series of three Technical Guides published by the Centre for Renewable Energy Sources (CRES) regardingthe Energy Audit procedure in buildings and in industry. The aim of these publications is to comprise a useful and practical tool for Engineers andother scientists that are going to be occupied in the field of Energy Auditing.
The Guides were published by CRES in the frame of project 124/375 of the ADAPT Community Initiative entitled: "Specialisation of Engineers andother Scientists in Energy Audit Actions". The project was co-financed, according to the European Social Fund (ESF) decree, from the DirectorateGeneral for Employment and Social Affairs of the European Commission and has been carried out under the supervision of the Division forCommunity Initiatives of the Hellenic Ministry for Labour and Social Affairs.
The Training Department of CRES was responsible for the implementation of the project, with the scientific support of the Energy Policy &Programming and Supervision & Execution of Energy Programming Departments of CRES. Dr. Ch. Malamatenios, who is the Head of CRES TrainingDept, coordinated the project that was realised during the 1998-2000 period.
The transnational partnership was completed by the French organisation ARMINES - Centre d' Energetique, whose colleagues contributed in manyways to the proper dispatch of the project, thus retaining its European dimension, as well as to the preparation of a part of these Guides. More specif-ically for this Guide, parts of Chapters 2, 3, 4, 5 and 6 have been reproduced, after relevant elaboration, from the texts produced by ARMINES -Centre d' Energetique in the frame of the present project. The original texts are also included in the book: Krarti, M., 2000, "Energy Audit for Buildings,Engineering Approach", CRC Press LCC, whose author (Pr. M. Krarti, University of Colorado at Boulder) worked in the project on behalf of partnerARMINES - Centre d' Energetique. For this reason, copy of any portion of these Chapters is prohibited without the permission of CRES, the authorand CRC Press LCC.
The views expressed in this publication do not necessarily reflect the view of theEuropean Commission, which co-financed the production of the Guides. CRESand the European Commission neither make any warranty or representation,expressed or implied, with respect to the information contained in this report,nor assume any liability with respect to the use of, or damages resulting fromthe use of this information.
ENERGY AUDIT GUIDE - PART B
3
CONTENTS1. GENERAL CONSIDERATIONS REGARDING AN ENERGY AUDIT___________________________________________________ 42. BUILDING ENVELOPE ENERGY AUDIT _______________________________________________________________________________ 42.1. Introduction ________________________________________________________________________________________________________________ 42.2. Simplified calculation tools for building envelope audits___________________________________________________________________________ 42.2.1. Degree-days method_______________________________________________________________________________________________________ 52.2.2. Estimation of the energy use savings _________________________________________________________________________________________ 52.2.3. Estimation of the building BLC ______________________________________________________________________________________________ 62.2.4. Estimation of the Degree-days_______________________________________________________________________________________________ 62.3. Selected retrofits for the building envelope ______________________________________________________________________________________ 62.3.1. Insulation of poorly insulated building envelope components_____________________________________________________________________ 62.3.2. Windows improvements ____________________________________________________________________________________________________ 62.3.3. Reduction of air-infiltration __________________________________________________________________________________________________ 73. ENERGY RETROFIT OF ELECTRIC SYSTEMS _______________________________________________________________________ 83.1. Introduction ________________________________________________________________________________________________________________ 83.2. Power factor improvement ____________________________________________________________________________________________________ 83.3. Electrical motor retrofits ______________________________________________________________________________________________________ 83.3.1. Replacement with energy-efficient motors _____________________________________________________________________________________ 83.3.2. Energy savings calculations _________________________________________________________________________________________________ 93.4. Energy-efficient lighting ______________________________________________________________________________________________________ 103.4.1. Introduction _______________________________________________________________________________________________________________ 103.4.2. Energy-efficient lighting systems _____________________________________________________________________________________________ 103.4.3. Lighting controls___________________________________________________________________________________________________________ 123.5. Power quality _______________________________________________________________________________________________________________ 133.5.1. Introduction _______________________________________________________________________________________________________________ 133.5.2. Total harmonic distortion____________________________________________________________________________________________________ 133.6. Selected examples for electric measures to save energy use ______________________________________________________________________ 143.6.1. Power factor correction - Calculation of the capacitor size _______________________________________________________________________ 143.6.2. Install High Efficacy Lamps - Calculation of energy savings ______________________________________________________________________ 144. UPGRADE OF CENTRAL HEATING SYSTEMS________________________________________________________________________ 154.1. Introduction ________________________________________________________________________________________________________________ 154.2. Basic combustion principles and fuel types _____________________________________________________________________________________ 154.3. Boiler configurations and components__________________________________________________________________________________________ 154.3.1. Boiler types _______________________________________________________________________________________________________________ 154.3.2. Firing systems_____________________________________________________________________________________________________________ 154.3.3. Boiler thermal efficiency ____________________________________________________________________________________________________ 164.4. Boiler efficiency improvements ________________________________________________________________________________________________ 174.4.1. Existing boiler tune-up______________________________________________________________________________________________________ 174.4.2. High efficiency boilers ______________________________________________________________________________________________________ 184.4.3. Modular boilers____________________________________________________________________________________________________________ 185. ENERGY IMPROVEMENTS OF COOLING SYSTEMS_________________________________________________________________ 185.1. Introduction ________________________________________________________________________________________________________________ 185.2. Basic cooling principles ______________________________________________________________________________________________________ 185.3. Types of cooling systems ____________________________________________________________________________________________________ 195.3.1. Unitary AC systems ________________________________________________________________________________________________________ 195.3.2. Central chillers ____________________________________________________________________________________________________________ 195.4. Energy conservation measures ________________________________________________________________________________________________ 205.4.1. Relations used ____________________________________________________________________________________________________________ 205.4.2. Chiller replacement ________________________________________________________________________________________________________ 205.4.3. Chiller control improvement _________________________________________________________________________________________________ 215.4.4. Alternative cooling systems _________________________________________________________________________________________________ 226. HVAC SYSTEMS RETROFIT ____________________________________________________________________________________________ 226.1. Introduction ________________________________________________________________________________________________________________ 226.2. Types of HVAC systems______________________________________________________________________________________________________ 226.3. Ventilation __________________________________________________________________________________________________________________ 236.3.1. Reduced ventilation air _____________________________________________________________________________________________________ 236.3.2. Air-side economizers _______________________________________________________________________________________________________ 246.4. Indoor temperature controls___________________________________________________________________________________________________ 256.5. Upgrade of Fan systems _____________________________________________________________________________________________________ 256.5.1. Introduction _______________________________________________________________________________________________________________ 256.5.2. Principles of Fan operation _________________________________________________________________________________________________ 256.5.3. Size adjustment ___________________________________________________________________________________________________________ 267. ENERGY CONSERVATION MEASURES IN INDUSTRIAL PROCESSES_____________________________________________ 267.1. Introduction ________________________________________________________________________________________________________________ 267.2. Important technologies_______________________________________________________________________________________________________ 267.3. Energy conservation measures ________________________________________________________________________________________________ 277.3.1. Process control and energy management technologies _________________________________________________________________________ 277.3.2. Process integration and intensification techniques ______________________________________________________________________________ 277.3.3. Refrigeration technologies __________________________________________________________________________________________________ 277.3.4. Heat pumps, heat transformers and organic Rankine cycle technologies __________________________________________________________ 287.3.5. High temperature combined heat and power technologies_______________________________________________________________________ 287.3.6. Combustion techniques and technologies _____________________________________________________________________________________ 287.3.7. Adjustable-speed drivers____________________________________________________________________________________________________ 297.4. Key technologies used in some energy intensive industries________________________________________________________________________ 297.4.1. Ceramics industry _________________________________________________________________________________________________________ 297.4.2. Cement industry __________________________________________________________________________________________________________ 297.4.3. Iron and steel industry______________________________________________________________________________________________________ 30APPENDIX: Combustion system efficiency methodology__________________________________________________________________ 31REFERENCES ______________________________________________________________________________________________________________ 32

1. GENERAL CONSIDERATIONS REGARDING AN ENERGY AUDIT
In new or retrofit energy conservation building design, innovationshould be encouraged. However, any innovation will fail no mat-ter how beneficial from the energy conservation point of view itis, if it cannot be easily integrated into conventional constructionpractices and conform to the established owner-user prefer-ences, financing methods, building codes and standards.Though the same procedures and information are used whetherdesigning for energy conservation or not, significantly greatercare and effort is necessary for energy-saving measures.
Special attention must be given to the following:• Overall values of the heat transfer coefficient U for walls,
floors, roofs and glass.• Maximum percent of fenestration (glass) area.• Building orientation in respect to fenestration exposure.• Hours of operation of each space and area on workdays,
weekends and holidays.• System efficiencies at full load and at partial loads.• Ability to control, reset, start/stop and reduce loads.• Heat recovery and heat storage.• Electrical motor efficiencies.
Whether it is a new or retrofit project, reduction in one or more ofthe following general categories is required to reduce the ener-gy consumed:• Hours of system operation.• Air-conditioning loads.• Lighting loads.• Off-peak loads.
Demand limiting and electric loads shifting to off-peak periodsgenerally do not reduce the total energy required for the facility.They do reduce peak electric load and therefore the utility or co-generation plant energy requirement. Of all the above energy-reduction items it is the hours of operation that will usually havethe most significant impact on energy conservation. In anotherway, the energy consumption of an inefficient mechanical,plumbing, electrical system that is turned off when not neededwill generally be less than that of the most efficient system thatis unnecessarily left on.
Of all energy conservation factors, the major one, which deter-mines the annual energy consumption of a facility, is the waythat the facility is used. This is more important than the type orcapacity of the refrigeration systems, chillers and processes andthe amount of glass or insulation or lighting. It is thereforeessential, if not mandatory, for the auditor to have a definitivework schedule for each activity to be performed in the facilitybefore energy conservation options can be considered.
This schedule is part of the project design program and shouldinclude the following items for each space and area:• A detailed description of the work being performed.• The type of energy producing/consuming equipment.• The number of working staff or personnel by shifts for week-
days, Saturdays, Sundays and holidays.• The percent of equipment operating in a given hour and the
average percent of full capacity for all the equipment by shiftsfor weekdays, weekends and holidays. If this information isnot available, then the percentage of each operating piece ofequipment maximum capacity for each hour of each shift forweekdays, weekends and holidays is required.
Finally, it has to be remembered that, the purpose of the typicalenergy audit is threefold:• to learn how much energy is being used annually and for what
purpose,• to identify areas of potential energy saving (cooling recla-
mation) and areas of energy waste, and• to obtain data required to prepare plans and specifications to
reduce, reclaim, or eliminate the waste identified in the audit.
It is a general practice to set priorities for the recommendations ofthe energy audit, starting with the most cost-effective options andprogressing down to the least cost-effective ones. Before propos-ing or making any modifications to a particular system, the systemengineer should carefully study all possible effects these modifi-cations will have on the total facility. For instance, a reduction inenergy usage for one or more subsystems may actually result inan increase in the total facility energy consumption.
2. BUILDING ENVELOPE ENERGYAUDIT
2.1. Introduction
Typically, architects design the envelope of a structure to re-spond to several considerations, including structural and aes-thetics. Before the oil crisis of 1973, the energy efficiency of theenvelope components was rarely considered as an importantfactor in the design of a building. Since then, several standardsand regulations have been developed to improve the energy ef-ficiency of various building envelope components. For energy re-trofit analysis, it is helpful to determine if the building was con-structed or modified to meet certain energy-efficiency standards.If it is the case, retrofitting of the building envelope may not becost-effective, especially for high-rise commercial buildings.
However, improvements to building envelope can be cost-effec-tive if the building was built without any concern for energy effi-ciency, such as the structures constructed with no insulationprovided in the walls or roofs. Moreover, the building enveloperetrofit must be performed after careful assessment of the build-ing thermal loads. For instance, in low-rise buildings (residentialand small commercial buildings or warehouses) the envelopetransmission losses and infiltration loads are dominant, while theinternal loads are typically low. In high-rise commercial, industri-al and institutional facilities, the internal heat gains due to equip-ment, lighting and people are typically dominant and the trans-mission loads affect only the perimeter spaces.
The accurate assessment of the energy savings incurred bybuilding envelope retrofits generally requires detailed hourly sim-ulation programs, since the heat transfer in buildings is complexand involves several mechanisms. In the following, only simpli-fied calculation methods are presented to estimate the energysavings for selected improvements of building envelope com-monly proposed to improve not only the energy efficiency of thebuilding but also the thermal comfort of its occupants and thestructural integrity of its shell.
2.2. Simplified calculation tools for building envelopeaudits
To determine the cost-effectiveness of any energy conservationmeasure for the building envelope, the energy use savings haveto be estimated. In this section, a general calculation procedure
ENERGY AUDIT GUIDE - PART B
4
based on the degree days method is provided with some rec-ommendations to determine the values of the parametersrequired to perform the energy use savings.
22..22..11.. DDeeggrreeee--ddaayyss mmeetthhoodd
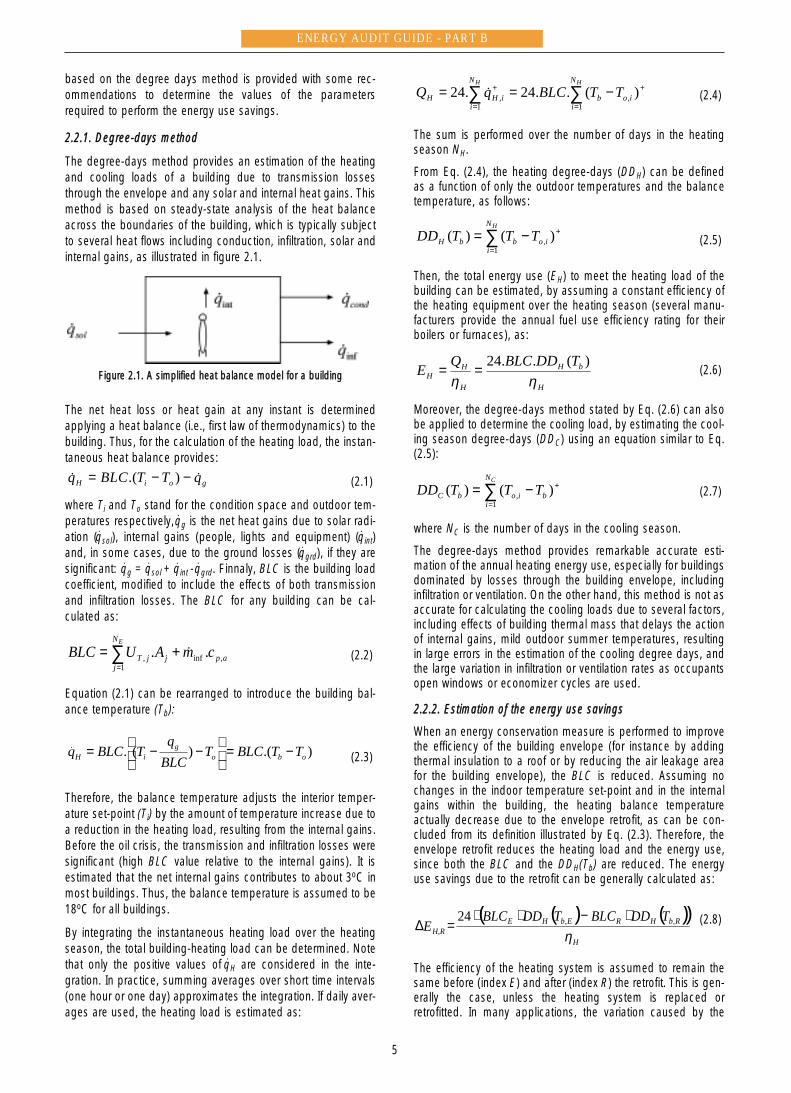
The degree-days method provides an estimation of the heatingand cooling loads of a building due to transmission lossesthrough the envelope and any solar and internal heat gains. Thismethod is based on steady-state analysis of the heat balanceacross the boundaries of the building, which is typically subjectto several heat flows including conduction, infiltration, solar andinternal gains, as illustrated in figure 2.1.
Figure 2.1. A simplified heat balance model for a building
The net heat loss or heat gain at any instant is determinedapplying a heat balance (i.e., first law of thermodynamics) to thebuilding. Thus, for the calculation of the heating load, the instan-taneous heat balance provides:
(2.1)
where Ti and To stand for the condition space and outdoor tem-peratures respectively,
•
qg is the net heat gains due to solar radi-ation (
•
qsol), internal gains (people, lights and equipment) (•
qint)and, in some cases, due to the ground losses (
•
qgrd), if they aresignificant:
•
qg = •
qsol + •
qint - •
qgrd. Finnaly, BLC is the building loadcoefficient, modified to include the effects of both transmissionand infiltration losses. The BLC for any building can be cal-culated as:
(2.2)
Equation (2.1) can be rearranged to introduce the building bal-ance temperature (Tb):
(2.3)
Therefore, the balance temperature adjusts the interior temper-ature set-point (Ti) by the amount of temperature increase due toa reduction in the heating load, resulting from the internal gains.Before the oil crisis, the transmission and infiltration losses weresignificant (high BLC value relative to the internal gains). It isestimated that the net internal gains contributes to about 3oC inmost buildings. Thus, the balance temperature is assumed to be18oC for all buildings.
By integrating the instantaneous heating load over the heatingseason, the total building-heating load can be determined. Notethat only the positive values of
•
qH are considered in the inte-gration. In practice, summing averages over short time intervals(one hour or one day) approximates the integration. If daily aver-ages are used, the heating load is estimated as:
(2.4)
The sum is performed over the number of days in the heatingseason NH.
From Eq. (2.4), the heating degree-days (DDH) can be definedas a function of only the outdoor temperatures and the balancetemperature, as follows:
(2.5)
Then, the total energy use (EH) to meet the heating load of thebuilding can be estimated, by assuming a constant efficiency ofthe heating equipment over the heating season (several manu-facturers provide the annual fuel use efficiency rating for theirboilers or furnaces), as:
(2.6)
Moreover, the degree-days method stated by Eq. (2.6) can alsobe applied to determine the cooling load, by estimating the cool-ing season degree-days (DDC) using an equation similar to Eq.(2.5):
(2.7)
where NC is the number of days in the cooling season.
The degree-days method provides remarkable accurate esti-mation of the annual heating energy use, especially for buildingsdominated by losses through the building envelope, includinginfiltration or ventilation. On the other hand, this method is not asaccurate for calculating the cooling loads due to several factors,including effects of building thermal mass that delays the actionof internal gains, mild outdoor summer temperatures, resultingin large errors in the estimation of the cooling degree days, andthe large variation in infiltration or ventilation rates as occupantsopen windows or economizer cycles are used.
22..22..22.. EEssttiimmaattiioonn ooff tthhee eenneerrggyy uussee ssaavviinnggss
When an energy conservation measure is performed to improvethe efficiency of the building envelope (for instance by addingthermal insulation to a roof or by reducing the air leakage areafor the building envelope), the BLC is reduced. Assuming nochanges in the indoor temperature set-point and in the internalgains within the building, the heating balance temperatureactually decrease due to the envelope retrofit, as can be con-cluded from its definition illustrated by Eq. (2.3). Therefore, theenvelope retrofit reduces the heating load and the energy use,since both the BLC and the DDH(Tb) are reduced. The energyuse savings due to the retrofit can be generally calculated as:
(2.8)
The efficiency of the heating system is assumed to remain thesame before (index E) and after (index R) the retrofit. This is gen-erally the case, unless the heating system is replaced orretrofitted. In many applications, the variation caused by the
( ) ( )( )H
RbHREbHE TDDBLCTDDBLCη
,,24 ⋅−⋅⋅=H,RE∆
+
=−= ∑ )()(
1, b
N
iiobC TTTDD
C
H
bH
H
HH
TDDBLCQEηη
)(..24==
+
=−= ∑ )()( ,
1io
N
ibbH TTTDD
H
+
==
+ −== ∑∑ )(..24.24 ,11
, io
N
ib
N
iiHH TTBLCqQ
HH
!
).()(. obog
iH TTBLCTBLCq
TBLCq −=
−−=
apj
N
jjT cmAUBLC
E
,inf1
, .. !+= ∑=
goiH qTTBLCq !! −−= ).(
ENERGY AUDIT GUIDE - PART B
5
•
retrofit of the balance temperature is quite small. Thus, thedegree-days (DDH) can be considered constant before and afterthe retrofit, so that the energy use savings can be estimatedmore easily using the following equation:
(2.9)
Note that when only one element of the building envelope isretrofitted (for instance the roof), the difference (BLCE-BLCR) isequivalent to the difference in the roof U·A values before andafter the retrofit (i.e., U·Aroof,E-U·Aroof,R). To use either Eq. (2.8) or(2.9), it is clear that the auditor needs to estimate the heatingdegree-days and the existing overall building load. Some rec-ommendations on how to calculate these two parameters aresummarized below.
22..22..33.. EEssttiimmaattiioonn ooff tthhee bbuuiillddiinngg BBLLCC
The BLC can he estimated using two approaches as brieflydescribed below. Depending on the data available, the auditorshould select the appropriate approach:1. Direct Calculation: The auditor should have all the data
(through the architectural drawings or from observation duringa site walk-through) needed to estimate the R- or U-values ofall the building envelope components and their relevant sur-face areas. References are available to provide the R-value ofvarious construction layers commonly used in buildings(ASHRAE 1997, CSTB Refs). In addition, the auditor shouldestimate the infiltration/ventilation rates either by rules ofthumb or by direct measurement. With all these, BLC can becalculated using Eq. (2.2).
2. Indirect Estimation: In this method, the auditor can rely on theutility energy use (monthly data are sufficient for this purpose)and its correlation with the outdoor temperature to provide anaccurate estimation of the BLC. This method is similar to thePRISM method (Fels 1986). It must be noted that the outdoortemperature should be averaged over the same periods thatthe utility data are available.
22..22..44.. EEssttiimmaattiioonn ooff tthhee DDeeggrreeee--ddaayyss
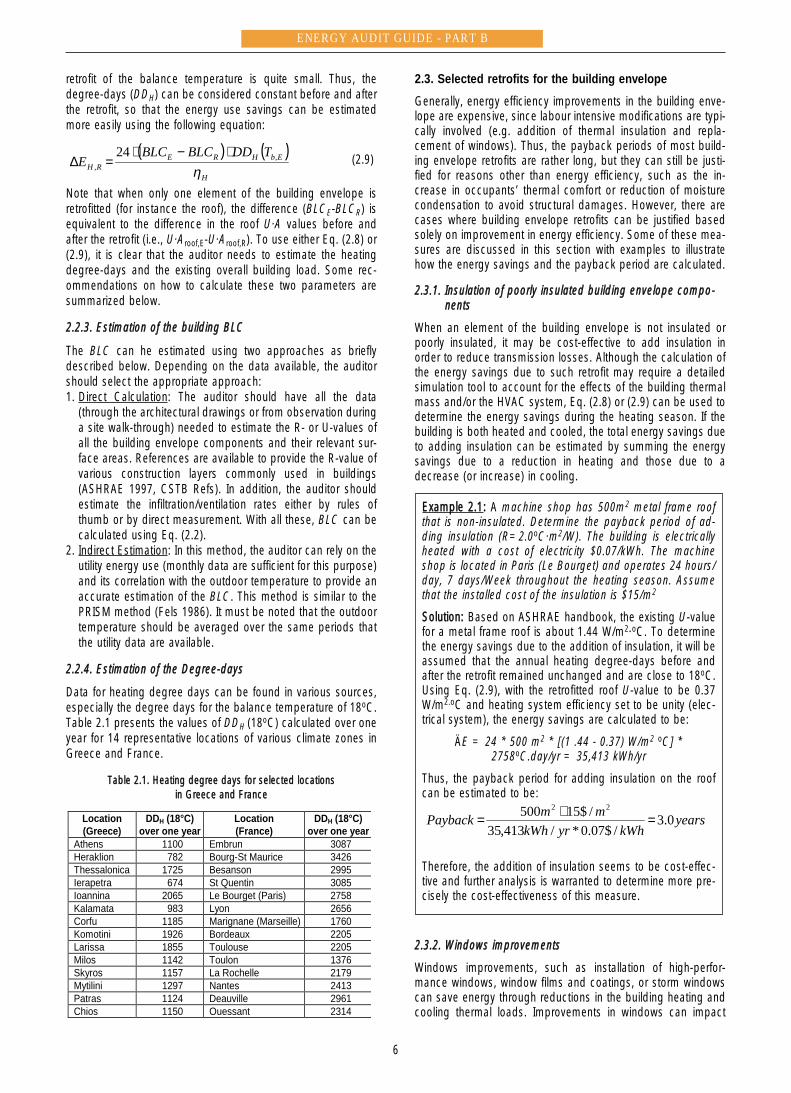
Data for heating degree days can be found in various sources,especially the degree days for the balance temperature of 18oC.Table 2.1 presents the values of DDH (18oC) calculated over oneyear for 14 representative locations of various climate zones inGreece and France.
Table 2.1. Heating degree days for selected locations in Greece and France
2.3. Selected retrofits for the building envelope
Generally, energy efficiency improvements in the building enve-lope are expensive, since labour intensive modifications are typi-cally involved (e.g. addition of thermal insulation and repla-cement of windows). Thus, the payback periods of most build-ing envelope retrofits are rather long, but they can still be justi-fied for reasons other than energy efficiency, such as the in-crease in occupants’ thermal comfort or reduction of moisturecondensation to avoid structural damages. However, there arecases where building envelope retrofits can be justified basedsolely on improvement in energy efficiency. Some of these mea-sures are discussed in this section with examples to illustratehow the energy savings and the payback period are calculated.
22..33..11.. IInnssuullaattiioonn ooff ppoooorrllyy iinnssuullaatteedd bbuuiillddiinngg eennvveellooppee ccoommppoo--nneennttss
When an element of the building envelope is not insulated orpoorly insulated, it may be cost-effective to add insulation inorder to reduce transmission losses. Although the calculation ofthe energy savings due to such retrofit may require a detailedsimulation tool to account for the effects of the building thermalmass and/or the HVAC system, Eq. (2.8) or (2.9) can be used todetermine the energy savings during the heating season. If thebuilding is both heated and cooled, the total energy savings dueto adding insulation can be estimated by summing the energysavings due to a reduction in heating and those due to adecrease (or increase) in cooling.
22..33..22.. WWiinnddoowwss iimmpprroovveemmeennttss
Windows improvements, such as installation of high-perfor-mance windows, window films and coatings, or storm windowscan save energy through reductions in the building heating andcooling thermal loads. Improvements in windows can impact
EExxaammppllee 22..11:: A machine shop has 500m2 metal frame roofthat is non-insulated. Determine the payback period of ad-ding insulation (R=2.0oC·m2/W). The building is electricallyheated with a cost of electricity $0.07/kWh. The machineshop is located in Paris (Le Bourget) and operates 24 hours/day, 7 days/Week throughout the heating season. Assumethat the installed cost of the insulation is $15/m2
SSoolluuttiioonn:: Based on ASHRAE handbook, the existing U-valuefor a metal frame roof is about 1.44 W/m2·oC. To determinethe energy savings due to the addition of insulation, it will beassumed that the annual heating degree-days before andafter the retrofit remained unchanged and are close to 18oC.Using Eq. (2.9), with the retrofitted roof U-value to be 0.37W/m2.oC and heating system efficiency set to be unity (elec-trical system), the energy savings are calculated to be:
ÄE = 24 * 500 m2 * [(1 .44 - 0.37) W/m2 oC] *2758oC.day/yr = 35,413 kWh/yr
Thus, the payback period for adding insulation on the roofcan be estimated to be:
Therefore, the addition of insulation seems to be cost-effec-tive and further analysis is warranted to determine more pre-cisely the cost-effectiveness of this measure.
Location(Greece)
DDH (18°C)over one year
Location(France)
DDH (18°C)over one year
Athens 1100 Embrun 3087Heraklion 782 Bourg-St Maurice 3426Thessalonica 1725 Besanson 2995Ierapetra 674 St Quentin 3085Ioannina 2065 Le Bourget (Paris) 2758Kalamata 983 Lyon 2656Corfu 1185 Marignane (Marseille) 1760Komotini 1926 Bordeaux 2205Larissa 1855 Toulouse 2205Milos 1142 Toulon 1376Skyros 1157 La Rochelle 2179Mytilini 1297 Nantes 2413Patras 1124 Deauville 2961Chios 1150 Ouessant 2314
( ) ( )H
EbHRERH
TDDBLCBLCE
η,
,
24 ⋅−⋅=∆
ENERGY AUDIT GUIDE - PART B
6
yearskWhyrkWh
mmPayback 0.3/$07.0*/413,35
/$15500 22
=∗=
both the thermal transmission and the solar heat gains. In addi-tion, energy-efficient windows create more comfortable environ-ments with evenly distributed temperatures and quality lighting.
Energy-efficiency improvements can be made to all the compo-nents of a window assembly including:• insulating the spacers between glass panes to reduce con-
duction heat transfer,• installing multiple coating or film layers to reduce heat transfer
by radiation,• inserting argon or krypton gas in the space between the panes
can decrease the convection heat transfer,• providing exterior shading devices can reduce the solar radi-
ation transmission to the occupied space.
To determine accurately the annual energy performance of win-dow retrofits, dynamic hourly modelling techniques are general-ly needed, since fenestration can impact the building thermalloads through several mechanisms. However, the simplified cal-culation method based on Eq. (2.8) to account for both heatingand cooling savings can be used to provide a preliminaryassessment of the cost-effectiveness of window retrofits.
22..33..33.. RReedduuccttiioonn ooff aaiirr--iinnffiillttrraattiioonn
In several low-rise facilities, the thermal loads due to air infil-tration can be significant. It is estimated that for well-insulatedresidential buildings, infiltration can contribute up to 40% to thetotal building-heating load. Tuluca et al. (1997) reported thatmeasurements in eight US office buildings found average airleakage rates of 0.1 to 0.5 air changes per hour (ACH). These airinfiltrations accounted for an estimated 10 to 25% of the peak-heating load. Two measurement techniques can be used toevaluate the existing amount of infiltrating air, namely the blowerand the tracer gas technique, as is described in Chapter 3.5.7 ofthe “Energy Auditing Guide - Part A”.
While several studies exist to evaluate the leakage distribution forresidential buildings, very little work is available for commercial orindustrial ones. However, some results indicate that the envelopeair tightness levels for commercial buildings are similar to those intypical houses. In particular, it was found that leaks in walls(frames of windows, electrical outlets, plumbing penetrations)constitute the major sources of air leakage to both residential andcommercial buildings. Other sources of air leakage identified forlarge buildings are through internal partitions (such as elevatorand service shafts) and exterior doors (especially for retail stores).
To improve the air tightness of the building envelope severalmethods and techniques are available including:i. Caulking: Several types of caulking (urethane, latex, polyvinyl,
etc.) can be applied to seal various leaks, such as thosearound the window and door frames, and any wall pene-trations, such as holes for water pipes.
ii. Weather Stripping: By applying foam rubber with adhesivebacking, windows and doors can be air sealed.
iii. Landscaping: This is a rather long term project and consistsof planting shrubs or trees around the building to reduce thewind effects and air infiltration.
iv. Air Retarders: They consist of one or more air-impermeablecomponents that can be applied around the building exteriorshell to form a continuous wrap around the building walls.There are several AR types such as liquid -applied bituminous,liquid-applied rubber, sheet bituminous and sheet plastic. TheAR membranes can be applied to impede the vapour move-ment through the building envelope and thus act as retarders.Unless they are part of an overall building envelope retrofit,these systems are typically expensive to install for existingbuildings.
To assess the energy savings due to a reduction in air infil-tration, Eq. (2.8) or (2.9) can be used. Whenever available, thedegree days IDDH(Tb) determined specifically to calculate infil-tration loads can be used, instead of the conventional temper-ature based degree days DDH(Tb). The infiltration heating de-gree-days for the balance temperature are defined as follows:
(2.10)
with calculated as:
(2.11)
ÄT is the indoor-outdoor temperature difference, vw is the periodaverage wind speed, while fs and fw are the stack and wind coef-ficients, respectively.
( ) 2/12...2 wwsrefvfTfPV
V +∆∆⋅= ρ!
!
refVV
!!
( ) ( )+
=•
•
−=∑ iob
N
iref
bH TTV
VTIDDH
,1
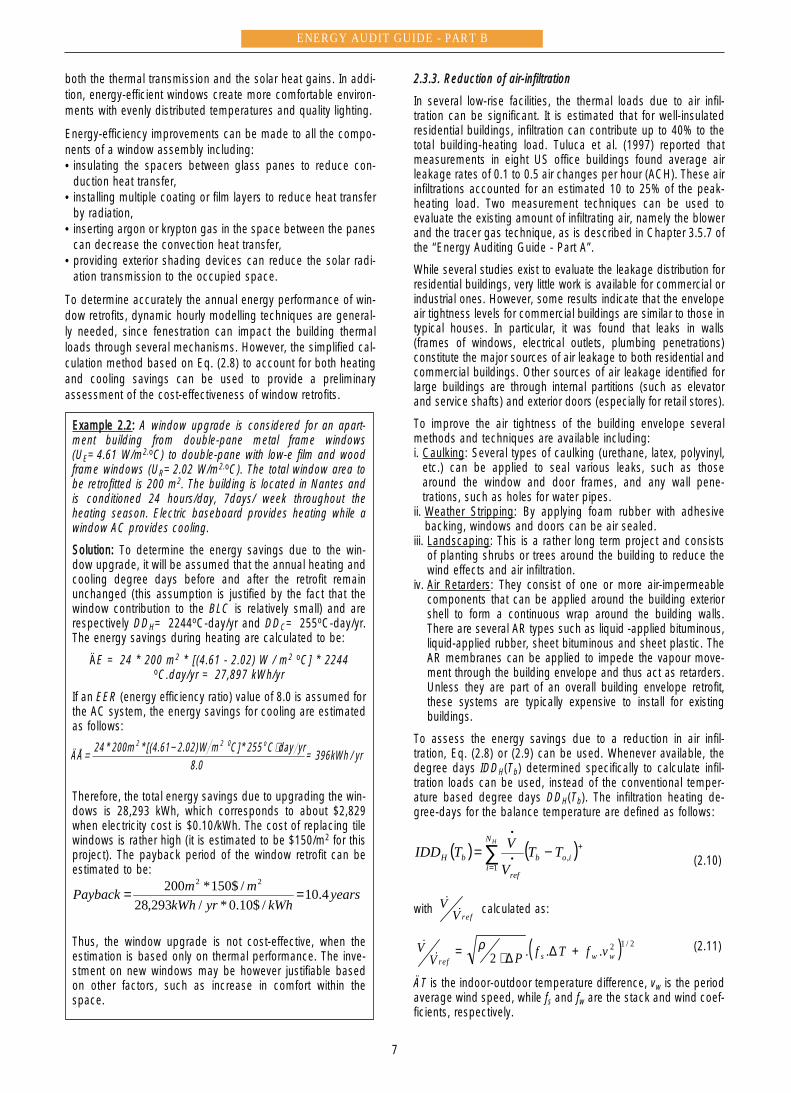
EExxaammppllee 22..22:: A window upgrade is considered for an apart-ment building from double-pane metal frame windows(UE=4.61 W/m2.oC) to double-pane with low-e film and woodframe windows (UR=2.02 W/m2.oC). The total window area tobe retrofitted is 200 m2. The building is located in Nantes andis conditioned 24 hours/day, 7days/ week throughout theheating season. Electric baseboard provides heating while awindow AC provides cooling.
SSoolluuttiioonn:: To determine the energy savings due to the win-dow upgrade, it will be assumed that the annual heating andcooling degree days before and after the retrofit remainunchanged (this assumption is justified by the fact that thewindow contribution to the BLC is relatively small) and arerespectively DDH= 2244oC-day/yr and DDC= 255oC-day/yr.The energy savings during heating are calculated to be:
ÄE = 24 * 200 m2 * [(4.61 - 2.02) W / m2 oC] * 2244oC.day/yr = 27,897 kWh/yr
If an EER (energy efficiency ratio) value of 8.0 is assumed forthe AC system, the energy savings for cooling are estimatedas follows:
Therefore, the total energy savings due to upgrading the win-dows is 28,293 kWh, which corresponds to about $2,829when electricity cost is $0.10/kWh. The cost of replacing tilewindows is rather high (it is estimated to be $150/m2 for thisproject). The payback period of the window retrofit can beestimated to be:
Thus, the window upgrade is not cost-effective, when theestimation is based only on thermal performance. The inve-stment on new windows may be however justifiable basedon other factors, such as increase in comfort within thespace.
ENERGY AUDIT GUIDE - PART B
7
yearskWhyrkWh
mmPayback 4.10/$10.0*/293,28
/$150*200 22
==
ÄÅ24 * 200m *[(4.61 2.02)W m C]* 255 C day yr
8.0= 396kWh / yr
2 2 0 o
= − ⋅
Moreover, •
Vref is the reference volume air rate through the build-ing at a pressure difference (between indoors and outdoors) of4 Pa. The radicand in Eq. (2.11) provides an estimate of theequivalent area of holes in the building envelope through whichair leaks can occur. However, the conventional degree-days(which basically ignore the effects of weather on the variation ofthe infiltration rate) provide generally good estimation of theenergy savings incurred from a reduction in air infiltration.
3. ENERGY RETROFIT OF ELECTRICSYSTEMS
3.1. Introduction
In most buildings and industrial facilities, electric systems con-sume a significant part of the total energy use. Motors, lightingand HVAC systems are the major equipment that consumeselectric energy. In commercial buildings, the electrical energyuse due to office equipment, such as computers and printers, isbecoming important in the last decade. Table 3.1 compares thepart of electricity consumption in three sectors (residential, com-mercial and industrial) for the US, France and Greece.
Table 3.1. Percentage share of electricity in the total energy use in three sectors for US1, France2 and Greece3
1. Office of Technology Assessment (1995).2. Electricité de France (1997).3. "Greece - National Energy Balance for 1998", Ministry of Development.
In the following sections, measures to reduce the electrical ener-gy use of various systems are presented and discussed.Moreover, where needed, a brief review of basic characteristics ofan electric system is provided to highlight the major issues that anauditor needs to consider when retrofitting an electric system.
3.2. Power factor improvement
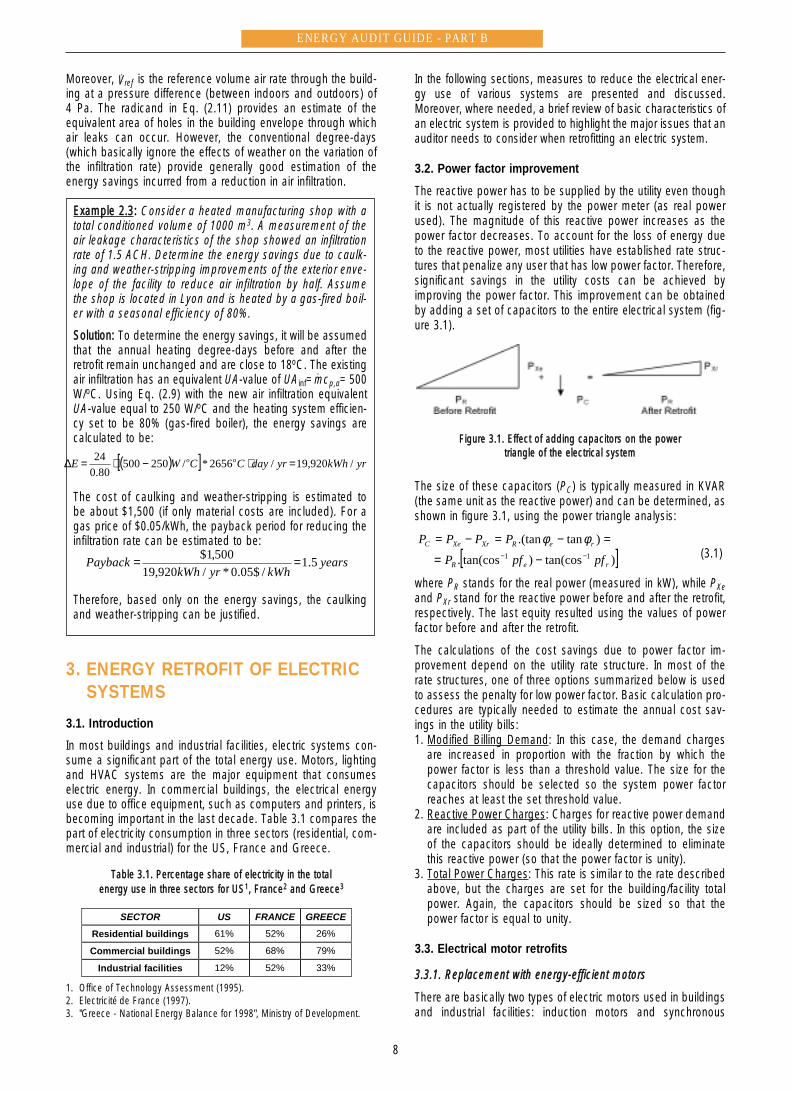
The reactive power has to be supplied by the utility even thoughit is not actually registered by the power meter (as real powerused). The magnitude of this reactive power increases as thepower factor decreases. To account for the loss of energy dueto the reactive power, most utilities have established rate struc-tures that penalize any user that has low power factor. Therefore,significant savings in the utility costs can be achieved byimproving the power factor. This improvement can be obtainedby adding a set of capacitors to the entire electrical system (fig-ure 3.1).
Figure 3.1. Effect of adding capacitors on the power triangle of the electrical system
The size of these capacitors (PC) is typically measured in KVAR(the same unit as the reactive power) and can be determined, asshown in figure 3.1, using the power triangle analysis:
(3.1)
where PR stands for the real power (measured in kW), while PXeand PXr stand for the reactive power before and after the retrofit,respectively. The last equity resulted using the values of powerfactor before and after the retrofit.
The calculations of the cost savings due to power factor im-provement depend on the utility rate structure. In most of therate structures, one of three options summarized below is usedto assess the penalty for low power factor. Basic calculation pro-cedures are typically needed to estimate the annual cost sav-ings in the utility bills:1. Modified Billing Demand: In this case, the demand charges
are increased in proportion with the fraction by which thepower factor is less than a threshold value. The size for thecapacitors should be selected so the system power factorreaches at least the set threshold value.
2. Reactive Power Charges: Charges for reactive power demandare included as part of the utility bills. In this option, the sizeof the capacitors should be ideally determined to eliminatethis reactive power (so that the power factor is unity).
3. Total Power Charges: This rate is similar to the rate describedabove, but the charges are set for the building/facility totalpower. Again, the capacitors should be sized so that thepower factor is equal to unity.
3.3. Electrical motor retrofits
33..33..11.. RReeppllaacceemmeenntt wwiitthh eenneerrggyy--eeffffiicciieenntt mmoottoorrss
There are basically two types of electric motors used in buildingsand industrial facilities: induction motors and synchronous
[ ])tan(cos)tan(cos.
)tan.(tan11
reR
reRXrXeC
pfpfPPPPP
−− −=
=−=−= φφ
SECTOR US FRANCE GREECE
Residential buildings 61% 52% 26%
Commercial buildings 52% 68% 79%
Industrial facilities 12% 52% 33%
EExxaammppllee 22..33:: Consider a heated manufacturing shop with atotal conditioned volume of 1000 m3. A measurement of theair leakage characteristics of the shop showed an infiltrationrate of 1.5 ACH. Determine the energy savings due to caulk-ing and weather-stripping improvements of the exterior enve-lope of the facility to reduce air infiltration by half. Assumethe shop is located in Lyon and is heated by a gas-fired boil-er with a seasonal efficiency of 80%.
SSoolluuttiioonn:: To determine the energy savings, it will be assumedthat the annual heating degree-days before and after theretrofit remain unchanged and are close to 18oC. The existingair infiltration has an equivalent UA-value of UAinf=
•
mcp,a=500W/oC. Using Eq. (2.9) with the new air infiltration equivalentUA-value equal to 250 W/oC and the heating system efficien-cy set to be 80% (gas-fired boiler), the energy savings arecalculated to be:
The cost of caulking and weather-stripping is estimated tobe about $1,500 (if only material costs are included). For agas price of $0.05/kWh, the payback period for reducing theinfiltration rate can be estimated to be:
Therefore, based only on the energy savings, the caulkingand weather-stripping can be justified.
ENERGY AUDIT GUIDE - PART B
8
yearskWhyrkWh
Payback 5.1/$05.0*/920,19
500,1$ ==
( )[ ] yrkWhyrdayCCWE oo /920,19/2656*/25050080.0
24 =⋅−⋅=∆
motors. Induction motors are the more common type, account-ing for 90% of the existing motor horsepower. Both types use amotionless stator and a spinning rotor to convert electrical ener-gy into mechanical power. One main difference between the twomotor types is how the rotor field is produced. In an inductionmotor, the rotating stator magnetic field induces a current, thusa magnetic field, in the rotor windings that are typically of thesquirrel-cage type.
Since its magnetic field is induced, the rotor cannot rotate as thestator field (if the rotor spins with the same speed as the statormagnetic field, no current can be induced in the rotor sinceeffectively the stator magnetic field remains unchanged relativeto the rotor). The difference between the rotor speed and thestator magnetic field rotation is called the slip factor. In asynchronous motor, the rotor field is produced by application ofdirect current through the rotor windings. Therefore, the rotorspins at the same speed as the rotating magnetic field of thestator and thus the rotor and the stator magnetic field aresynchronous in their speed.
Because of its construction characteristics, the induction motoris basically an inductive load and thus have a lagging power fac-tor, while the synchronous motor can be set so it has a leadingpower factor (i.e., acts like a capacitor). Therefore, it is importantto remember that a synchronous motor can be installed to bothprovide mechanical power and improve the power factor of a setof induction motors. This option may be more cost-effective thanjust adding a bank of capacitors.
One parameter is typically important to identify an electric motorduring full-load operation, the conversion efficiency of the motor(ç). This efficiency expresses the mechanical power as a fractionof the real electric power consumed by the motor: çÌ=ÑÌ/ÑR.Due to various losses (friction, core losses due to the alternatingof the magnetic field and resistive losses through the windings),the motor efficiency has typical values ranging from 75% to 95%,depending on the size of the motor. In the above definition, PMstands for the mechanical power output of the motor, expressedin kW or horsepower (HP), which is the most important factor inselecting a motor.
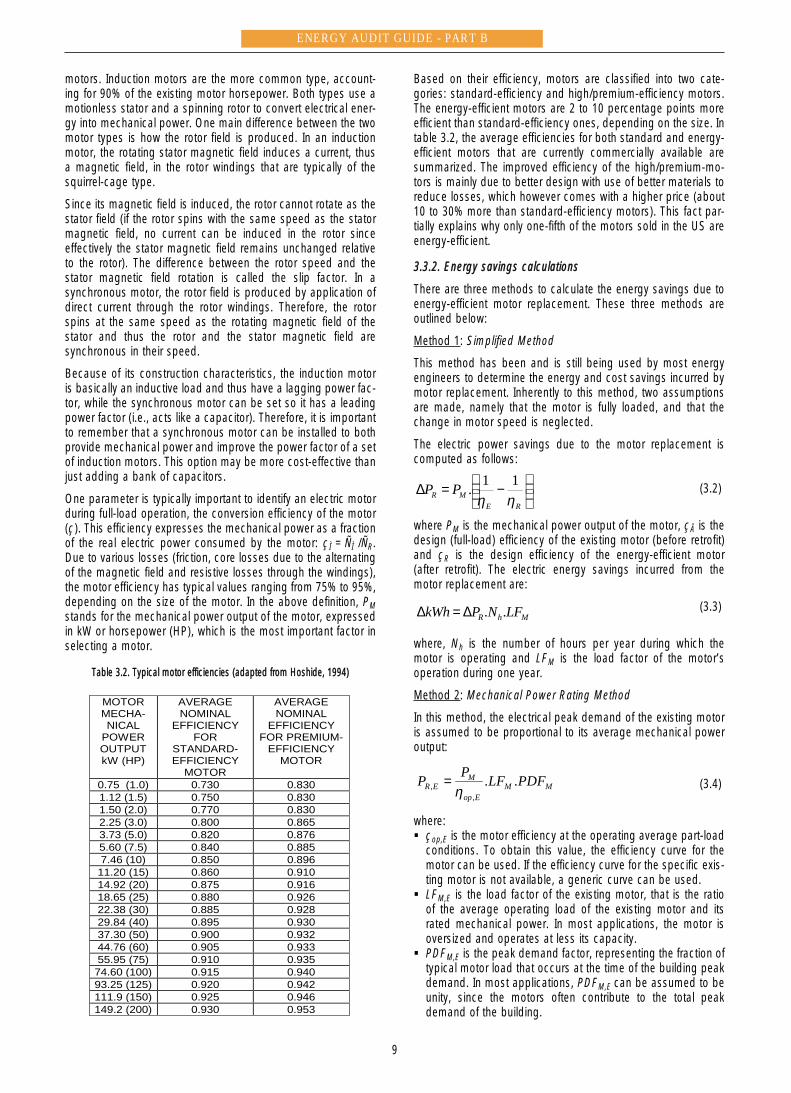
TTaabbllee 33..22.. TTyyppiiccaall mmoottoorr eeffffiicciieenncciieess ((aaddaapptteedd ffrroomm HHoosshhiiddee,, 11999944))
Based on their efficiency, motors are classified into two cate-gories: standard-efficiency and high/premium-efficiency motors.The energy-efficient motors are 2 to 10 percentage points moreefficient than standard-efficiency ones, depending on the size. Intable 3.2, the average efficiencies for both standard and energy-efficient motors that are currently commercially available aresummarized. The improved efficiency of the high/premium-mo-tors is mainly due to better design with use of better materials toreduce losses, which however comes with a higher price (about10 to 30% more than standard-efficiency motors). This fact par-tially explains why only one-fifth of the motors sold in the US areenergy-efficient.
33..33..22.. EEnneerrggyy ssaavviinnggss ccaallccuullaattiioonnss
There are three methods to calculate the energy savings due toenergy-efficient motor replacement. These three methods areoutlined below:
Method 1: Simplified Method
This method has been and is still being used by most energyengineers to determine the energy and cost savings incurred bymotor replacement. Inherently to this method, two assumptionsare made, namely that the motor is fully loaded, and that thechange in motor speed is neglected.
The electric power savings due to the motor replacement iscomputed as follows:
(3.2)
where PM is the mechanical power output of the motor, çÅ is thedesign (full-load) efficiency of the existing motor (before retrofit)and çR is the design efficiency of the energy-efficient motor(after retrofit). The electric energy savings incurred from themotor replacement are:
(3.3)
where, Nh is the number of hours per year during which themotor is operating and LFM is the load factor of the motor’soperation during one year.
Method 2: Mechanical Power Rating Method
In this method, the electrical peak demand of the existing motoris assumed to be proportional to its average mechanical poweroutput:
(3.4)
where:! çop,E is the motor efficiency at the operating average part-load
conditions. To obtain this value, the efficiency curve for themotor can be used. If the efficiency curve for the specific exis-ting motor is not available, a generic curve can be used.
! LFM,E is the load factor of the existing motor, that is the ratioof the average operating load of the existing motor and itsrated mechanical power. In most applications, the motor isoversized and operates at less its capacity.
! PDFM,E is the peak demand factor, representing the fraction oftypical motor load that occurs at the time of the building peakdemand. In most applications, PDFM,E can be assumed to beunity, since the motors often contribute to the total peakdemand of the building.
MMEop
MER PDFLFPP ..
,, η
=
MhR LFNPkWh ..∆=∆
−=∆
REMR PP
ηη11.
MOTORMECHA-NICAL
POWEROUTPUTkW (HP)
AVERAGENOMINAL
EFFICIENCYFOR
STANDARD-EFFICIENCY
MOTOR
AVERAGENOMINAL
EFFICIENCYFOR PREMIUM-
EFFICIENCYMOTOR
0.75 (1.0) 0.730 0.8301.12 (1.5) 0.750 0.8301.50 (2.0) 0.770 0.8302.25 (3.0) 0.800 0.8653.73 (5.0) 0.820 0.8765.60 (7.5) 0.840 0.8857.46 (10) 0.850 0.89611.20 (15) 0.860 0.91014.92 (20) 0.875 0.91618.65 (25) 0.880 0.92622.38 (30) 0.885 0.92829.84 (40) 0.895 0.93037.30 (50) 0.900 0.93244.76 (60) 0.905 0.93355.95 (75) 0.910 0.93574.60 (100) 0.915 0.94093.25 (125) 0.920 0.942111.9 (150) 0.925 0.946149.2 (200) 0.930 0.953
ENERGY AUDIT GUIDE - PART B
9
Since the mechanical load does not change after installing anenergy-efficient motor, it is possible to consider a smaller motorwith a capacity PM,R if the existing motor is oversized with arating of PM,E. In this case, the smaller energy-efficient motor canoperate at a higher load factor than the existing motor. The newload factor of the energy-efficient motor can be calculated as fol-lows:
(3.5)
The energy-efficient motors often operate at higher speeds thanthe standard motors they replace, since they have lower internallosses. This higher speed actually has a negative impact, sinceit reduces the effective efficiency of the energy-efficient motor bya factor called the slip penalty. If ùÌ,Å and ùM,R are the rotationspeeds of the existing motor and of the energy-efficient one, theslip penalty factor is defined as:
(3.6)
Using a similar to Eq. (3.4) relation, the peak electrical demandfor the retrofitted motor (e.g. energy-efficient motor) can bedetermined:
(3.7)
The electrical power savings due to the motor replacement cannow be estimated as:
(3.8)
The electric energy savings can be calculated again using Eq.(3.3).
Method 3: Field Measurement Method
In this method, the motor electrical power demand is measureddirectly on-site. Typically, current (IM), voltage (VM), power factor(pfM) readings are recorded for the motor to be retrofitted. Forthree-phase motors (common in industrial facilities and in mostHVAC systems for commercial buildings), the electrical powerused by the existing motor can be either directly measured orcalculated from current, voltage and power factor readings asfollows:
(3.9)
The load factor of the existing motor can be estimated by theratio of the measured current over the nameplate full-load cur-rent (IFL), as:
(3.10)
Eq. (3.10) was proved to be much more accurate for the estimationof the motor load ratio than an approach based on the ratio of themotor speeds (i.e. measured speed over nominally rated speed). Itshould be noted that, Eq. (3.10) is recommended for load ratiosthat are above 50%, since for these load ratios a typical motordraws electrical current that is proportional to the imposed load.The methodology for the calculation of the electrical power andenergy savings is the same as described for the Mechanical PowerRating Method using Eq. (3.5) through Eq. (3.8).
3.4. Energy-efficient lighting
33..44..11.. IInnttrroodduuccttiioonn
Lighting accounts for a significant portion of the energy use incommercial buildings. In office buildings, for instance, 30% to50% of the electricity consumption is used to provide lighting. Inaddition, heat generated by lighting contributes to the thermalload to be removed by the cooling equipment. Energy retrofits oflighting equipment are typically very cost-effective, with paybackperiods of less than 2 years in most applications.
To better understand the retrofit measures that need to be con-sidered in order to improve the energy-efficiency of lightingsystems, a simple estimation of the total electrical energy usedue to lighting can be provided by Eq. (3.11):
(3.11)
where NLum,j is the number of lighting luminaries of type j in thebuilding to be retrofitted (a luminary consists of the complete setof ballast, electric wiring, housing and lamps), WRLum,j is thewattage rating for each luminaries of type j (the energy use dueto both the lamps and ballast should be accounted for in thisrating), Nh,j is the number of hours per year when the luminariesof type j are operating.
There are three options to reduce the energy use due to lighting,including:a) Reduction of the wattage rating for the luminaries including
both the lighting sources (lamps) and the power transformingdevices (ballasts), therefore decreasing the term WRLum,j inEq. (3.11). In the last decade, technological advances suchas compact fluorescent lamps and electronic ballasts haveincreased the energy efficiency of lighting systems.
b) Reduction of the lighting systems time of use through lightingcontrols, therefore decreasing the term Nh,j in Eq. (3.11).Automatic controls have been developed to decrease the useof a lighting system, so illumination is provided only duringtimes when it is needed. Energy-efficient lighting controlsinclude the occupancy sensing systems and light dimmingcontrols through the use of day lighting.
c) Reduction of the number of luminaries, therefore decreasingthe term NLum,j in Eq. (3.11). This goal can be achieved only incases where de-lamping is possible due to over-illumination.
Herein, only measures related to the general actions describedin items (a) and (b) are discussed. To estimate the energy sav-ings due to any retrofit measure for the lighting system, Eq.(3.11) can be used. The energy use due to lighting has to becalculated before and after the retrofit and the difference bet-ween the two estimated energy uses represents the energy sav-ings. In the following, examples of lighting retrofit are presented,together with calculations of the resulting energy savings.
33..44..22.. EEnneerrggyy--eeffffiicciieenntt lliigghhttiinngg ssyysstteemmss
Improvements in the energy-efficiency of lighting systems haveprovided several opportunities to reduce electrical energy use inbuildings. In this section, the potential of high efficiency fluores-cent lamps, compact fluorescent lamps, compact halogenlamps and electronic ballasts is discussed. First a brief descrip-tion is provided for the factors that an auditor should considerfor achieving and maintaining an acceptable quality and level ofcomfort for the lighting system. Secondly, the design and oper-ation concepts are summarized for each available lighting tech-nology. Then, the energy savings that can be expected from
jhjLumjLum
J
jLit NWRNkWh ,,,
1
..∑=
=
FL
MEM I
ILF =,
MMMER pfIVP ...3, =
RRERR PPP ,, −=∆
PRMRMRop
RMRR SLIPPDFLF
PP ... ,,
,
,, η
=
3
,
,
=
EM
RMPSLIP
ωω
EM
RMER P
PLFLF
,
,.=
ENERGY AUDIT GUIDE - PART B
10
ENERGY AUDIT GUIDE - PART B
retrofitting existing lighting systems using any of the new tech-nologies are estimated and discussed.
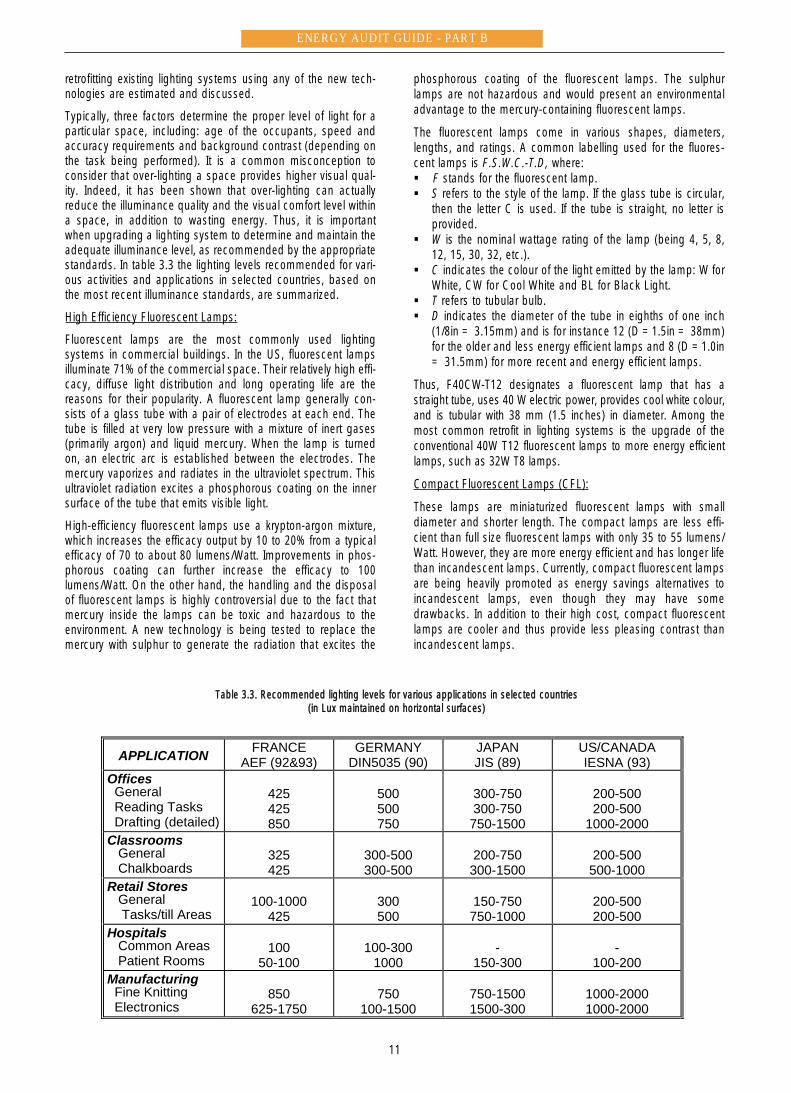
Typically, three factors determine the proper level of light for aparticular space, including: age of the occupants, speed andaccuracy requirements and background contrast (depending onthe task being performed). It is a common misconception toconsider that over-lighting a space provides higher visual qual-ity. Indeed, it has been shown that over-lighting can actuallyreduce the illuminance quality and the visual comfort level withina space, in addition to wasting energy. Thus, it is importantwhen upgrading a lighting system to determine and maintain theadequate illuminance level, as recommended by the appropriatestandards. In table 3.3 the lighting levels recommended for vari-ous activities and applications in selected countries, based onthe most recent illuminance standards, are summarized.
High Efficiency Fluorescent Lamps:
Fluorescent lamps are the most commonly used lightingsystems in commercial buildings. In the US, fluorescent lampsilluminate 71% of the commercial space. Their relatively high effi-cacy, diffuse light distribution and long operating life are thereasons for their popularity. A fluorescent lamp generally con-sists of a glass tube with a pair of electrodes at each end. Thetube is filled at very low pressure with a mixture of inert gases(primarily argon) and liquid mercury. When the lamp is turnedon, an electric arc is established between the electrodes. Themercury vaporizes and radiates in the ultraviolet spectrum. Thisultraviolet radiation excites a phosphorous coating on the innersurface of the tube that emits visible light.
High-efficiency fluorescent lamps use a krypton-argon mixture,which increases the efficacy output by 10 to 20% from a typicalefficacy of 70 to about 80 lumens/Watt. Improvements in phos-phorous coating can further increase the efficacy to 100lumens/Watt. On the other hand, the handling and the disposalof fluorescent lamps is highly controversial due to the fact thatmercury inside the lamps can be toxic and hazardous to theenvironment. A new technology is being tested to replace themercury with sulphur to generate the radiation that excites the
phosphorous coating of the fluorescent lamps. The sulphurlamps are not hazardous and would present an environmentaladvantage to the mercury-containing fluorescent lamps.
The fluorescent lamps come in various shapes, diameters,lengths, and ratings. A common labelling used for the fluores-cent lamps is F.S.W.C.-T.D, where:! F stands for the fluorescent lamp.!" S refers to the style of the lamp. If the glass tube is circular,
then the letter C is used. If the tube is straight, no letter isprovided.
!"W is the nominal wattage rating of the lamp (being 4, 5, 8,12, 15, 30, 32, etc.).
!"C indicates the colour of the light emitted by the lamp: W forWhite, CW for Cool White and BL for Black Light.
!" T refers to tubular bulb.!"D indicates the diameter of the tube in eighths of one inch
(1/8in = 3.15mm) and is for instance 12 (D =1.5in = 38mm)for the older and less energy efficient lamps and 8 (D =1.0in= 31.5mm) for more recent and energy efficient lamps.
Thus, F40CW-T12 designates a fluorescent lamp that has astraight tube, uses 40 W electric power, provides cool white colour,and is tubular with 38 mm (1.5 inches) in diameter. Among themost common retrofit in lighting systems is the upgrade of theconventional 40W T12 fluorescent lamps to more energy efficientlamps, such as 32W T8 lamps.
Compact Fluorescent Lamps (CFL):
These lamps are miniaturized fluorescent lamps with smalldiameter and shorter length. The compact lamps are less effi-cient than full size fluorescent lamps with only 35 to 55 lumens/Watt. However, they are more energy efficient and has longer lifethan incandescent lamps. Currently, compact fluorescent lampsare being heavily promoted as energy savings alternatives toincandescent lamps, even though they may have somedrawbacks. In addition to their high cost, compact fluorescentlamps are cooler and thus provide less pleasing contrast thanincandescent lamps.
APPLICATION FRANCEAEF (92&93)
GERMANYDIN5035 (90)
JAPANJIS (89)
US/CANADAIESNA (93)
Offices General Reading Tasks Drafting (detailed)
425425850
500500750
300-750300-750750-1500
200-500200-500
1000-2000Classrooms General Chalkboards
325425
300-500300-500
200-750300-1500
200-500500-1000
Retail Stores General Tasks/till Areas
100-1000425
300500
150-750750-1000
200-500200-500
Hospitals Common Areas Patient Rooms
10050-100
100-3001000
-150-300
-100-200
Manufacturing Fine Knitting Electronics
850625-1750
750100-1500
750-15001500-300
1000-20001000-2000
Table 3.3. Recommended lighting levels for various applications in selected countries (in Lux maintained on horizontal surfaces)
11
Compact Halogen Lamps:
The compact halogen lamps are adapted for use as directreplacements for standard incandescent lamps. They are moreenergy-efficient, produce whiter light and last longer than incan-descent lamps. Indeed, incandescent lamps convert typicallyonly 15% of their electrical energy input into visible light, since75% is emitted as infrared radiation and the filament uses 10%as it burns off. In halogen lamps, the filament is encased insidea quartz tube that is contained in a glass bulb. A selective coat-ing on the exterior surface of the quartz tube allows visible radi-ation to pass through but reflects the infrared radiation back tothe filament. This recycled infrared radiation permits the filamentto maintain its operating temperatures with 30% less electricalpower input. The halogen lamps can be dimmed and present nopower quality or compatibility concerns, as can be the case forthe compact fluorescent lamps.
Electronic Ballasts:
Ballasts are integral parts to fluorescent luminaries, since theyprovide the voltage level required to start the electric arc andregulate the intensity of the arc. Before the development of elec-tronic ballasts in early 1980’s, only magnetic or “core and coil”ones were used to operate fluorescent lamps. While the fre-quency of the electrical current is kept at 50 Hz (or 60 Hz in US)by the magnetic ballasts, electronic ballasts use solid-state tech-nology to produce high-frequency (20 - 60 MHz) current, whichincreases the energy-efficiency of the fluorescent luminariessince the light is cycling more quickly and appear brighter. Whenused with high-efficiency lamps (i.e., T8), electronic ballasts canachieve 95 lumens/Watt, as opposed to 70 lumens/ Watt forconventional magnetic ballasts. It should be mentioned, howev-er, that efficient magnetic ballasts could achieve similarlumen/Watt ratios as electronic ballasts.
Other advantages that electronic ballasts have relative to theirmagnetic counterparts include:! Higher power factor. The power factor of electronic ballasts is
typically in the 0.9 to 0.98 range. Meanwhile, the convention-al magnetic ballasts have low power factor (less than 0.80)unless a capacitor is added, as discussed in section 3.2.
! Less flicker problems. Since the magnetic ballasts operate at50 Hz current, they cycle the electric arc about 120 times persecond. As a result, flicker may be perceptible, especially ifthe lamp is old during normal operation or when the lamp isdimmed to less than 50% capacity. However, electronic bal-lasts cycle the electric arc several thousands of times persecond and flicker problems are avoided, even when thelamps are dimmed to as low as 5% of capacity.
! Less noise problems. The magnetic ballasts use electric coilsand generate audible hum, which can increase with age.Such noise is eliminated by the solid-state components ofthe electronic ballasts.
33..44..33.. LLiigghhttiinngg ccoonnttrroollss
As illustrated by Eq. (3.11), energy savings can be achieved by notoperating at full capacity the lighting system in cases when illumi-nation becomes unnecessary. The control of the lighting systemoperation can be achieved by several means, including manualon/off and dimming switches, occupancy sensing systems, andautomatic dimming systems using day-lighting controls.
While manual switching and/or dimming can achieve energy sav-ings, the results are typically unpredictable since they depend onthe occupant behaviour. Scheduled lighting controls provide a
more efficient approach to energy savings, but can also beaffected by the frequent adjustments from occupants. Only auto-matic light switching and dimming systems can respond in real-time to changes in occupancy and climatic changes. Some ofthe automatic controls available for lighting systems are brieflydiscussed below.
Occupancy Sensors:
Occupancy sensors save energy by automatically turning off thelights in spaces that are not occupied. Generally, occupancysensors are suitable for most lighting control applications andshould be considered for lighting retrofits. It is important to prop-erly specify and install the occupancy sensors to provide reliablelighting during periods of occupancy. Indeed, most failed occu-pancy sensor installations result from inadequate product selec-tion and improper placement. In particular, the auditor shouldselect the proper motion sensing technology used in occupancysensors.
Two types of motion sensing technologies are currently availablein the market:i. Infrared sensors, which register the infrared radiation emitted
by various surfaces in the space including the human body.When the controller connected to the infrared sensors receivesa sustained change in the thermal signature of the environ-ment (as is the case when an occupant moves), it turns thelights on. The lights are kept on until the recorded changes intemperature are not significant. The infrared sensors operateadequately only if they are in direct line-of-sight with the occu-pants and must be used in smaller enclosed spaces with reg-ular shapes and without partitions.
ii. Ultrasound sensors operate on a sonar principle, like the sub-marines and airport radars, emitting a high frequency sound(25-40 kHz) that is beyond the hearing range of humans. Thissound is reflected by the surfaces in a space (including fur-niture and occupants) and is sensed by a receiver. When peo-ple move inside the space, the pattern of sound wavechanges. The lights remain on until no movement is detectedfor a preset period of time (e.g., 5 min.). Unlike infrared radi-ation, obstacles do not easily block sound waves. However,these sensors may not operate properly in large spaces thattend to produce weak echoes.
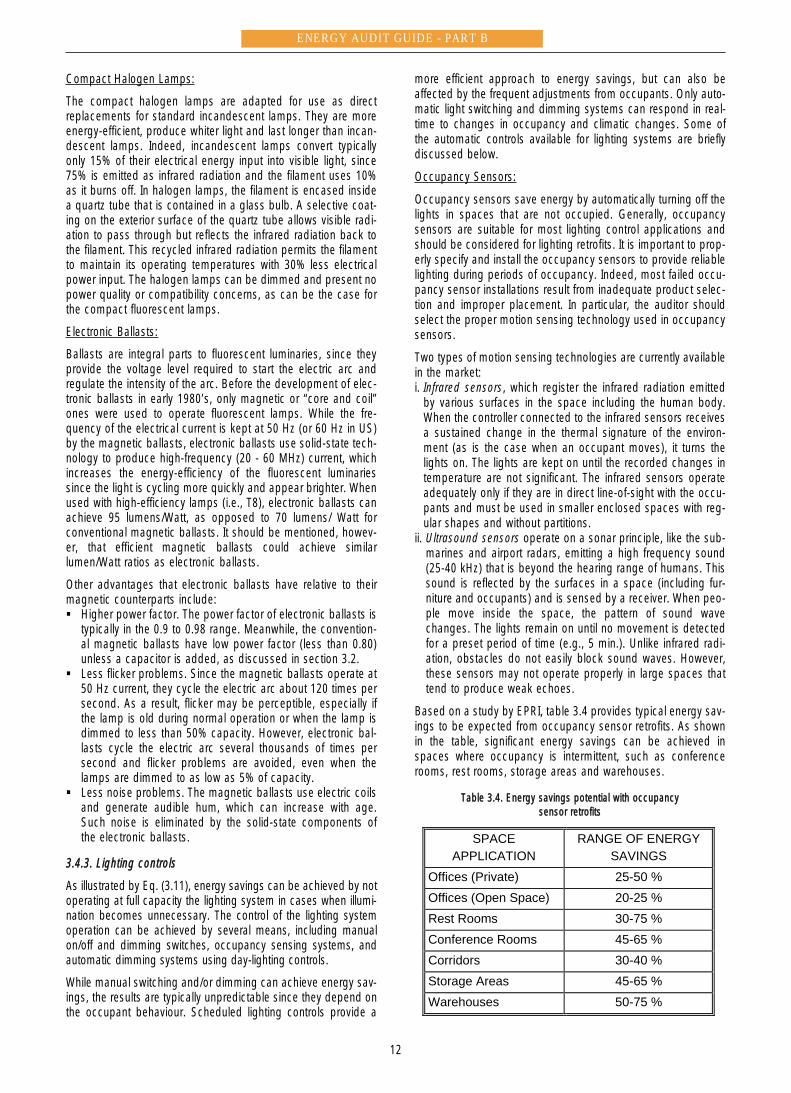
Based on a study by EPRI, table 3.4 provides typical energy sav-ings to be expected from occupancy sensor retrofits. As shownin the table, significant energy savings can be achieved inspaces where occupancy is intermittent, such as conferencerooms, rest rooms, storage areas and warehouses.
Table 3.4. Energy savings potential with occupancy sensor retrofits
SPACEAPPLICATION
RANGE OF ENERGYSAVINGS
Offices (Private) 25-50 %Offices (Open Space) 20-25 %Rest Rooms 30-75 %Conference Rooms 45-65 %Corridors 30-40 %Storage Areas 45-65 %Warehouses 50-75 %
ENERGY AUDIT GUIDE - PART B
12
ENERGY AUDIT GUIDE - PART B
Light Dimming Systems:
Dimming controls allow the variation of the intensity of lightingsystem output based on natural light level, manual adjustmentsand occupancy. Smooth and uninterrupted decrease in the lightoutput is defined as a continuous dimming, as opposed tostepped dimming in which the lamp output is decreased instages by preset amounts. The auditor, using relevant computersoftware to accurately estimate the energy savings from dim-ming systems that use natural light controls, can predict the per-centage of time when natural light is sufficient to meet all light-ing needs.
3.5. Power quality
33..55..11.. IInnttrroodduuccttiioonn
Under ideal conditions, the electrical current and voltage vary asa sine function of time. However, problems in the utility gener-ation/distribution system, such as voltage drops, spikes or tran-sients, can cause fluctuations in electricity that can reduce thelife of electrical equipment, including motors and lighting sy-stems. Moreover, latterly an increasing number of electrical de-vices operating on the system can cause distortion of the cur-rent and/or voltage sine waveform leading to poor power quality,which can waste energy and harm both electrical distributionand devices operating on the systems. Therefore, it is importantthe energy auditor to be aware of these problems and takesteps in improving the power quality of the electrical systems.
33..55..22.. TToottaall hhaarrmmoonniicc ddiissttoorrttiioonn
The power quality can be defined as the extend to which an elec-trical system distorts the voltage or current sine waveform, whichis the ideal power quality for an electrical system, often referred
to as the fundamental harmonic. When the power is distorteddue, for instance, to electronic ballasts (which change the fre-quency of the electricity supplied to the lighting systems), sever-al harmonics need to be used in addition to the fundamental har-monic to represent the voltage or current time-variation.
Highly distorted waveforms contain numerous harmonics. Whilethe even harmonics (second, fourth, etc.) tend to cancel eachother effects, the odd harmonics (third, fifth, etc.) have theirpeaks coincide and significantly increase the distortion effects.To quantify the level of distortion for voltage and current a di-mensionless number, referred to as the total harmonic distortion(THD), is determined through a Fourier series analysis of thevoltage and current waveforms and is respectively defined as:
(3.12)
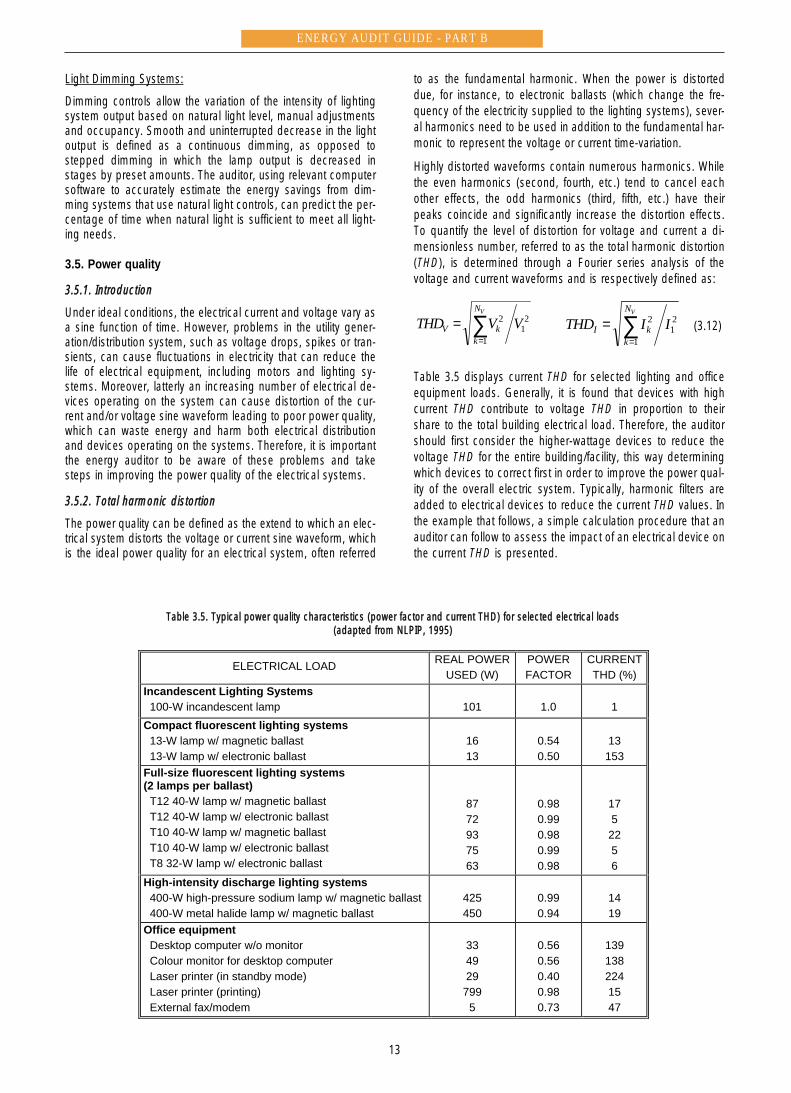
Table 3.5 displays current THD for selected lighting and officeequipment loads. Generally, it is found that devices with highcurrent THD contribute to voltage THD in proportion to theirshare to the total building electrical load. Therefore, the auditorshould first consider the higher-wattage devices to reduce thevoltage THD for the entire building/facility, this way determiningwhich devices to correct first in order to improve the power qual-ity of the overall electric system. Typically, harmonic filters areadded to electrical devices to reduce the current THD values. Inthe example that follows, a simple calculation procedure that anauditor can follow to assess the impact of an electrical device onthe current THD is presented.
21
1
2 IITHDVN
kkI ∑
=
=21
1
2 VVTHDVN
kkV ∑
=
=
ELECTRICAL LOAD REAL POWERUSED (W)
POWERFACTOR
CURRENTTHD (%)
Incandescent Lighting Systems 100-W incandescent lamp 101 1.0 1Compact fluorescent lighting systems 13-W lamp w/ magnetic ballast 13-W lamp w/ electronic ballast
1613
0.540.50
13153
Full-size fluorescent lighting systems(2 lamps per ballast) T12 40-W lamp w/ magnetic ballast T12 40-W lamp w/ electronic ballast T10 40-W lamp w/ magnetic ballast T10 40-W lamp w/ electronic ballast T8 32-W lamp w/ electronic ballast
8772937563
0.980.990.980.990.98
1752256
High-intensity discharge lighting systems 400-W high-pressure sodium lamp w/ magnetic ballast 400-W metal halide lamp w/ magnetic ballast
425450
0.990.94
1419
Office equipment Desktop computer w/o monitor Colour monitor for desktop computer Laser printer (in standby mode) Laser printer (printing) External fax/modem
334929
7995
0.560.560.400.980.73
1391382241547
Table 3.5. Typical power quality characteristics (power factor and current THD) for selected electrical loads(adapted from NLPIP, 1995)
13
IEEE (1992) recommends a maximum allowable voltage THD of5% at the building service entrance (where the utility distributionsystem is connected to the building electrical system).Verderber et al. (1993) showed that the voltage THD reaches the5% limit when about 50% of the building electrical load has acurrent THD of 55% or when 25% of the building electrical loadhas a current THD of 115%.
When the electrical device has a power factor of unity (pf=1),there is little or no current THD, since the device has only aresistive load and effectively converts input current and voltageinto useful electric power. Thus, the power factor and the currentTHD are interrelated and both define the characteristics of thepower quality. As indicated in table 3.5, the lighting systems withelectronic ballast have typically high power factor and low cur-rent THD. This good power quality is achieved using capacitorsto reduce the phase lag between the current and voltage (toimprove the power factor) and filters to reduce harmonics (toincrease the current THD value).
The problems that have been reported due to poor power qual-ity include:i. Overload of neutral conductors in three-phase with four wi-
res. In a system with no THD, the neutral wire carries no cur-rent if the system is well balanced. However, when the cur-rent THD becomes significant, the currents due to the oddharmonics do not cancel each other and rather add up onthe neutral wire that can overheat and cause a fire hazard.
ii. Reduction in the life of transformers and capacitors. Thiseffect is mostly caused by distortion in the voltage.
iii. Interference with communication systems. Electrical devicesthat operate with high frequencies, such as electronic bal-lasts (operating at frequencies ranging from 20 to 40 kHz),can interfere and disturb the operation of communicationsystems, such radios, phones and energy managementsystems (EMS).
3.6. Selected examples for electric measures to saveenergy use
33..66..11.. PPoowweerr ffaaccttoorr ccoorrrreeccttiioonn -- CCaallccuullaattiioonn ooff tthhee ccaappaacciittoorr ssiizzee
Background: To reduce the penalty of low power factor imposedby the utility, a set of capacitors can be installed in parallel to theelectrical system. The benefits of increasing the power factorcan only be determined for each specific case since the cal-culation of the cost savings depends closely on the utility rate. Inthis calculation sheet, only the size in kVAR of the capacitors isdetermined so that the power factor can be increased from theexisting value to the minimum required by the utility in order toincurs no penalty. With this size, the cost of the capacitors andthus the cost-effectiveness of improving the power factor can becalculated.
Required Data:! pfe: existing power factor (this information can be directly
measured or taken from the utility bills),! pfr: power factor to be achieved after the retrofit (this value is
defined by the utility rate structure),! PR: real power used by the electrical system at peak condi-
tions (this information is provided by the utility bills).
Calculation Procedure: The size of one capacitor or a bank ofcapacitors in kVAR is determined as: PC=PR·[tan(cos-1pfe)-tan(cos-1pfr)]
33..66..22.. IInnssttaallll HHiigghh EEffffiiccaaccyy LLaammppss -- CCaallccuullaattiioonn ooff eenneerrggyy ssaavviinnggss
Background: The high efficacy tubes introduced herein repre-sent the next generation of high efficiency fluorescent lamps andare currently available in the market. These lamps consume 40Watts, but have several advantages over the ~40 Watt lampscurrently used. The initial lighting intensity of these bulbs is ratedat 3,300-3,700 lumens, which is about 780-1,180 lumens greaterthan that of the existing lamps, resulting in about 15-17% greaterlight output, due primarily to a narrower tube body and specialphosphor blends. Also the initial lumen level is maintained for alonger period with these lamps. The colour rendition (a measureof “usable” light output) is also significantly greater for theselamps. Moreover, the improved efficacy lamps typically have alonger life than the existing ones (rated at 24,000-30,000 hoursat 3 hrs. per start, as compared with 20,000 hours rating). Theselamps can be used in all standard 4-foot fixtures with no modifi-cations.
Required Data:! WRE: Wattage rating for existing luminaries,! WRR: Wattage rating for energy-efficient luminaries,! Nlum: Number of luminaries,! Nh: Number of operating hours of luminaries per year.
CCaallccuullaattiioonn EExxaammppllee::
PPrroobblleemm: Consider a building with a total real powerdemand of 500 kW and a power factor of pfe=0.70.Determine the required size of a set of capacitors to beinstalled in parallel at the building service entrance so thatthe power factor becomes pfr=0.90.
SSoolluuttiioonn: The size in kVAR of the capacitor is:
PC=500·[tan(cos-10.70) - tan(cos-10.90)]=268kVAR
Thus, a capacitor of 275 kVAR will be adequate.
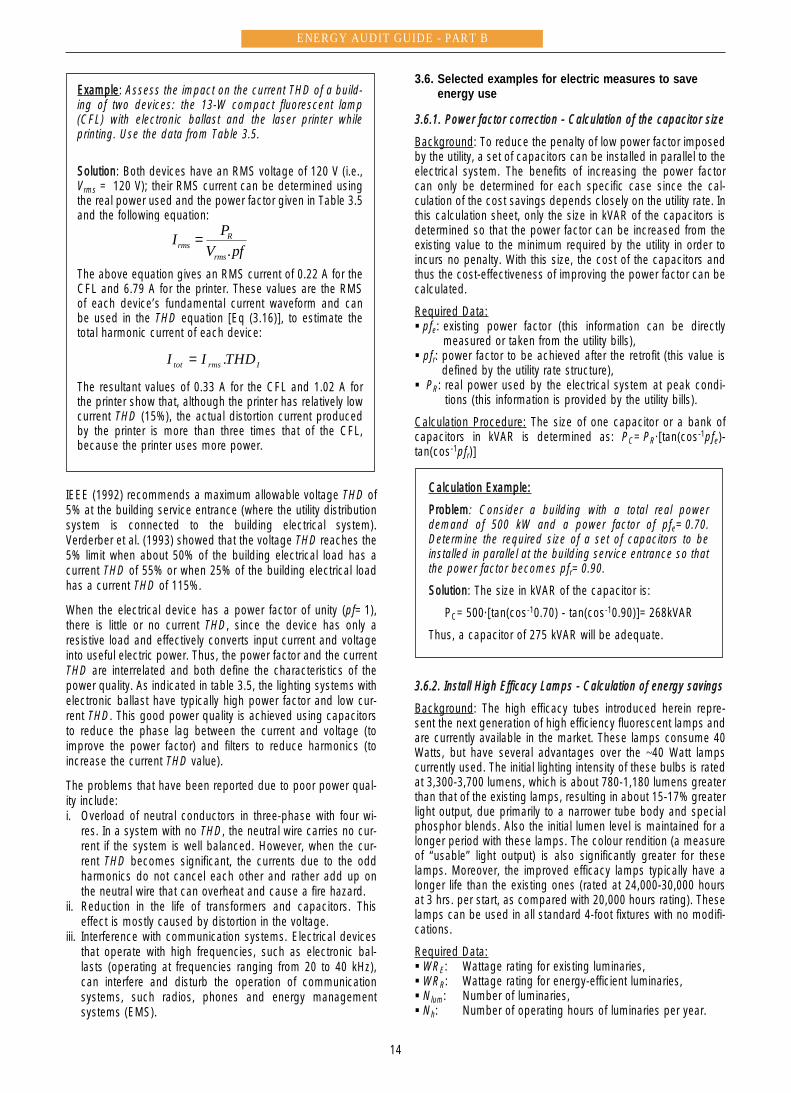
EExxaammppllee: Assess the impact on the current THD of a build-ing of two devices: the 13-W compact fluorescent lamp(CFL) with electronic ballast and the laser printer whileprinting. Use the data from Table 3.5.
SSoolluuttiioonn: Both devices have an RMS voltage of 120 V (i.e.,Vrms = 120 V); their RMS current can be determined usingthe real power used and the power factor given in Table 3.5and the following equation:
The above equation gives an RMS current of 0.22 A for theCFL and 6.79 A for the printer. These values are the RMSof each device’s fundamental current waveform and canbe used in the THD equation [Eq (3.16)], to estimate thetotal harmonic current of each device:
The resultant values of 0.33 A for the CFL and 1.02 A forthe printer show that, although the printer has relatively lowcurrent THD (15%), the actual distortion current producedby the printer is more than three times that of the CFL,because the printer uses more power.
ENERGY AUDIT GUIDE - PART B
14
pfVPI
rms
Rrms .
=
Irmstot THDII .=
ENERGY AUDIT GUIDE - PART B
15
Calculation Procedure: The energy saving in kWh is determinedas follows:
4. UPGRADE OF CENTRAL HEATINGSYSTEMS
4.1. Introduction
According to a survey reported by the US Energy InformationAdministration (EIA, 1997), four types of heating systems areused extensively in US commercial buildings including boilers,packaged heating units, individual space heaters and/or fur-naces. Boilers are the main equipment used by percentage oftotal heated buildings, since they provide heating to almost 33%of the total heated floor-space of US commercial buildings.
However, boilers are used in only 15% of heated commercialbuildings, significantly less than furnaces, which are used in mo-re than 42% of US commercial buildings. This difference inusage stems from the fact that the boilers are typically used inlarger buildings, while furnaces are used in smaller ones. Of theexisting boilers in US commercial buildings 65% are gas-fired,28% oil-fired, and only 7% are electric. The average combustionefficiency of the existing boilers is in the range of 65 to 75%.New energy-efficient gas or oil-fired boilers can be in the rangeof 85 to 95%.
4.2. Basic combustion principles and fuel types
Fuels used in boilers consist of hydrocarbons including alkynes(CnH2n-2) such as the acetylene (n=2), alkenes (CnH2n) such asthe ethylene (n=2), alkanes (CnH2n+2) such as the octane (n=8).A typical combustion reaction involves an atom of carbon withtwo atoms of oxygen with a generation of heat, which is knownas the heating value (HV) of a fuel. Typically, the heating value isgiven when the fuel is dry, while the moisture reduces theheating value according to the relation: HV=HVdry·(1-M), with Mthe moisture content of the fuel. It should be noted that theheating value of a fuel increases with its carbon content.
Liquid or distillate fuels are generally graded in different cate-gories depending on its properties. For fuel oils, there are 6 dif-ferent grades depending on the viscosity. Table 4.1 provides theheating values and common usage of 5 oil fuels commonly soldin the US. Fuel oil No 3 has now been incorporated as part offuel oil No 2. Similar grades are used for diesel fuels with dieselNo 1 used for high-speed engines and diesel No 2 used forindustrial applications and heavy cars.
4.3. Boiler configurations and components
Typically, boilers have several parts including an insulated jack-et, a burner, a mechanical draft system, tubes and chambers forcombustion gases, tubes and chambers for water or steam cir-culation, and controls. There are several factors that influencethe design of boilers including fuel characteristics, firing method,steam pressure, and heating capacity. However, commercialand industrial boilers can be divided into two basic groups: fire-tube or water-tube, depending on the relative location of the hotcombustion gases and the fluid being heated within the boiler.In the following sections, a brief description of the boiler andburner types is provided.
44..33..11.. BBooiilleerr ttyyppeess
Most commercial boilers are manufactured of steel. Some smal-ler-size boilers are made up of cast iron. The steel boilers trans-fer combustion heat to the fluid using an assembly of tubes,which can be either water-tubes or fire-tubes.
Fire-tube Boilers: In these boilers, the hot combustion productsflow through tubes submerged in the boiler water. To increasethe contact surface area between the hot gases and the water,2 to 4 passes are used for the tubes. The multi-passes tubesincrease the efficiency of the boiler but require greater fanpower. Due to economics, the highest capacity of fire-tube boil-ers is currently in the 10,000 kg of steam per hour at an oper-ating pressure of 16 atm (250 psi). The fire-tube boilers are gen-erally simple to install and maintain. Moreover, they have theability to meet sudden and wide load fluctuations with only smallpressure changes.
Water-tube Boilers: In these boilers, the water flows inside tubessurrounded by flue combustion gases. The density variationbetween cold feed water and the hot water/ steam mixture in theriser generally maintain the water flow. The water-tube boilersare classified in several groups depending on the shape, anddrum location, capacity and number. The size of water-tube boil-ers can be as small as 400 kg of steam per hour and as largeas 1000 MW. The largest industrial boilers provide about250,000 kg of steam per hour.
Cast-iron Boilers: These boilers are used in small installations(below 1 MWh) where long service life is important. They are ma-de up of pre-cast sections and thus are more readily field assem-bled than steel boilers. At similar capacities, the cast-iron boilersare typically more expensive than fire-tube or water-tube boilers.
44..33..22.. FFiirriinngg ssyysstteemmss
The firing system of a boiler depends on the fuel used. The cha-racteristics of the firing system for each fuel type are summa-rized below.
Gas-fired units: Natural gas is the simplest fuel to burn since itmixes easily with combustion air supply. Gas is generally intro-
( )1000
1⋅⋅−⋅=∆ hRElum NWRWRNkWh
Oil Grade SpecificGravity
Heating ValuekWh/litre (MBtu/gal)
Applications
No 1 0.805 9.7 (134) For vaporizing pot-type burnersNo 2 0.850 10.4 (139) For general purpose domestic heatingNo 3 0.903 10.9 (145) For burners without preheatingNo 5 0.933 11.1 (148) Requires preheating to 75-95 °CNo 6 0.965 11.3 (151) Requires preheating to 95-115 °C
Table 4.1: Heating value and specific gravity of oil fuels used in the US
duced at the burner through several orifices providing jets ofnatural gas that mix rapidly with the combustion air supply.There is a wide range of burner designs depending on the ori-entation, the number and the location of the orifices. As part ofroutine tune-up and maintenance of gas-fired boilers, it is impo-rtant to inspect gas injection orifices to check that all the pas-sages are unobstructed. In addition, it is important to identifyand replace any burned off or missing burner parts.
Oil-fired units: Oil fuels need some form of preparation and treat-ment before final delivery to the burner. The preparation of theoil fuels may include the following:• Use of strainers and filters to clean the oil fuel and remove any
deposit or solid foreign material.• Add flow line pre-heaters to deliver the fuel oil with a proper
viscosity.• Use atomizers to deliver the fuel oil in small droplets before
mixing with the combustion air supply. A gun fitted with a tiphaving several orifices that can produce fine spray can carryout the atomisation of the fuel oil. Moreover, oil cups that spinthe oil into a fine mist are also used on small boiler units.
During tune-up of central heating systems, it is important tocheck that the burner is adequate for the boiler unit. In particular,it is important to verify that the atomizer has the proper design,size and location. In addition, the oil-tip orifices should becleaned and inspected for any damages to ensure proper oil-spray pattern.
Coal-fired units: Some central heating systems use coal as theprimary fuel to fire the burner. The efficiency of such systemsdepends on the firing system, the type of boiler or furnace and theash characteristics of the coal. Some units are equipped with ashre-injection systems that allow collected ash, containing someunburned carbon, to be redelivered into the burner. There are twomain coal-firing systems:a) Pulverized coal fired systems that pulverize, dry, classify and
transport the coal to the burner’s incoming air supply. Thepulverized coal fired systems are generally considered to beeconomical for units with large capacities (more than 100,000kg of steam per hour).
b) Coal stoker units that have bed combustion on the boiler gratethrough which the combustion air is supplied. There are cur-rently several stoker-firing methods used in industrial appli-cations, such as underfed, overfed and spreader. Both under-fed and overfed firing methods require the coal to be trans-ported directly to the bed combustion and usually respondslowly to sudden load variations. The spreader stokers burnpartially the coal in suspension before transporting it to thegrate, while they can burn a wide range of fuels includingwaste products.
44..33..33.. BBooiilleerr tthheerrmmaall eeffffiicciieennccyy
As is already mentioned, combustion is a chemical reaction ofcarbon and oxygen atoms that produces heat. The oxygen comesfrom the air supplied to the burner that fires the boiler, which alsocontains nitrogen that is useless to the combustion process. Aspecific amount of air is needed to ideally complete the com-bustion of the fuel. This amount of air is typically referred to as thestoichiometric air. However, in actual combustion reactions, moreair than this ideal amount is needed to totally complete the com-bustion of fuel.
The main challenge to ensure optimal operating conditions forboilers is to provide the proper excess air for the fuel com-bustion. It is generally agreed that 10% excess air provides the
optimum air to fuel ratio for complete combustion. Too muchexcess air causes higher stack losses and requires more fuel toraise ambient air to stack temperatures. On the other hand,incomplete combustion occurs if insufficient air is supplied, andthe flame temperature is reduced.
The overall boiler thermal efficiency is defined as the ratio of theheat output (Eout) over the heat input (Ein):
(4.1)
The overall efficiency accounts for the combustion efficiency, thestack loss and the heat losses from the outside surfaces of theboiler. The combustion efficiency refers to the effectiveness ofthe burner to provide the optimum fuel/air ratio for complete fuelcombustion.
To determine the overall boiler thermal efficiency, some mea-surements are required. The most common test used for boilersis the flue gas analysis using an Orsat apparatus to determinethe percentage by volume of CO2, CO, O2 and N2 in the com-bustion gases leaving the stack. Based on the flue gas compo-sition and temperature, some adjustments can be made to tune-up the boiler to get the best air-to-fuel ratio in order to improvethe boiler efficiency.
The following general rules can be used to adjust the operationof the boiler:• Stack temperature: The lower the stack temperature, the more
efficient is the combustion. High flue gas temperatures indi-cate that there is no good heat transfer between the hot com-bustion gases and water. The chambers and the tubes withinthe boiler should be cleaned to remove any soot, deposit andfouling that may reduce the heat transfer. However, the stacktemperature should not be too low to avoid water condensa-tion along the stack. The condensed water mixes with sulphurand can cause corrosion of the stack. Table 4.2 provides theminimum stack temperature for common fuel types to avoidcorrosion problems.
• CO2 level: The higher this level, the more efficient is the com-bustion. The low limits acceptable for CO2 level is 10% for gasfired boilers and 14% for oil fired boilers. If the CO2 levels arelower than these limits, the combustion is most likely incom-plete. The air-to-fuel ratio should be adjusted to provide moreexcess air.
• CO level: No CO should be present in the flue gas. Indeed,any presence of CO indicates that the combustion reaction isincomplete, thus there is not enough excess air. The presenceof CO in the flue gas can be detected by the presence ofsmoke that leads to soot deposit in the boiler tubes andchambers.
• O2 level: The lower the O2 level, the more efficient is the com-bustion. High level of O2 is an indication of too much excessair. The high limit acceptable for O2 level is 10%. Whengreater levels are found, the excess air should be reduced.
Table 4.2: Minimum exit flue gas temperatures to avoid stack corrosion
Fuel type used bythe boiler
TemperatureLimit (°C)
Fuel Oil 200Bituminous Coal 150Natural gas 105
in
outb E
E=η
ENERGY AUDIT GUIDE - PART B
16
When the excess air is not adequate, the following boiler adjust-ments can be used:1. Operate the boiler for a specific firing rate and put the com-
bustion controls on.2. After stable operation, take a complete set of measurements
(composition and temperature of the stack flue gas).3. Increase the excess air by 1 to 2% and take a new set of mea-
surements (after reaching stable boiler operating conditions).4. Decrease the excess air in small steps until a minimum ex-
cess O2 condition is reached (i.e., when the combustion is in-complete and a noticeable CO level –above 400 ppm- can bedetected in the flue gas). Take measurements following eachchange (allow the boiler to reach stable operating conditions).
5. Plot the measured data to determine the variation of CO levelas a function of the percent of O2 in the flue gas. Typically, amargin in excess O2 ranging from 0.5 to 2% O2 above theminimum value is used.
6. Reset the burner controls to maintain the excess O2 within themargin established in step 5.
7. Repeat steps 1 through 6 for various firing rates to be met inthe boiler operation. It is recommended the tests to be per-formed from higher to lower firing rates.
The new operating controls should be closely monitored for asufficient length of time (one to two months) to ensure properoperation of the boiler. Monographs are available to determinethe overall boiler efficiency based on measurements of flue gascomposition and temperature. One of these monographs ap-plies to both gas- and oil-fired boilers and is shown in Appendix.Example 4.1 illustrates how the monographs can be used todetermine the boiler efficiency.
4.4. Boiler efficiency improvements
There are several measures by which the boiler efficiency of anexisting heating plant can be improved, providing savings in thefuel use by the plant. Among these measures are:• The tuning-up of the existing boiler.• The replacement of the existing boiler with a high efficiency
boiler.• The use of modular boilers.
To calculate the savings in fuel use (ÄFU) related to the changein the boiler efficiency, the following equation could be used:
(4.2)
where çstd, çeff are the old and new efficiency of the boiler re-spectively and FUstd is the fuel consumption before any retrofitof the boiler system. It is therefore important to estimate both theold and the new overall thermal efficiency of the boiler in order toestimate the energy savings. The following sections provide adetailed description of the various boiler improvementmeasures, with some estimation of their impact.
44..44..11.. EExxiissttiinngg bbooiilleerr ttuunnee--uupp
The boiler thermal efficiency can be estimated analysing the fluegas composition and temperature, using the monograph ofAppendix. If the efficiency is found to be low due to inappropri-ate excess air, the boiler can be adjusted and its efficiencyimproved, as described in the step-by-step procedure of theprevious section. For this, some instrumentation is needed, suchas a gas flue analyser and a temperature measurement device.Example 4.2 illustrates how the cost-effectiveness of a boilertune-up can be evaluated.
Other measures that can be considered to increase the overallefficiency of the boiler are summarized below:# Installation of turbulators in the fire-tubes to create more tur-
bulence, thus increasing the heat transfer between the hotcombustion gas and the water. The improvement in boilerefficiency can be determined by measuring the stack fluegas temperature, which should decrease when the tur-bulators are installed. As a rule of thumb, a 2.5% increase inthe boiler efficiency is expected for each 50oC decrease inthe stack flue gas temperature.
# Insulation of the boiler’s jacket to reduce the heat loss. Theimprovement of the boiler efficiency depends on the surfacetemperature.
# Installation of soot-blowers to remove boiler tube depositsthat reduce the heat transfer between the hot combustiongas and the water. The improvement in the boiler efficiencydepends on the flue gas temperature.
# Use of economizers to transfer energy from stack flue gasesto incoming feed-water. The stack temperature should not belowered below the limits provided in table 4.2 to avoid corro-sion problems. As a rule of thumb, a 1% increase in the boil-er efficiency is expected for each 5oC increase in the feed-water temperature.
# Use of air pre-heaters to transfer energy from stack fluegases to combustion air. The stack temperature should notbe lower than the values provided in table 4.2.
The stack flue gas heat recovery equipment (i.e., air pre-heatersand economizers) is typically the most cost-effective auxiliaryequipment that can be added to improve the overall thermal effi-ciency of the boiler system.
EExxaammppllee 44..22: The boiler of example 4.1 uses 1,500,000litres of fuel oil per year. Instrumentation for the adjust-ment of the boiler operation so its excess O2 to be only3% is purchased at a cost of $20,000. Determine thepayback of the equipment if the cost of fuel oil is$0.20/litre.
SSoolluuttiioonn:: From example 4.1, the existing boiler has excessO2 of 6% and the overall boiler thermal efficiency is about78% (i.e., nstd=0.78). After the boiler tune-up, the excessO2 is 3%. Using the monograph of Appendix, the newboiler efficiency can be determined from the flue gas tem-perature (343oC) and the excess O2 (3%). It is found to beneff=84%=0.84. Using eq. (4.2), the fuel savings can becalculated:
Therefore, the simple payback period for the instrumen-tation is:
stdeff
stdeff FUFU .η
ηη −=∆
EExxaammppllee 44..11:: A flue gas analysis of an oil fuel fired boilerindicates that the CO2 content is 11% with a gas flue tem-perature of 343oC. Determine the overall thermal efficien-cy of the boiler.
SSoolluuttiioonn:: From the monograph of Appendix, the com-bustion occurs with an excess air of 38% and excess O2of 6%. The overall boiler thermal efficiency is about 78%.
ENERGY AUDIT GUIDE - PART B
17
yr/litre140,107000,500,184.0
78.084.0FU =⋅−=∆
year0.1litre/20.0$*yr/litre140,107
000,20$SBP ≈=
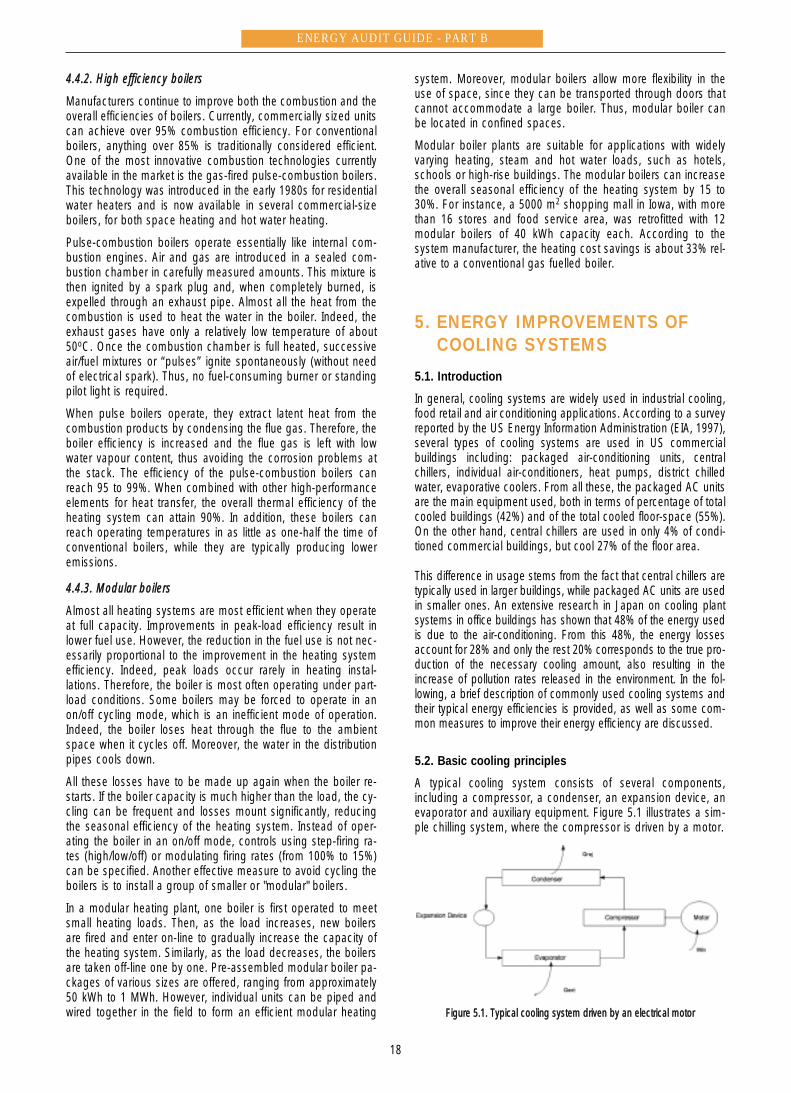
ENERGY AUDIT GUIDE - PART B
18
44..44..22.. HHiigghh eeffffiicciieennccyy bbooiilleerrss
Manufacturers continue to improve both the combustion and theoverall efficiencies of boilers. Currently, commercially sized unitscan achieve over 95% combustion efficiency. For conventionalboilers, anything over 85% is traditionally considered efficient.One of the most innovative combustion technologies currentlyavailable in the market is the gas-fired pulse-combustion boilers.This technology was introduced in the early 1980s for residentialwater heaters and is now available in several commercial-sizeboilers, for both space heating and hot water heating.
Pulse-combustion boilers operate essentially like internal com-bustion engines. Air and gas are introduced in a sealed com-bustion chamber in carefully measured amounts. This mixture isthen ignited by a spark plug and, when completely burned, isexpelled through an exhaust pipe. Almost all the heat from thecombustion is used to heat the water in the boiler. Indeed, theexhaust gases have only a relatively low temperature of about50oC. Once the combustion chamber is full heated, successiveair/fuel mixtures or “pulses” ignite spontaneously (without needof electrical spark). Thus, no fuel-consuming burner or standingpilot light is required.
When pulse boilers operate, they extract latent heat from thecombustion products by condensing the flue gas. Therefore, theboiler efficiency is increased and the flue gas is left with lowwater vapour content, thus avoiding the corrosion problems atthe stack. The efficiency of the pulse-combustion boilers canreach 95 to 99%. When combined with other high-performanceelements for heat transfer, the overall thermal efficiency of theheating system can attain 90%. In addition, these boilers canreach operating temperatures in as little as one-half the time ofconventional boilers, while they are typically producing loweremissions.
44..44..33.. MMoodduullaarr bbooiilleerrss
Almost all heating systems are most efficient when they operateat full capacity. Improvements in peak-load efficiency result inlower fuel use. However, the reduction in the fuel use is not nec-essarily proportional to the improvement in the heating systemefficiency. Indeed, peak loads occur rarely in heating instal-lations. Therefore, the boiler is most often operating under part-load conditions. Some boilers may be forced to operate in anon/off cycling mode, which is an inefficient mode of operation.Indeed, the boiler loses heat through the flue to the ambientspace when it cycles off. Moreover, the water in the distributionpipes cools down.
All these losses have to be made up again when the boiler re-starts. If the boiler capacity is much higher than the load, the cy-cling can be frequent and losses mount significantly, reducingthe seasonal efficiency of the heating system. Instead of oper-ating the boiler in an on/off mode, controls using step-firing ra-tes (high/low/off) or modulating firing rates (from 100% to 15%)can be specified. Another effective measure to avoid cycling theboilers is to install a group of smaller or "modular" boilers.
In a modular heating plant, one boiler is first operated to meetsmall heating loads. Then, as the load increases, new boilersare fired and enter on-line to gradually increase the capacity ofthe heating system. Similarly, as the load decreases, the boilersare taken off-line one by one. Pre-assembled modular boiler pa-ckages of various sizes are offered, ranging from approximately50 kWh to 1 MWh. However, individual units can be piped andwired together in the field to form an efficient modular heating
system. Moreover, modular boilers allow more flexibility in theuse of space, since they can be transported through doors thatcannot accommodate a large boiler. Thus, modular boiler canbe located in confined spaces.
Modular boiler plants are suitable for applications with widelyvarying heating, steam and hot water loads, such as hotels,schools or high-rise buildings. The modular boilers can increasethe overall seasonal efficiency of the heating system by 15 to30%. For instance, a 5000 m2 shopping mall in Iowa, with morethan 16 stores and food service area, was retrofitted with 12modular boilers of 40 kWh capacity each. According to thesystem manufacturer, the heating cost savings is about 33% rel-ative to a conventional gas fuelled boiler.
5. ENERGY IMPROVEMENTS OFCOOLING SYSTEMS
5.1. Introduction
In general, cooling systems are widely used in industrial cooling,food retail and air conditioning applications. According to a surveyreported by the US Energy Information Administration (EIA, 1997),several types of cooling systems are used in US commercialbuildings including: packaged air-conditioning units, centralchillers, individual air-conditioners, heat pumps, district chilledwater, evaporative coolers. From all these, the packaged AC unitsare the main equipment used, both in terms of percentage of totalcooled buildings (42%) and of the total cooled floor-space (55%).On the other hand, central chillers are used in only 4% of condi-tioned commercial buildings, but cool 27% of the floor area.
This difference in usage stems from the fact that central chillers aretypically used in larger buildings, while packaged AC units are usedin smaller ones. An extensive research in Japan on cooling plantsystems in office buildings has shown that 48% of the energy usedis due to the air-conditioning. From this 48%, the energy lossesaccount for 28% and only the rest 20% corresponds to the true pro-duction of the necessary cooling amount, also resulting in theincrease of pollution rates released in the environment. In the fol-lowing, a brief description of commonly used cooling systems andtheir typical energy efficiencies is provided, as well as some com-mon measures to improve their energy efficiency are discussed.
5.2. Basic cooling principles
A typical cooling system consists of several components,including a compressor, a condenser, an expansion device, anevaporator and auxiliary equipment. Figure 5.1 illustrates a sim-ple chilling system, where the compressor is driven by a motor.
Figure 5.1. Typical cooling system driven by an electrical motor
Note that the chilling (or heat extraction) occurs at the evapo-rator, while the condenser does the heat rejection. Both theevaporator and the condenser are heat exchangers. At the evap-orator, heat is extracted by the refrigerant from water that is cir-culated through cooling coils of an air-handling unit. At the con-denser, heat is extracted from the refrigerant and rejected to theambient air (air cooled condensers) or water (water cooled con-densers, connected to cooling towers).
The Coefficient of Performance (COP) characterizes the energyefficiency of a cooling system and is defined as the ratio of theheat extracted divided by the energy input required. In case ofan electrically driven cooling system, as the one shown in figure5.1, the COP can be expressed as: COP=Qext/Win. Both Qextand Win should be expressed in the same unit (i.e., W or kW), sothat COP to be dimensionless. Most manufacturers provide theCOP of their systems for full load conditions.
The maximum theoretical value of COP corresponds to the idealCarnot cycle, which consists of isentropic compression andexpansion and isothermal evaporation and condensation. In realcooling systems, the Carnot cycle cannot be achieved becauseof the irreversible losses in the compression and expansion ofthe refrigerant, the pressure losses in the lines and the heat loss-es in the rejection and absorption processes. However, it is use-ful to compare the COP of an actual cooling system to that ofthe Carnot cycle operating between the same temperatures todetermine the potential of any energy efficiency improvements inthe design of cooling units.
The COP of an ideal Carnot cycle can be expressed in terms ofthe absolute temperature of the evaporator (TC - the lowest tem-perature in the cycle) and the condenser (TH - the highest tem-perature in the cycle) as follows:
(5.1)
Using the ARI standard 550/590 (1998) rated conditions for waterchillers (TH=308 K and TC=280 K), the COPCarnot is calculated tobe 9.88. Currently, the most energy efficient centrifugal chiller hasa COP of about 7.0 (70% of the ideal Carnot cycle).
The capacity of cooling systems is expressed in kW and isdefined in terms of the maximum amount of heat that can beextracted. Cooling systems manufacturers use tons to providetheir capacity (1 ton is about 3.516 kW) and kW/ton to expresstheir energy efficiency. In addition, the energy efficiency of theelectrically powered cooling systems can be expressed with theenergy efficiency ratio (EER), which is defined as the ratio of theheat extracted (in Btu/h) over the energy input required (inWatts). Therefore, the relation between EER and COP is:EER=3.413··COP.
The above stands only for US, since in Europe the EER isdefined to be exactly the same as the COP. However, theadopted European standard EN814 (CENELEC, 1997) specifiesthat the term COP should be used for only heating mode oper-ation of heat pumps. Otherwise, the standard requires the use ofthe term EER to rate the energy efficiency of air conditioners andheat pumps. ARI standard 550/590 allows rating the energy effi-ciency of water chilling systems using the vapour compressioncycle by one of the three parameters: COP, EER or kW/ton.
Since cooling systems operate often under part-load conditionsthroughout the year, other efficiency coefficients have been pro-posed in an attempt to provide a better estimation of the coolingunits energy performance over a wide range of operating condi-
tions. Two such parameters are commonly used, the seasonalenergy efficiency ratio (SEER) and the integrated part load value(IPLV). ARI 550/590 standard defines the IPLV using the relation:IPLV = 0.01xA + 0.42xB + 0.45xC + 0.12xD, with A the COP (orEER) at 100% load, B at 75%, C at 50% and D at 25% load.
5.3. Types of cooling systems
As already mentioned, several types of cooling systems are cur-rently available for space air conditioning, the most common ofwhich can be grouped into two major categories: unitary ACsystems and chillers.
55..33..11.. UUnniittaarryy AACC ssyysstteemmss
These systems are typically factory-assembled units to provideeither cooling only or both cooling and heating, and includepackaged AC units, individual air conditioners, residential typeAC units and heat pumps. Compared to chillers, the unitary ACsystems have lower life span and lower energy efficiency. Theyare typically installed in small commercial buildings (less thanthree floors) including small office buildings, retail spaces andclassrooms.
The packaged AC units are compact cooling systems encasedin cabinets, including:• Rooftop Systems, typically located in the roof. For commer-
cial buildings, these units are available in the range of 17 to70 kW, even though custom-built units can have capacitiesup to 350 kW. For residential buildings, capacities between 3and 7 kW are common. Most units are equipped with aheating system (a built-in gas furnace, an electric resistance,etc.) to provide both cooling and heating.
• Vertical Packaged Systems, which are typically designed for in-door installation. Most systems have water-cooled condensers.
• Split Packaged Systems have typically air cooled condenserand compressor installed outdoors and the evaporator instal-led in an indoor air-handling unit.
Heat pumps can be used for both cooling and heating by sim-ply reversing the refrigeration flow through the unit. The heat sink(or source) for the heat pump can be air, water or ground. Forcommercial and industrial applications, air-to-air heat pumpshave capacities up to 90 kW, while hydronic heat pumps canhave higher cooling capacities. Ground-coupled heat pumpsare still small and are mostly suitable for residential applications.
55..33..22.. CCeennttrraall cchhiilllleerrss
In large buildings, central chillers are used to cool water forspace air conditioning. Electric motors, hot water or steam, fos-sil fuel engines or turbines can power central chillers. Des-cription of the various types of central chillers is provided below.
Electric Chillers: These chillers use mechanical vapour compres-sion cycle. There are currently three major types of electricchillers available in the market, according to the type of the com-pressor they use: • Centrifugal compressors use rotating impellers to increase the
refrigerant gas pressure and temperature. Chillers with cen-trifugal compressors have capacities in the range of 300 to25000 kW. For capacities above 4500 kW, the centrifugalcompressors are typically field erected.
• Reciprocating compressors use pistons to raise the pressureand the temperature of refrigerant gases. Two or more com-pressors can be used under part-load conditions to achievehigher operating efficiencies. Capacities of 35 to 700 kW aretypical for chillers with reciprocating compressors.
CH
CCarnot TT
TCOP−
=
ENERGY AUDIT GUIDE - PART B
19
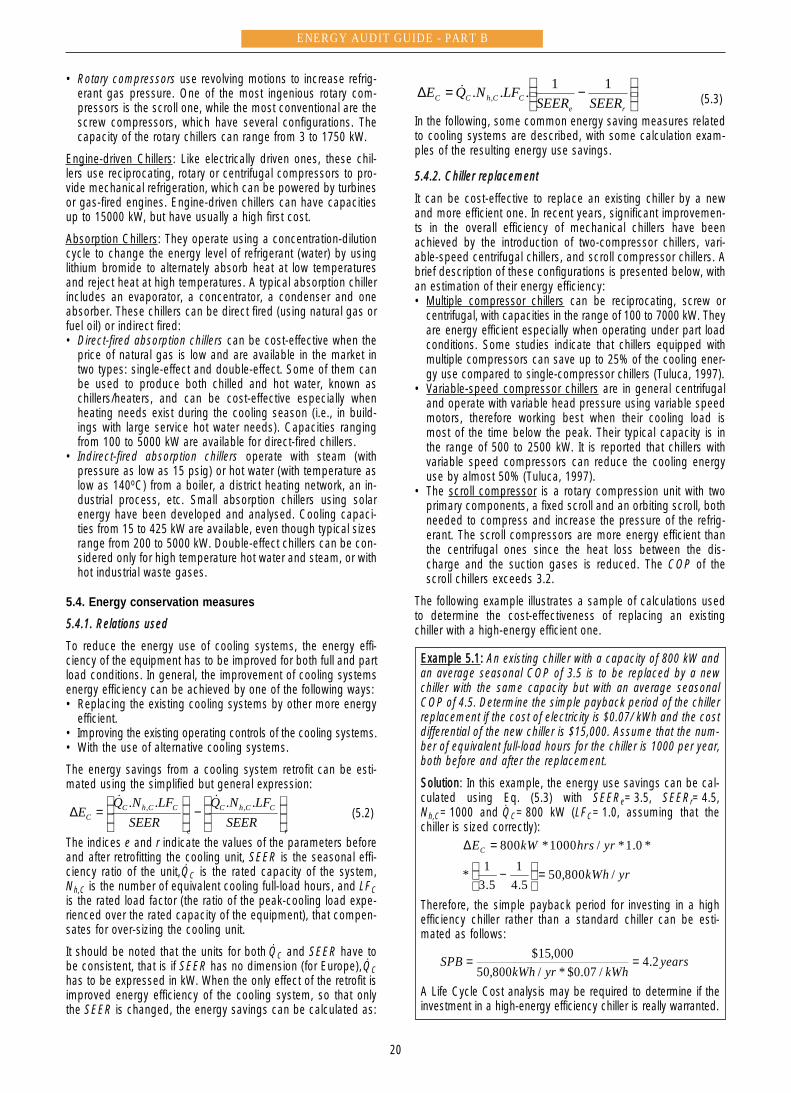
• Rotary compressors use revolving motions to increase refrig-erant gas pressure. One of the most ingenious rotary com-pressors is the scroll one, while the most conventional are thescrew compressors, which have several configurations. Thecapacity of the rotary chillers can range from 3 to 1750 kW.
Engine-driven Chillers: Like electrically driven ones, these chil-lers use reciprocating, rotary or centrifugal compressors to pro-vide mechanical refrigeration, which can be powered by turbinesor gas-fired engines. Engine-driven chillers can have capacitiesup to 15000 kW, but have usually a high first cost.
Absorption Chillers: They operate using a concentration-dilutioncycle to change the energy level of refrigerant (water) by usinglithium bromide to alternately absorb heat at low temperaturesand reject heat at high temperatures. A typical absorption chillerincludes an evaporator, a concentrator, a condenser and oneabsorber. These chillers can be direct fired (using natural gas orfuel oil) or indirect fired: • Direct-fired absorption chillers can be cost-effective when the
price of natural gas is low and are available in the market intwo types: single-effect and double-effect. Some of them canbe used to produce both chilled and hot water, known aschillers/heaters, and can be cost-effective especially whenheating needs exist during the cooling season (i.e., in build-ings with large service hot water needs). Capacities rangingfrom 100 to 5000 kW are available for direct-fired chillers.
• Indirect-fired absorption chillers operate with steam (withpressure as low as 15 psig) or hot water (with temperature aslow as 140oC) from a boiler, a district heating network, an in-dustrial process, etc. Small absorption chillers using solarenergy have been developed and analysed. Cooling capaci-ties from 15 to 425 kW are available, even though typical sizesrange from 200 to 5000 kW. Double-effect chillers can be con-sidered only for high temperature hot water and steam, or withhot industrial waste gases.
5.4. Energy conservation measures
55..44..11.. RReellaattiioonnss uusseedd
To reduce the energy use of cooling systems, the energy effi-ciency of the equipment has to be improved for both full and partload conditions. In general, the improvement of cooling systemsenergy efficiency can be achieved by one of the following ways:• Replacing the existing cooling systems by other more energy
efficient.• Improving the existing operating controls of the cooling systems.• With the use of alternative cooling systems.
The energy savings from a cooling system retrofit can be esti-mated using the simplified but general expression:
(5.2)
The indices e and r indicate the values of the parameters beforeand after retrofitting the cooling unit, SEER is the seasonal effi-ciency ratio of the unit,
•
QC is the rated capacity of the system,Nh,C is the number of equivalent cooling full-load hours, and LFCis the rated load factor (the ratio of the peak-cooling load expe-rienced over the rated capacity of the equipment), that compen-sates for over-sizing the cooling unit.
It should be noted that the units for both•
QC and SEER have tobe consistent, that is if SEER has no dimension (for Europe),
•
QChas to be expressed in kW. When the only effect of the retrofit isimproved energy efficiency of the cooling system, so that onlythe SEER is changed, the energy savings can be calculated as:
(5.3)
In the following, some common energy saving measures relatedto cooling systems are described, with some calculation exam-ples of the resulting energy use savings.
55..44..22.. CChhiilllleerr rreeppllaacceemmeenntt
It can be cost-effective to replace an existing chiller by a newand more efficient one. In recent years, significant improvemen-ts in the overall efficiency of mechanical chillers have beenachieved by the introduction of two-compressor chillers, vari-able-speed centrifugal chillers, and scroll compressor chillers. Abrief description of these configurations is presented below, withan estimation of their energy efficiency:• Multiple compressor chillers can be reciprocating, screw or
centrifugal, with capacities in the range of 100 to 7000 kW. Theyare energy efficient especially when operating under part loadconditions. Some studies indicate that chillers equipped withmultiple compressors can save up to 25% of the cooling ener-gy use compared to single-compressor chillers (Tuluca, 1997).
• Variable-speed compressor chillers are in general centrifugaland operate with variable head pressure using variable speedmotors, therefore working best when their cooling load ismost of the time below the peak. Their typical capacity is inthe range of 500 to 2500 kW. It is reported that chillers withvariable speed compressors can reduce the cooling energyuse by almost 50% (Tuluca, 1997).
• The scroll compressor is a rotary compression unit with twoprimary components, a fixed scroll and an orbiting scroll, bothneeded to compress and increase the pressure of the refrig-erant. The scroll compressors are more energy efficient thanthe centrifugal ones since the heat loss between the dis-charge and the suction gases is reduced. The COP of thescroll chillers exceeds 3.2.
The following example illustrates a sample of calculations usedto determine the cost-effectiveness of replacing an existingchiller with a high-energy efficient one.
EExxaammppllee 55..11:: An existing chiller with a capacity of 800 kW andan average seasonal COP of 3.5 is to be replaced by a newchiller with the same capacity but with an average seasonalCOP of 4.5. Determine the simple payback period of the chillerreplacement if the cost of electricity is $0.07/ kWh and the costdifferential of the new chiller is $15,000. Assume that the num-ber of equivalent full-load hours for the chiller is 1000 per year,both before and after the replacement.
SSoolluuttiioonn: In this example, the energy use savings can be cal-culated using Eq. (5.3) with SEERe=3.5, SEERr=4.5,Nh,C=1000 and
•
QC=800 kW (LFC=1.0, assuming that thechiller is sized correctly):
Therefore, the simple payback period for investing in a highefficiency chiller rather than a standard chiller can be esti-mated as follows:
A Life Cycle Cost analysis may be required to determine if theinvestment in a high-energy efficiency chiller is really warranted.
−=∆
reCChCC SEERSEER
LFNQE 11... ,!
r
CChC
e
CChCC SEER
LFNQSEER
LFNQE
−
=∆
.... ,,!!
ENERGY AUDIT GUIDE - PART B
20
yrkWh
yrhrskWEC
/800,505.4
15.3
1*
*0.1*/1000*800
=
−
=∆
yearskWhyrkWh
SPB 2.4/07.0$*/800,50
000,15$ ==
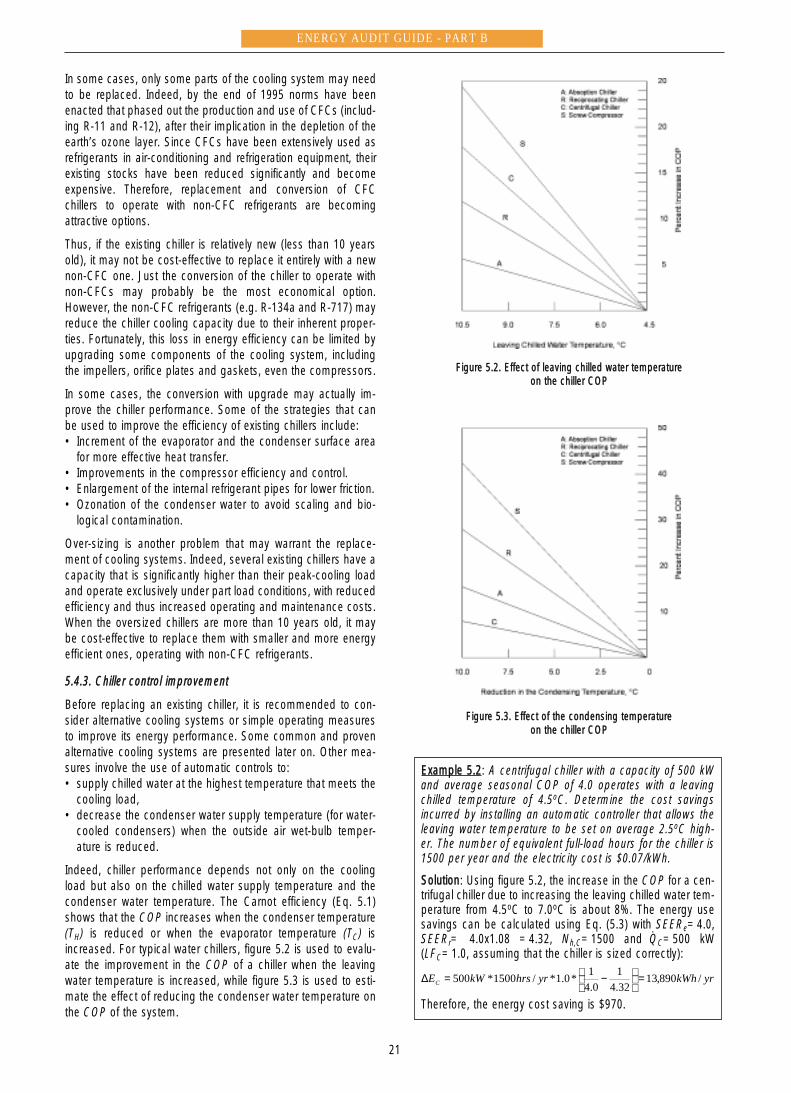
In some cases, only some parts of the cooling system may needto be replaced. Indeed, by the end of 1995 norms have beenenacted that phased out the production and use of CFCs (includ-ing R-11 and R-12), after their implication in the depletion of theearth’s ozone layer. Since CFCs have been extensively used asrefrigerants in air-conditioning and refrigeration equipment, theirexisting stocks have been reduced significantly and becomeexpensive. Therefore, replacement and conversion of CFCchillers to operate with non-CFC refrigerants are becomingattractive options.
Thus, if the existing chiller is relatively new (less than 10 yearsold), it may not be cost-effective to replace it entirely with a newnon-CFC one. Just the conversion of the chiller to operate withnon-CFCs may probably be the most economical option.However, the non-CFC refrigerants (e.g. R-134a and R-717) mayreduce the chiller cooling capacity due to their inherent proper-ties. Fortunately, this loss in energy efficiency can be limited byupgrading some components of the cooling system, includingthe impellers, orifice plates and gaskets, even the compressors.
In some cases, the conversion with upgrade may actually im-prove the chiller performance. Some of the strategies that canbe used to improve the efficiency of existing chillers include:• Increment of the evaporator and the condenser surface area
for more effective heat transfer.• Improvements in the compressor efficiency and control.• Enlargement of the internal refrigerant pipes for lower friction.• Ozonation of the condenser water to avoid scaling and bio-
logical contamination.
Over-sizing is another problem that may warrant the replace-ment of cooling systems. Indeed, several existing chillers have acapacity that is significantly higher than their peak-cooling loadand operate exclusively under part load conditions, with reducedefficiency and thus increased operating and maintenance costs.When the oversized chillers are more than 10 years old, it maybe cost-effective to replace them with smaller and more energyefficient ones, operating with non-CFC refrigerants.
55..44..33.. CChhiilllleerr ccoonnttrrooll iimmpprroovveemmeenntt
Before replacing an existing chiller, it is recommended to con-sider alternative cooling systems or simple operating measuresto improve its energy performance. Some common and provenalternative cooling systems are presented later on. Other mea-sures involve the use of automatic controls to:• supply chilled water at the highest temperature that meets the
cooling load,• decrease the condenser water supply temperature (for water-
cooled condensers) when the outside air wet-bulb temper-ature is reduced.
Indeed, chiller performance depends not only on the coolingload but also on the chilled water supply temperature and thecondenser water temperature. The Carnot efficiency (Eq. 5.1)shows that the COP increases when the condenser temperature(TH) is reduced or when the evaporator temperature (TC) isincreased. For typical water chillers, figure 5.2 is used to evalu-ate the improvement in the COP of a chiller when the leavingwater temperature is increased, while figure 5.3 is used to esti-mate the effect of reducing the condenser water temperature onthe COP of the system.
Figure 5.2. Effect of leaving chilled water temperature on the chiller COP
Figure 5.3. Effect of the condensing temperature on the chiller COP
EExxaammppllee 55..22: A centrifugal chiller with a capacity of 500 kWand average seasonal COP of 4.0 operates with a leavingchilled temperature of 4.5oC. Determine the cost savingsincurred by installing an automatic controller that allows theleaving water temperature to be set on average 2.5oC high-er. The number of equivalent full-load hours for the chiller is1500 per year and the electricity cost is $0.07/kWh.
SSoolluuttiioonn: Using figure 5.2, the increase in the COP for a cen-trifugal chiller due to increasing the leaving chilled water tem-perature from 4.5oC to 7.0oC is about 8%. The energy usesavings can be calculated using Eq. (5.3) with SEERe=4.0,SEERr= 4.0x1.08 =4.32, Nh,C=1500 and
•
QC=500 kW(LFC=1.0, assuming that the chiller is sized correctly):
Therefore, the energy cost saving is $970.
ENERGY AUDIT GUIDE - PART B
21
yrkWhyrhrskWEC /890,1332.41
0.41*0.1*/1500*500 =
−=∆
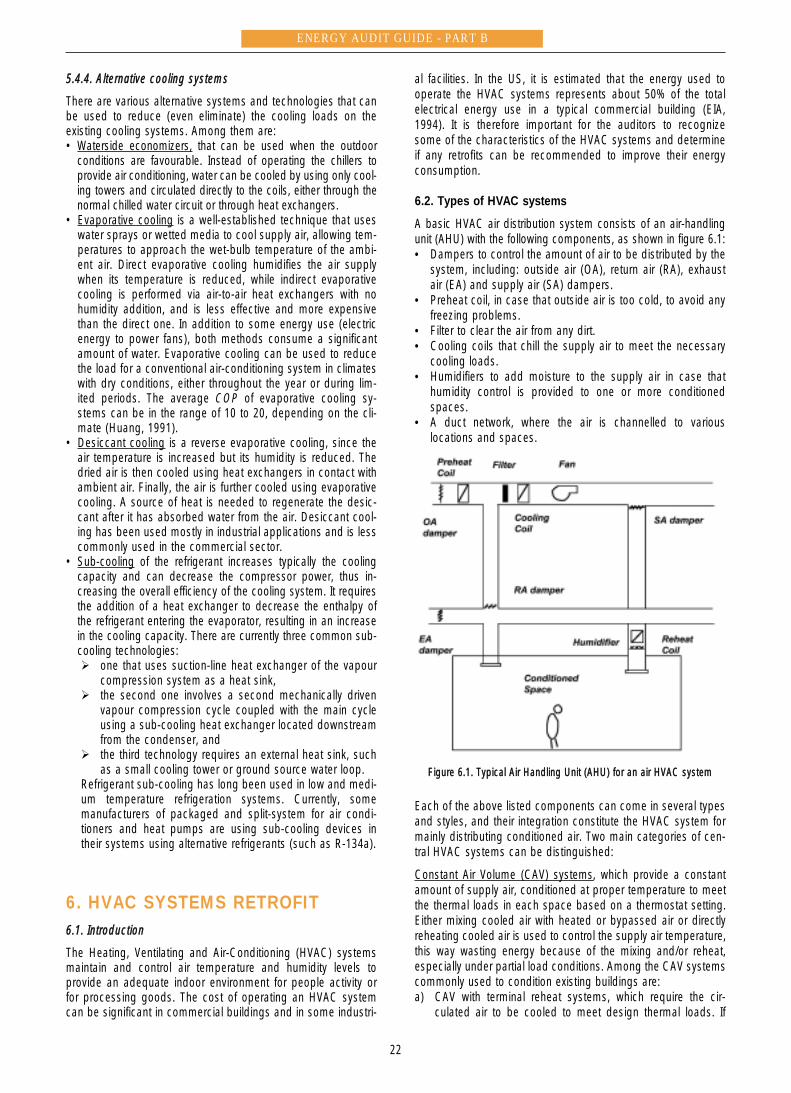
ENERGY AUDIT GUIDE - PART B
22
55..44..44.. AAlltteerrnnaattiivvee ccoooolliinngg ssyysstteemmss
There are various alternative systems and technologies that canbe used to reduce (even eliminate) the cooling loads on theexisting cooling systems. Among them are:• Waterside economizers, that can be used when the outdoor
conditions are favourable. Instead of operating the chillers toprovide air conditioning, water can be cooled by using only cool-ing towers and circulated directly to the coils, either through thenormal chilled water circuit or through heat exchangers.
• Evaporative cooling is a well-established technique that useswater sprays or wetted media to cool supply air, allowing tem-peratures to approach the wet-bulb temperature of the ambi-ent air. Direct evaporative cooling humidifies the air supplywhen its temperature is reduced, while indirect evaporativecooling is performed via air-to-air heat exchangers with nohumidity addition, and is less effective and more expensivethan the direct one. In addition to some energy use (electricenergy to power fans), both methods consume a significantamount of water. Evaporative cooling can be used to reducethe load for a conventional air-conditioning system in climateswith dry conditions, either throughout the year or during lim-ited periods. The average COP of evaporative cooling sy-stems can be in the range of 10 to 20, depending on the cli-mate (Huang, 1991).
• Desiccant cooling is a reverse evaporative cooling, since theair temperature is increased but its humidity is reduced. Thedried air is then cooled using heat exchangers in contact withambient air. Finally, the air is further cooled using evaporativecooling. A source of heat is needed to regenerate the desic-cant after it has absorbed water from the air. Desiccant cool-ing has been used mostly in industrial applications and is lesscommonly used in the commercial sector.
• Sub-cooling of the refrigerant increases typically the coolingcapacity and can decrease the compressor power, thus in-creasing the overall efficiency of the cooling system. It requiresthe addition of a heat exchanger to decrease the enthalpy ofthe refrigerant entering the evaporator, resulting in an increasein the cooling capacity. There are currently three common sub-cooling technologies: # one that uses suction-line heat exchanger of the vapour
compression system as a heat sink, # the second one involves a second mechanically driven
vapour compression cycle coupled with the main cycleusing a sub-cooling heat exchanger located downstreamfrom the condenser, and
# the third technology requires an external heat sink, suchas a small cooling tower or ground source water loop.
Refrigerant sub-cooling has long been used in low and medi-um temperature refrigeration systems. Currently, somemanufacturers of packaged and split-system for air condi-tioners and heat pumps are using sub-cooling devices intheir systems using alternative refrigerants (such as R-134a).
6. HVAC SYSTEMS RETROFIT66..11.. IInnttrroodduuccttiioonn
The Heating, Ventilating and Air-Conditioning (HVAC) systemsmaintain and control air temperature and humidity levels toprovide an adequate indoor environment for people activity orfor processing goods. The cost of operating an HVAC systemcan be significant in commercial buildings and in some industri-
al facilities. In the US, it is estimated that the energy used tooperate the HVAC systems represents about 50% of the totalelectrical energy use in a typical commercial building (EIA,1994). It is therefore important for the auditors to recognizesome of the characteristics of the HVAC systems and determineif any retrofits can be recommended to improve their energyconsumption.
6.2. Types of HVAC systems
A basic HVAC air distribution system consists of an air-handlingunit (AHU) with the following components, as shown in figure 6.1:• Dampers to control the amount of air to be distributed by the
system, including: outside air (OA), return air (RA), exhaustair (EA) and supply air (SA) dampers.
• Preheat coil, in case that outside air is too cold, to avoid anyfreezing problems.
• Filter to clear the air from any dirt.• Cooling coils that chill the supply air to meet the necessary
cooling loads.• Humidifiers to add moisture to the supply air in case that
humidity control is provided to one or more conditionedspaces.
• A duct network, where the air is channelled to variouslocations and spaces.
Figure 6.1. Typical Air Handling Unit (AHU) for an air HVAC system
Each of the above listed components can come in several typesand styles, and their integration constitute the HVAC system formainly distributing conditioned air. Two main categories of cen-tral HVAC systems can be distinguished:
Constant Air Volume (CAV) systems, which provide a constantamount of supply air, conditioned at proper temperature to meetthe thermal loads in each space based on a thermostat setting.Either mixing cooled air with heated or bypassed air or directlyreheating cooled air is used to control the supply air temperature,this way wasting energy because of the mixing and/or reheat,especially under partial load conditions. Among the CAV systemscommonly used to condition existing buildings are: a) CAV with terminal reheat systems, which require the cir-
culated air to be cooled to meet design thermal loads. If
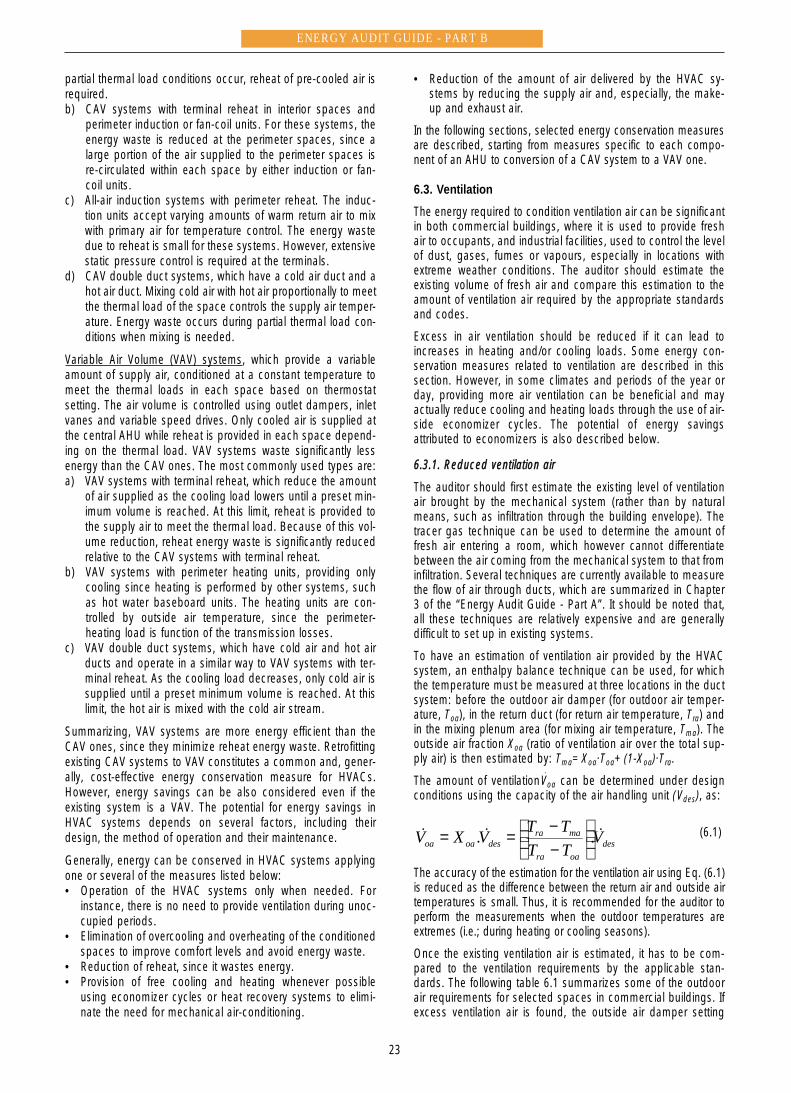
partial thermal load conditions occur, reheat of pre-cooled air isrequired.b) CAV systems with terminal reheat in interior spaces and
perimeter induction or fan-coil units. For these systems, theenergy waste is reduced at the perimeter spaces, since alarge portion of the air supplied to the perimeter spaces isre-circulated within each space by either induction or fan-coil units.
c) All-air induction systems with perimeter reheat. The induc-tion units accept varying amounts of warm return air to mixwith primary air for temperature control. The energy wastedue to reheat is small for these systems. However, extensivestatic pressure control is required at the terminals.
d) CAV double duct systems, which have a cold air duct and ahot air duct. Mixing cold air with hot air proportionally to meetthe thermal load of the space controls the supply air temper-ature. Energy waste occurs during partial thermal load con-ditions when mixing is needed.
Variable Air Volume (VAV) systems, which provide a variableamount of supply air, conditioned at a constant temperature tomeet the thermal loads in each space based on thermostatsetting. The air volume is controlled using outlet dampers, inletvanes and variable speed drives. Only cooled air is supplied atthe central AHU while reheat is provided in each space depend-ing on the thermal load. VAV systems waste significantly lessenergy than the CAV ones. The most commonly used types are: a) VAV systems with terminal reheat, which reduce the amount
of air supplied as the cooling load lowers until a preset min-imum volume is reached. At this limit, reheat is provided tothe supply air to meet the thermal load. Because of this vol-ume reduction, reheat energy waste is significantly reducedrelative to the CAV systems with terminal reheat.
b) VAV systems with perimeter heating units, providing onlycooling since heating is performed by other systems, suchas hot water baseboard units. The heating units are con-trolled by outside air temperature, since the perimeter-heating load is function of the transmission losses.
c) VAV double duct systems, which have cold air and hot airducts and operate in a similar way to VAV systems with ter-minal reheat. As the cooling load decreases, only cold air issupplied until a preset minimum volume is reached. At thislimit, the hot air is mixed with the cold air stream.
Summarizing, VAV systems are more energy efficient than theCAV ones, since they minimize reheat energy waste. Retrofittingexisting CAV systems to VAV constitutes a common and, gener-ally, cost-effective energy conservation measure for HVACs.However, energy savings can be also considered even if theexisting system is a VAV. The potential for energy savings inHVAC systems depends on several factors, including theirdesign, the method of operation and their maintenance.
Generally, energy can be conserved in HVAC systems applyingone or several of the measures listed below:• Operation of the HVAC systems only when needed. For
instance, there is no need to provide ventilation during unoc-cupied periods.
• Elimination of overcooling and overheating of the conditionedspaces to improve comfort levels and avoid energy waste.
• Reduction of reheat, since it wastes energy. • Provision of free cooling and heating whenever possible
using economizer cycles or heat recovery systems to elimi-nate the need for mechanical air-conditioning.
• Reduction of the amount of air delivered by the HVAC sy-stems by reducing the supply air and, especially, the make-up and exhaust air.
In the following sections, selected energy conservation measuresare described, starting from measures specific to each compo-nent of an AHU to conversion of a CAV system to a VAV one.
6.3. Ventilation
The energy required to condition ventilation air can be significantin both commercial buildings, where it is used to provide freshair to occupants, and industrial facilities, used to control the levelof dust, gases, fumes or vapours, especially in locations withextreme weather conditions. The auditor should estimate theexisting volume of fresh air and compare this estimation to theamount of ventilation air required by the appropriate standardsand codes.
Excess in air ventilation should be reduced if it can lead toincreases in heating and/or cooling loads. Some energy con-servation measures related to ventilation are described in thissection. However, in some climates and periods of the year orday, providing more air ventilation can be beneficial and mayactually reduce cooling and heating loads through the use of air-side economizer cycles. The potential of energy savingsattributed to economizers is also described below.
66..33..11.. RReedduucceedd vveennttiillaattiioonn aaiirr
The auditor should first estimate the existing level of ventilationair brought by the mechanical system (rather than by naturalmeans, such as infiltration through the building envelope). Thetracer gas technique can be used to determine the amount offresh air entering a room, which however cannot differentiatebetween the air coming from the mechanical system to that frominfiltration. Several techniques are currently available to measurethe flow of air through ducts, which are summarized in Chapter3 of the “Energy Audit Guide - Part A”. It should be noted that,all these techniques are relatively expensive and are generallydifficult to set up in existing systems.
To have an estimation of ventilation air provided by the HVACsystem, an enthalpy balance technique can be used, for whichthe temperature must be measured at three locations in the ductsystem: before the outdoor air damper (for outdoor air temper-ature, Toa), in the return duct (for return air temperature, Tra) andin the mixing plenum area (for mixing air temperature, Tma). Theoutside air fraction Xoa (ratio of ventilation air over the total sup-ply air) is then estimated by: Tma=Xoa·Toa+(1-Xoa)·Tra.
The amount of ventilation •
Voa can be determined under designconditions using the capacity of the air handling unit (
•
Vdes), as:
(6.1)
The accuracy of the estimation for the ventilation air using Eq. (6.1)is reduced as the difference between the return air and outside airtemperatures is small. Thus, it is recommended for the auditor toperform the measurements when the outdoor temperatures areextremes (i.e.; during heating or cooling seasons).
Once the existing ventilation air is estimated, it has to be com-pared to the ventilation requirements by the applicable stan-dards. The following table 6.1 summarizes some of the outdoorair requirements for selected spaces in commercial buildings. Ifexcess ventilation air is found, the outside air damper setting
desoara
maradesoaoa V
TTTTVXV !!! ..
−−==
ENERGY AUDIT GUIDE - PART B
23
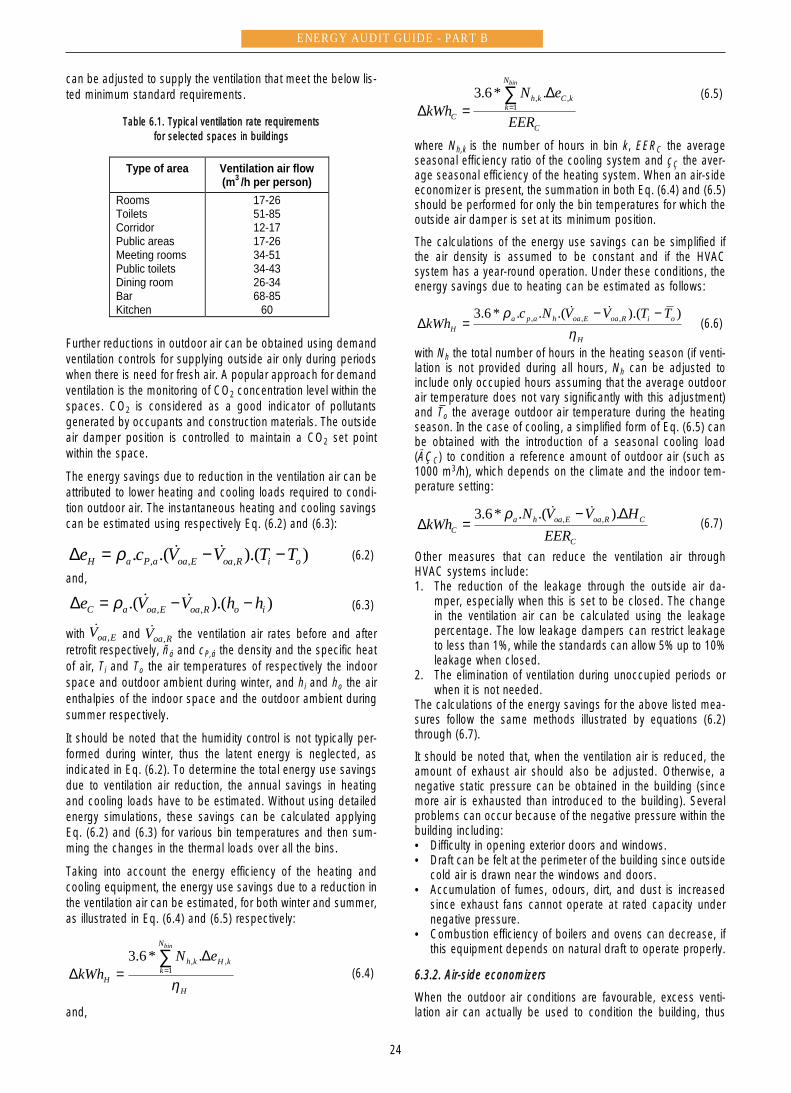
can be adjusted to supply the ventilation that meet the below lis-ted minimum standard requirements.
Table 6.1. Typical ventilation rate requirements for selected spaces in buildings
Further reductions in outdoor air can be obtained using demandventilation controls for supplying outside air only during periodswhen there is need for fresh air. A popular approach for demandventilation is the monitoring of CO2 concentration level within thespaces. CO2 is considered as a good indicator of pollutantsgenerated by occupants and construction materials. The outsideair damper position is controlled to maintain a CO2 set pointwithin the space.
The energy savings due to reduction in the ventilation air can beattributed to lower heating and cooling loads required to condi-tion outdoor air. The instantaneous heating and cooling savingscan be estimated using respectively Eq. (6.2) and (6.3):
(6.2)
and,
(6.3)
with and the ventilation air rates before and afterretrofit respectively, ñá and cP,á the density and the specific heatof air, Ti and To the air temperatures of respectively the indoorspace and outdoor ambient during winter, and hi and ho the airenthalpies of the indoor space and the outdoor ambient duringsummer respectively.
It should be noted that the humidity control is not typically per-formed during winter, thus the latent energy is neglected, asindicated in Eq. (6.2). To determine the total energy use savingsdue to ventilation air reduction, the annual savings in heatingand cooling loads have to be estimated. Without using detailedenergy simulations, these savings can be calculated applyingEq. (6.2) and (6.3) for various bin temperatures and then sum-ming the changes in the thermal loads over all the bins.
Taking into account the energy efficiency of the heating andcooling equipment, the energy use savings due to a reduction inthe ventilation air can be estimated, for both winter and summer,as illustrated in Eq. (6.4) and (6.5) respectively:
(6.4)
and,
(6.5)
where Nh,k is the number of hours in bin k, EERC the averageseasonal efficiency ratio of the cooling system and çÇ the aver-age seasonal efficiency of the heating system. When an air-sideeconomizer is present, the summation in both Eq. (6.4) and (6.5)should be performed for only the bin temperatures for which theoutside air damper is set at its minimum position.
The calculations of the energy use savings can be simplified ifthe air density is assumed to be constant and if the HVACsystem has a year-round operation. Under these conditions, theenergy savings due to heating can be estimated as follows:
(6.6)
with Nh the total number of hours in the heating season (if venti-lation is not provided during all hours, Nh can be adjusted toinclude only occupied hours assuming that the average outdoorair temperature does not vary significantly with this adjustment)and To the average outdoor air temperature during the heatingseason. In the case of cooling, a simplified form of Eq. (6.5) canbe obtained with the introduction of a seasonal cooling load(ÄÇC) to condition a reference amount of outdoor air (such as1000 m3/h), which depends on the climate and the indoor tem-perature setting:
(6.7)
Other measures that can reduce the ventilation air throughHVAC systems include:1. The reduction of the leakage through the outside air da-
mper, especially when this is set to be closed. The changein the ventilation air can be calculated using the leakagepercentage. The low leakage dampers can restrict leakageto less than 1%, while the standards can allow 5% up to 10%leakage when closed.
2. The elimination of ventilation during unoccupied periods orwhen it is not needed.
The calculations of the energy savings for the above listed mea-sures follow the same methods illustrated by equations (6.2)through (6.7).
It should be noted that, when the ventilation air is reduced, theamount of exhaust air should also be adjusted. Otherwise, anegative static pressure can be obtained in the building (sincemore air is exhausted than introduced to the building). Severalproblems can occur because of the negative pressure within thebuilding including:• Difficulty in opening exterior doors and windows.• Draft can be felt at the perimeter of the building since outside
cold air is drawn near the windows and doors.• Accumulation of fumes, odours, dirt, and dust is increased
since exhaust fans cannot operate at rated capacity undernegative pressure.
• Combustion efficiency of boilers and ovens can decrease, ifthis equipment depends on natural draft to operate properly.
66..33..22.. AAiirr--ssiiddee eeccoonnoommiizzeerrss
When the outdoor air conditions are favourable, excess venti-lation air can actually be used to condition the building, thus
C
CRoaEoahaC EER
HVVNkWh
∆−=∆
)..(.*6.3 ,,!!ρ
H
oiRoaEoahapaH
TTVVNckWh
ηρ )).(.(..*6.3 ,,, −−
=∆!!
C
N
kkCkh
C EER
eNkWh
bin
∑=
∆=∆ 1
,, .*6.3
H
N
kkHkh
H
bin
eNkWh
η
∑=
∆=∆ 1
,, .*6.3
RoaV ,!
EoaV ,!
)).(.( ,, ioRoaEoaaC hhVVe −−=∆ !!ρ
)).(.(. ,,, oiRoaEoaaPaH TTVVce −−=∆ !!ρ
Type of area Ventilation air flow(m3 /h per person)
RoomsToiletsCorridorPublic areasMeeting roomsPublic toiletsDining roomBarKitchen
17-2651-8512-1717-2634-5134-4326-3468-85
60
ENERGY AUDIT GUIDE - PART B
24
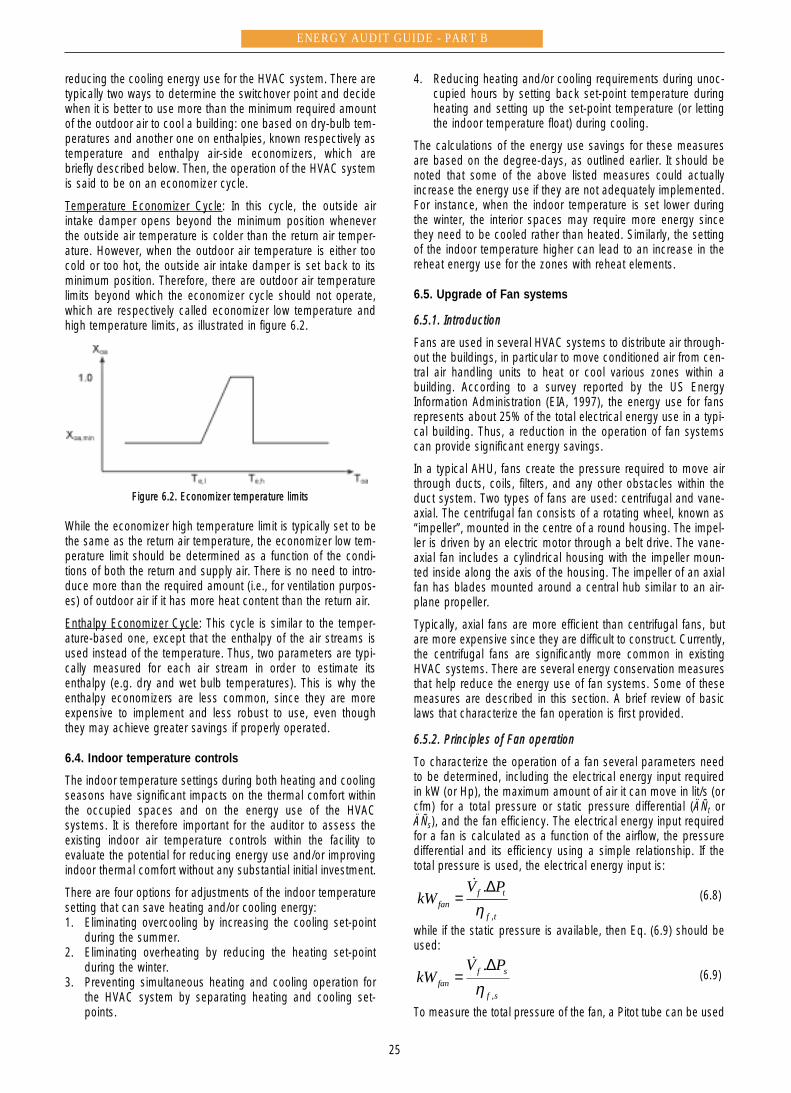
reducing the cooling energy use for the HVAC system. There aretypically two ways to determine the switchover point and decidewhen it is better to use more than the minimum required amountof the outdoor air to cool a building: one based on dry-bulb tem-peratures and another one on enthalpies, known respectively astemperature and enthalpy air-side economizers, which arebriefly described below. Then, the operation of the HVAC systemis said to be on an economizer cycle.
Temperature Economizer Cycle: In this cycle, the outside airintake damper opens beyond the minimum position wheneverthe outside air temperature is colder than the return air temper-ature. However, when the outdoor air temperature is either toocold or too hot, the outside air intake damper is set back to itsminimum position. Therefore, there are outdoor air temperaturelimits beyond which the economizer cycle should not operate,which are respectively called economizer low temperature andhigh temperature limits, as illustrated in figure 6.2.
Figure 6.2. Economizer temperature limits
While the economizer high temperature limit is typically set to bethe same as the return air temperature, the economizer low tem-perature limit should be determined as a function of the condi-tions of both the return and supply air. There is no need to intro-duce more than the required amount (i.e., for ventilation purpos-es) of outdoor air if it has more heat content than the return air.
Enthalpy Economizer Cycle: This cycle is similar to the temper-ature-based one, except that the enthalpy of the air streams isused instead of the temperature. Thus, two parameters are typi-cally measured for each air stream in order to estimate itsenthalpy (e.g. dry and wet bulb temperatures). This is why theenthalpy economizers are less common, since they are moreexpensive to implement and less robust to use, even thoughthey may achieve greater savings if properly operated.
6.4. Indoor temperature controls
The indoor temperature settings during both heating and coolingseasons have significant impacts on the thermal comfort withinthe occupied spaces and on the energy use of the HVACsystems. It is therefore important for the auditor to assess theexisting indoor air temperature controls within the facility toevaluate the potential for reducing energy use and/or improvingindoor thermal comfort without any substantial initial investment.
There are four options for adjustments of the indoor temperaturesetting that can save heating and/or cooling energy:1. Eliminating overcooling by increasing the cooling set-point
during the summer.2. Eliminating overheating by reducing the heating set-point
during the winter.3. Preventing simultaneous heating and cooling operation for
the HVAC system by separating heating and cooling set-points.
4. Reducing heating and/or cooling requirements during unoc-cupied hours by setting back set-point temperature duringheating and setting up the set-point temperature (or lettingthe indoor temperature float) during cooling.
The calculations of the energy use savings for these measuresare based on the degree-days, as outlined earlier. It should benoted that some of the above listed measures could actuallyincrease the energy use if they are not adequately implemented.For instance, when the indoor temperature is set lower duringthe winter, the interior spaces may require more energy sincethey need to be cooled rather than heated. Similarly, the settingof the indoor temperature higher can lead to an increase in thereheat energy use for the zones with reheat elements.
6.5. Upgrade of Fan systems
66..55..11.. IInnttrroodduuccttiioonn
Fans are used in several HVAC systems to distribute air through-out the buildings, in particular to move conditioned air from cen-tral air handling units to heat or cool various zones within abuilding. According to a survey reported by the US EnergyInformation Administration (EIA, 1997), the energy use for fansrepresents about 25% of the total electrical energy use in a typi-cal building. Thus, a reduction in the operation of fan systemscan provide significant energy savings.
In a typical AHU, fans create the pressure required to move airthrough ducts, coils, filters, and any other obstacles within theduct system. Two types of fans are used: centrifugal and vane-axial. The centrifugal fan consists of a rotating wheel, known as“impeller”, mounted in the centre of a round housing. The impel-ler is driven by an electric motor through a belt drive. The vane-axial fan includes a cylindrical housing with the impeller moun-ted inside along the axis of the housing. The impeller of an axialfan has blades mounted around a central hub similar to an air-plane propeller.
Typically, axial fans are more efficient than centrifugal fans, butare more expensive since they are difficult to construct. Currently,the centrifugal fans are significantly more common in existingHVAC systems. There are several energy conservation measuresthat help reduce the energy use of fan systems. Some of thesemeasures are described in this section. A brief review of basiclaws that characterize the fan operation is first provided.
66..55..22.. PPrriinncciipplleess ooff FFaann ooppeerraattiioonn
To characterize the operation of a fan several parameters needto be determined, including the electrical energy input requiredin kW (or Hp), the maximum amount of air it can move in lit/s (orcfm) for a total pressure or static pressure differential (ÄÑt orÄÑs), and the fan efficiency. The electrical energy input requiredfor a fan is calculated as a function of the airflow, the pressuredifferential and its efficiency using a simple relationship. If thetotal pressure is used, the electrical energy input is:
(6.8)
while if the static pressure is available, then Eq. (6.9) should beused:
(6.9)
To measure the total pressure of the fan, a Pitot tube can be usedsf
sffan
PVkW
,
.η
∆=
!
tf
tffan
PVkW
,
.η
∆=
!
ENERGY AUDIT GUIDE - PART B
25
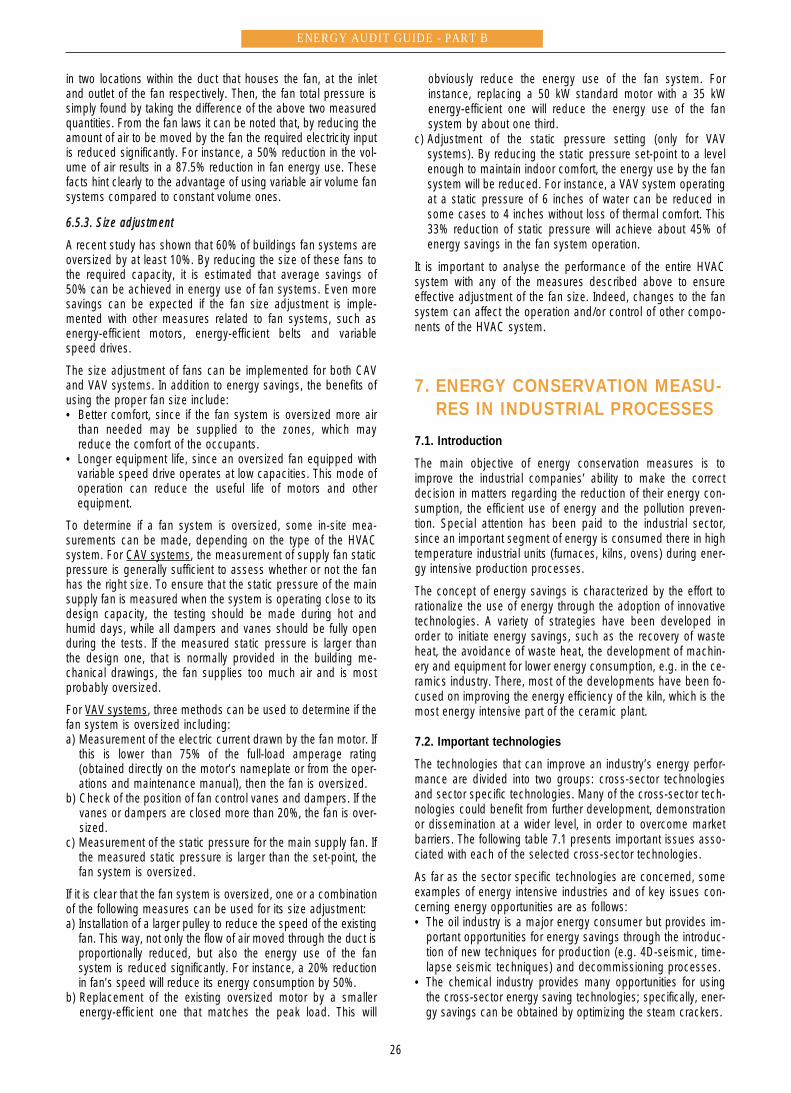
in two locations within the duct that houses the fan, at the inletand outlet of the fan respectively. Then, the fan total pressure issimply found by taking the difference of the above two measuredquantities. From the fan laws it can be noted that, by reducing theamount of air to be moved by the fan the required electricity inputis reduced significantly. For instance, a 50% reduction in the vol-ume of air results in a 87.5% reduction in fan energy use. Thesefacts hint clearly to the advantage of using variable air volume fansystems compared to constant volume ones.
66..55..33.. SSiizzee aaddjjuussttmmeenntt
A recent study has shown that 60% of buildings fan systems areoversized by at least 10%. By reducing the size of these fans tothe required capacity, it is estimated that average savings of50% can be achieved in energy use of fan systems. Even moresavings can be expected if the fan size adjustment is imple-mented with other measures related to fan systems, such asenergy-efficient motors, energy-efficient belts and variablespeed drives.
The size adjustment of fans can be implemented for both CAVand VAV systems. In addition to energy savings, the benefits ofusing the proper fan size include: • Better comfort, since if the fan system is oversized more air
than needed may be supplied to the zones, which mayreduce the comfort of the occupants.
• Longer equipment life, since an oversized fan equipped withvariable speed drive operates at low capacities. This mode ofoperation can reduce the useful life of motors and otherequipment.
To determine if a fan system is oversized, some in-site mea-surements can be made, depending on the type of the HVACsystem. For CAV systems, the measurement of supply fan staticpressure is generally sufficient to assess whether or not the fanhas the right size. To ensure that the static pressure of the mainsupply fan is measured when the system is operating close to itsdesign capacity, the testing should be made during hot andhumid days, while all dampers and vanes should be fully openduring the tests. If the measured static pressure is larger thanthe design one, that is normally provided in the building me-chanical drawings, the fan supplies too much air and is mostprobably oversized.
For VAV systems, three methods can be used to determine if thefan system is oversized including:a) Measurement of the electric current drawn by the fan motor. If
this is lower than 75% of the full-load amperage rating(obtained directly on the motor’s nameplate or from the oper-ations and maintenance manual), then the fan is oversized.
b) Check of the position of fan control vanes and dampers. If thevanes or dampers are closed more than 20%, the fan is over-sized.
c) Measurement of the static pressure for the main supply fan. Ifthe measured static pressure is larger than the set-point, thefan system is oversized.
If it is clear that the fan system is oversized, one or a combinationof the following measures can be used for its size adjustment:a) Installation of a larger pulley to reduce the speed of the existing
fan. This way, not only the flow of air moved through the duct isproportionally reduced, but also the energy use of the fansystem is reduced significantly. For instance, a 20% reductionin fan’s speed will reduce its energy consumption by 50%.
b) Replacement of the existing oversized motor by a smallerenergy-efficient one that matches the peak load. This will
obviously reduce the energy use of the fan system. Forinstance, replacing a 50 kW standard motor with a 35 kWenergy-efficient one will reduce the energy use of the fansystem by about one third.
c) Adjustment of the static pressure setting (only for VAVsystems). By reducing the static pressure set-point to a levelenough to maintain indoor comfort, the energy use by the fansystem will be reduced. For instance, a VAV system operatingat a static pressure of 6 inches of water can be reduced insome cases to 4 inches without loss of thermal comfort. This33% reduction of static pressure will achieve about 45% ofenergy savings in the fan system operation.
It is important to analyse the performance of the entire HVACsystem with any of the measures described above to ensureeffective adjustment of the fan size. Indeed, changes to the fansystem can affect the operation and/or control of other compo-nents of the HVAC system.
7. ENERGY CONSERVATION MEASU-RES IN INDUSTRIAL PROCESSES
7.1. Introduction
The main objective of energy conservation measures is toimprove the industrial companies’ ability to make the correctdecision in matters regarding the reduction of their energy con-sumption, the efficient use of energy and the pollution preven-tion. Special attention has been paid to the industrial sector,since an important segment of energy is consumed there in hightemperature industrial units (furnaces, kilns, ovens) during ener-gy intensive production processes.
The concept of energy savings is characterized by the effort torationalize the use of energy through the adoption of innovativetechnologies. A variety of strategies have been developed inorder to initiate energy savings, such as the recovery of wasteheat, the avoidance of waste heat, the development of machin-ery and equipment for lower energy consumption, e.g. in the ce-ramics industry. There, most of the developments have been fo-cused on improving the energy efficiency of the kiln, which is themost energy intensive part of the ceramic plant.
7.2. Important technologies
The technologies that can improve an industry’s energy perfor-mance are divided into two groups: cross-sector technologiesand sector specific technologies. Many of the cross-sector tech-nologies could benefit from further development, demonstrationor dissemination at a wider level, in order to overcome marketbarriers. The following table 7.1 presents important issues asso-ciated with each of the selected cross-sector technologies.
As far as the sector specific technologies are concerned, someexamples of energy intensive industries and of key issues con-cerning energy opportunities are as follows:• The oil industry is a major energy consumer but provides im-
portant opportunities for energy savings through the introduc-tion of new techniques for production (e.g. 4D-seismic, time-lapse seismic techniques) and decommissioning processes.
• The chemical industry provides many opportunities for usingthe cross-sector energy saving technologies; specifically, ener-gy savings can be obtained by optimizing the steam crackers.
ENERGY AUDIT GUIDE - PART B
26
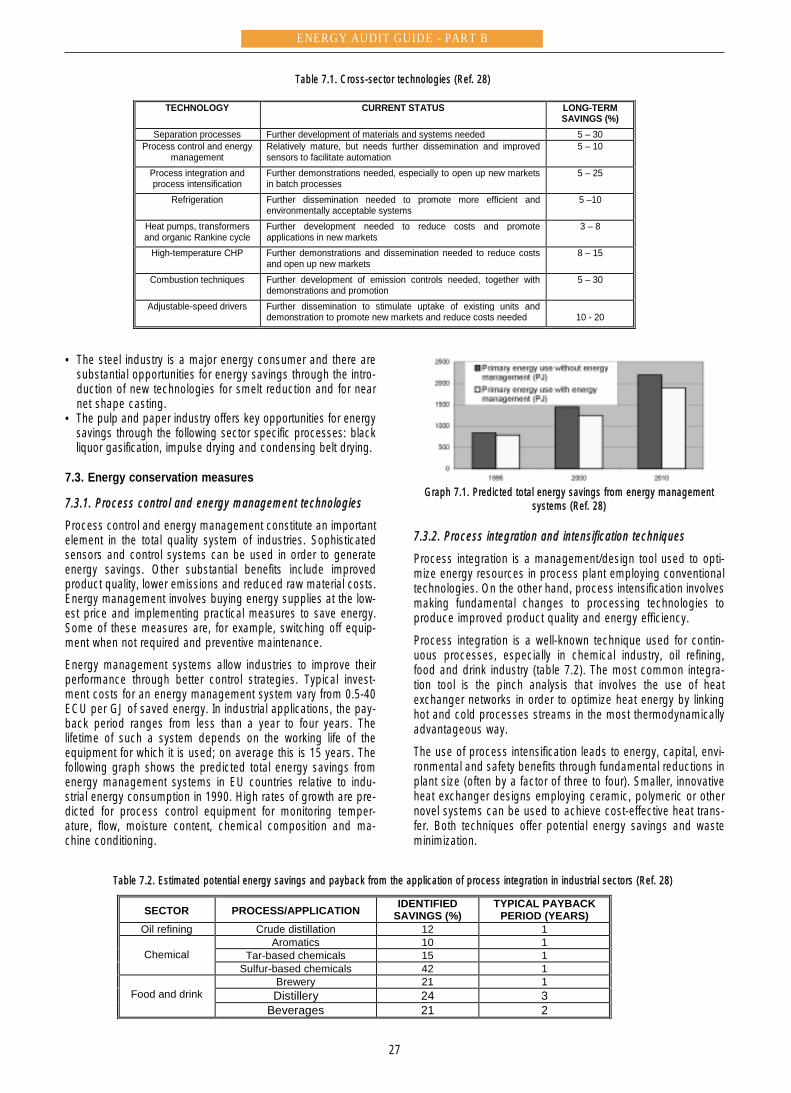
ENERGY AUDIT GUIDE - PART B
• The steel industry is a major energy consumer and there aresubstantial opportunities for energy savings through the intro-duction of new technologies for smelt reduction and for nearnet shape casting.
• The pulp and paper industry offers key opportunities for energysavings through the following sector specific processes: blackliquor gasification, impulse drying and condensing belt drying.
7.3. Energy conservation measures
77..33..11.. PPrroocceessss ccoonnttrrooll aanndd eenneerrggyy mmaannaaggeemmeenntt tteecchhnnoollooggiieess
Process control and energy management constitute an importantelement in the total quality system of industries. Sophisticatedsensors and control systems can be used in order to generateenergy savings. Other substantial benefits include improvedproduct quality, lower emissions and reduced raw material costs.Energy management involves buying energy supplies at the low-est price and implementing practical measures to save energy.Some of these measures are, for example, switching off equip-ment when not required and preventive maintenance.
Energy management systems allow industries to improve theirperformance through better control strategies. Typical invest-ment costs for an energy management system vary from 0.5-40ECU per GJ of saved energy. In industrial applications, the pay-back period ranges from less than a year to four years. Thelifetime of such a system depends on the working life of theequipment for which it is used; on average this is 15 years. Thefollowing graph shows the predicted total energy savings fromenergy management systems in EU countries relative to indu-strial energy consumption in 1990. High rates of growth are pre-dicted for process control equipment for monitoring temper-ature, flow, moisture content, chemical composition and ma-chine conditioning.
Graph 7.1. Predicted total energy savings from energy managementsystems (Ref. 28)
77..33..22.. PPrroocceessss iinntteeggrraattiioonn aanndd iinntteennssiiffiiccaattiioonn tteecchhnniiqquueess
Process integration is a management/design tool used to opti-mize energy resources in process plant employing conventionaltechnologies. On the other hand, process intensification involvesmaking fundamental changes to processing technologies toproduce improved product quality and energy efficiency.
Process integration is a well-known technique used for contin-uous processes, especially in chemical industry, oil refining,food and drink industry (table 7.2). The most common integra-tion tool is the pinch analysis that involves the use of heatexchanger networks in order to optimize heat energy by linkinghot and cold processes streams in the most thermodynamicallyadvantageous way.
The use of process intensification leads to energy, capital, envi-ronmental and safety benefits through fundamental reductions inplant size (often by a factor of three to four). Smaller, innovativeheat exchanger designs employing ceramic, polymeric or othernovel systems can be used to achieve cost-effective heat trans-fer. Both techniques offer potential energy savings and wasteminimization.
TECHNOLOGY CURRENT STATUS LONG-TERMSAVINGS (%)
Separation processes Further development of materials and systems needed 5 – 30Process control and energy
managementRelatively mature, but needs further dissemination and improvedsensors to facilitate automation
5 – 10
Process integration andprocess intensification
Further demonstrations needed, especially to open up new marketsin batch processes
5 – 25
Refrigeration Further dissemination needed to promote more efficient andenvironmentally acceptable systems
5 –10
Heat pumps, transformersand organic Rankine cycle
Further development needed to reduce costs and promoteapplications in new markets
3 – 8
High-temperature CHP Further demonstrations and dissemination needed to reduce costsand open up new markets
8 – 15
Combustion techniques Further development of emission controls needed, together withdemonstrations and promotion
5 – 30
Adjustable-speed drivers Further dissemination to stimulate uptake of existing units anddemonstration to promote new markets and reduce costs needed 10 - 20
Table 7.1. Cross-sector technologies (Ref. 28)
27
SECTOR PROCESS/APPLICATION IDENTIFIEDSAVINGS (%)
TYPICAL PAYBACKPERIOD (YEARS)
Oil refining Crude distillation 12 1Aromatics 10 1
Tar-based chemicals 15 1ChemicalSulfur-based chemicals 42 1
Brewery 21 1Distillery 24 3Food and drink
Beverages 21 2
Table 7.2. Estimated potential energy savings and payback from the application of process integration in industrial sectors (Ref. 28)
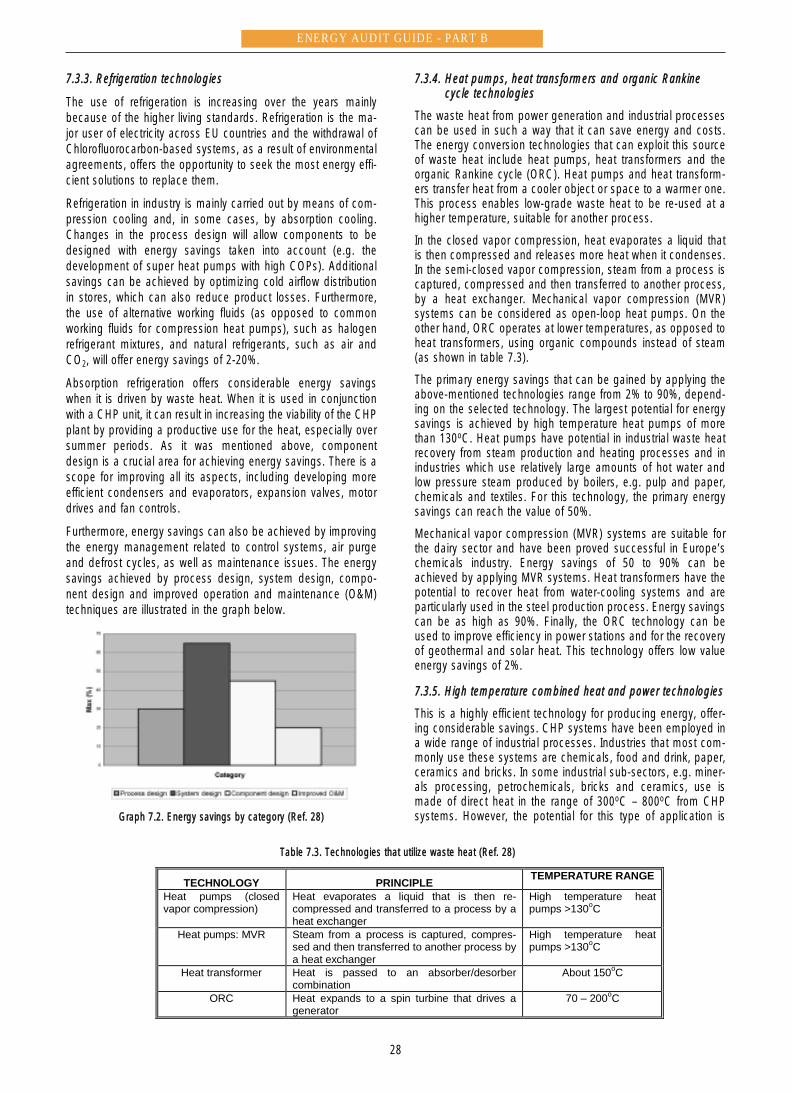
ENERGY AUDIT GUIDE - PART B
TECHNOLOGY PRINCIPLE TEMPERATURE RANGE
Heat pumps (closedvapor compression)
Heat evaporates a liquid that is then re-compressed and transferred to a process by aheat exchanger
High temperature heatpumps >130oC
Heat pumps: MVR Steam from a process is captured, compres-sed and then transferred to another process bya heat exchanger
High temperature heatpumps >130oC
Heat transformer Heat is passed to an absorber/desorbercombination
About 150oC
ORC Heat expands to a spin turbine that drives agenerator
70 – 200oC
Table 7.3. Technologies that utilize waste heat (Ref. 28)
77..33..33.. RReeffrriiggeerraattiioonn tteecchhnnoollooggiieess
The use of refrigeration is increasing over the years mainlybecause of the higher living standards. Refrigeration is the ma-jor user of electricity across EU countries and the withdrawal ofChlorofluorocarbon-based systems, as a result of environmentalagreements, offers the opportunity to seek the most energy effi-cient solutions to replace them.
Refrigeration in industry is mainly carried out by means of com-pression cooling and, in some cases, by absorption cooling.Changes in the process design will allow components to bedesigned with energy savings taken into account (e.g. thedevelopment of super heat pumps with high COPs). Additionalsavings can be achieved by optimizing cold airflow distributionin stores, which can also reduce product losses. Furthermore,the use of alternative working fluids (as opposed to commonworking fluids for compression heat pumps), such as halogenrefrigerant mixtures, and natural refrigerants, such as air andCO2, will offer energy savings of 2-20%.
Absorption refrigeration offers considerable energy savingswhen it is driven by waste heat. When it is used in conjunctionwith a CHP unit, it can result in increasing the viability of the CHPplant by providing a productive use for the heat, especially oversummer periods. As it was mentioned above, componentdesign is a crucial area for achieving energy savings. There is ascope for improving all its aspects, including developing moreefficient condensers and evaporators, expansion valves, motordrives and fan controls.
Furthermore, energy savings can also be achieved by improvingthe energy management related to control systems, air purgeand defrost cycles, as well as maintenance issues. The energysavings achieved by process design, system design, compo-nent design and improved operation and maintenance (O&M)techniques are illustrated in the graph below.
Graph 7.2. Energy savings by category (Ref. 28)
77..33..44.. HHeeaatt ppuummppss,, hheeaatt ttrraannssffoorrmmeerrss aanndd oorrggaanniicc RRaannkkiinneeccyyccllee tteecchhnnoollooggiieess
The waste heat from power generation and industrial processescan be used in such a way that it can save energy and costs.The energy conversion technologies that can exploit this sourceof waste heat include heat pumps, heat transformers and theorganic Rankine cycle (ORC). Heat pumps and heat transform-ers transfer heat from a cooler object or space to a warmer one.This process enables low-grade waste heat to be re-used at ahigher temperature, suitable for another process.
In the closed vapor compression, heat evaporates a liquid thatis then compressed and releases more heat when it condenses.In the semi-closed vapor compression, steam from a process iscaptured, compressed and then transferred to another process,by a heat exchanger. Mechanical vapor compression (MVR)systems can be considered as open-loop heat pumps. On theother hand, ORC operates at lower temperatures, as opposed toheat transformers, using organic compounds instead of steam(as shown in table 7.3).
The primary energy savings that can be gained by applying theabove-mentioned technologies range from 2% to 90%, depend-ing on the selected technology. The largest potential for energysavings is achieved by high temperature heat pumps of morethan 130oC. Heat pumps have potential in industrial waste heatrecovery from steam production and heating processes and inindustries which use relatively large amounts of hot water andlow pressure steam produced by boilers, e.g. pulp and paper,chemicals and textiles. For this technology, the primary energysavings can reach the value of 50%.
Mechanical vapor compression (MVR) systems are suitable forthe dairy sector and have been proved successful in Europe’schemicals industry. Energy savings of 50 to 90% can beachieved by applying MVR systems. Heat transformers have thepotential to recover heat from water-cooling systems and areparticularly used in the steel production process. Energy savingscan be as high as 90%. Finally, the ORC technology can beused to improve efficiency in power stations and for the recoveryof geothermal and solar heat. This technology offers low valueenergy savings of 2%.
77..33..55.. HHiigghh tteemmppeerraattuurree ccoommbbiinneedd hheeaatt aanndd ppoowweerr tteecchhnnoollooggiieess
This is a highly efficient technology for producing energy, offer-ing considerable savings. CHP systems have been employed ina wide range of industrial processes. Industries that most com-monly use these systems are chemicals, food and drink, paper,ceramics and bricks. In some industrial sub-sectors, e.g. miner-als processing, petrochemicals, bricks and ceramics, use ismade of direct heat in the range of 300oC – 800oC from CHPsystems. However, the potential for this type of application is
28
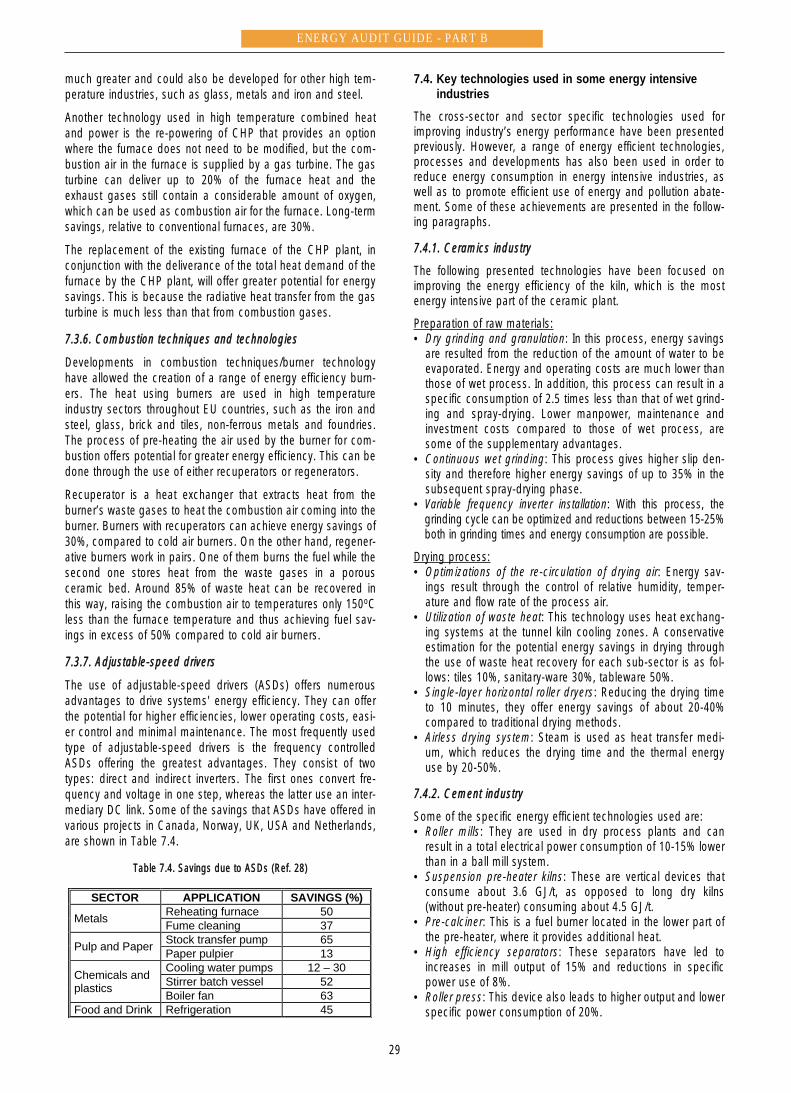
ENERGY AUDIT GUIDE - PART B
much greater and could also be developed for other high tem-perature industries, such as glass, metals and iron and steel.
Another technology used in high temperature combined heatand power is the re-powering of CHP that provides an optionwhere the furnace does not need to be modified, but the com-bustion air in the furnace is supplied by a gas turbine. The gasturbine can deliver up to 20% of the furnace heat and theexhaust gases still contain a considerable amount of oxygen,which can be used as combustion air for the furnace. Long-termsavings, relative to conventional furnaces, are 30%.
The replacement of the existing furnace of the CHP plant, inconjunction with the deliverance of the total heat demand of thefurnace by the CHP plant, will offer greater potential for energysavings. This is because the radiative heat transfer from the gasturbine is much less than that from combustion gases.
77..33..66.. CCoommbbuussttiioonn tteecchhnniiqquueess aanndd tteecchhnnoollooggiieess
Developments in combustion techniques/burner technologyhave allowed the creation of a range of energy efficiency burn-ers. The heat using burners are used in high temperatureindustry sectors throughout EU countries, such as the iron andsteel, glass, brick and tiles, non-ferrous metals and foundries.The process of pre-heating the air used by the burner for com-bustion offers potential for greater energy efficiency. This can bedone through the use of either recuperators or regenerators.
Recuperator is a heat exchanger that extracts heat from theburner’s waste gases to heat the combustion air coming into theburner. Burners with recuperators can achieve energy savings of30%, compared to cold air burners. On the other hand, regener-ative burners work in pairs. One of them burns the fuel while thesecond one stores heat from the waste gases in a porousceramic bed. Around 85% of waste heat can be recovered inthis way, raising the combustion air to temperatures only 150oCless than the furnace temperature and thus achieving fuel sav-ings in excess of 50% compared to cold air burners.
77..33..77.. AAddjjuussttaabbllee--ssppeeeedd ddrriivveerrss
The use of adjustable-speed drivers (ASDs) offers numerousadvantages to drive systems' energy efficiency. They can offerthe potential for higher efficiencies, lower operating costs, easi-er control and minimal maintenance. The most frequently usedtype of adjustable-speed drivers is the frequency controlledASDs offering the greatest advantages. They consist of twotypes: direct and indirect inverters. The first ones convert fre-quency and voltage in one step, whereas the latter use an inter-mediary DC link. Some of the savings that ASDs have offered invarious projects in Canada, Norway, UK, USA and Netherlands,are shown in Table 7.4.
Table 7.4. Savings due to ASDs (Ref. 28)
7.4. Key technologies used in some energy intensiveindustries
The cross-sector and sector specific technologies used forimproving industry’s energy performance have been presentedpreviously. However, a range of energy efficient technologies,processes and developments has also been used in order toreduce energy consumption in energy intensive industries, aswell as to promote efficient use of energy and pollution abate-ment. Some of these achievements are presented in the follow-ing paragraphs.
77..44..11.. CCeerraammiiccss iinndduussttrryy
The following presented technologies have been focused onimproving the energy efficiency of the kiln, which is the mostenergy intensive part of the ceramic plant.
Preparation of raw materials:• Dry grinding and granulation: In this process, energy savings
are resulted from the reduction of the amount of water to beevaporated. Energy and operating costs are much lower thanthose of wet process. In addition, this process can result in aspecific consumption of 2.5 times less than that of wet grind-ing and spray-drying. Lower manpower, maintenance andinvestment costs compared to those of wet process, aresome of the supplementary advantages.
• Continuous wet grinding: This process gives higher slip den-sity and therefore higher energy savings of up to 35% in thesubsequent spray-drying phase.
• Variable frequency inverter installation: With this process, thegrinding cycle can be optimized and reductions between 15-25%both in grinding times and energy consumption are possible.
Drying process:• Optimizations of the re-circulation of drying air: Energy sav-
ings result through the control of relative humidity, temper-ature and flow rate of the process air.
• Utilization of waste heat: This technology uses heat exchang-ing systems at the tunnel kiln cooling zones. A conservativeestimation for the potential energy savings in drying throughthe use of waste heat recovery for each sub-sector is as fol-lows: tiles 10%, sanitary-ware 30%, tableware 50%.
• Single-layer horizontal roller dryers: Reducing the drying timeto 10 minutes, they offer energy savings of about 20-40%compared to traditional drying methods.
• Airless drying system: Steam is used as heat transfer medi-um, which reduces the drying time and the thermal energyuse by 20-50%.
77..44..22.. CCeemmeenntt iinndduussttrryy
Some of the specific energy efficient technologies used are:• Roller mills: They are used in dry process plants and can
result in a total electrical power consumption of 10-15% lowerthan in a ball mill system.
• Suspension pre-heater kilns: These are vertical devices thatconsume about 3.6 GJ/t, as opposed to long dry kilns(without pre-heater) consuming about 4.5 GJ/t.
• Pre-calciner: This is a fuel burner located in the lower part ofthe pre-heater, where it provides additional heat.
• High efficiency separators: These separators have led toincreases in mill output of 15% and reductions in specificpower use of 8%.
• Roller press: This device also leads to higher output and lowerspecific power consumption of 20%.
SECTOR APPLICATION SAVINGS (%)Reheating furnace 50Metals Fume cleaning 37Stock transfer pump 65Pulp and Paper Paper pulpier 13Cooling water pumps 12 – 30Stirrer batch vessel 52Chemicals and
plastics Boiler fan 63Food and Drink Refrigeration 45
29
• Variable speed fan drivers: These fan drivers lead to signifi-cant electrical power savings by controlling the air or gas flow,generated by large fans.
• High efficiency electric motors: They give a payback period ofabout 2 years.
77..44..33.. IIrroonn aanndd sstteeeell iinndduussttrryy
Iron and steel plants require large amounts of heat and mechan-ical work for their operation. In order to reduce the overall ener-gy consumption, the energy that flows in the plant must be wellknown and understood. Some of the energy efficient technolo-gies used are the following:• Thin scrap casting: It offers energy savings of more than 1-5
GJ/t over the conventional route and since flat products rep-resent about 60% of output in the EU, significant opportunitiesare available.
• Energy optimizing process: It combines simple scrap pre-heating utilizing off gases, together with oxygen and coalinjection into a liquid iron bath. This process offers consider-able savings by incorporating scrap pre-heating. Additionally,it offers environmental benefits in terms of reduced electricityand reduced greenhouse gases.
• Corex plant: This process involves lump ore reduction or sin-ter to 90% iron. It is estimated that energy savings are 10%-15% that of the conventional blast furnace route.
• Top gas pressure recovery turbine: This is one of the mosteffective energy saving technologies allowing for the high top
pressure operation of blast furnaces (up to 2.5 atmospheres)to be reduced to that of the gas boiler with the generation ofelectricity.
• Hot stove waste heat recovery: Through this process, theresidual sensible heat comes from the hot stove gases andused for pre-heating both combustion air and flue gas.Energy savings are of 0.08 GJ/tpi.
• High temperature scrap pre-heating: The low temperaturepre-heaters have caused environmental problems in Europeand are now being replaced by high temperature pre-heatersallowing for energy savings between 0.1-0.3 GJ/tcs.
• Secondary refining via ladle metallurgy: It uses a high-powered electric furnace giving energy savings equivalent to0.05 GJ/tcs.
• Self recuperative and regenerative burners: They have a sig-nificant effect on energy use in re-heating furnaces and offerpotential savings in the region of 65% representing between0.3-0.7 GJ/tcs.
• Hot direct rolling: It involves transferring of hot semi-finishedproducts to a hot mill without undertaking intermediate re-heating. Potential energy savings can be up to 2GJ/tcs.
• Hot charging: It involves transferring the stock as rapidly aspossible to the re-heating furnace and minimizing the cool-down period. Energy savings of 0.5-1.2 GJ/tcs are possible.
• Combined cycle power plant: It gives higher energy efficiencyand results in energy savings in the range of 0.5 GJ/tcs.
ENERGY AUDIT GUIDE - PART B
30
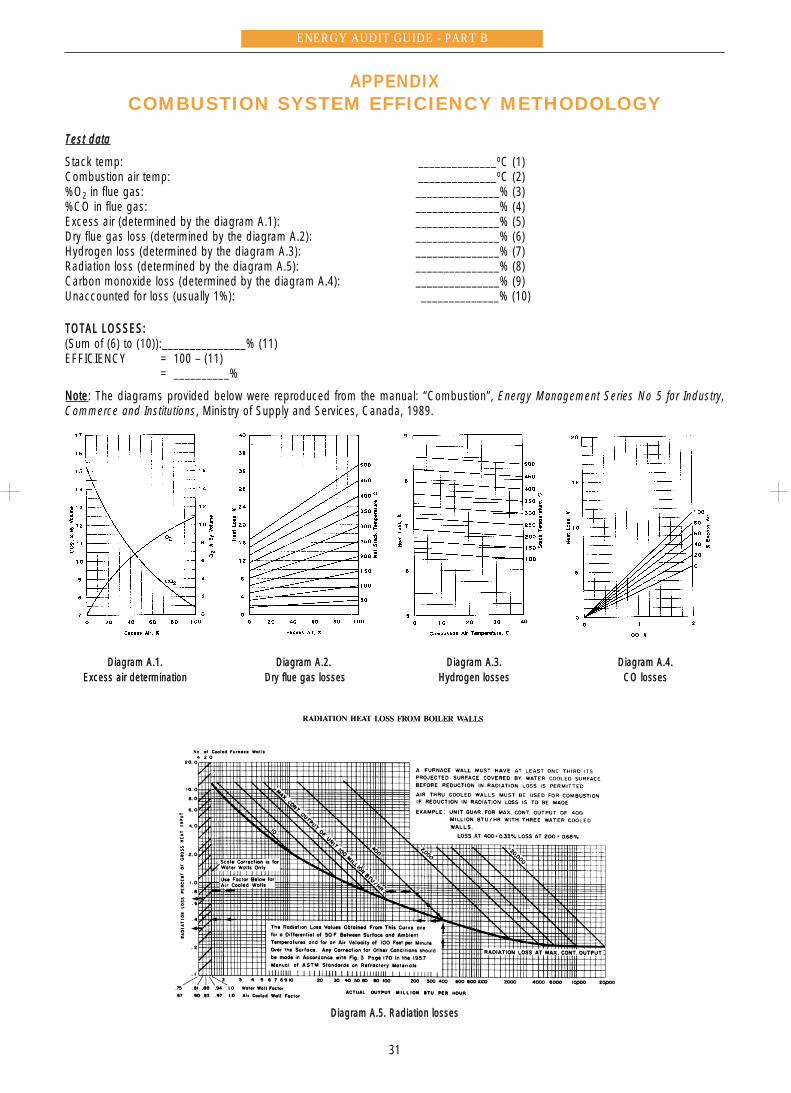
APPENDIXCOMBUSTION SYSTEM EFFICIENCY METHODOLOGY
TTeesstt ddaattaa
Stack temp: ______________oC (1)Combustion air temp: ______________oC (2)%O2 in flue gas: _______________% (3)%CO in flue gas: _______________% (4)Excess air (determined by the diagram A.1): _______________% (5)Dry flue gas loss (determined by the diagram A.2): _______________% (6)Hydrogen loss (determined by the diagram A.3): _______________% (7)Radiation loss (determined by the diagram A.5): _______________% (8)Carbon monoxide loss (determined by the diagram A.4): _______________% (9)Unaccounted for loss (usually 1%): ______________% (10)
TTOOTTAALL LLOOSSSSEESS::(Sum of (6) to (10)):_______________% (11)EFFICIENCY = 100 – (11)
= __________%
NNoottee: The diagrams provided below were reproduced from the manual: “Combustion”, Energy Management Series No 5 for Industry,Commerce and Institutions, Ministry of Supply and Services, Canada, 1989.
Diagram A.1. Diagram A.2. Diagram A.3. Diagram A.4.Excess air determination Dry flue gas losses Hydrogen losses CO losses
Diagram A.5. Radiation losses
ENERGY AUDIT GUIDE - PART B
31

ENERGY AUDIT GUIDE - PART B
32
REFERENCES
PPaappeerrss1) Kelly, J., and Fels, M., 1986, An assessment of Prism’s reli-
ability for commercial buildings, Princeton University, 13p.2) Rabl, A., 1988, Parameter estimation in buildings: methods
for dynamic analysis of measured energy use, PrincetonUniversity, February, Journal of solar energy engineering, 14p.
3) Erbs, D.G., S. A. Klein, and W. Beckman, 1983, Estimationof degree-days and ambient temperature bin data frommonthly-average temperatures, ASHRAE Journal, June, pp.60-65.
4) Verderber, R. R., O. C. Morse, and Alling, W. R.. 1993, Har-monics From Compact Fluorescent Lamps. IEEE Transa-ctions on Industry Applications 29(3):670-674.
5) Maîtrise de l’énergie dans les Industries Mécaniques, Jour-née technique ATEE, 1er Octobre 1996, Cnit Paris laDéfense
BBooookkss aanndd RReeppoorrttss6) Baron, S., 1978, Manual of Energy Saving in Existing
Buildings and Plants: Volume 1 and Volume 2.7) Thurmann, A., 1983, Handbook of Energy Audits, Prentice-
Hall Inc.8) Kennedy, W., & Turner, W., 1984, Energy Management,
Prentice-Hall Inc.9) Ottaviano, V., 1983, Energy Management, Prentice-Hall Inc.
10) Météoclim, 93, Recueil des Degrés-Jours calculés par leCostic., Sedit editions
11) Pilavachi, P., 1993, Energy efficiency in process technology,Elsevier science, 1280p.
12) Guide de diagnostic thermique, 1987, de l’ADEME, EditionsEyrolles.
13) Extrait du Guide de Diagnostic Thermique, 1986, Stagepratique du diagnostic thermique, AFME, Paris.
14) AFME, 1988, Energy audit in Existing Buildings, Landmarks,Plan Construction et Architecture, Bâtiment économe, Age-nce Française pour la maîtrise de l’énergie,84 p.
15) ASHRAE standard, 1988, Energy Conservation in ExistingFacilities - Industrial, ASHRAE Inc., Altanta, GA.
16) ASHRAE standard, 1988, Energy Conservation in ExistingFacilities - Commercial, ASHRAE Inc., Atlanta, GA.
17) Combustion, Energy Management Series for industry, com-merce and institutions, Vol. 5, Ministry of Supply andServices - Canada 1989.
18) Heating, Ventilation and Air-conditioning, Energy Mana-gement Series for industry, commerce and institutions, Vol.10, Ministry of Supply and Services - Canada.
19) Guide for Harmonic Control and Reactive Compensation ofStatic Power Converters, IEEE 519-1992. Piscataway, NJ:Institute of Electrical and Electronics Engineers.
20) Power Quality-Lighting Answers. Newsletter by the NationalLighting Product Information Program – NPLIP, 1995, 2(2), p. 5.
21) Malamatenios, Ch., 1997, Energy Conservation on HVACsystems Guide, Produced in the frame of a Programmefunded by ESF, CRES editions.
22) “Air-conditioning system VRV - the only solution towardsenergy conservation”, by KLIMATAIR LTD.
23) “BAS/Microelectronic Controls Specification Manual”, byTRANE LTD.
24) The Economic use of refrigeration plant, Fuel Efficiencybooklet 11, Energy Efficiency Office.
25) Controls and Energy Savings, Fuel Efficiency Booklet 10,Energy Efficiency Office.
26) Energy efficiency in industry, 1988, Commission of theEuropean communities, edited by J.Srichis, Elsevier AppliedScience, 270 p.
27) Improved Energy Efficiency in the Process Industry, Com-mission of the European Communities 1990, Proceedings ofa European Seminar Brussels, 23 and 24 October 1990.
28) Energy Efficient Technologies in High TemperatureIndustries, by European Commission – Directorate Generalfor Energy (DG XVII), 1998.