Physical Chemistry Chemical Physics - Welcome to UC Santa Barbara
S1
Electronic Supporting Information
Endogenous Exosome Labelling with an Amphiphilic NIR-Fluorescent Probe
Marco P. Monopoli,* Andrea Zendrini, Dan Wu, Shane Cheung, Gonzalo Sampedro,
Brendan Ffrench, John Nolan, Olga Piskareva, Raymond L. Stalings, Serena Ducoli
Paolo Bergese, Donal F. O’Shea*
Table of Contents
Methods S1
Fig. S1 S7
Fig. S2 S8
Fig. S3 S8
Fig. S4 S9
Fig. S5 S10
Fig. S6 S10
Fig S7 S11
Fig S8 S12
Fig S9 S13
Fig S10 S14
Fig S11 S15
Movie S1 and S2 legends S15
References S15
Electronic Supplementary Material (ESI) for ChemComm.This journal is © The Royal Society of Chemistry 2018
S2
Methods
Synthesis
NIR-AZA probe 1 was synthesized following previously reported procedure.1
Cell culture
KellyCis83cells were grown in complete RPMI 1640 medium (supplemented with 10%
fetal bovine serum (FBS), 1% Penicillin/Streptomycin or 1% Gentamicin and 1%
Glutamine, all purchased from Gibco), at 37 °C, 5% CO2.
Endogenous exosome labelling with NIR-AZA 1.
KellyCis83 cells were grown in complete RPMI 1640 medium until 70-80% confluence
was reached, and washed thrice with sterile PBS. Cells were incubated for 2 h with 10
ml of staining medium (RPMI complete medium added with NIR-AZA 1, 5 μM) and
then rinsed three times with sterile PBS. Finally, 10 ml of serum free medium was
added to each flask and exosomes were purified following 24 h incubation at 37 °C,
5% CO2.
Unstained exosome harvest
KellyCis83 cells were grown in complete RPMI 1640 medium until 70-80% confluence
was reached. Complete medium was removed and cells were washed thrice with sterile
PBS. Cells were then added with 10 ml of Serum Free RPMI 1640 (supplemented with
1% penicillin/streptomycin or 1% gentamycin and 1% glutamine, all purchased from
Gibco) and exosome were purified after 24 h of incubation.
Exosome isolation
Both NIR-exosomes and unlabelled exosomes were purified from cell-conditioned
serum free medium using several differential centrifugation steps: 800 g x 30 minutes
(to pellet larger EVs such as apoptotic bodies and cell debris) and 16,000 g x 45 minutes
to pellet large EVs (microvesicles). The remaining supernatant containing smaller EVs
(exosomes) were then concentrated using centrifugal filters (Amicon Ultra-15 with a
MWCO of 100 kDa), following manufacturer’s instructions. Exosomes were pelleted
by ultracentrifugation at 100,000 g x 2 h.
S3
Exosome Nanoparticle Tracking Analysis
NTA was performed using a Malvern Nanosight NS300 equipped with a blue laser and
a quartz chamber for sample injection (O-Ring top plate model). Each exosome sample
was diluted in sterile, ultrapure grade water and measured for 60 sec. Measurement
parameters were set using 100 nm polystyrene-latex beads as standards and kept
constant between samples; dilution factor was tuned in order to keep a particle number
per frame ~ 30, according to NS300 standard operational procedures, and varied
between 1:100 and 1:500.
Exosome purity and titration through colloidal gold nanoplasmonics
Exosome purity and concentration were assessed using a test based on colloidal gold
nanoplasmonics (CONAN assay) (Fig S3A, B) as previously reported.2 Exosomes and
NIR-exosomes were resuspended in sterile PBS, diluted 1:100 with MilliQwater and
analyzed using a test based on colloidal gold, CONAN assay (Fig S3A, B). The assay
exploits three aspects of gold nanoparticles (AuNPs) - nanoplasmonics,
nanoparticles/lipid membrane interaction and protein corona, to assess purity and
concentration of exosome samples. In CONAN assay, the exosome purity and
concentration are linked with the aggregation state of AuNPs in solution, which is
expressed through a numerical value called Aggregation Index (AI).
Exosome biochemical analysis
For biochemical analysis, NIR-exosomes and unlabelled exosomes were resuspended
in 50 μl of 100 mM Tris, 150 mM NaCl, 1 mM EDTA supplemented with 1:1000
protease inhibitor cocktail (P.I.). 10 μl of loading buffer 6x were added and samples
were boiled 5 min at 95°C. Twenty μl of samples were electrophoresed (120V x 90
min) in sodium dodecyl sulfate – polyacrylamide gel electrophoresis (SDS-PAGE).
Proteins were then transferred on a PVDF membrane (100V x 60 min), which was
incubated 45 min at 37°C in PBS + tween 0.05% + fat-free milk 5%. The membrane
was then analyzed by Western Blot (WB), using the following antibodies: mouse rabbit
α GM130 1:1000 (Origene), mouse α TSG101 1:500 (Santa Cruz Biotechnology),
mouse α Annexin-V 1:500 (Santa Cruz Biotechnology), mouse α CD81 1:500 (Santa
Cruz Biotechnology). PVDF membrane was incubated under mild agitation with
primary antibodies for 90 min, washed three times with PBS and then incubated for 60
S4
min with HRP-conjugated secondary antibodies (provided by Bethyl Laboratories),
diluted 1:10000 prior to use. Both primary and secondary antibodies were diluted into
PBS + tween 0.05% + fat-free milk 1%.
Exosome fluorimeter analysis
To check fluorescence after NIR-AZA 1 loading, similar amounts (between 1.5 and 2.0
x 1010 particles/ml, according to NTA) NIR-exosomes and unlabelled exosomes were
re-suspended in 200 μl of sterile PBS and analyzed with a Jasco UV-Vis-NIR
fluorometer. Samples were measured in quartz microcuvettes (Perkin-Elmer, optical
path length: 10 mm, chamber width: 1 mm); fluorophore was excited at λ =680 nm and
fluorescence was collected between λ=690 nm and λ=900 nm.
Exosome atomic force microscopy
Exosomes and NIR-exosomes samples re-suspended in sterile PBS were diluted 1:10
in milliQ water and 7-10 μl were spotted on freshly cleaved mica substrates and let dry
at room temperature in a Petri dish. Mica sheets were then analyzed with a NaioAFM
(Nanosurf, Liestal, Switzerland) atomic force microscope, equipped with MultiGD-G
probes (BudgetSensors, Sofia, Bulgaria) and run in dynamic mode. Scanning
parameters were tuned according to instrument and probes’ manufacturers. Images
were processed using WSxM 5.03 software.
Exosome flow cytometry analysis
NIR-Exosomes and unlabelled exosomes were diluted into sterile-filtered PBS for
analysis with a BD FACSCanto II flow cytometer (BD Biosciences, Franklin Lake,
New Jersey, U.S). For stability studies NIR-Exosomes in PBS with 10% FBS added
were incubated at 37 °C and analyzed at time points of 1h, 6h and 24h. Forward scatter
threshold was set to its minimum value. EV flow rate was set on slow; illumination was
provided by a standard 635 nm red laser and fluorescence was collected through a APC-
Cy7-A filter. Data were processed with FACSDiva software. Downstream of
acquisition, data was analysed in Summit 5.2 software. Overlays and boxplots were
generated in R using pre-quantified data exported from Summit 5.2.
Live cell fluorescence microscopy
S5
KellyCis83 cells were cultured in 8-well plates (μ-slide 8-well plates, Ibidi,
Martinsried, Germany) suitable for live imaging, until 60% confluence was reached.
NIR-AZA 1 was then added to each well (final concentration 5 μM) and its uptake was
followed for 30 minutes on an Olympus IX73 epi-fluorescent wide field microscope
fitted with an Andor iXon Ultra 888 EMCCD, using a 100x/ 1.40 oil PlanApo objective
(Olympus Corporation, Shinjuku, Tokyo, Japan) controlled by MetaMorph (v7.8).
Fluorescence illumination was provided by a Lumencor Spectra X light engine
containing a solid state light source, and a 640 nm excitation filter. NIR fluorescence
emission was collected using a 705 nm emission filter. Images in the NIR channel were
then acquired using 75 ms exposure, 1000 x gain, and 60% laser power.
Microvesicle labelling with NIR-AZA 1.
KellyCis83 cells were grown in complete RPMI 1640 medium until 70-80% confluence
was reached, and washed three times with sterile PBS. Cells were incubated for 2 h
with 10 ml of staining medium (RPMI complete medium added with NIR-AZA 1, 5
μM) and then rinsed three times with sterile PBS. Finally, 10 ml of serum free medium
was added to each flask and microvesicles were purified following 24 h incubation at
37 °C, 5% CO2.
Unlabelled microvesicle isolation
KellyCis83 cells were grown in complete RPMI 1640 medium until 70-80% confluence
was reached. Complete medium was removed and cells were washed thrice with sterile
PBS. Cells were then added with 10 ml of Serum Free RPMI 1640 (supplemented with
1% penicillin/streptomycin or 1% gentamycin and 1% glutamine, all purchased from
Gibco) and the microvesicles were purified after 24 h of incubation.
Microvesicle fractionation
Both NIR-microvesicles and unlabelled microvesicles were purified from cell-
conditioned serum free medium using several differential centrifugation steps: 800 g x
30 minutes (to pellet larger EVs such as apoptotic bodies and cell debris) and 16,000 g
x 45 minutes to pellet large EVs (microvesicles).
Microvesicle Nanoparticle Tracking Analysis
S6
NTA was performed using a Malvern Nanosight NS300 equipped with a blue laser and
a quartz chamber for sample injection (O-Ring top plate model). Each NIR-
microvesicle and unlabeled microvesicle sample was diluted in sterile, ultrapure grade
water and measured for 60 sec. Measurement parameters were set using 200 nm
polystyrene-latex beads as standards and kept constant between samples; dilution factor
was tuned in order to keep a particle number per frame ~ 30, according to NS300
standard operational procedures, and varied between 1:100 and 1:500.
Microvesicle biochemical analysis
For biochemical analysis, NIR-microvesicles and unlabelled microvesicles were
resuspended in 50 μl of 100 mM Tris, 150 mM NaCl, 1 mM EDTA supplemented with
1:1000 protease inhibitor cocktail (P.I.). 10 μl of loading buffer 6x were added and
samples were boiled 5 min at 95°C. Twenty μl of samples were electrophoresed (120V
x 90 min) in sodium dodecyl sulfate – polyacrylamide gel electrophoresis (SDS-
PAGE). Proteins were then transferred on a PVDF membrane (100V x 60 min), which
was incubated 45 min at 37°C in PBS + tween 0.05% + fat-free milk 5%. The membrane
was then analyzed by Western Blot (WB), using the following antibodies: mouse rabbit
α ACTN4 1:500 (Genetex), mouse α MMP2 1:500 (Santa Cruz Biotechnology), mouse
α Annexin-V 1:500 (Santa Cruz Biotechnology), mouse α CD81 1:500 (Santa Cruz
Biotechnology). PVDF membrane was incubated under mild agitation with primary
antibodies for 90 min, washed three times with PBS and then incubated for 60 min with
HRP-conjugated secondary antibodies (provided by Bethyl Laboratories), diluted
1:10000 prior to use. Both primary and secondary antibodies were diluted into PBS +
tween 0.05% + fat-free milk 1%.
Microvesicle fluorimeter analysis
To check fluorescence after NIR-AZA 1 loading, similar amounts (between 1.5 and 2.0
x 1010 particles/ml, according to NTA) of NIR-microvesicles and unlabelled
microvesicles were re-suspended in 200 μl of sterile PBS and analyzed with a Jasco
UV-Vis-NIR fluorometer. Samples were measured in quartz microcuvettes (Perkin-
Elmer, optical path length: 10 mm, chamber width: 1 mm); fluorophore was excited at
λ =680 nm and fluorescence was collected between λ=690 nm and λ=900 nm.
Microvesicle Atomic Force Microscopy
S7
NIR-microvesicle and unlabelled microvesicle samples re-suspended in sterile PBS
were diluted 1:10 in milliQ water and 7-10 μl were spotted on freshly cleaved mica
substrates and let dry at room temperature in a Petri dish. Mica sheets were then
analyzed with a NaioAFM (Nanosurf, Liestal, Switzerland) atomic force microscope,
equipped with MultiGD-G probes (BudgetSensors, Sofia, Bulgaria) and run in dynamic
mode. Scanning parameters were tuned according to instrument and probes’
manufacturers. Images were processed using WSxM 5.0 software.
Microvesicle analysis by flow cytometry
NIR-microvesicles and unlabeled microvesicles were diluted into sterile-filtered PBS
or with 10% FBS for up to 24 h at 37 °C and analyzed with a BD FACSCanto II flow
cytometer (BD Biosciences, Franklin Lake, New Jersey, U.S). Forward scatter
threshold was set to its minimum value. EV flow rate was set on slow; illumination was
provided by a standard 635 nm red laser and fluorescence was collected through a APC-
Cy7-A filter. Data were processed with FACSDiva software. Downstream of
acquisition, data was analysed in Summit 5.2 software. Overlays and boxplots were
generated in R using pre-quantified data exported from Summit 5.2.
Wavelength (nm)
400 500 600 700 800 900
No
rmali
ze
d A
bs
orp
tio
n
0.0
0.2
0.4
0.6
0.8
1.0
No
rmali
ze
d F
luo
res
ce
nce
In
ten
sti
y
0.0
0.2
0.4
0.6
0.8
1.0
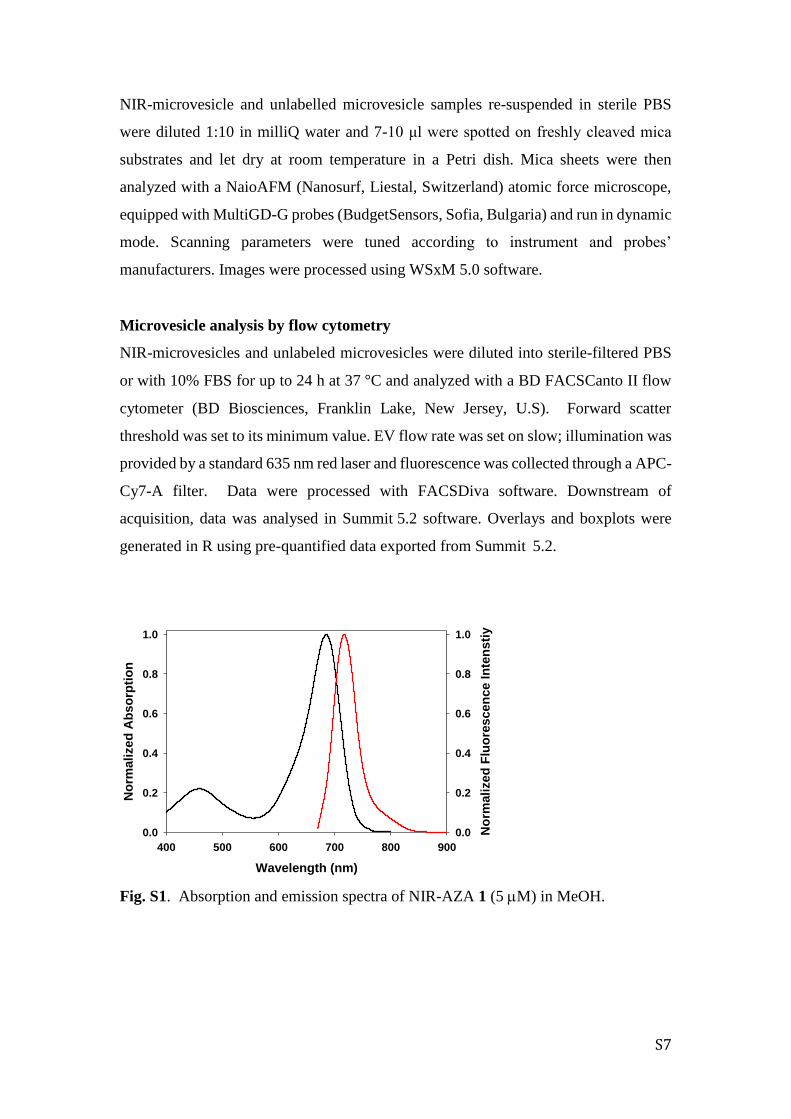
Fig. S1. Absorption and emission spectra of NIR-AZA 1 (5 M) in MeOH.
S8
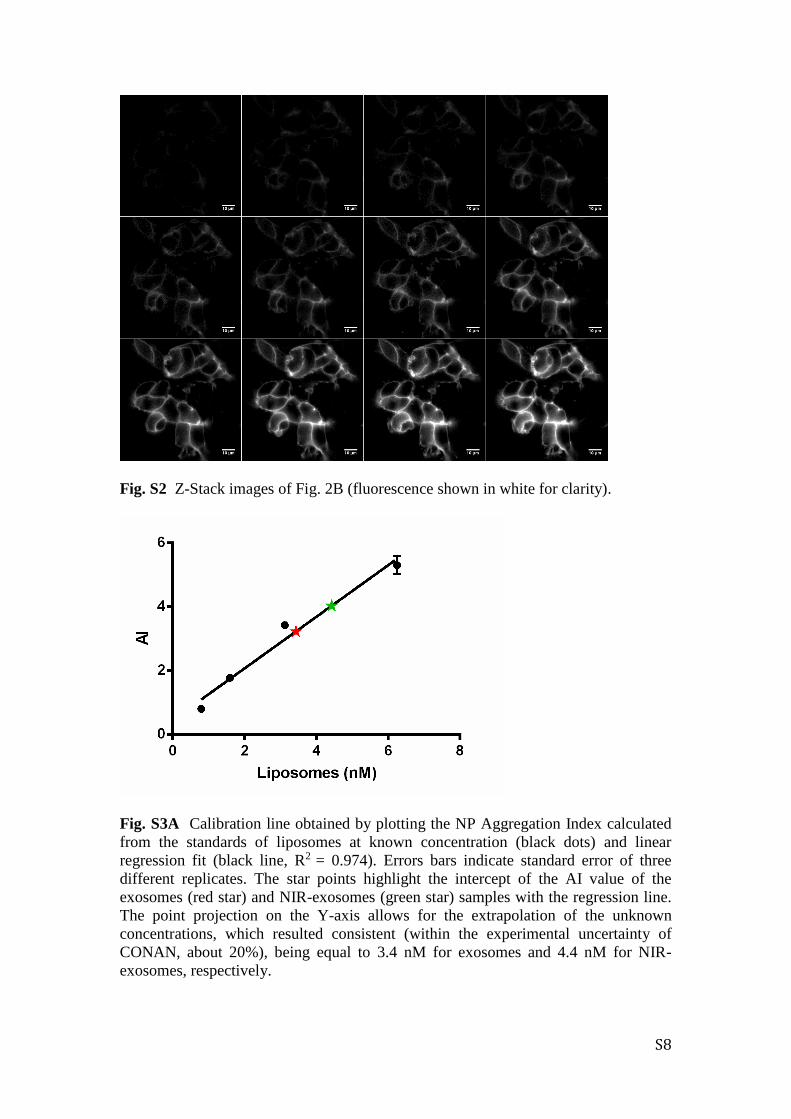
Fig. S2 Z-Stack images of Fig. 2B (fluorescence shown in white for clarity).
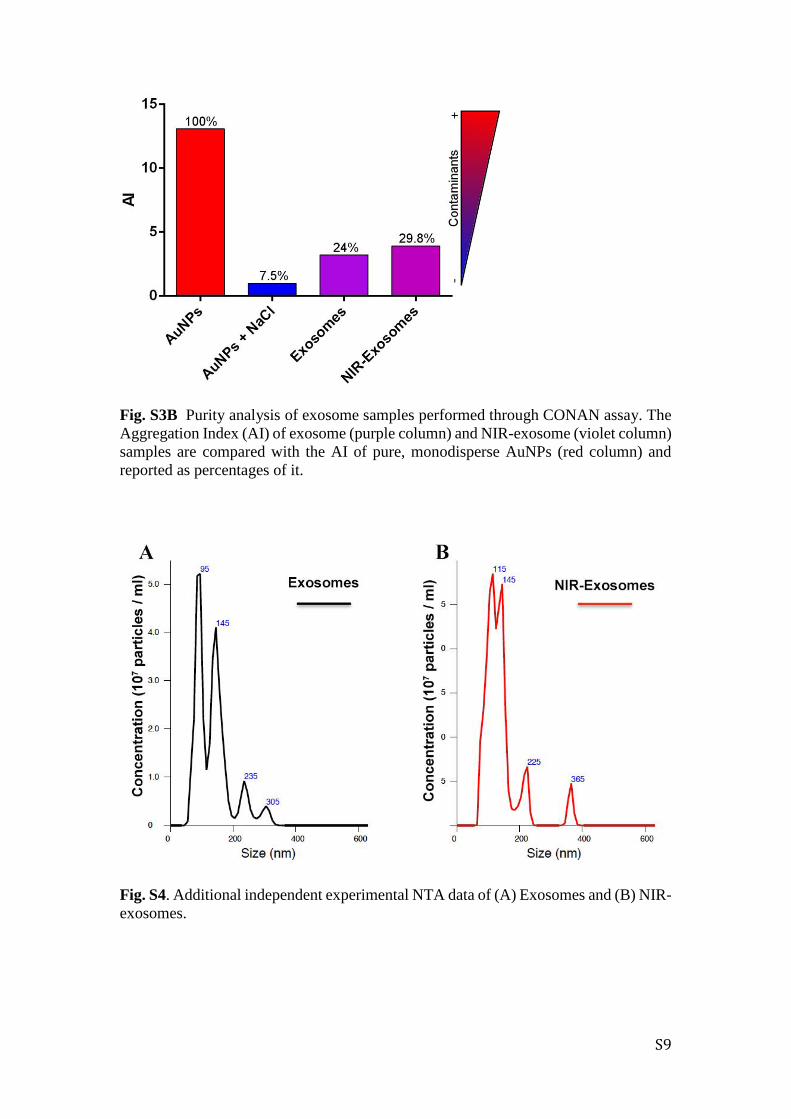
Fig. S3A Calibration line obtained by plotting the NP Aggregation Index calculated
from the standards of liposomes at known concentration (black dots) and linear
regression fit (black line, R2 = 0.974). Errors bars indicate standard error of three
different replicates. The star points highlight the intercept of the AI value of the
exosomes (red star) and NIR-exosomes (green star) samples with the regression line.
The point projection on the Y-axis allows for the extrapolation of the unknown
concentrations, which resulted consistent (within the experimental uncertainty of
CONAN, about 20%), being equal to 3.4 nM for exosomes and 4.4 nM for NIR-
exosomes, respectively.
S9
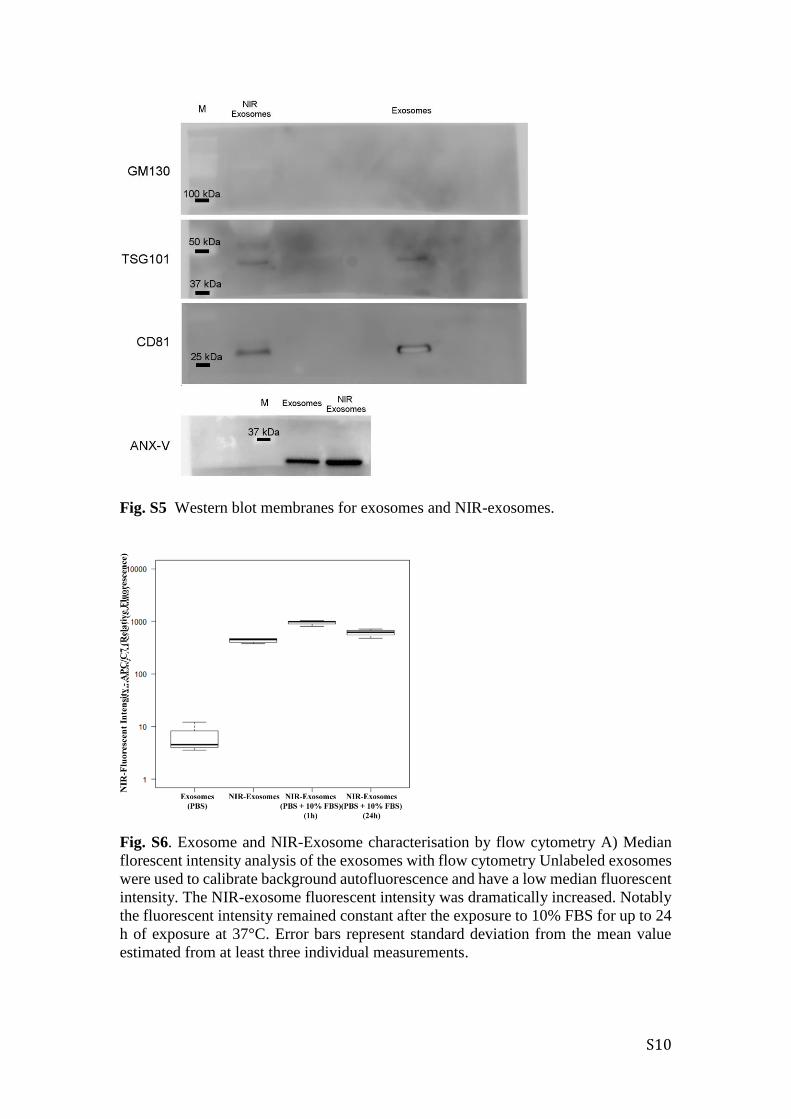
Fig. S3B Purity analysis of exosome samples performed through CONAN assay. The
Aggregation Index (AI) of exosome (purple column) and NIR-exosome (violet column)
samples are compared with the AI of pure, monodisperse AuNPs (red column) and
reported as percentages of it.
Fig. S4. Additional independent experimental NTA data of (A) Exosomes and (B) NIR-
exosomes.
S10
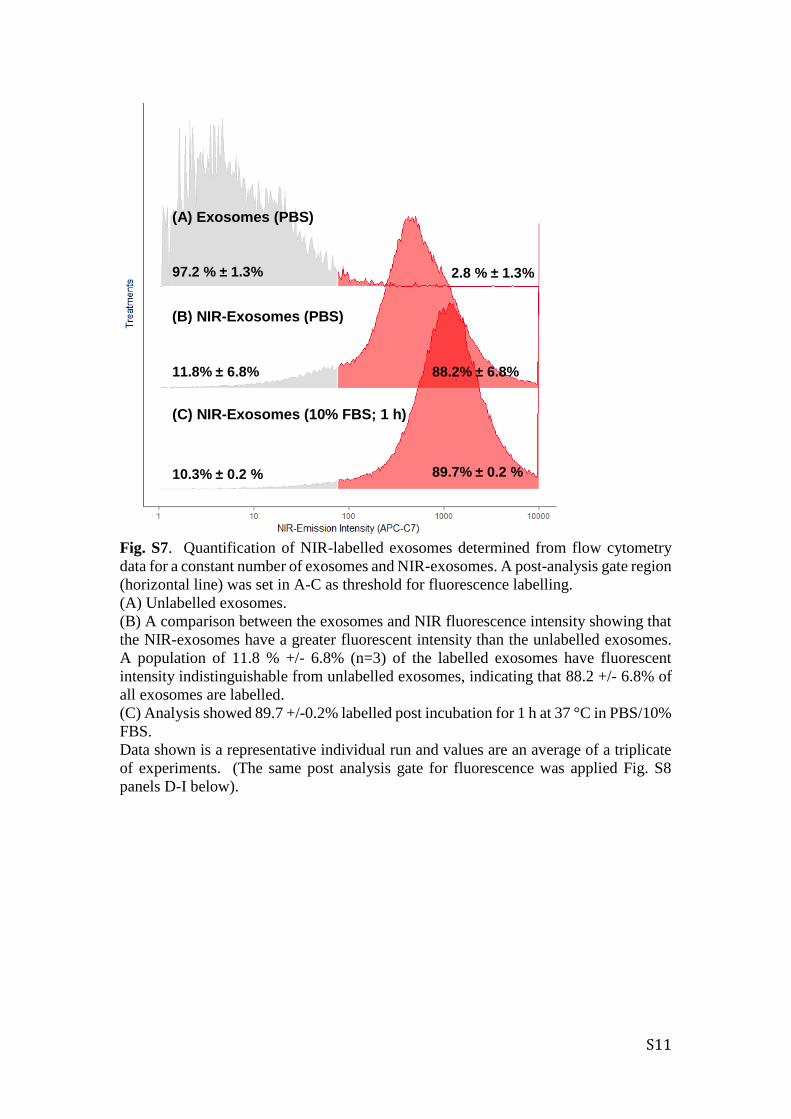
Fig. S5 Western blot membranes for exosomes and NIR-exosomes.
Fig. S6. Exosome and NIR-Exosome characterisation by flow cytometry A) Median
florescent intensity analysis of the exosomes with flow cytometry Unlabeled exosomes
were used to calibrate background autofluorescence and have a low median fluorescent
intensity. The NIR-exosome fluorescent intensity was dramatically increased. Notably
the fluorescent intensity remained constant after the exposure to 10% FBS for up to 24
h of exposure at 37°C. Error bars represent standard deviation from the mean value
estimated from at least three individual measurements.
S11
Fig. S7. Quantification of NIR-labelled exosomes determined from flow cytometry
data for a constant number of exosomes and NIR-exosomes. A post-analysis gate region
(horizontal line) was set in A-C as threshold for fluorescence labelling.
(A) Unlabelled exosomes.
(B) A comparison between the exosomes and NIR fluorescence intensity showing that
the NIR-exosomes have a greater fluorescent intensity than the unlabelled exosomes.
A population of 11.8 % +/- 6.8% (n=3) of the labelled exosomes have fluorescent
intensity indistinguishable from unlabelled exosomes, indicating that 88.2 +/- 6.8% of
all exosomes are labelled.
(C) Analysis showed 89.7 +/-0.2% labelled post incubation for 1 h at 37 °C in PBS/10%
FBS.
Data shown is a representative individual run and values are an average of a triplicate
of experiments. (The same post analysis gate for fluorescence was applied Fig. S8
panels D-I below).
(A) Exosomes (PBS)
(B) NIR-Exosomes (PBS)
(C) NIR-Exosomes (10% FBS; 1 h)
2.8 % ± 1.3% 97.2 % ± 1.3%
88.2% ± 6.8%
89.7% ± 0.2 %
11.8% ± 6.8%
10.3% ± 0.2 %
S12
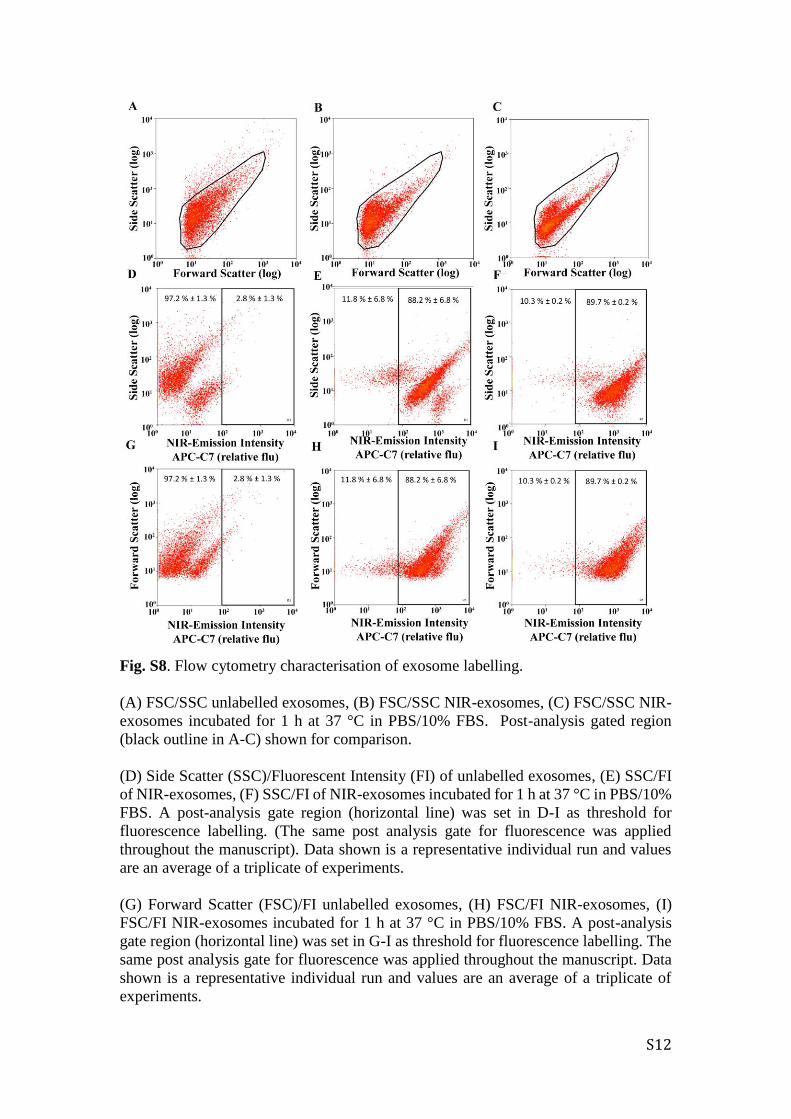
Fig. S8. Flow cytometry characterisation of exosome labelling.
(A) FSC/SSC unlabelled exosomes, (B) FSC/SSC NIR-exosomes, (C) FSC/SSC NIR-
exosomes incubated for 1 h at 37 °C in PBS/10% FBS. Post-analysis gated region
(black outline in A-C) shown for comparison.
(D) Side Scatter (SSC)/Fluorescent Intensity (FI) of unlabelled exosomes, (E) SSC/FI
of NIR-exosomes, (F) SSC/FI of NIR-exosomes incubated for 1 h at 37 °C in PBS/10%
FBS. A post-analysis gate region (horizontal line) was set in D-I as threshold for
fluorescence labelling. (The same post analysis gate for fluorescence was applied
throughout the manuscript). Data shown is a representative individual run and values
are an average of a triplicate of experiments.
(G) Forward Scatter (FSC)/FI unlabelled exosomes, (H) FSC/FI NIR-exosomes, (I)
FSC/FI NIR-exosomes incubated for 1 h at 37 °C in PBS/10% FBS. A post-analysis
gate region (horizontal line) was set in G-I as threshold for fluorescence labelling. The
same post analysis gate for fluorescence was applied throughout the manuscript. Data
shown is a representative individual run and values are an average of a triplicate of
experiments.
S13
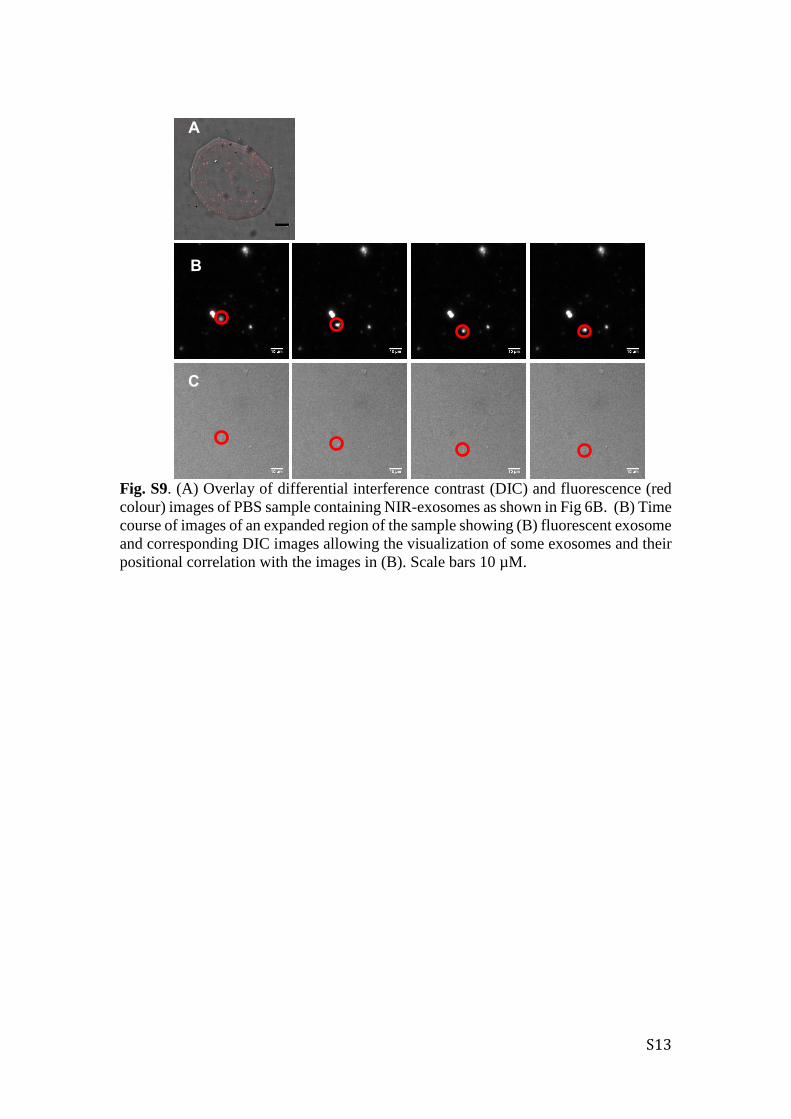
Fig. S9. (A) Overlay of differential interference contrast (DIC) and fluorescence (red
colour) images of PBS sample containing NIR-exosomes as shown in Fig 6B. (B) Time
course of images of an expanded region of the sample showing (B) fluorescent exosome
and corresponding DIC images allowing the visualization of some exosomes and their
positional correlation with the images in (B). Scale bars 10 µM.
A
B
C
S14
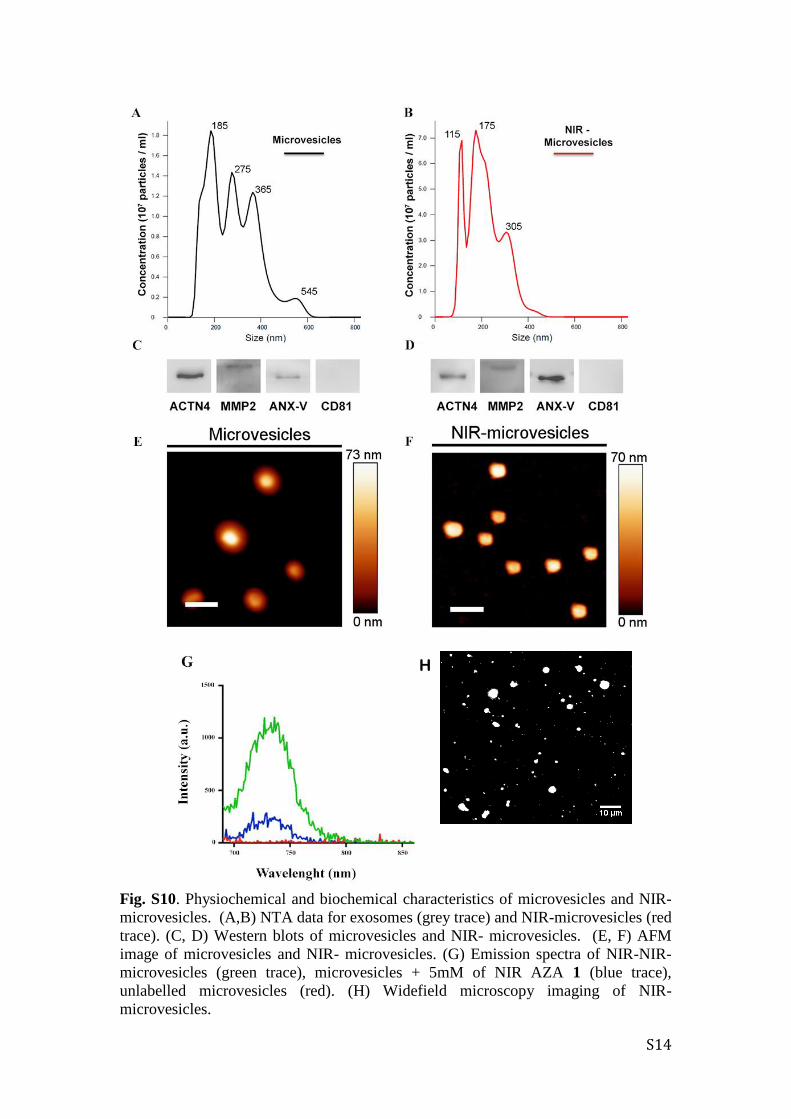
Fig. S10. Physiochemical and biochemical characteristics of microvesicles and NIR-
microvesicles. (A,B) NTA data for exosomes (grey trace) and NIR-microvesicles (red
trace). (C, D) Western blots of microvesicles and NIR- microvesicles. (E, F) AFM
image of microvesicles and NIR- microvesicles. (G) Emission spectra of NIR-NIR-
microvesicles (green trace), microvesicles + 5mM of NIR AZA 1 (blue trace),
unlabelled microvesicles (red). (H) Widefield microscopy imaging of NIR-
microvesicles.
H
S15
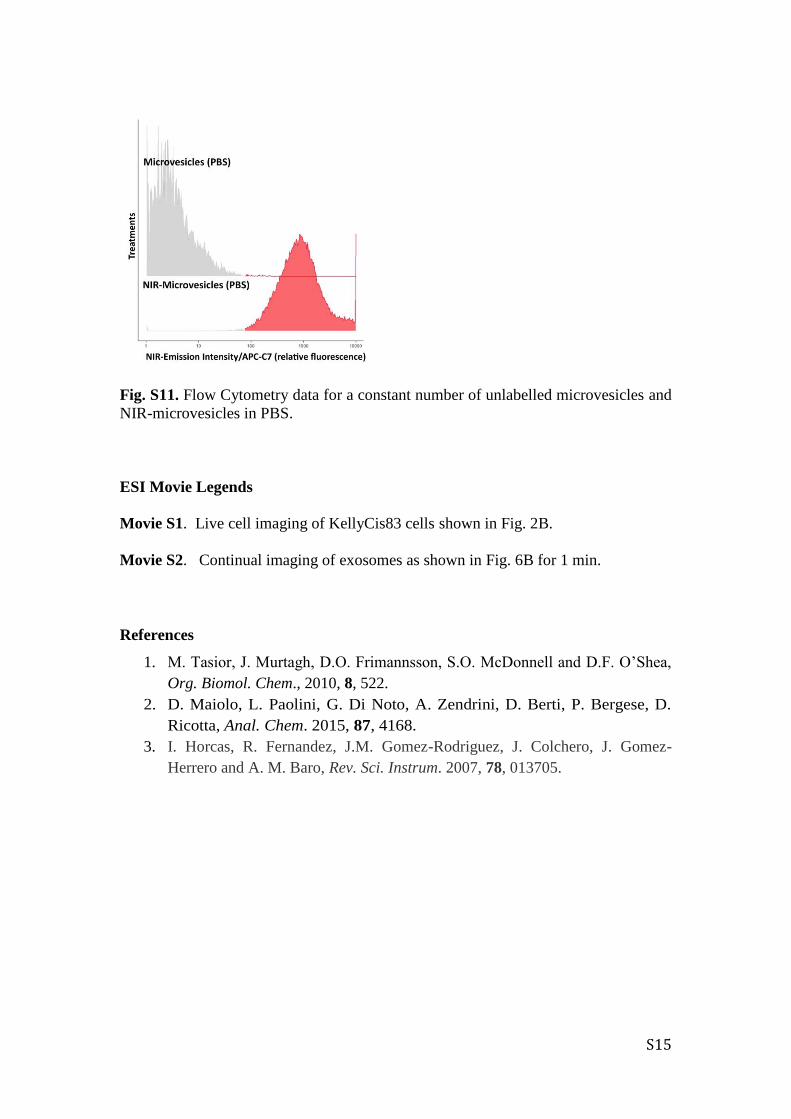
Fig. S11. Flow Cytometry data for a constant number of unlabelled microvesicles and
NIR-microvesicles in PBS.
ESI Movie Legends
Movie S1. Live cell imaging of KellyCis83 cells shown in Fig. 2B.
Movie S2. Continual imaging of exosomes as shown in Fig. 6B for 1 min.
References
1. M. Tasior, J. Murtagh, D.O. Frimannsson, S.O. McDonnell and D.F. O’Shea,
Org. Biomol. Chem., 2010, 8, 522.
2. D. Maiolo, L. Paolini, G. Di Noto, A. Zendrini, D. Berti, P. Bergese, D.
Ricotta, Anal. Chem. 2015, 87, 4168.
3. I. Horcas, R. Fernandez, J.M. Gomez-Rodriguez, J. Colchero, J. Gomez-
Herrero and A. M. Baro, Rev. Sci. Instrum. 2007, 78, 013705.