Two dimensional vortex structures in magnetized plasmas Master
Elementary Processes of Free-decaying Two-dimensionalTurbulence in Magnetized Pure Electron Plasmas
Yosuke KAWAI and Yasuhito KIWAMOTOGraduate School of Human and Environmental Studies, Kyoto University, Yoshidanihonmatsu-cho, Sakyo-ku, Kyoto
606-8501, Japan
Elementary processes of two-dimensional (2D) turbulence have been examined by extensive analyses of fine-scale structures in the density distribution of a magnetized pure electron plasma that evolves from an unstableinitial state to a single-peaked stable distribution through successive mergers of vortex patches. Fourier-basedanalyses have revealed that the spectral dynamics in the wave-number k space is qualitatively consistent withthe theoretical picture of 2D turbulence, i.e., while the energy is transferred downward, the enstrophy cascadesupward in the wave-number region larger than kin j corresponding to the size of vortex patches, and the energyspectrum E(k) shows a power-law scaling k−α with α > 3. By applying wavelet analyses to the observed densitydistributions, this spectral dynamics is connected directly to the vortex dynamics in the physical space. Withthe simultaneous resolution in the physical coordinates and wave numbers, we have observed that the enstrophycascade is associated with the filamentation process of vortex structures. Moreover, controlled discrimination ofthe coherent component in terms of the wavelet coefficients indicates significant contribution of coherent vorticesin steepening the energy spectrum far above the theoretical prediction of k−3.Keywords: non-neutral plasma, two-dimensional turbulence, spectral analysis, wavelet analysis
1. IntroductionIn the guiding center approximation, the macroscopic
dynamics of pure electron plasmas transverse to a strongmagnetic field B0 is equivalent to the two-dimensional(2D) vortex dynamics in inviscid and incompressible flu-ids, through the relation ζ = en/ε0B0 between the electrondensity n(x, y) and the vorticity ζ(x, y) [1]. Here, −e and ε0are the electron charge and the dielectric constant in vac-uum, respectively. Taking advantage of this equivalence,many aspects of vortex dynamics constituting fundamentalprocesses of 2D turbulence, such as the advection, merger,filamentation of vortices, has been studied extensively byemploying magnetized pure electron plasmas [1, 2].
Free relaxation of 2D turbulence starting from an un-stable initial distribution has also been studied, focusingon the formation of quasi-stationary states with orderedstructures [1, 3, 4]. In the previous study, we have inves-tigated the relaxation process via stochastic mergers of co-herent vortices by applying time-resolved spectral analy-ses in terms of the density transport [5]. In this paper, weextend these examinations further to explore fundamentalproperties of 2D turbulence in terms of the transport of theenergy and enstrophy in the wave-number k space [6].
Theoretical picture of 2D turbulence has been pro-posed by Kraichnan and Batchelor [7]. In these studies,they proposed that in an isotropic and homogeneous 2Dturbulence, the enstrophy (vorticity) injected at the lengthscale of lin j (∝ 1/kin j) cascades at a constant transfer rateof η down to a scale of dissipation ld (∝ 1/kd) and dis-sipates at smaller scales by viscosity. This cascade pictureof 2D turbulence leads to an energy spectrum characterized
author’s e-mail: [email protected]
by the power-law scaling E(k) ∝ k−3 in the inertial rangekin j ≤ k ≤ kd of the wave-number space. In the presentwork, we observe the vorticity distribution ζ(x, y) in termsof the electron density distribution n(x, y), and analyze thespectral dynamics over a wide range of wave numbers ex-tending to the dissipative scale.
In addition to the Fourier-based analysis, in this paper,we also apply the wavelet analysis to the observed densitydistributions [8]. In contrast to the Fourier expantion, spa-tially localized wave packet, called ”wavelet”, allows us toanalyze the turbulent structures in terms of both coordinate(physical space) and scale (wave-number space) simulta-neously within the limits of the uncertainty principle [9].With this advantage, we examine the spectral dynamics inthe wave-number space in relation to the vortex dynamicsin the physical space, and clarify characteristic features of2D turbulence from a physical point of view.
2. Experimental MethodThe experiment was carried out by using a pure elec-
tron plasma confined in a Penning-Malmberg trap with auniform magnetic field (B0 = 0.048 T) and a square-wellpotential. The relaxation process starts with a spontaneousformation of vortices via a nonlinear stage of the diocotroninstability of a ring-shaped initial distribution [5, 10]. Af-ter the production of an initial profile, the stochastic vor-tex dynamics proceeds spontaneously while the electronsare held in the trap. The time evolution of the 2D den-sity distribution was observed destructively by dampingthe electrons onto the conducting phosphor screen and dig-itizing the resultant luminosity distribution with a charge-coupled-device camera (CCD), which provides the spatial
944
J. Plasma Fusion Res. SERIES, Vol. 8 (2009)
©2009 by The Japan Society of PlasmaScience and Nuclear Fusion Research
(Received: 31 August 2008 / Accepted: 11 October 2008)
25 31 40 60 200
5 Μs 13 15 21 23
1.40 (m-3)
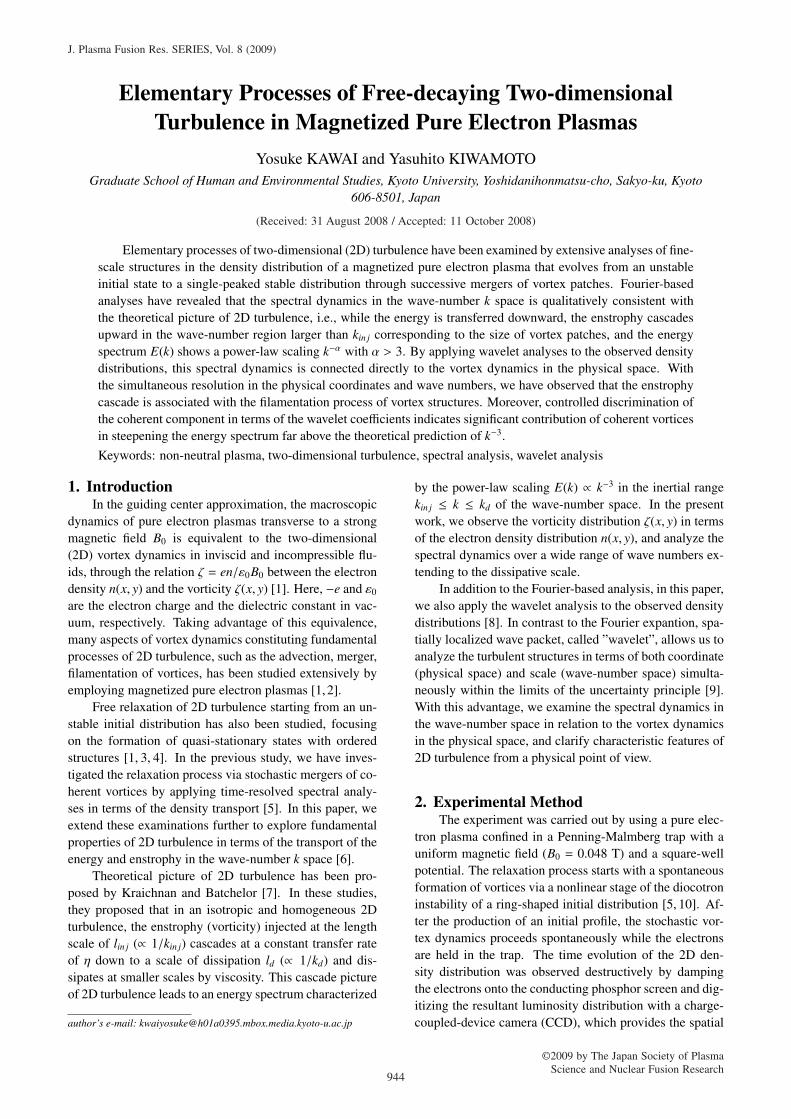
Fig. 1 Images of the time evolution of the density distribution.The darkness is proportional to the density. The time ofobservation (in μs) is indicated at the upper left corner.
resolution of 0.1 mm/pix, at each time step of the relax-ation. This destructive diagnostic requires a high repro-ducibility of the initial profiles, because of the stochasticnature of the turbulent relaxation process triggered by theinstability. Therefore in this experiment, in addition totechnically minimizing shot-by-shot variations in the ini-tial profiles, an ensemble-average is applied over typically5 shots of data for each time step in evaluating physicalquantities. The details of the experimental configurationand diagnostic are reported in Refs. [2, 4–6, 11].
3. Vortex Dynamics in 2D TurbulenceThe time evolution of the observed density distribu-
tion is shown in Fig. 1. Each image is denoised frominstrumental noise, which is an accumulated charge onCCD pixels due to a dark current, by using the wavelet-based noise extraction method [8, 12]. The ring-shapedprofile produced at 5 μs is distorted by the diocotron in-stability [10] within a few μs, and eventually 5 high den-sity vortex patches are generated at 13 μs. After the for-mation of the first vortex patches, the successive mergersamong the patches proceed spontaneously up to the for-mation of a single vortex, accompanied by a generationof filamentary structures that evolve toward smaller lengthscales. The concentrated patches rotate expelling filamen-tary structures from the central region, and finally form astable distribution of a bell-shaped core profile surroundedby a low density halo at 200 μs.
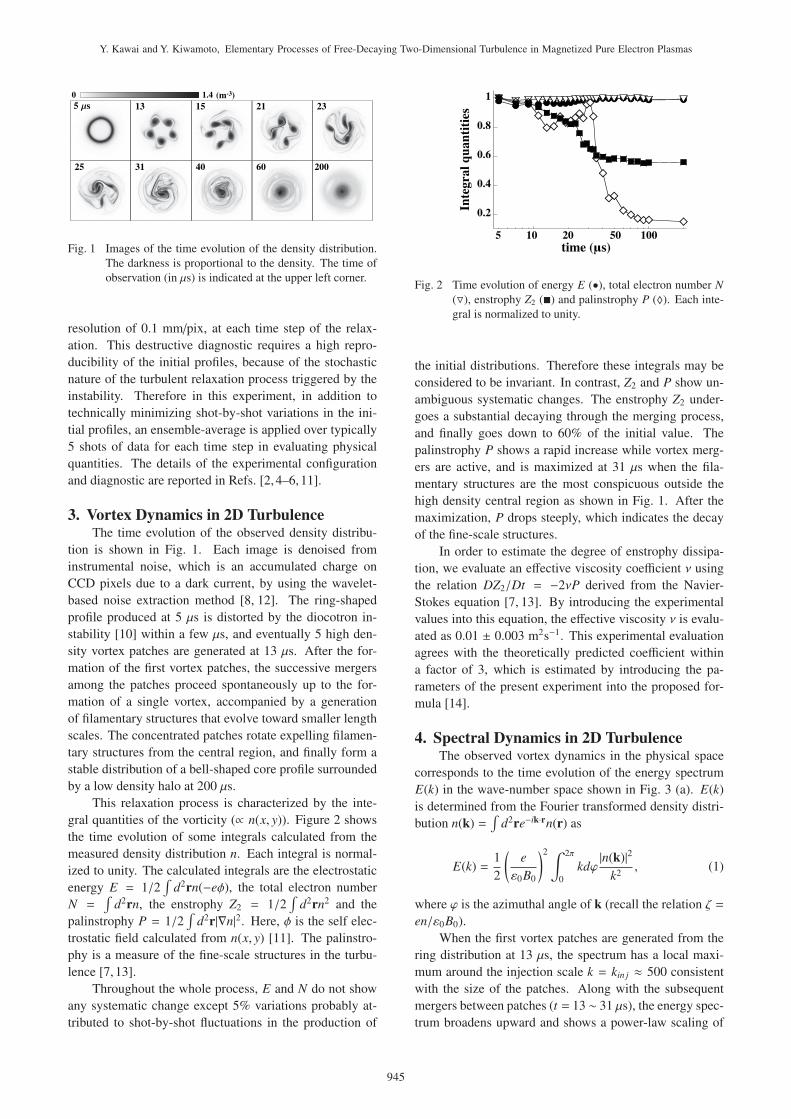
This relaxation process is characterized by the inte-gral quantities of the vorticity (∝ n(x, y)). Figure 2 showsthe time evolution of some integrals calculated from themeasured density distribution n. Each integral is normal-ized to unity. The calculated integrals are the electrostaticenergy E = 1/2
�d2rn(−eφ), the total electron number
N =�d2rn, the enstrophy Z2 = 1/2
�d2rn2 and the
palinstrophy P = 1/2�d2r|∇n|2. Here, φ is the self elec-
trostatic field calculated from n(x, y) [11]. The palinstro-phy is a measure of the fine-scale structures in the turbu-lence [7, 13].
Throughout the whole process, E and N do not showany systematic change except 5% variations probably at-tributed to shot-by-shot fluctuations in the production of
0.2
0.4
0.6
0.8
1
5 10 20 50 100
time (�s)
In
teg
ra
l q
ua
nti
ties
Fig. 2 Time evolution of energy E (•), total electron number N(�), enstrophy Z2 (�) and palinstrophy P (♦). Each inte-gral is normalized to unity.
the initial distributions. Therefore these integrals may beconsidered to be invariant. In contrast, Z2 and P show un-ambiguous systematic changes. The enstrophy Z2 under-goes a substantial decaying through the merging process,and finally goes down to 60% of the initial value. Thepalinstrophy P shows a rapid increase while vortex merg-ers are active, and is maximized at 31 μs when the fila-mentary structures are the most conspicuous outside thehigh density central region as shown in Fig. 1. After themaximization, P drops steeply, which indicates the decayof the fine-scale structures.
In order to estimate the degree of enstrophy dissipa-tion, we evaluate an effective viscosity coefficient ν usingthe relation DZ2/Dt = −2νP derived from the Navier-Stokes equation [7, 13]. By introducing the experimentalvalues into this equation, the effective viscosity ν is evalu-ated as 0.01 ± 0.003 m2s−1. This experimental evaluationagrees with the theoretically predicted coefficient withina factor of 3, which is estimated by introducing the pa-rameters of the present experiment into the proposed for-mula [14].
4. Spectral Dynamics in 2D TurbulenceThe observed vortex dynamics in the physical space
corresponds to the time evolution of the energy spectrumE(k) in the wave-number space shown in Fig. 3 (a). E(k)is determined from the Fourier transformed density distri-bution n(k) =
�d2re−ik·rn(r) as
E(k) =12
�eε0B0
�2 � 2π
0kdϕ|n(k)|2k2, (1)
where ϕ is the azimuthal angle of k (recall the relation ζ =en/ε0B0).
When the first vortex patches are generated from thering distribution at 13 μs, the spectrum has a local maxi-mum around the injection scale k = kin j ≈ 500 consistentwith the size of the patches. Along with the subsequentmergers between patches (t = 13 ∼ 31 μs), the energy spec-trum broadens upward and shows a power-law scaling of
945
Y. Kawai and Y. Kiwamoto, Elementary Processes of Free-Decaying Two-Dimensional Turbulence in Magnetized Pure Electron Plasmas
25
�4.9
31
�3.9
40
�4.
60
�4.1
200
�4.5
5 Μs 13
�5.1
15
�5.3
21
�4.9
23
�5.3
102 103
102
10-2
E(k) (m2 s-2)
102 103 102 103 102 103 102 103
102
10-2
17Μs 23 25 27 312
0
-2
k (m-1)
�(k) (2�108 m2 s-3) �(k) (1014 s-3)
102 103 102 103 102 103 102 103 102 103
(a)
(b)
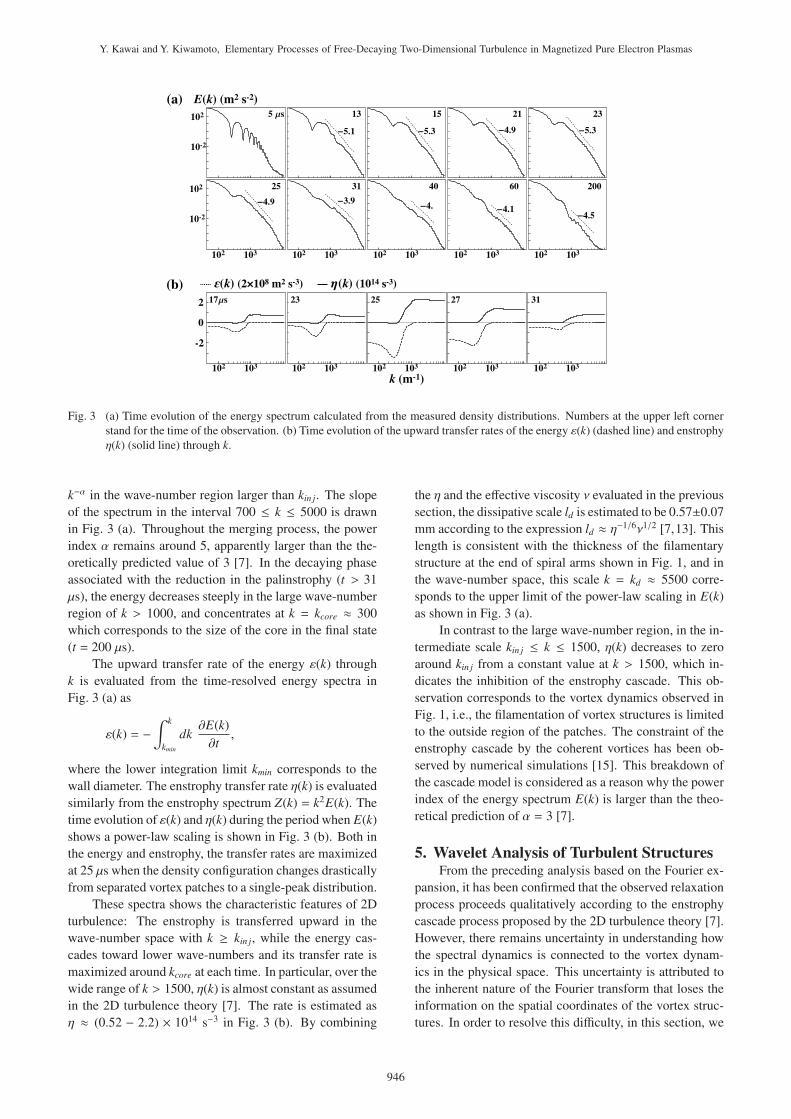
Fig. 3 (a) Time evolution of the energy spectrum calculated from the measured density distributions. Numbers at the upper left cornerstand for the time of the observation. (b) Time evolution of the upward transfer rates of the energy ε(k) (dashed line) and enstrophyη(k) (solid line) through k.
k−α in the wave-number region larger than kin j. The slopeof the spectrum in the interval 700 ≤ k ≤ 5000 is drawnin Fig. 3 (a). Throughout the merging process, the powerindex α remains around 5, apparently larger than the the-oretically predicted value of 3 [7]. In the decaying phaseassociated with the reduction in the palinstrophy (t > 31μs), the energy decreases steeply in the large wave-numberregion of k > 1000, and concentrates at k = kcore ≈ 300which corresponds to the size of the core in the final state(t = 200 μs).
The upward transfer rate of the energy ε(k) throughk is evaluated from the time-resolved energy spectra inFig. 3 (a) as
ε(k) = −� k
kmin
dk∂E(k)∂t,
where the lower integration limit kmin corresponds to thewall diameter. The enstrophy transfer rate η(k) is evaluatedsimilarly from the enstrophy spectrum Z(k) = k2E(k). Thetime evolution of ε(k) and η(k) during the period when E(k)shows a power-law scaling is shown in Fig. 3 (b). Both inthe energy and enstrophy, the transfer rates are maximizedat 25 μs when the density configuration changes drasticallyfrom separated vortex patches to a single-peak distribution.
These spectra shows the characteristic features of 2Dturbulence: The enstrophy is transferred upward in thewave-number space with k ≥ kin j, while the energy cas-cades toward lower wave-numbers and its transfer rate ismaximized around kcore at each time. In particular, over thewide range of k > 1500, η(k) is almost constant as assumedin the 2D turbulence theory [7]. The rate is estimated asη ≈ (0.52 − 2.2) × 1014 s−3 in Fig. 3 (b). By combining
the η and the effective viscosity ν evaluated in the previoussection, the dissipative scale ld is estimated to be 0.57±0.07mm according to the expression ld ≈ η−1/6ν1/2 [7,13]. Thislength is consistent with the thickness of the filamentarystructure at the end of spiral arms shown in Fig. 1, and inthe wave-number space, this scale k = kd ≈ 5500 corre-sponds to the upper limit of the power-law scaling in E(k)as shown in Fig. 3 (a).
In contrast to the large wave-number region, in the in-termediate scale kin j ≤ k ≤ 1500, η(k) decreases to zeroaround kin j from a constant value at k > 1500, which in-dicates the inhibition of the enstrophy cascade. This ob-servation corresponds to the vortex dynamics observed inFig. 1, i.e., the filamentation of vortex structures is limitedto the outside region of the patches. The constraint of theenstrophy cascade by the coherent vortices has been ob-served by numerical simulations [15]. This breakdown ofthe cascade model is considered as a reason why the powerindex of the energy spectrum E(k) is larger than the theo-retical prediction of α = 3 [7].
5. Wavelet Analysis of Turbulent StructuresFrom the preceding analysis based on the Fourier ex-
pansion, it has been confirmed that the observed relaxationprocess proceeds qualitatively according to the enstrophycascade process proposed by the 2D turbulence theory [7].However, there remains uncertainty in understanding howthe spectral dynamics is connected to the vortex dynam-ics in the physical space. This uncertainty is attributed tothe inherent nature of the Fourier transform that loses theinformation on the spatial coordinates of the vortex struc-tures. In order to resolve this difficulty, in this section, we
946
Y. Kawai and Y. Kiwamoto, Elementary Processes of Free-Decaying Two-Dimensional Turbulence in Magnetized Pure Electron Plasmas
apply the wavelet analysis to the same data set, and inves-tigate the spectral transport in connection with the vortexdynamics in the physical space.
5.1 Multiresolution analysis of density dis-tribution
First, we decompose the density distribution n(x, y)into an orthogonal wavelet series from the smallest scale2−(J−1) to the largest scale 20 (where J = log2
√N = 9
and N is the total pixel number 512×512) using a two-dimensional multiresolution analysis [9, 12] given as
n(x, y) = n00,0φ00,0(x, y)
+
J−1�j=0
2 j−1�ix=0
2 j−1�iy=0
3�μ=1
nμ, jix,iyψμ, jix,iy
(x, y),
φjix,iy
(x, y) = φ jix(x)φ j
iy(y), ψ1, jix,iy
(x, y) = φ jix(x)ψ j
iy(y),
ψ2, jix,iy
(x, y) = ψ jix(x)φ j
iy(y), ψ3, jix,iy
(x, y) = ψ jix(x)ψ j
iy(y),
where φ jix(x) and ψ j
ix(x) are the scaling function and the
corresponding wavelet, respectively. Due to the orthogo-nality, the wavelet coefficient nμ, jix,iy
at scale 2− j and position
(ix, iy) is given by nμ, jix,iy=�n, ψμ, jix,iy
�=�n(r)ψμ, jix,iy
(r)dr, andn00,0 =
�n, φ00,0
�corresponds to the mean value of the den-
sity.In this paper, we employ the Coiflet order 12 wavelet
in terms of compact-support, symmetry, smoothness,the number of vanishing moments and calculation effi-ciency [9, 16]. The inner product �·, ·� is performed withthe periodic boundary condition, so that in the low wave-number range the shape of the spectrum is different fromthat of the spectra shown in Fig. 3 (a) which were calcu-lated with the experimentally imposed boundary condition.Nevertheless, as far as we examine the spectra in the wave-number space above kin j, the spectral structure is confirmedto be consistent with the previous one.
5.2 Spatial dynamics of enstrophy spectrumFrom the wavelet coefficients nμ, jix,iy
thus obtained, weevaluate the spatial distribution of the enstrophy spec-trum Z2(x, k j) of wave number k j = k02 j at coordinatex = (ix, iy)29− jΔx as follows [16, 17]:
Z2(x, k j) =12
�eε0B0
�2 3�μ=1
(nμ, jix,iy)2�Aj,
where
Aj = Δk jΔx2j ,
Δx j = 29− jΔx, Δk j =
�k j+1k j −
�k jk j−1.
Δx = 0.1 mm is the smallest resolvable scale on theCCD image, and k0 is determined by the filtering prop-erty of the Fourier-transformed wavelet and scaling func-tion. Z2(x, k j) is defined as the density of the enstrophy per
107
Z2(k
) (s
-3)
k (m-1)
106
102 103
105
104
103
j = 3j = 4
j = 5
j = 6
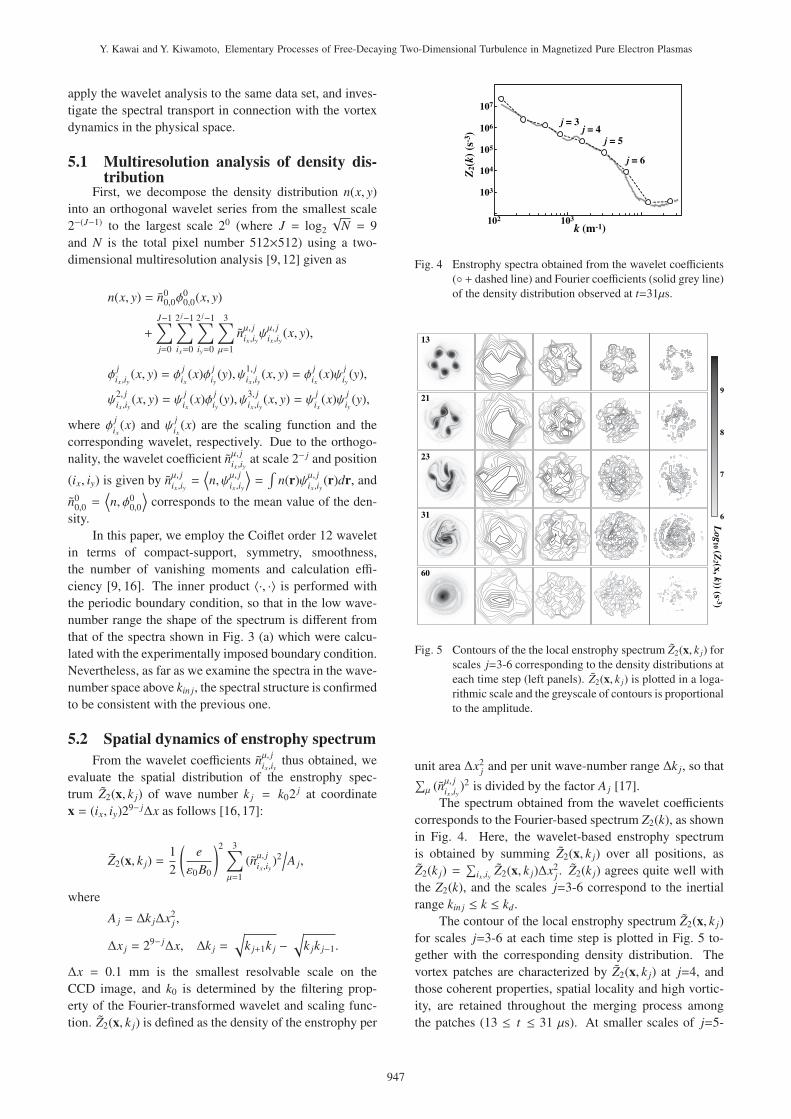
Fig. 4 Enstrophy spectra obtained from the wavelet coefficients(◦ + dashed line) and Fourier coefficients (solid grey line)of the density distribution observed at t=31μs.
31
13
21
23
60
6
7
8
9
Lo
g1
0 (Z
2 (x, k
)) (s-3)
Fig. 5 Contours of the the local enstrophy spectrum Z2(x, k j) forscales j=3-6 corresponding to the density distributions ateach time step (left panels). Z2(x, k j) is plotted in a loga-rithmic scale and the greyscale of contours is proportionalto the amplitude.
unit area Δx2j and per unit wave-number range Δk j, so that�μ (n
μ, jix,iy
)2 is divided by the factor Aj [17].The spectrum obtained from the wavelet coefficients
corresponds to the Fourier-based spectrum Z2(k), as shownin Fig. 4. Here, the wavelet-based enstrophy spectrumis obtained by summing Z2(x, k j) over all positions, asZ2(k j) =
�ix,iy Z2(x, k j)Δx2j . Z2(k j) agrees quite well with
the Z2(k), and the scales j=3-6 correspond to the inertialrange kin j ≤ k ≤ kd.
The contour of the local enstrophy spectrum Z2(x, k j)for scales j=3-6 at each time step is plotted in Fig. 5 to-gether with the corresponding density distribution. Thevortex patches are characterized by Z2(x, k j) at j=4, andthose coherent properties, spatial locality and high vortic-ity, are retained throughout the merging process amongthe patches (13 ≤ t ≤ 31 μs). At smaller scales of j=5-
947
Y. Kawai and Y. Kiwamoto, Elementary Processes of Free-Decaying Two-Dimensional Turbulence in Magnetized Pure Electron Plasmas
j = 0
1
2
3
4
5
6
7
8
100
En
str
op
hy
(m
2 s
-2)
10-1
10-2
10-3
5 10 20 50 100
time (�s)
Fig. 6 Time evolution of the enstrophy at each length-scale j=0(×), 1 (�), 2 (�), 3 (�), 4 (�), 5 (♦), 6 (�), 7 (◦), 8 (•).
6, Z2(x, k j) is dominant in the interacting region of thepatches, and extends spatially along with the filamentationof vortex structures. At the end of the merging processat t =31 μs, while the scales j=5-6 are developed the mostextensively, Z2(x, k j) at j=3 is sharpen accompanied by theformation of a single-peaked distribution. In the decayingphase at t >31 μs, the amplitude of Z2(x, k j) at j=3 is con-centrated in the central core region, and the enstrophy atscales j=4-6 decrease due to the decay of the fine-scalestructures.
The time evolution of the enstrophy Z2(k j) at eachlength-scale is shown in Fig. 6. Throughout the mergingprocess, while Z2(k j)s at j=2-3 decrease, Z2(k j) at j=4 re-mains almost constant. At smaller scales of j=5-6, Z2(k j)sshow a rapid increase and reach the maximum at 31 μs, likethe palinstrophy shown in Fig. 2. This temporal behavioris consistent with the observation of Fig. 5. The successivechange of the enstrophy at each length-scale supports thephysical interpretation that the enstrophy cascade processproceeds through the filamentation of the vortex structures.
5.3 Effect of coherent vortices on spectrumAs shown in Sec. 4, a long-time persistence of the co-
herent patches inhibits the cascade of the enstrophy, and, asobserved in numerical studies [15], this influence causesthe slope of the energy spectrum E(k) to be steeper thanthe theoretical prediction of k−3 [7]. In this section, we ex-amine contributions of the coherent vortices to the energyspectrum by extracting those components from the densitydistribution [18].
To extract coherent vortices from a turbulent field, var-ious methods have been proposed, a lot of which is per-formed by clipping the vorticity field using a thresholdcriterion (see Ref. [13] in Sec. 3). However, the clippingmethod introduces discontinuities in the vorticity distribu-tion and incorporates spurious components to the Fourierspectrum causing a wrong scaling. For this reason, inthis paper, we extract the coherent component in termsof wavelet coefficients based on a threshold criterion [18].
�20 �10 0 10 20
0
0.5
1.
Density (1013 m-3)(a) (b)
r (mm)
k -3.
k -5.5
(c)
E(k
) (m
2 s
-2)
102
10-2
10-6
102 103k (m-1)
0 0.5 1 -0.5 0.50
Den
sit
y (
10
13 m
-3)
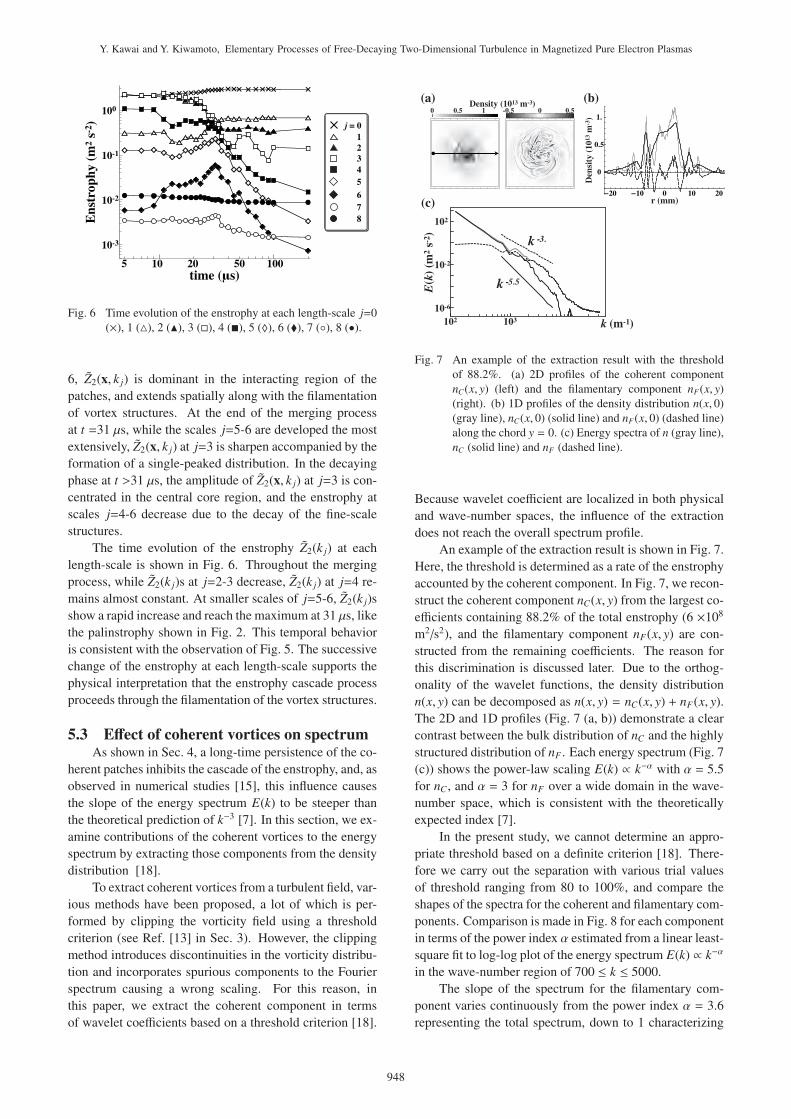
Fig. 7 An example of the extraction result with the thresholdof 88.2%. (a) 2D profiles of the coherent componentnC(x, y) (left) and the filamentary component nF(x, y)(right). (b) 1D profiles of the density distribution n(x, 0)(gray line), nC(x, 0) (solid line) and nF(x, 0) (dashed line)along the chord y = 0. (c) Energy spectra of n (gray line),nC (solid line) and nF (dashed line).
Because wavelet coefficient are localized in both physicaland wave-number spaces, the influence of the extractiondoes not reach the overall spectrum profile.
An example of the extraction result is shown in Fig. 7.Here, the threshold is determined as a rate of the enstrophyaccounted by the coherent component. In Fig. 7, we recon-struct the coherent component nC(x, y) from the largest co-efficients containing 88.2% of the total enstrophy (6 ×10⁸m2/s2), and the filamentary component nF(x, y) are con-structed from the remaining coefficients. The reason forthis discrimination is discussed later. Due to the orthog-onality of the wavelet functions, the density distributionn(x, y) can be decomposed as n(x, y) = nC(x, y) + nF(x, y).The 2D and 1D profiles (Fig. 7 (a, b)) demonstrate a clearcontrast between the bulk distribution of nC and the highlystructured distribution of nF . Each energy spectrum (Fig. 7(c)) shows the power-law scaling E(k) ∝ k−α with α = 5.5for nC , and α = 3 for nF over a wide domain in the wave-number space, which is consistent with the theoreticallyexpected index [7].
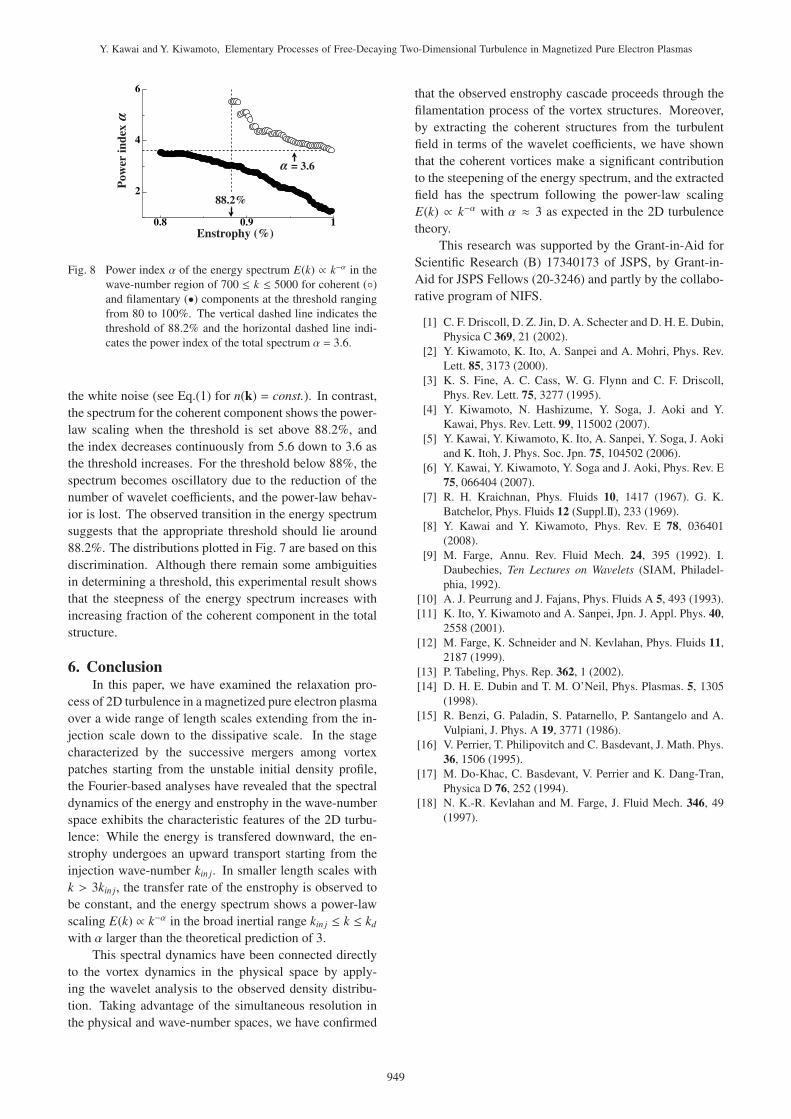
In the present study, we cannot determine an appro-priate threshold based on a definite criterion [18]. There-fore we carry out the separation with various trial valuesof threshold ranging from 80 to 100%, and compare theshapes of the spectra for the coherent and filamentary com-ponents. Comparison is made in Fig. 8 for each componentin terms of the power index α estimated from a linear least-square fit to log-log plot of the energy spectrum E(k) ∝ k−α
in the wave-number region of 700 ≤ k ≤ 5000.The slope of the spectrum for the filamentary com-
ponent varies continuously from the power index α = 3.6representing the total spectrum, down to 1 characterizing
948
Y. Kawai and Y. Kiwamoto, Elementary Processes of Free-Decaying Two-Dimensional Turbulence in Magnetized Pure Electron Plasmas
2
4
6
0.8 0.9 1
Pow
er i
nd
ex �
Enstrophy (%)
� = 3.6
88.2%
Fig. 8 Power index α of the energy spectrum E(k) ∝ k−α in thewave-number region of 700 ≤ k ≤ 5000 for coherent (◦)and filamentary (•) components at the threshold rangingfrom 80 to 100%. The vertical dashed line indicates thethreshold of 88.2% and the horizontal dashed line indi-cates the power index of the total spectrum α = 3.6.
the white noise (see Eq.(1) for n(k) = const.). In contrast,the spectrum for the coherent component shows the power-law scaling when the threshold is set above 88.2%, andthe index decreases continuously from 5.6 down to 3.6 asthe threshold increases. For the threshold below 88%, thespectrum becomes oscillatory due to the reduction of thenumber of wavelet coefficients, and the power-law behav-ior is lost. The observed transition in the energy spectrumsuggests that the appropriate threshold should lie around88.2%. The distributions plotted in Fig. 7 are based on thisdiscrimination. Although there remain some ambiguitiesin determining a threshold, this experimental result showsthat the steepness of the energy spectrum increases withincreasing fraction of the coherent component in the totalstructure.
6. ConclusionIn this paper, we have examined the relaxation pro-
cess of 2D turbulence in a magnetized pure electron plasmaover a wide range of length scales extending from the in-jection scale down to the dissipative scale. In the stagecharacterized by the successive mergers among vortexpatches starting from the unstable initial density profile,the Fourier-based analyses have revealed that the spectraldynamics of the energy and enstrophy in the wave-numberspace exhibits the characteristic features of the 2D turbu-lence: While the energy is transfered downward, the en-strophy undergoes an upward transport starting from theinjection wave-number kin j. In smaller length scales withk > 3kin j, the transfer rate of the enstrophy is observed tobe constant, and the energy spectrum shows a power-lawscaling E(k) ∝ k−α in the broad inertial range kin j ≤ k ≤ kdwith α larger than the theoretical prediction of 3.
This spectral dynamics have been connected directlyto the vortex dynamics in the physical space by apply-ing the wavelet analysis to the observed density distribu-tion. Taking advantage of the simultaneous resolution inthe physical and wave-number spaces, we have confirmed
that the observed enstrophy cascade proceeds through thefilamentation process of the vortex structures. Moreover,by extracting the coherent structures from the turbulentfield in terms of the wavelet coefficients, we have shownthat the coherent vortices make a significant contributionto the steepening of the energy spectrum, and the extractedfield has the spectrum following the power-law scalingE(k) ∝ k−α with α ≈ 3 as expected in the 2D turbulencetheory.
This research was supported by the Grant-in-Aid forScientific Research (B) 17340173 of JSPS, by Grant-in-Aid for JSPS Fellows (20-3246) and partly by the collabo-rative program of NIFS.
[1] C. F. Driscoll, D. Z. Jin, D. A. Schecter and D. H. E. Dubin,Physica C 369, 21 (2002).
[2] Y. Kiwamoto, K. Ito, A. Sanpei and A. Mohri, Phys. Rev.Lett. 85, 3173 (2000).
[3] K. S. Fine, A. C. Cass, W. G. Flynn and C. F. Driscoll,Phys. Rev. Lett. 75, 3277 (1995).
[4] Y. Kiwamoto, N. Hashizume, Y. Soga, J. Aoki and Y.Kawai, Phys. Rev. Lett. 99, 115002 (2007).
[5] Y. Kawai, Y. Kiwamoto, K. Ito, A. Sanpei, Y. Soga, J. Aokiand K. Itoh, J. Phys. Soc. Jpn. 75, 104502 (2006).
[6] Y. Kawai, Y. Kiwamoto, Y. Soga and J. Aoki, Phys. Rev. E75, 066404 (2007).
[7] R. H. Kraichnan, Phys. Fluids 10, 1417 (1967). G. K.Batchelor, Phys. Fluids 12 (Suppl.II), 233 (1969).
[8] Y. Kawai and Y. Kiwamoto, Phys. Rev. E 78, 036401(2008).
[9] M. Farge, Annu. Rev. Fluid Mech. 24, 395 (1992). I.Daubechies, Ten Lectures on Wavelets (SIAM, Philadel-phia, 1992).
[10] A. J. Peurrung and J. Fajans, Phys. Fluids A 5, 493 (1993).[11] K. Ito, Y. Kiwamoto and A. Sanpei, Jpn. J. Appl. Phys. 40,
2558 (2001).[12] M. Farge, K. Schneider and N. Kevlahan, Phys. Fluids 11,
2187 (1999).[13] P. Tabeling, Phys. Rep. 362, 1 (2002).[14] D. H. E. Dubin and T. M. O’Neil, Phys. Plasmas. 5, 1305
(1998).[15] R. Benzi, G. Paladin, S. Patarnello, P. Santangelo and A.
Vulpiani, J. Phys. A 19, 3771 (1986).[16] V. Perrier, T. Philipovitch and C. Basdevant, J. Math. Phys.
36, 1506 (1995).[17] M. Do-Khac, C. Basdevant, V. Perrier and K. Dang-Tran,
Physica D 76, 252 (1994).[18] N. K.-R. Kevlahan and M. Farge, J. Fluid Mech. 346, 49
(1997).
949
Y. Kawai and Y. Kiwamoto, Elementary Processes of Free-Decaying Two-Dimensional Turbulence in Magnetized Pure Electron Plasmas