Ejercicios trabajados en clases
12
ParametricPlot[{Cos[t], Sin[t]}, {t, 0, 2 π}] -1.0 -0.5 0.5 1.0 -1.0 -0.5 0.5 1.0 Plot 1 - x^2 , {x, - 1, 1} -1.0 -0.5 0.5 1.0 0.2 0.4 0.6 0.8 1.0
-
Upload
israel-garciia -
Category
Engineering
-
view
46 -
download
1
Transcript of Ejercicios trabajados en clases
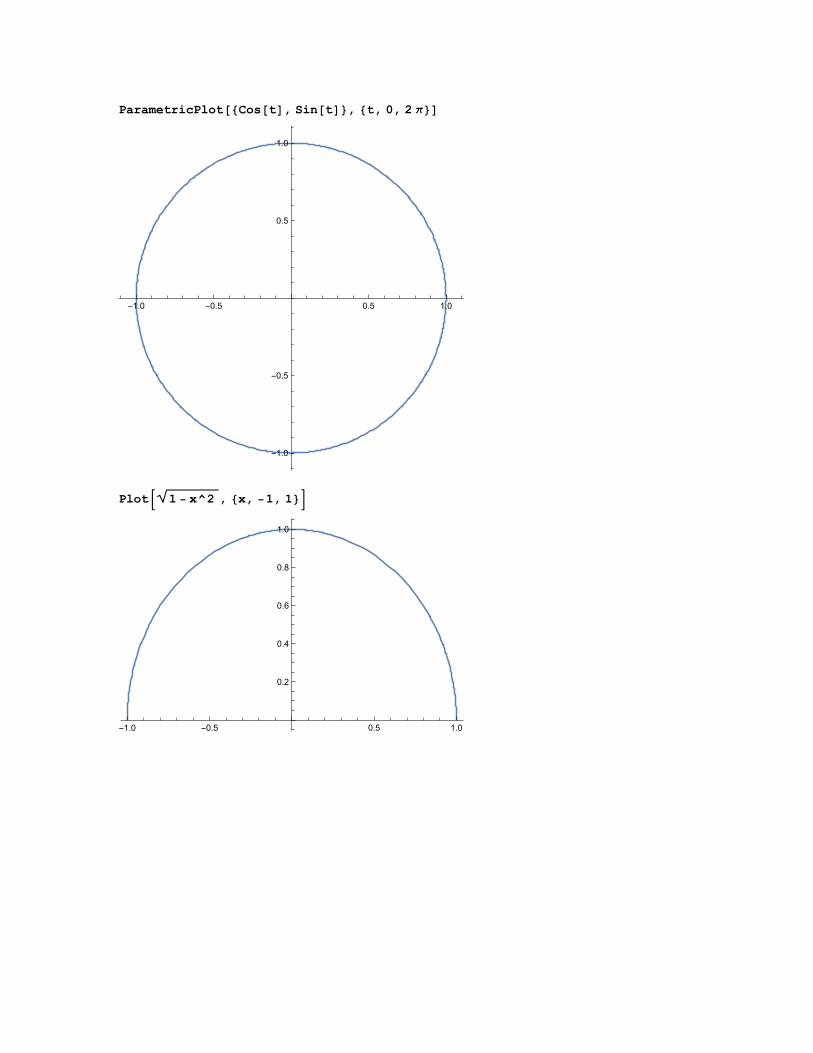
ParametricPlot[{Cos[t], Sin[t]}, {t, 0, 2 π}]
-1.0 -0.5 0.5 1.0
-1.0
-0.5
0.5
1.0
Plot 1 - x^2 , {x, -1, 1}
-1.0 -0.5 0.5 1.0
0.2
0.4
0.6
0.8
1.0
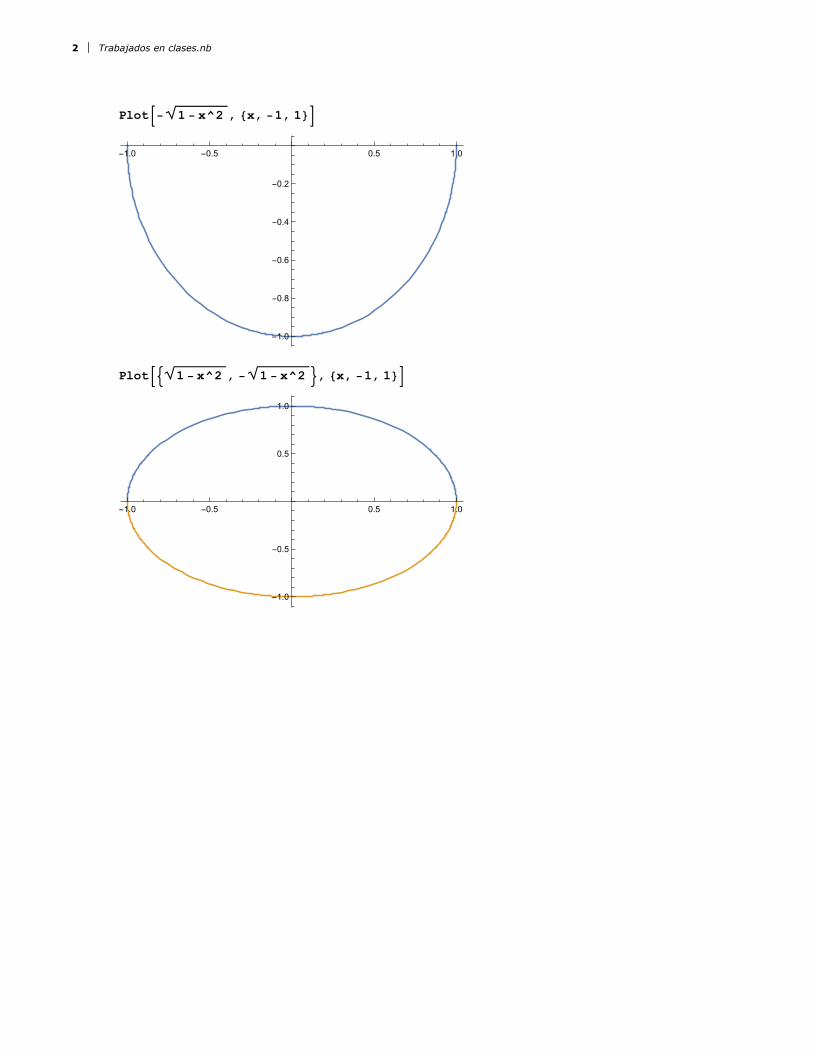
Plot- 1 - x^2 , {x, -1, 1}
-1.0 -0.5 0.5 1.0
-1.0
-0.8
-0.6
-0.4
-0.2
Plot 1 - x^2 , - 1 - x^2 , {x, -1, 1}
-1.0 -0.5 0.5 1.0
-1.0
-0.5
0.5
1.0
2 Trabajados en clases.nb
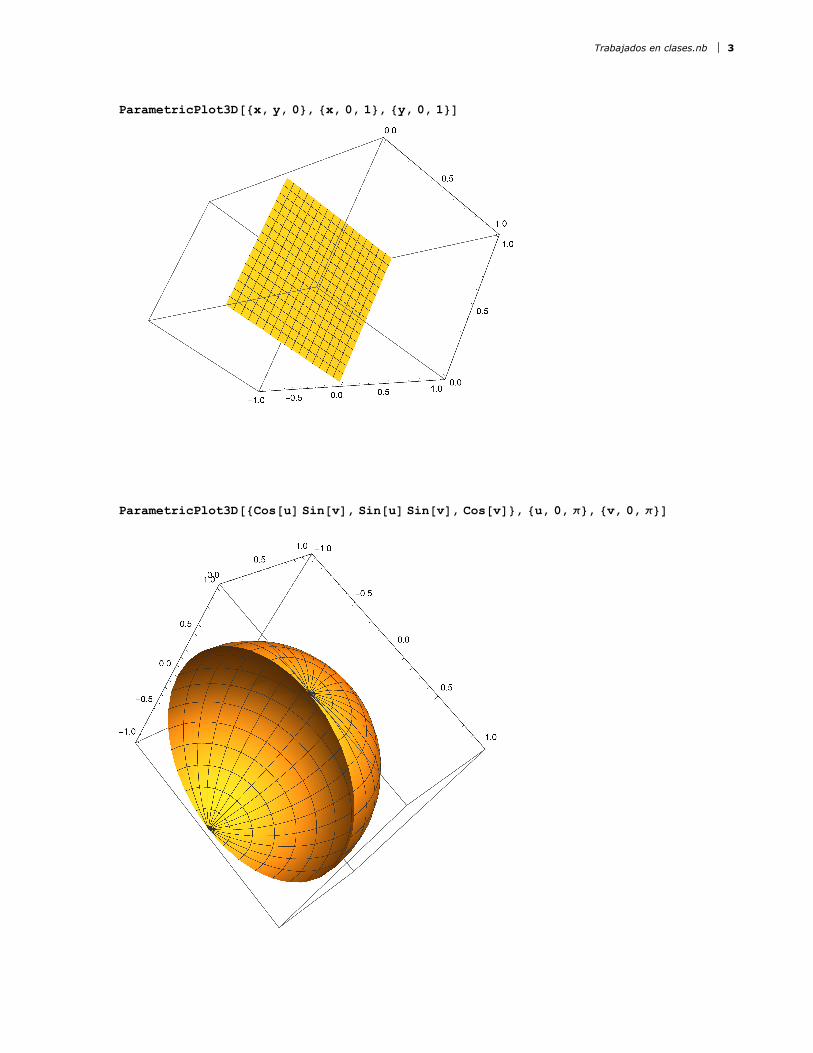
ParametricPlot3D[{x, y, 0}, {x, 0, 1}, {y, 0, 1}]
ParametricPlot3D[{Cos[u] Sin[v], Sin[u] Sin[v], Cos[v]}, {u, 0, π}, {v, 0, π}]
Trabajados en clases.nb 3
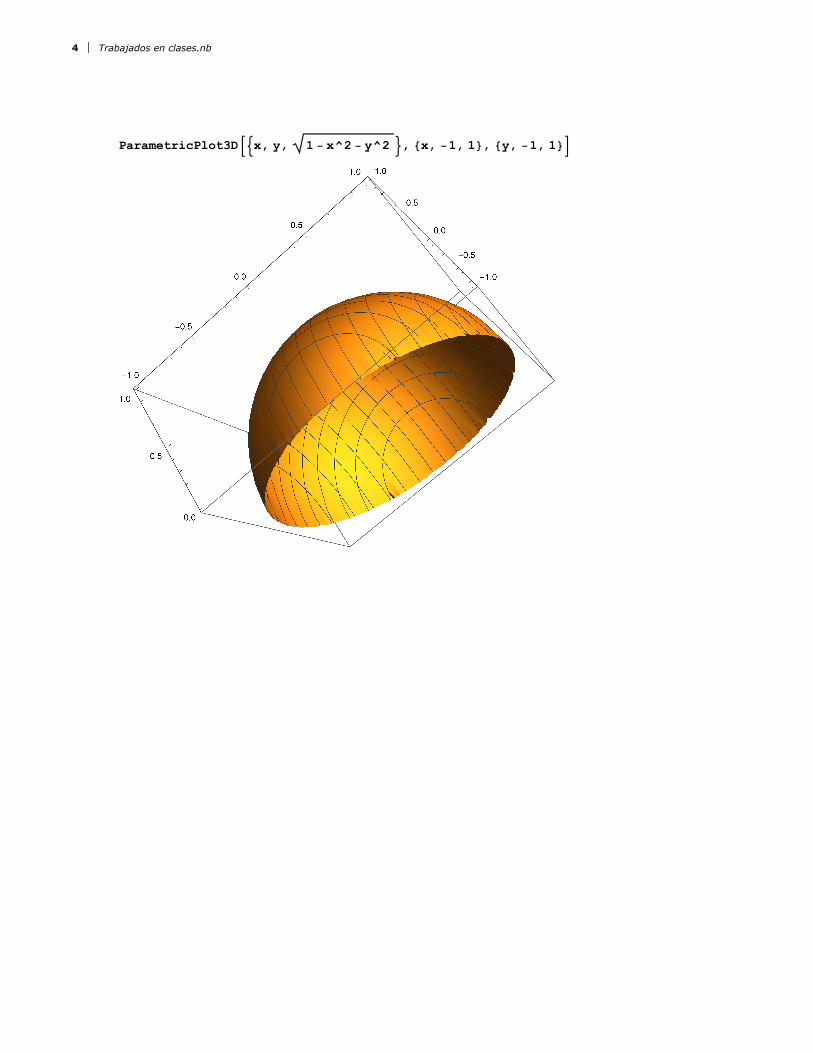
ParametricPlot3Dx, y, 1 - x^2 - y^2 , {x, -1, 1}, {y, -1, 1}
4 Trabajados en clases.nb
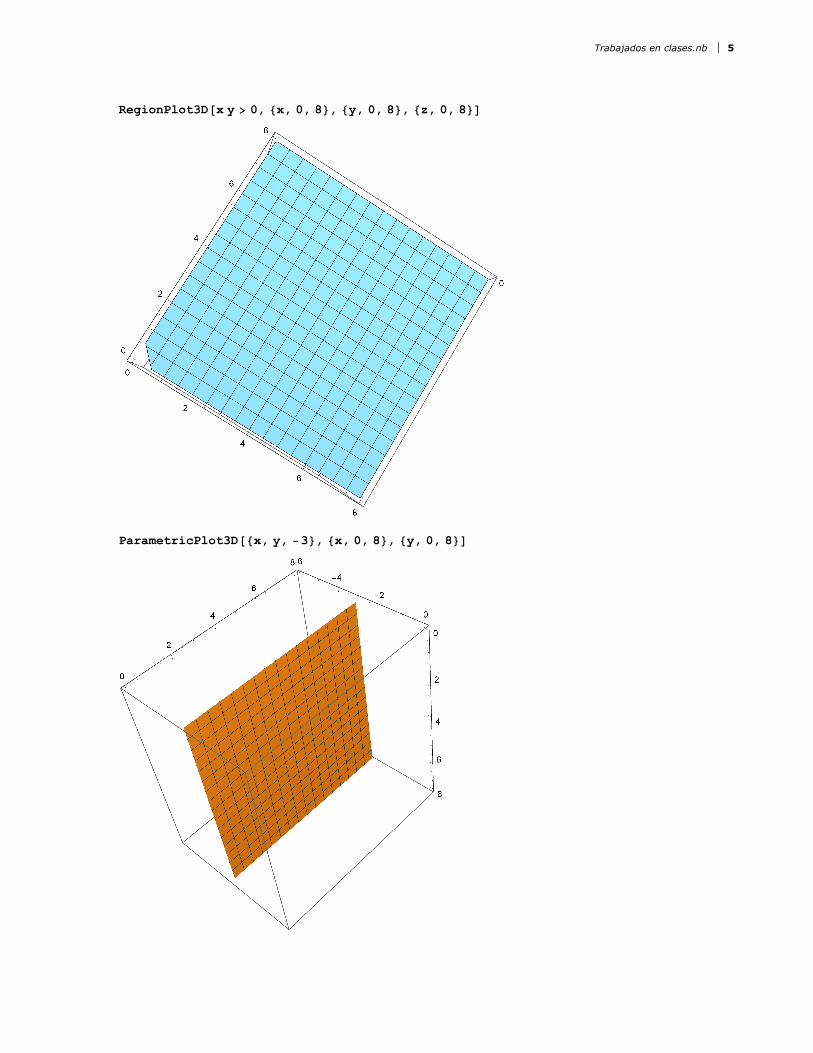
RegionPlot3D[x y > 0, {x, 0, 8}, {y, 0, 8}, {z, 0, 8}]
ParametricPlot3D[{x, y, -3}, {x, 0, 8}, {y, 0, 8}]
Trabajados en clases.nb 5
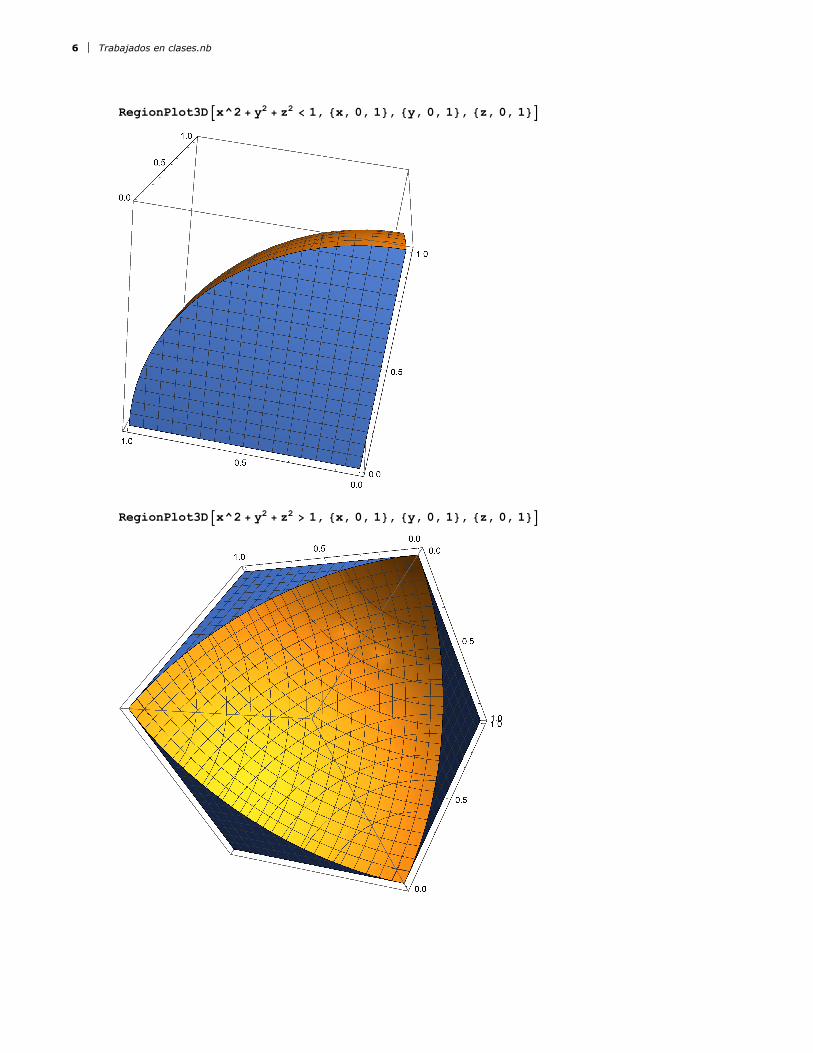
RegionPlot3Dx^2 + y2 + z2 < 1, {x, 0, 1}, {y, 0, 1}, {z, 0, 1}
RegionPlot3Dx^2 + y2 + z2 > 1, {x, 0, 1}, {y, 0, 1}, {z, 0, 1}
6 Trabajados en clases.nb
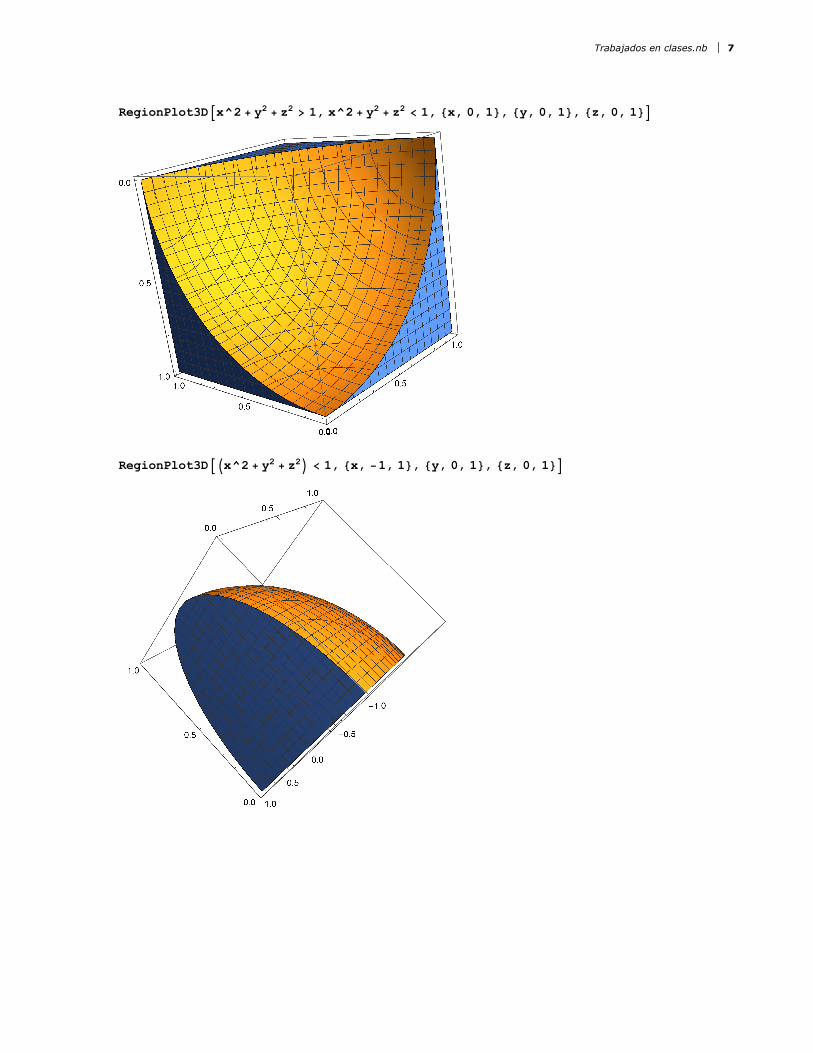
RegionPlot3Dx^2 + y2 + z2 > 1, x^2 + y2 + z2 < 1, {x, 0, 1}, {y, 0, 1}, {z, 0, 1}
RegionPlot3Dx^2 + y2 + z2 < 1, {x, -1, 1}, {y, 0, 1}, {z, 0, 1}
Trabajados en clases.nb 7
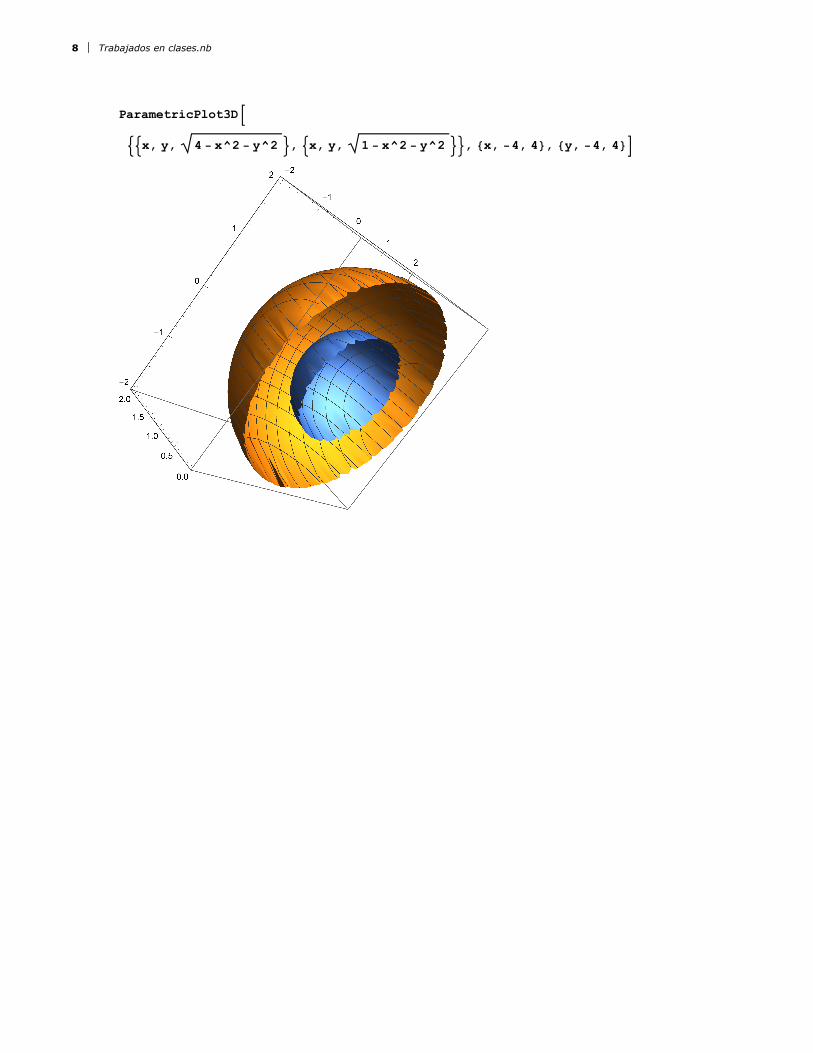
ParametricPlot3D
x, y, 4 - x^2 - y^2 , x, y, 1 - x^2 - y^2 , {x, -4, 4}, {y, -4, 4}
8 Trabajados en clases.nb
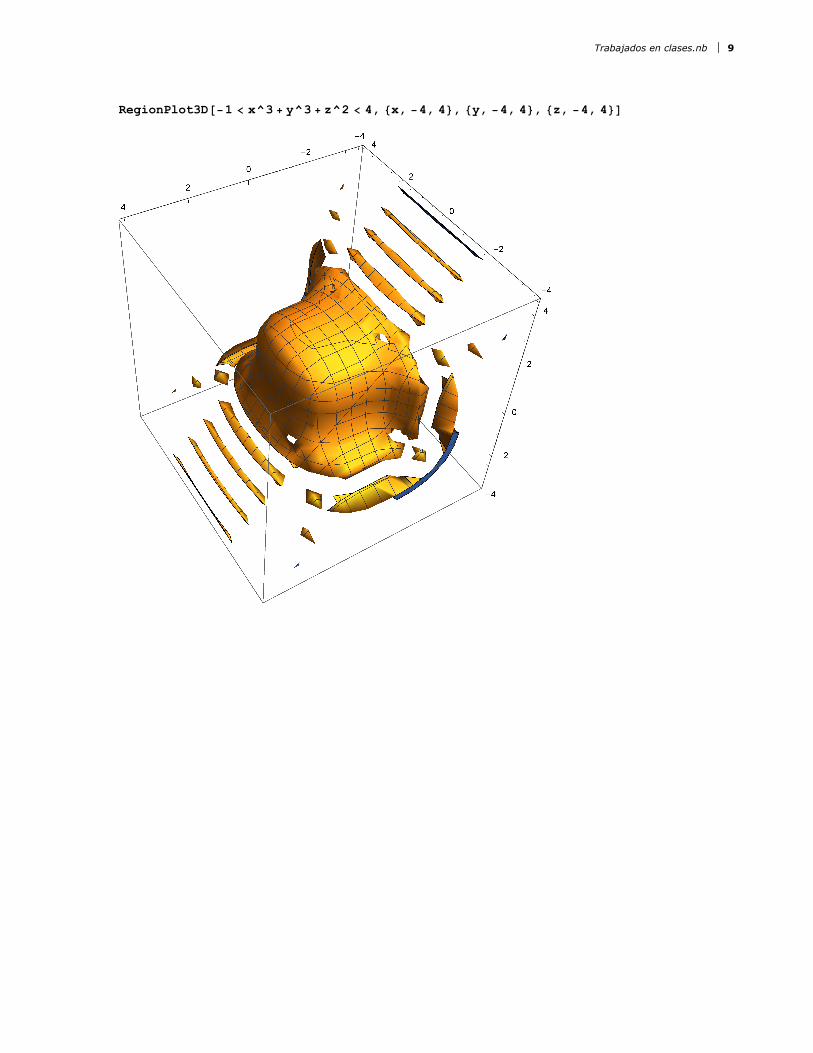
RegionPlot3D[-1 < x^3 + y^3 + z^2 < 4, {x, -4, 4}, {y, -4, 4}, {z, -4, 4}]
Trabajados en clases.nb 9
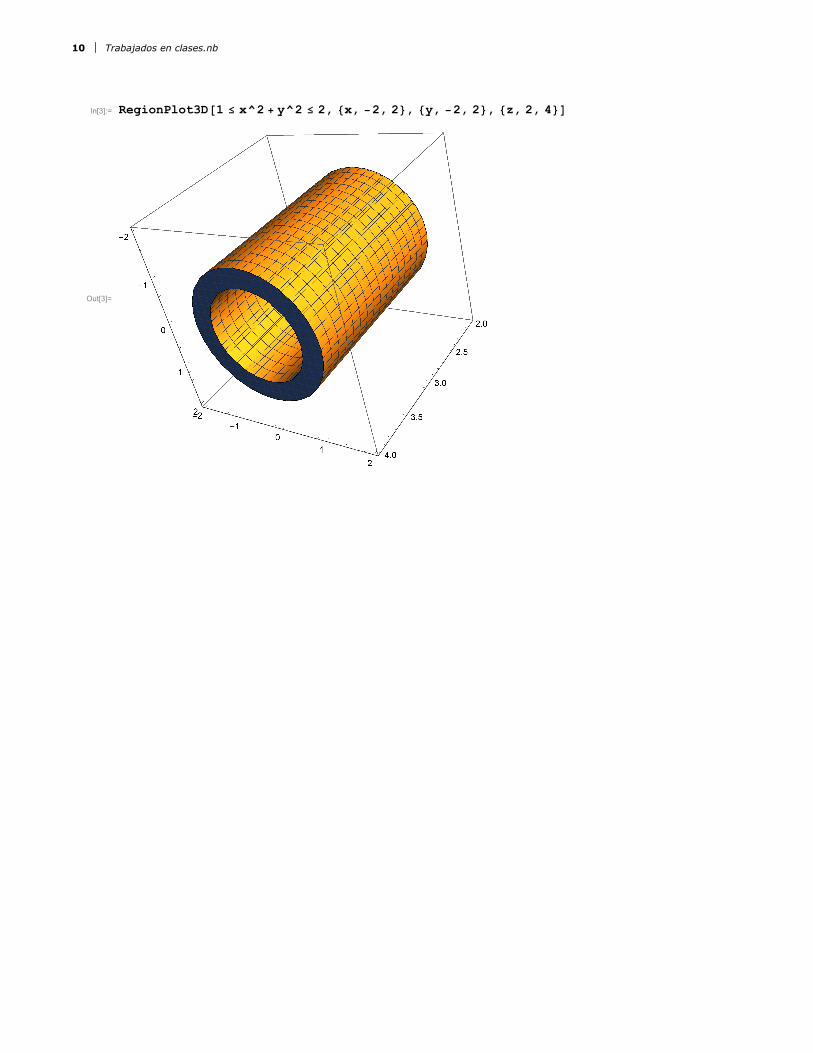
In[3]:= RegionPlot3D[1 ≤ x^2 + y^2 ≤ 2, {x, -2, 2}, {y, -2, 2}, {z, 2, 4}]
Out[3]=
10 Trabajados en clases.nb
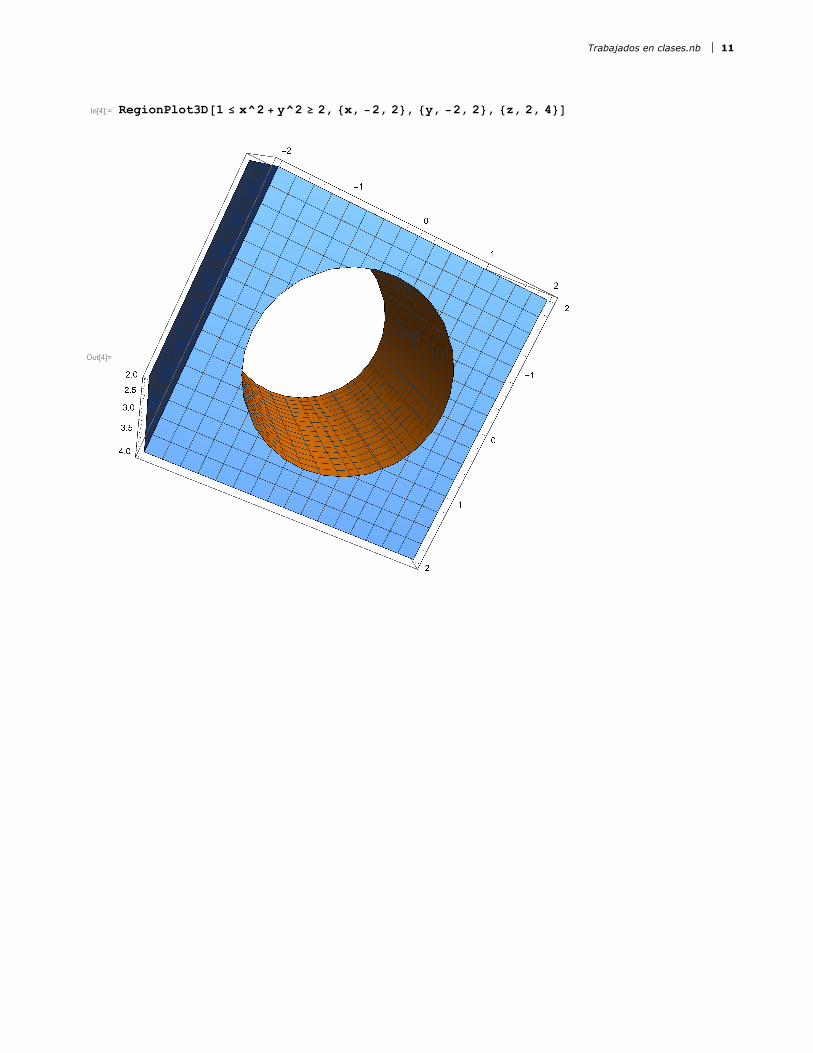
In[4]:= RegionPlot3D[1 ≤ x^2 + y^2 ≥ 2, {x, -2, 2}, {y, -2, 2}, {z, 2, 4}]
Out[4]=
Trabajados en clases.nb 11
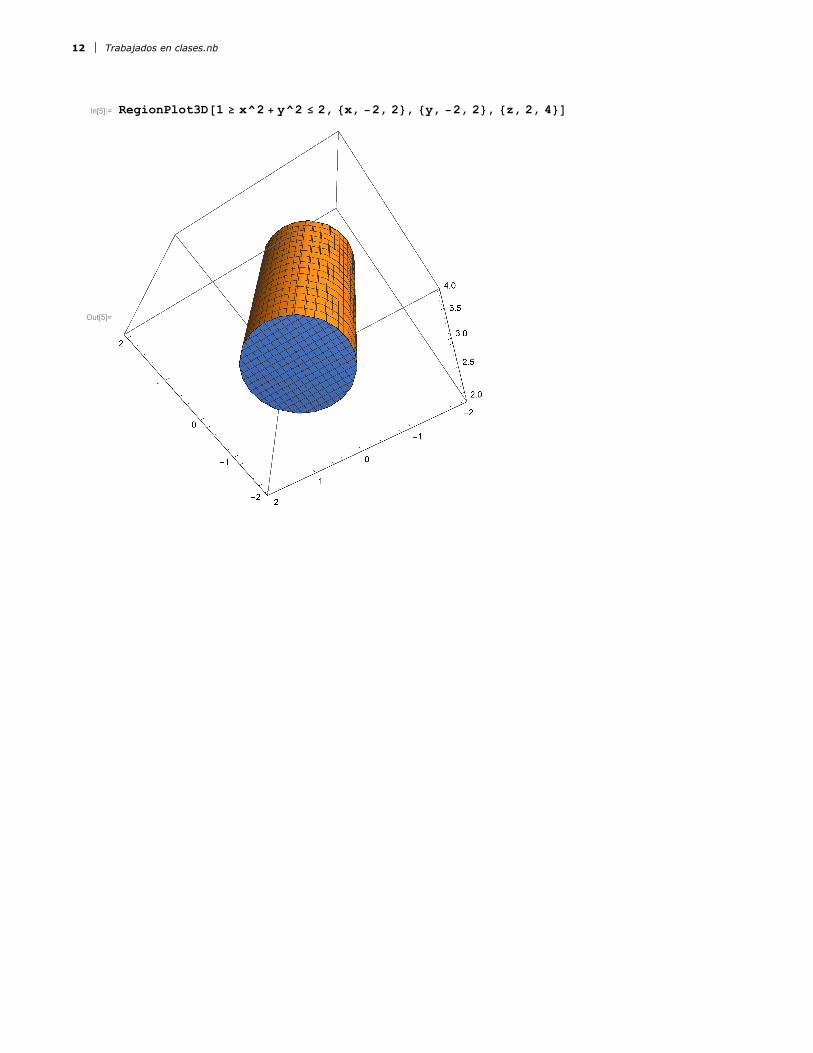
In[5]:= RegionPlot3D[1 ≥ x^2 + y^2 ≤ 2, {x, -2, 2}, {y, -2, 2}, {z, 2, 4}]
Out[5]=
12 Trabajados en clases.nb