Efficient Irrigation Agricultural Urban Management Tools ... file. Efficient Irrigation
92
www.irrigation-management.eu Efficient Irrigation Management Tools for Agricultural Cultivations and Urban Landscapes IRMA Efficient irrigation Αποτελεσματική άρδευση Ιrrigazione efficienti PART I – open field crops WP2, Action 2.4., Deliverable 2 V1 1
Transcript of Efficient Irrigation Agricultural Urban Management Tools ... file. Efficient Irrigation
www.irrigation-management.eu
Efficient Irrigation Management Tools for Agricultural Cultivations and Urban Landscapes IRMA
Efficient irrigation Αποτελεσματική άρδευση Ιrrigazione efficienti PART I – open field crops
WP2, Action 2.4., Deliverable 2
V1 1

Front page back [intentionally left blank]
2
IRMA info
European Territorial Cooperation Programmes (ETCP)
GREECE-ITALY 2007-2013
www.greece-italy.eu
Efficient Irrigation Management Tools for Agricultural Cultivations
and Urban Landscapes (IRMA)
www.irrigation-management.eu
3
IRMA partners
LP, Lead Partner, TEIEP
Technological Educational Institution of Epirus
http://www.teiep.gr, http://research.teiep.gr
P2, AEPDE
Olympiaki S.A., Development Enterprise of the Region of Western Greece
http://www.aepde.gr
P3, INEA / P7, CRea
Ιnstituto Nazionale di Economia Agraria
http://www.inea.it
P4, ISPA-CNR
Consiglio Nazionale delle Ricerche - Istituto di Scienze
delle Produzioni Alimentari
http://www.ispa.cnr.it/
P5, ROP
Regione di Puglia
http://www.regione.puglia.it
P6, ROEDM
Decentralised Administration of Epirus–Western
Macedonia
http://www.apdhp-dm.gov.gr
4
WP2, Action 2.4. Efficient irrigation management
PART I – open field crops (Deliverable 2.4.2.)
Involved partners:
TEIEP (LP)
Authoring team:
Dr. Malamos Nicolaos
Dr. Mamasis Nicolaos
Mrs. Fotia Konstantina
Mr. Triantos Sotirios
Place and time: Arta, 2015
European Territorial Cooperation Programmes (ETCP) GREECE-ITALY 2007-2013 www.greece-italy.eu
www.irrigation-management.eu
Efficient Irrigation Management Tools for Agricultural Cultivations and Urban Landscapes (IRMA)
5
Publication info
WP2: Information & Publicity
Action 2.4. Efficient irrigation management PART I – open field crops (Deliverable 2.4.2.)
The work that is presented in this ebook has been co-
financed by EU / ERDF (75%) and national funds of Greece
and Italy (25%) in the framework of the European
Territorial Cooperation Programme (ETCP) GREECE-ITALY
2007-2013 (www.greece-italy.eu): IRMA project
(www.irrigation-management.eu), subsidy contract no:
I3.11.06.
© This open access ebook is published under the
Creative Commons Attribution Non-Commercial
(CC BY-NC) license and is freely accessible online to
anyone.
6
Contents
Introduction ............................................................................................................................. 11
Irrigation in Greece and Italy - forming the context and the concept of IRMA project...................... 13
Water governance .................................................................................................................... 15
The EU Water Framework Directive ........................................................................................ 18
Application of WFD and irrigation water governance in Greece ................................................. 20
Application of WFD and irrigation water governance in Italy ..................................................... 27
Efficient use of water and Irrigation efficiency ............................................................................. 32
Irrigation efficiency, Water productivity and Water savings ...................................................... 34
Efficiency at basin and scheme level ....................................................................................... 37
Efficiency at end-user level .................................................................................................... 40
Tools for achieving, maintaining and improving water use efficiency and irrigation application
efficiency ................................................................................................................................. 44
Water Use Efficiency or Water Productivity, a benchmarking indicator ...................................... 47
Irrigation Application Efficiency, an auditing indicator .............................................................. 50
Water use efficiency for open field crops .................................................................................... 53
Olive .................................................................................................................................... 55
Kiwifruit ............................................................................................................................... 63
Citrus ................................................................................................................................... 67
EIP Water ................................................................................................................................. 73
Conclusions, proposals and future trends .................................................................................... 77
References ............................................................................................................................... 79
Αποτελεσματική άρδευση - Σύνοψη στην ελληνική γλώσσα ......................................................... 87
Διακυβέρνηση ...................................................................................................................... 87
Αποτελεσματικότητα ............................................................................................................. 87
Άρδευση στην Ελλάδα ........................................................................................................... 87
Συμπεράσματα ..................................................................................................................... 89
7
Tables
Table 1 Expected application efficiency for agricultural applications (Brouwer and Prins, 1989) ....... 42
Table 2 Various expressions of Water Use Efficiency and Water Productivity ................................. 49
Table 3 Summary of recommended olive Kc values (Fereres et al., 2011) ....................................... 58
Table 4 Crop coefficients for a mature microjet irrigated kiwifruit (Hayward) orchard grown in the
Northern Hemisphere (N 40° 23’ E 16° 45’) (seasonal irrigation volume = 10 012 m3/ha). Note that the
whole soil surface area was wetted and the soil was not tilled. ..................................................... 65
Table 5 Single (time-averaged) crop coefficients, Kc, for non-stressed, well-managed crops in subhumid
climates (RHmin<45%, u2<2 m s-1) for use with the FAO Penman-Monteith ETo (Allen et al., 1998) .... 69
Table 6 Applied water (irrigation and rainfall) and water use efficiency for orange orchards in Valencia,
Spain (Castel et al., 1987). Average values for the period 1981-1984 (4 years) ................................ 69
Table 7 3 years average applied water volume and fruit yield for two orange cultivars at Cordoba, Spain
(Gracia Tejero et al., 2011) ......................................................................................................... 70
Figures
Fig. 1 Availability of water resources on earth ............................................................................. 11
Fig. 2 Water connections (IA, 2013) ............................................................................................ 12
Fig. 3 The IRMA project area (Google Maps) ................................................................................ 14
Fig. 4 Multi-level water governance framework (OECD, 2015 (original source: OECD, 2011. Water
Governance in OECD: A Multi-Level Approach, OECD Publishing, Paris) ......................................... 15
Fig. 5 OECD principles on water governance and the relevant cycle (OECD, 2015) ........................... 17
Fig. 6 Water governance cycle (OECD, 2015) ............................................................................... 18
Fig. 7 The front page of WFD official web page (EU, 2015) ............................................................ 19
Fig. 8 Governmental Gazette No. A 280 9/12/2003, where law 3199/2003 was published. .............. 20
Fig. 9 Hydrological apportionment of Greece (the 14 Regional Water Districts (RWDs))................... 21
Fig. 10 The front page of the Regional Water Management Plan of Epirus (2013) ........................... 22
Fig. 11 Indicative photos of Local Organization of Land Reclamation infrastructure: (a) offices and
machinery yard (LOLR of Louros, Arta, Greece) and b) Pump station (Iliovounia, Preveza, Greece) ... 23
Fig. 12 Indicative photos of Local Organization of Land Reclamation infrastructure: (c) surface water
reservoir and gates (Purnari II dam, Arta, Greece), d) cement covered irrigation channe (Kalovatos,
Arta, Greece) and e) drainage ditch (Messolonghi, Greece). .......................................................... 24
Fig. 13 Hydrological Regions (red borders), River Basin Authorities territory (black borders) and River
Basin District territory (colored) in Italy (Italian Ministry of Environment, 2009) ............................. 28
8
Fig. 14 An indicative activities report of an Italian Consorzio di Bonifica (Consorzio Brenta, 2015) ... 30
Fig. 15 Assessment levels and sectors ......................................................................................... 32
Fig. 16 Variability of priorities and concerns among the various levels ........................................... 33
Fig. 17 Typical beneficial and non-beneficial water use (respectively BWU and N-BWU) in crop and
landscape irrigation (left) and relevant schematics with reference to reuse of recycling (right) (Pereira
et al., 2012) .............................................................................................................................. 34
Fig. 18 Processes influencing irrigation efficiency off- and on-farm: grey boxes are the processes leading
to the crop yield; white boxes are those leading to water wastes and losses (Pereira et al., 2012) ... 35
Fig. 20 Surface irrigation of onions (furrow system) ..................................................................... 40
Fig. 21 Sprinkler irrigation for turfgrass (rotor pop-up sprinklers in a golf field) ............................... 41
Fig. 22 The right thing: a droplet of water -having almost zero relevant pressure- leaves the dripper41
Fig. 23 Micro irrigation of tomatoes (drippers in hydroponic greenhouse) ..................................... 42
Fig. 24 Framework of performance assessment of irrigation and drainage schemes (Bos et al., 2005)
............................................................................................................................................... 46
Fig. 25 The way to optimum efficiency (opIRIS, 2015) ................................................................... 47
Fig. 26 Screenshot from UKIA’s benchmarking tool (UKIA, 2015) ................................................... 48
Fig. 27 Catch-cans from a micro-irrigation audit ........................................................................... 51
Fig. 28 Distribution of olive trees around the Mediterranean Sea, average yield for 2005-2013
(FAOSTAT, 2015) ....................................................................................................................... 55
Fig. 29 Irrigated (a) and non-irrigated olive orchards at Salento (Italy) ........................................... 56
Fig. 30 Occurrence and duration of main phenological stages of olive trees during the growing season
(n). Flower bud induction occurs during the summer of the previous year (n-1). Shoot and leaf
development are often inhibited by high temperatures and water deficit during the summer (vertical
shading) (Sans-Cortes et al., 2002). ............................................................................................. 57
Fig. 31 Yield response to irrigation (Michelakis, 1990) .................................................................. 59
Fig. 32 Relative yield and gross revenue of table olives under deficit irrigation (Goldhamer et al., 1994).
............................................................................................................................................... 60
Fig. 33 Fruit and oil yield in 2003 and 2004. Each histogram represents the average of eight trees.
(Moriana et al., 2007) ................................................................................................................ 61
Fig. 34 Kiwifruit areas around the Mediterranean Sea, average yield for 2005-2013 (FAOSTAT, 2015)
............................................................................................................................................... 63
Fig. 35 Typical view of a young kiwifruit setup in Arta (Greece). Plant’s distance is normally 4-4.5m
(625-500 trees ha-1) and irrigation system consists of hanging 120 LPH micro sprinklers (one per plant)
............................................................................................................................................... 64
9
Fig. 36 Citrus trees – total, areas around the Mediterranean Sea, average yield for 2005-2013
(FAOSTAT, 2015) ....................................................................................................................... 67
Fig. 37 Orange groove of the local variety “Common of Arta” at Arta (Greece) ............................... 68
Fig. 38 EIP Water priorities......................................................................................................... 73
Equations
Eq. 1 A generic equation for expressing Water Use Efficient ......................................................... 49
Eq. 2 The economic productivity indicator (EPI) ........................................................................... 49
Eq. 3 A generic equation for expressing Irrigation Application Efficiency ........................................ 50
Eq. 3 FAO’s model for the relationship between crop yield and water use (Doorenbos and Kassam,
1979) ....................................................................................................................................... 53
Notes
10
Introduction
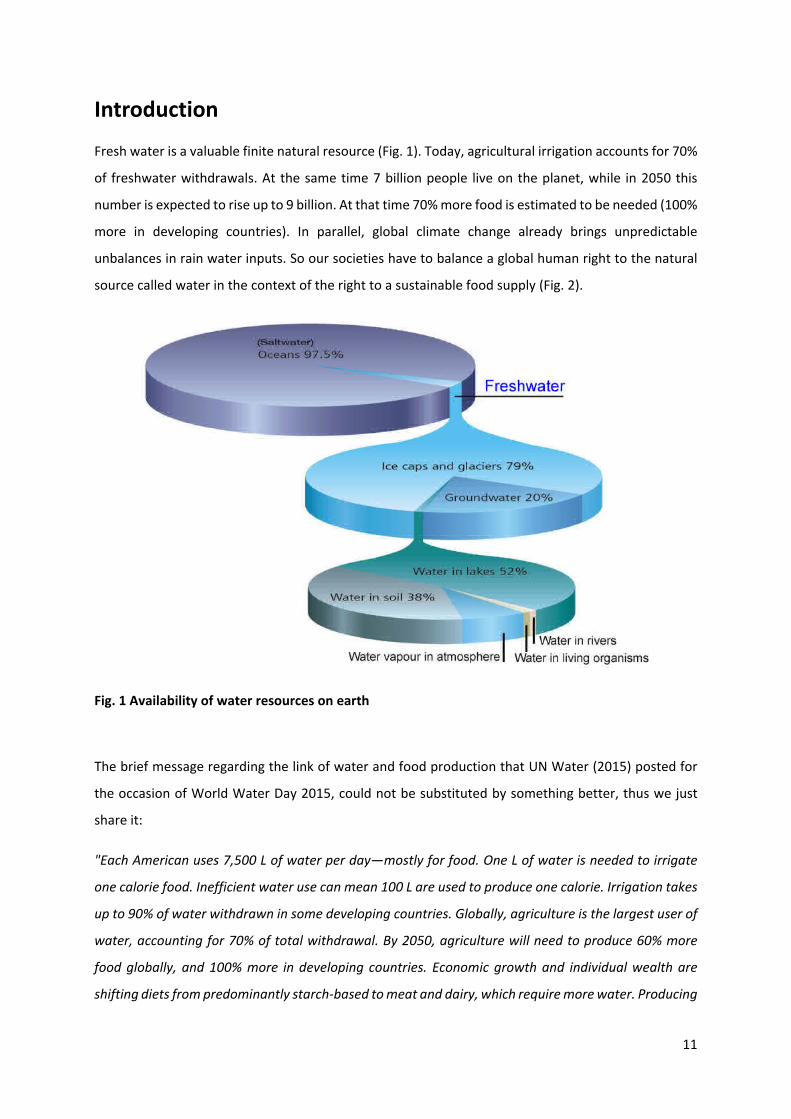
Fresh water is a valuable finite natural resource (Fig. 1). Today, agricultural irrigation accounts for 70%
of freshwater withdrawals. At the same time 7 billion people live on the planet, while in 2050 this
number is expected to rise up to 9 billion. At that time 70% more food is estimated to be needed (100%
more in developing countries). In parallel, global climate change already brings unpredictable
unbalances in rain water inputs. So our societies have to balance a global human right to the natural
source called water in the context of the right to a sustainable food supply (Fig. 2).
Fig. 1 Availability of water resources on earth
The brief message regarding the link of water and food production that UN Water (2015) posted for
the occasion of World Water Day 2015, could not be substituted by something better, thus we just
share it:
"Each American uses 7,500 L of water per day—mostly for food. One L of water is needed to irrigate
one calorie food. Inefficient water use can mean 100 L are used to produce one calorie. Irrigation takes
up to 90% of water withdrawn in some developing countries. Globally, agriculture is the largest user of
water, accounting for 70% of total withdrawal. By 2050, agriculture will need to produce 60% more
food globally, and 100% more in developing countries. Economic growth and individual wealth are
shifting diets from predominantly starch-based to meat and dairy, which require more water. Producing
11
1 kilo rice, for example, requires about 3,500 L of water, while 1 kilo of beef some 15,000 L. This shift in
diet is the greatest to impact on water consumption over the past 30 years, and is likely to continue
well into the middle of the twenty-first century. The current growth rates of agricultural demands on
the world’s freshwater resources are unsustainable. Inefficient use of water for crop production
depletes aquifers, reduces river flows, degrades wildlife habitats, and has caused salinization of 20% of
the global irrigated land area. To increase efficiency in the use of water, agriculture can reduce water
losses and, most importantly, increase crop productivity with respect to water. With increased intensive
agriculture, water pollution may worsen. Experience from high income countries shows that a
combination of incentives, including more stringent regulation, enforcement and well-targeted
subsidies, can help reduce water pollution."
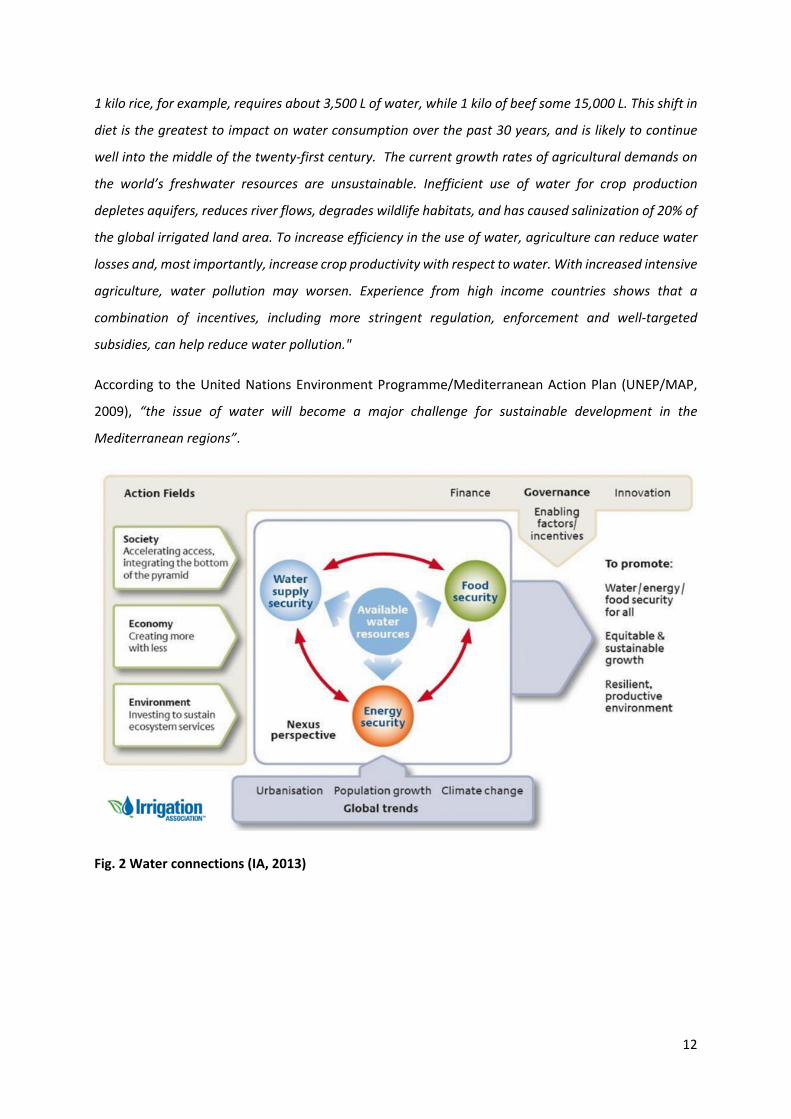
According to the United Nations Environment Programme/Mediterranean Action Plan (UNEP/MAP,
2009), “the issue of water will become a major challenge for sustainable development in the
Mediterranean regions”.
Fig. 2 Water connections (IA, 2013)
12
Irrigation in Greece and Italy - forming the context and the
concept of IRMA project
In Greece, the total area of arable land and permanent crops is about 3 and 3.5 Mha (EEA, 2014; FAO-
Aquastat, 2015a) and almost 40% of it is irrigated (FAO-Aquastat, 2014a) consuming about 7,000 hm3
(70-80%) of water per year (OECD, 2008; FAO-Aquastat, 2014a). These facts do not include irrigation
of urban and recreational landscapes.
Due to uneven rainfall distribution or no rainfall and because a large part of the Greek agricultural
production is planted, grown, and marketed during spring, summer and fall (normally the driest part
of the year according to the Mediterranean climate), growers of high-per-hectare-value crops find it
almost mandatory to provide supplemental irrigation for successful crop production. Besides
preventing crop-water stress, irrigation systems are used to protect the crop against heat and cold and
to apply fertilizers and pesticides.
Common irrigation sources are the underground water as well as the surface water through rivers,
lakes or reservoirs. Additionally irrigation needs for urban and recreational landscapes are consistently
increased over the last years, as more people migrate to cities. Moreover, commercial and housing
development expanded very rapidly up to 2010 while the tourist industry is under constant rise.
Turfgrass (most varieties are notorious for their great water needs) remains the most common
groundcover plant for all these cases.
Common sources of water for urban irrigation vary from shallow wells to water utilities. Some small
amounts of treated municipal wastewaters are also used for irrigation purposes (irrigation of hotel
green zones, municipal landscapes).
According to the literature findings (Karamanos et al., 2005), surface irrigation methods cover about
7% of the irrigated area while sprinkler and drip irrigation covered 49% and 44% respectively.
In Italy, the total area of arable land and permanent crops is between 9 and 9.5 Mha (EEA, 2014; FAO-
Aquastat, 2014b). One third (2.7 Mha) of the total agricultural area is irrigated (Bartolini et al., 2010;
Lupia, 2013). The irrigated area is very heterogeneous between the regions, ranging from 6%
(Toscana) to 56% (Lombardia). Agriculture uses almost 67% of the total amount of the available water
(Massarutto, 2013). The most common irrigated crops are grain maize, rotational forages, vineyards,
fruit and berry plantations (Lupia, 2013). The main water sources are surface and underground water.
In 2003, 329,032 farms were irrigated from the Irrigation and Land Reclamation Consortia while
397,199 farms were irrigated by other ways like self-supply etc. (Lupia, 2013). The underground
13
resources contribute at an average of 25% nationally and almost 50% in some regions (Massarutto,
2013).
The great majority (76%) of irrigated farms use only one type of irrigation system (Massarutto, 2013).
In 2007 the most used irrigation method was the sprinkler one covering about 37% of the total irrigated
area of Italy, while surface irrigation (borders, furrows) ranged at the second place covering about 31%
of that area and micro-irrigation in the third place covering 21.4% of the total irrigation area. However,
in the southern regions of Italy like Puglia, where the climate is dry, micro-irrigation covered more than
50% of the irrigated area (Lupia, 2013; Massarutto, 2013).
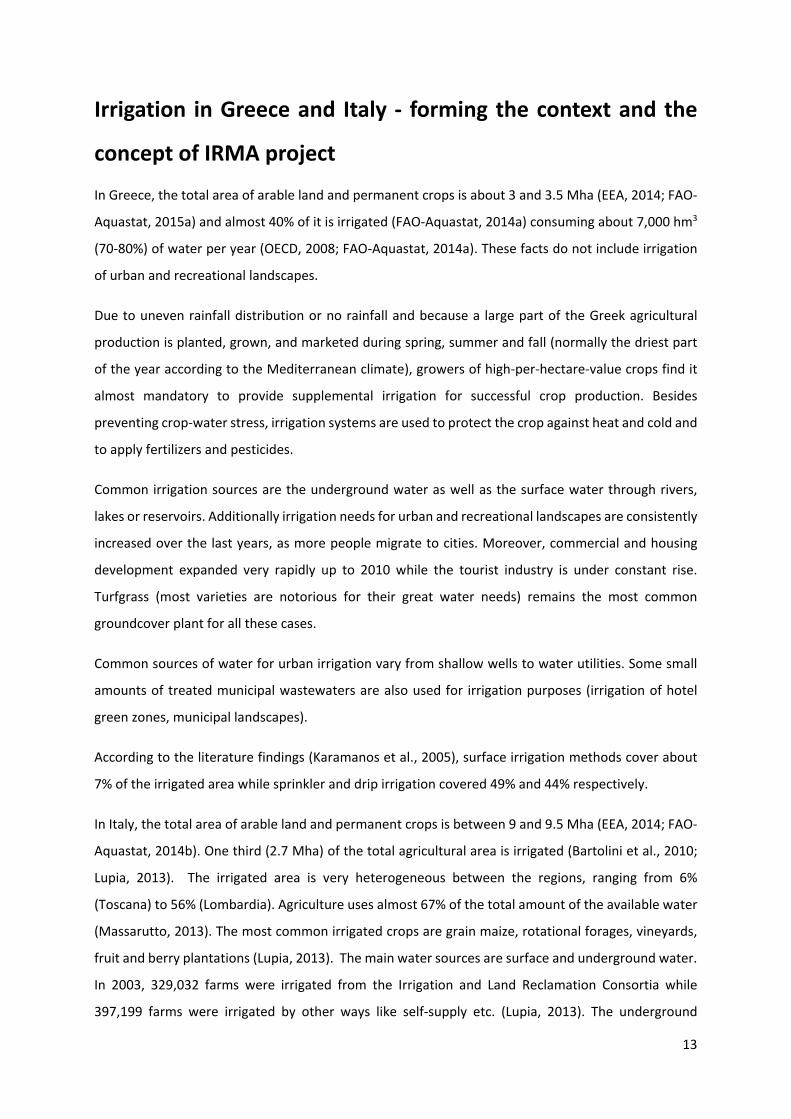
Fig. 3 The IRMA project area (Google Maps)
The IRMA project is applied in the Region of Apoulia (Italy) and the Regions of Epirus and Western
Greece (Greece) (Fig. 3). The project concept states that within the given infrastructure, agricultural
(open field or under cover) and landscape, irrigation and drainage systems efficiency could be
increased promptly, if their design, installation and maintenance received regular auditing procedures
and more reasonable water management was applied.
In this framework the present deliverable is an effort to present irrigation efficiency issues at end-user
level.
14
Water governance
A very recent (2015) publication of The Organisation for Economic Co-operation and Development
(OECD) states that very significant global issues are linked to water management (over-abstraction and
contamination of aquifers, aged water related infrastructure etc.), which require to act as efficiently
as possible when handling this natural resource.
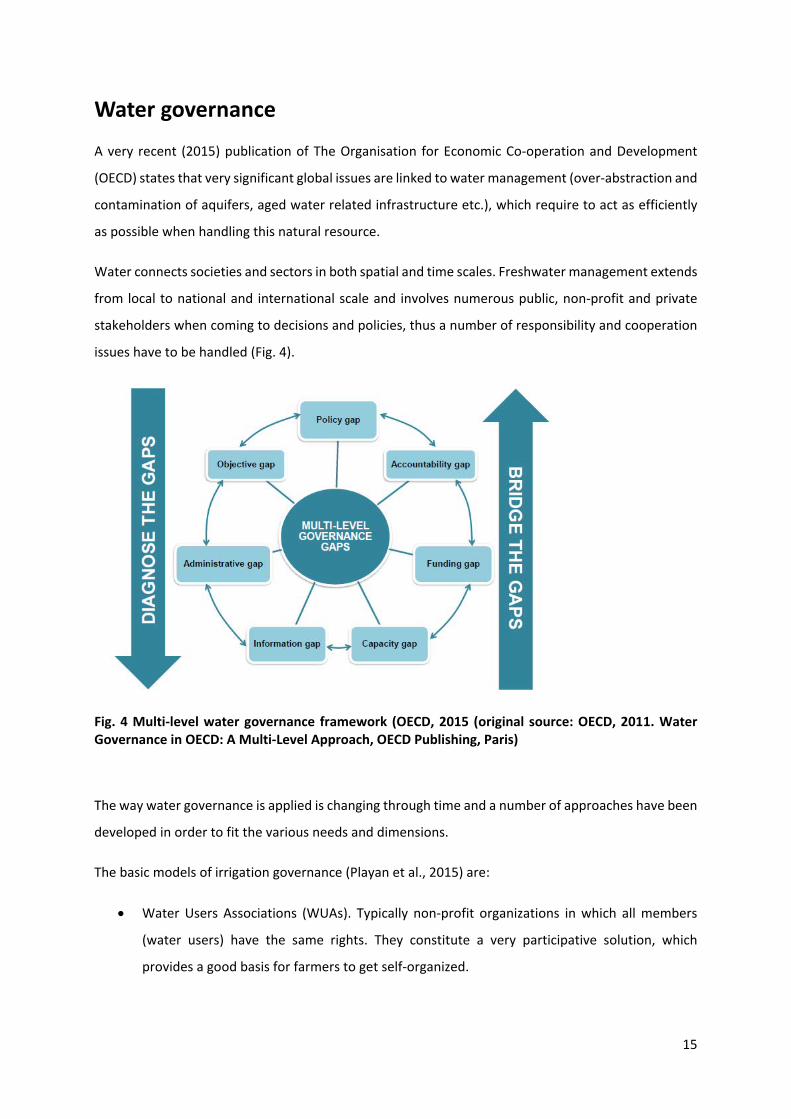
Water connects societies and sectors in both spatial and time scales. Freshwater management extends
from local to national and international scale and involves numerous public, non-profit and private
stakeholders when coming to decisions and policies, thus a number of responsibility and cooperation
issues have to be handled (Fig. 4).
Fig. 4 Multi-level water governance framework (OECD, 2015 (original source: OECD, 2011. Water Governance in OECD: A Multi-Level Approach, OECD Publishing, Paris)
The way water governance is applied is changing through time and a number of approaches have been
developed in order to fit the various needs and dimensions.
The basic models of irrigation governance (Playan et al., 2015) are:
• Water Users Associations (WUAs). Typically non-profit organizations in which all members
(water users) have the same rights. They constitute a very participative solution, which
provides a good basis for farmers to get self-organized.
15
• Public Administration and farmers’ organizations. They act as interface between private and
public / state organizations. When the state completely rules the irrigated area, the
performance is typically low.
• Cooperatives and other participative societies. This approach is used in different parts of the
world with variable results. A potential limitation is that membership is voluntary and thus
some farmers may not be interested in joining.
• Local entities. In some countries local public intervention in irrigation development has
resulted in a strong identification between the village and irrigation governance.
• Private companies. Companies can respond to the inefficiencies of public governance. They
often represent the will to extend urban water services to irrigation water governance. They
could also be associated to “Build, Operate and Transfer” (BOT) schemes of irrigation system
development
The commonly accepted water governance principles are the following (Playan et al., 2015):
• Transparency. This involves implementation of clear management procedures and
professionalization of internal services.
• Participation. This includes differentiation between the directive and executive function and
promotion of users’ involvement in committees under the overall concept of participatory
irrigation management.
• Water traceability. This can be facilitated by implementing water management software that
links users - water uses – infrastructure – crops, publishing information and using informative
water bills.
• Effectiveness. Which can be reached by applying benchmarking water management and crop
water use and optimizing costs.
• Monitoring and performance evaluation by identifying problems and implementing corrective
measures in the exploitation of irrigated areas, ensuring societal return of public funds and
avoiding donor’s fatigue in the context of cooperation projects.
• Standardization regarding operation, management and infrastructure.
• Certification of quality systems application1.
1 For example ISO 9000 has produced a list of additional principles completely adequate for irrigation governance: leadership, involvement of people, continual improvement or factual approach to decision making (Playan et al., 2015)
16
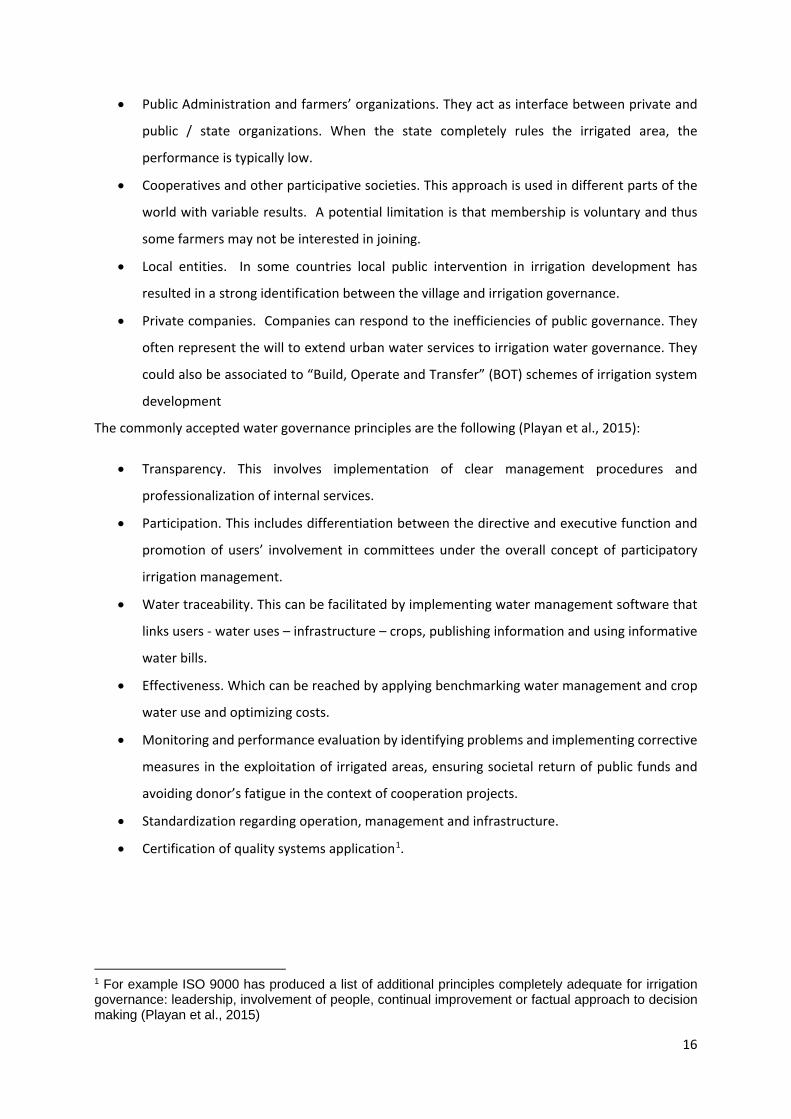
In our days there is an enhanced recognition that bottom-up and inclusive decision-making is the key
to effective water policies. OECD (2015) developed a set of 12 principles on water governance (Fig. 5)
following the concept that there is no one-size-fits-all solution to water challenges worldwide, but a
menu of options building on the diversity of legal, administrative and organisational systems within
and across countries.
Fig. 5 OECD principles on water governance and the relevant cycle (OECD, 2015)
17
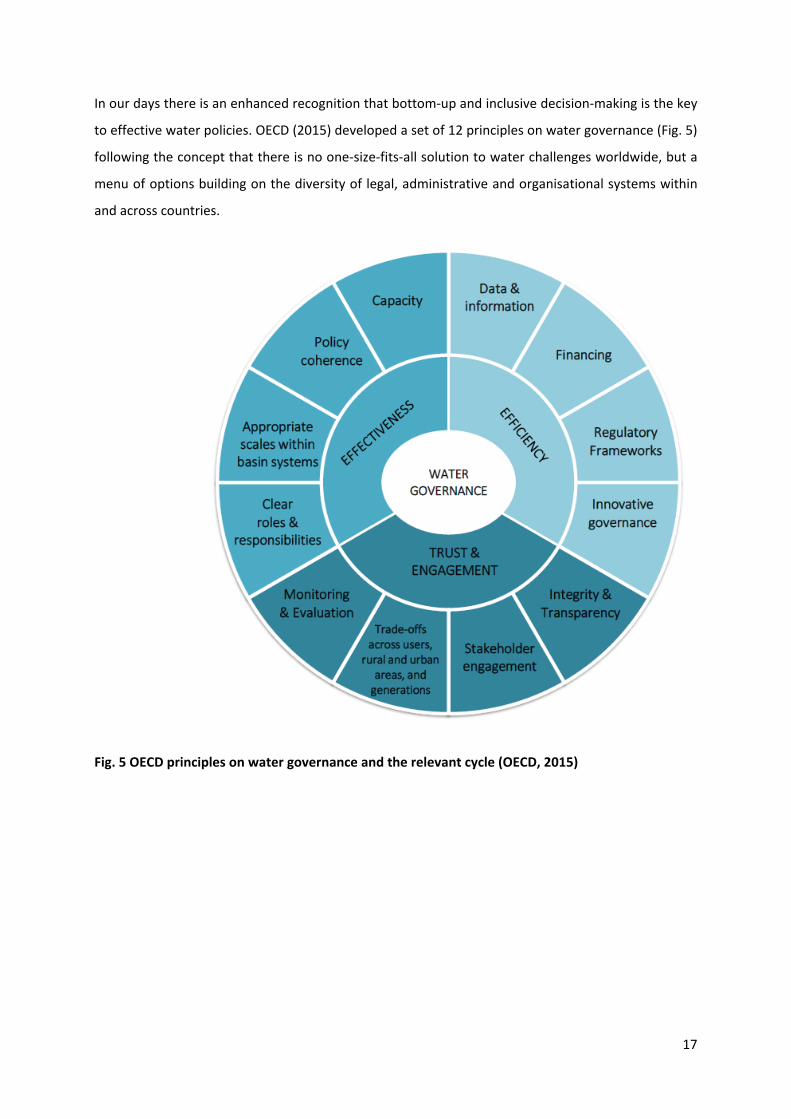
Fig. 6 Water governance cycle (OECD, 2015)
The EU Water Framework Directive The Directive 2000/60/EC of the European Parliament and of the Council or, in short, the EU Water
Framework Directive (or even shorter the WFD) establishes a framework for the Community action in
the field of water policy. WFD was based on former relevant EU legislation. Also since its publication a
number of amendments have been also developed (EU, 2015). WFD is mainly focused on water quality
issues, addressing pollution from urban waste water and from agriculture, but it also includes concerns
regarding quantitative issues for groundwater. WFD recognizes a single system of water management:
river basin (natural geographical and hydrological unit) management. WFD states that for every river
basin a management plan should be developed and this will incorporate all the aspects of the Directive.
For the development of that plan a public participatory process should be designed. While several EU
Member States followed the river basin approach, this is at present not the case everywhere.
18
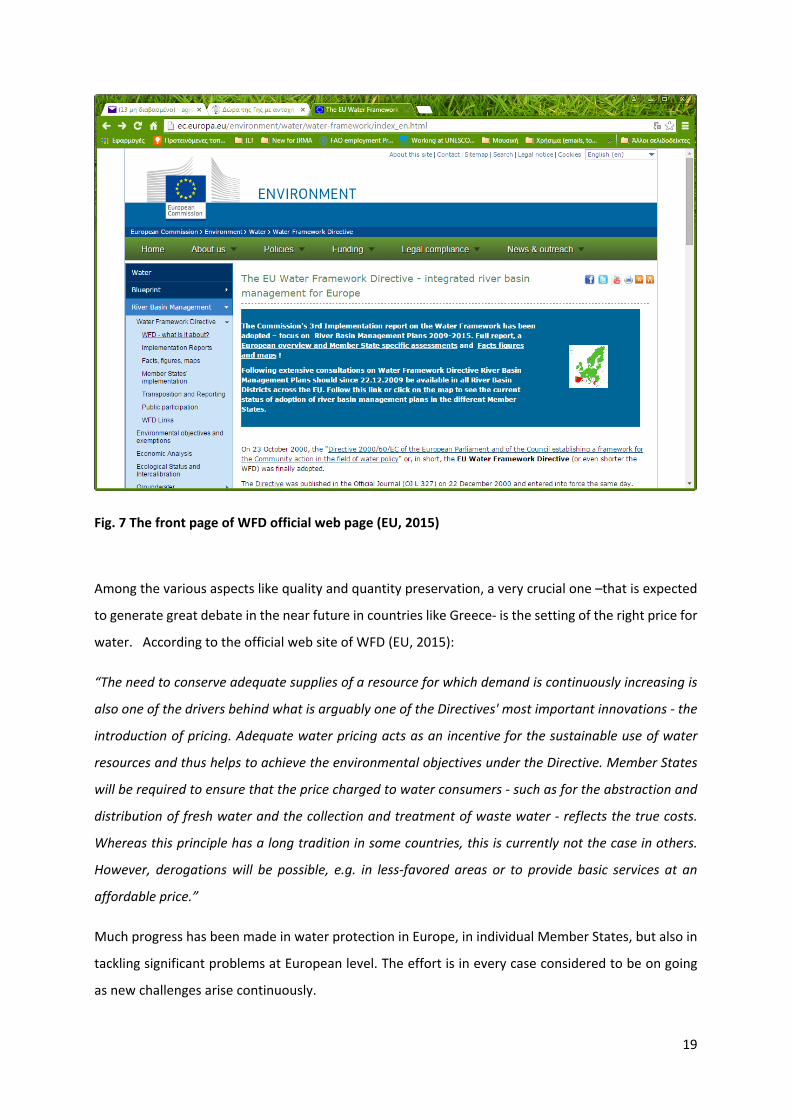
Fig. 7 The front page of WFD official web page (EU, 2015)
Among the various aspects like quality and quantity preservation, a very crucial one –that is expected
to generate great debate in the near future in countries like Greece- is the setting of the right price for
water. According to the official web site of WFD (EU, 2015):
“The need to conserve adequate supplies of a resource for which demand is continuously increasing is
also one of the drivers behind what is arguably one of the Directives' most important innovations - the
introduction of pricing. Adequate water pricing acts as an incentive for the sustainable use of water
resources and thus helps to achieve the environmental objectives under the Directive. Member States
will be required to ensure that the price charged to water consumers - such as for the abstraction and
distribution of fresh water and the collection and treatment of waste water - reflects the true costs.
Whereas this principle has a long tradition in some countries, this is currently not the case in others.
However, derogations will be possible, e.g. in less-favored areas or to provide basic services at an
affordable price.”
Much progress has been made in water protection in Europe, in individual Member States, but also in
tackling significant problems at European level. The effort is in every case considered to be on going
as new challenges arise continuously.
19
It is clear that in order to get to efficient water use –regardless the sector that is addressed- there is a
need for promotion of multi-level co-operation among users, stakeholders and levels of government
for the management of water resources.
Application of WFD and irrigation water governance in Greece Two ministries are basically in charge for water issues in Greece. The first is the Ministry of
Environment Energy & Climate Change which operates a Special Secretariat for Water
(http://wfd.ypeka.gr/). It is in charge for the implementation of the Water Framework Directive
(European Commission, 2000) in Greece. In this framework they are setting managerial plans for the
various regions of Greece (http://www.ypeka.gr/Default.aspx?tabid=248&language=en-US). These
plans contain also information regarding the cost of irrigation water. The other is the Ministry of
Agricultural Development and Foods (http://www.minagric.gr) which includes the Directives of Land
Reclamation and Hydrology (Directive for Land Reclamations Projects Design and Soil Resources
Efficient Use and Directive of Geology and Hydrology). Their main duties have to do with drillings
management, public central irrigation networks design and supervision, irrigation water needs
calculation etc. Both Ministries have relevant special branches in all regions of Greece.
In Greece, the WFD has been transposed into the national legislation with Law 3199/2003 (GG Α 280
9/12/2003, Fig. 7). This law was amended by the Presidential Degree 51 (GG Α 54 8/3/2007).
Fig. 8 Governmental Gazette No. A 280 9/12/2003, where law 3199/2003 was published.
20

The country is divided into 14 Regional Water Districts (RWD), 5 of which are transnational, sharing
water routes with Albania, FYROM and Bulgaria to the north and Turkey to the east (Fig. 7).
Furthermore the country is divided into 45 River Basins. For each RWD a Regional Water Management
Plan (RWMP) has been planned to be developed. In 2015 most of these plans are completed (GSW,
2015). It worth to be noted at this point that according to WFD these plans are suggested to concern
river basins than regions and should be updated every 6 years. For the area of IRMA project in the
Region of Western Greece, the following plans are active (Fig. 9):
• Western Peloponnesus (Fig. 4, GR01,
http://wfd.ypeka.gr/index.php?option=com_content&task=category§ionid=2&id=2&Ite
mid=12),
• Northern Peloponnesus (Fig. 5 and Fig. 6, GR02,
http://wfd.ypeka.gr/index.php?option=com_content&task=category§ionid=2&id=3&Ite
mid=12),
• Western Continental Greece (Fig. 7, GR04,
http://wfd.ypeka.gr/index.php?option=com_content&task=category§ionid=2&id=5&Ite
mid=12)
It has to be noted that administrative borders do not coincide with hydrological borders.
Fig. 9 Hydrological apportionment of Greece (the 14 Regional Water Districts (RWDs)).
21
Fig. 10 The front page of the Regional Water Management Plan of Epirus (2013)
Two kinds of irrigation setups exist, the participatory irrigation projects which cover about 40%
(572,000 ha) and the private projects 60% (858,000 ha). The transportation of water in the case of
public networks is done by surface irrigation (36%), sprinkler irrigation (52%) and drip irrigation (10%).
In private networks the water is mainly come from drillings and applied using a variety of systems.
The authorities responsible for water management of the public irrigation projects (they mainly deal
with water abstracted surface water bodies) are the Local Organizations of Land Reclamation (LOLR)
which typically operate the B level works (irrigation and drainage works, flood protection
infrastructure etc.) of the system. Groups of LOLR are related (if there is a need) to General
Organizations of Land Reclamation (GOLR) which control the A level works (dams and reservoirs, large
irrigation canals etc.). Both organisations are "public utility entities" which operate as private
companies (N.D. 1218/72, Laws 1256/82 (GG A 65) and 1892/1990 (GG A 101); GOEV, 2015) and are
in charge for the good operation of public systems. In the management boards of LOLRs, it is obligatory
that a certain number of seats is addressed to public servants. All around Greece 10 GOLRs and 382
LOLRs are operating (Greek Ministry of Agriculture, 2015).
22
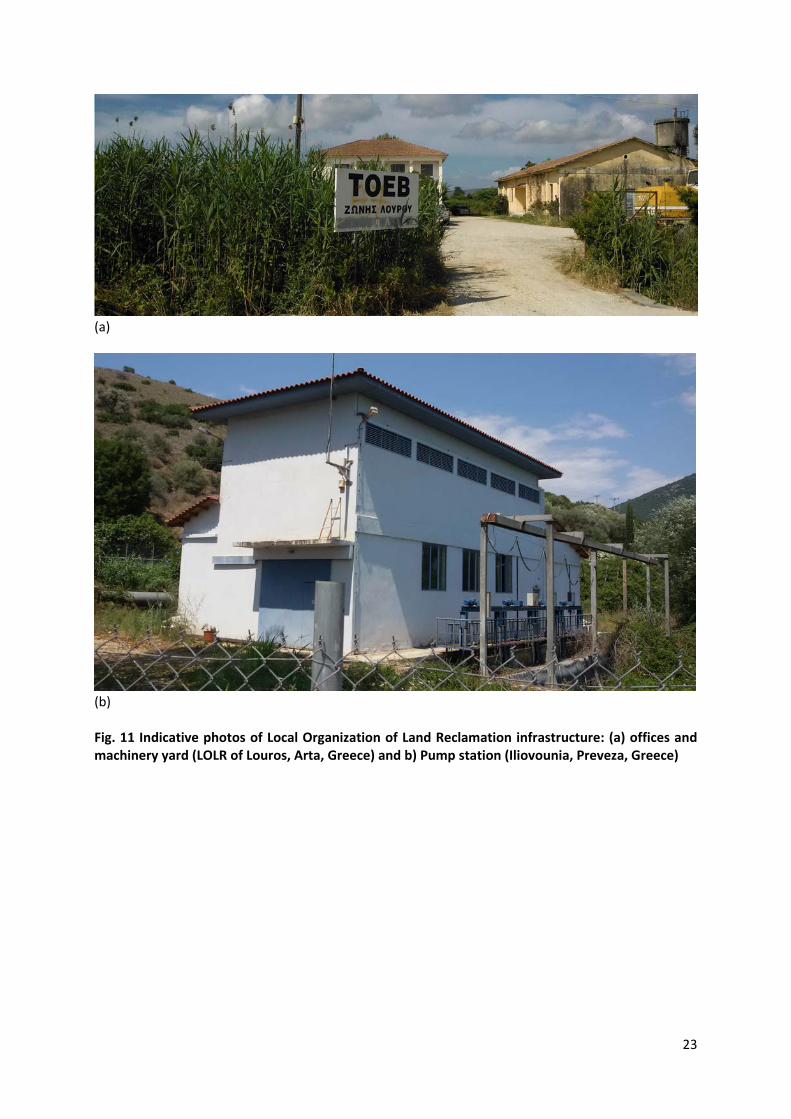
(a)
(b) Fig. 11 Indicative photos of Local Organization of Land Reclamation infrastructure: (a) offices and machinery yard (LOLR of Louros, Arta, Greece) and b) Pump station (Iliovounia, Preveza, Greece)
23
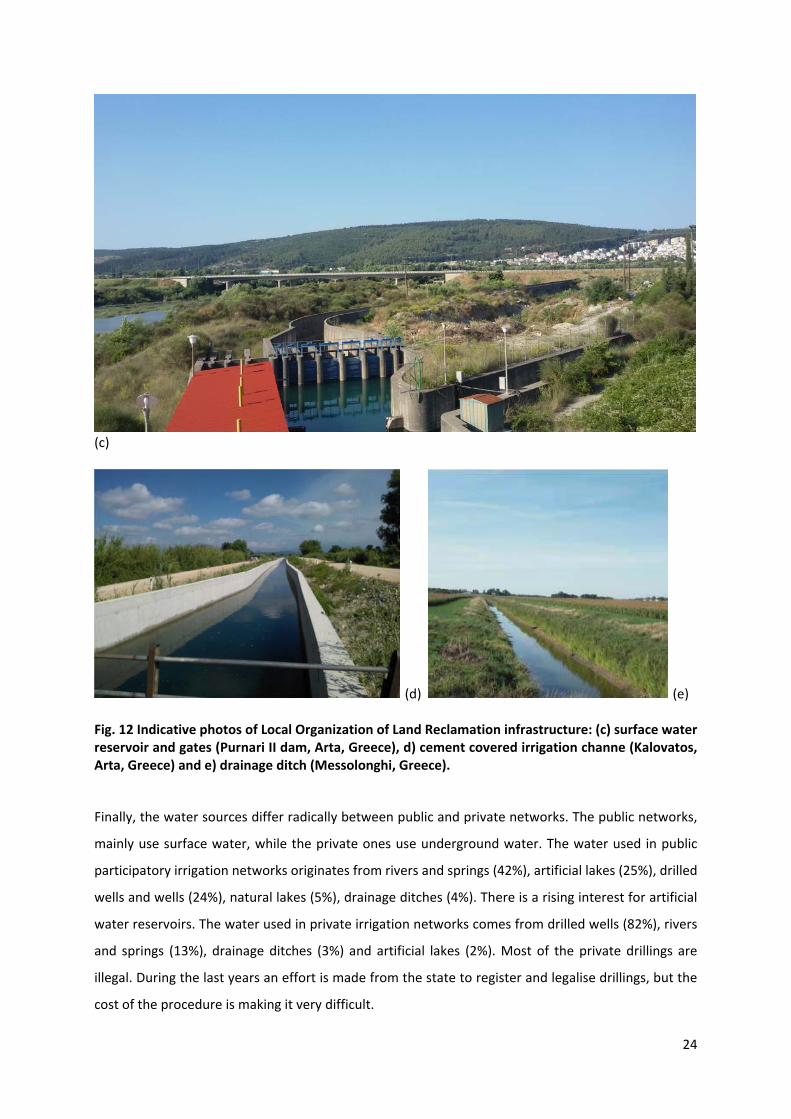
(c)
(d) (e) Fig. 12 Indicative photos of Local Organization of Land Reclamation infrastructure: (c) surface water reservoir and gates (Purnari II dam, Arta, Greece), d) cement covered irrigation channe (Kalovatos, Arta, Greece) and e) drainage ditch (Messolonghi, Greece).
Finally, the water sources differ radically between public and private networks. The public networks,
mainly use surface water, while the private ones use underground water. The water used in public
participatory irrigation networks originates from rivers and springs (42%), artificial lakes (25%), drilled
wells and wells (24%), natural lakes (5%), drainage ditches (4%). There is a rising interest for artificial
water reservoirs. The water used in private irrigation networks comes from drilled wells (82%), rivers
and springs (13%), drainage ditches (3%) and artificial lakes (2%). Most of the private drillings are
illegal. During the last years an effort is made from the state to register and legalise drillings, but the
cost of the procedure is making it very difficult.
24
Field water in the case of public networks is applied by means of surface irrigation, sprinkler irrigation
and drip irrigation in proportions of 37%, 53% and 10% respectively, with a distinct falling tendency of
surface irrigation. Water in the private networks is applied by means of surface irrigation, sprinkler
irrigation and drip irrigation at rates of 7%, 49% and 44% respectively. During the last 15 years new
technology irrigation systems have been financed for agricultural application through Farm
Development Plans (in the framework of European Co-funded programmes) and a lot of farmers took
advantage of this occasion.
Farmers must submit an irrigation plan before getting permission to participate in a public system or
to construct and exploit a drilling. In reality the vast majority irrigates using practical information and
experience. The use of calculations, sensors etc. is very limited. The water and energy consumptions
are increased in the public projects where consumptions of 10,000 m3 ha-1 are usual with water losses
up to 50%. In the case of private projects the cost of irrigation water is significant and it is totally
chargeable to the farmers. In this way both the losses and consumptions are reduced by 10-20% and
5,000 m3 ha-1 respectively. Regarding prising of water, in the public reclamation works the operational
costs (administrative-operational-maintenance) are estimated; then, the distribution of proportional
expenses is based on an area-basis of the irrigated land. This way of distributing expenses has the
following disadvantages. The estimation of the cost for each organization (LOLR) is different and it is
based more on the operational expenses (energy for pumping, etc.) and less on the salaries of
administrative staff. For the most of the cases, the relevant cost for maintenance and depreciation of
the works is not included. Experience has shown that the pricing of water based on the size of parcel
is in a way obligatory and sufficient for surface networks but it is particularly problematic in irrigation
networks under pressure. It does not create motives for saving water and energy. A usual characteristic
of Greek irrigation networks is that the energy cost is higher than the personnel cost. This fact is
opposite to the rational management according to the international standards. Regarding the
economic parameters, it can be pointed out that by converting a dry land to an irrigated one the family
income is increased by more than 70%. For social parameters, it can be said that the conversion
increases the employment at a rate of 20%. The environmental impacts from the developments of
irrigation networks there are positive (as creation of artificial wetlands) and negative (as draining of
wetlands, salinization of coastal aquifers, increasing of agricultural inputs) effects. Recent observations
and research showed that the construction of storage dams is increasing and the nitrate problem in
ground water remains at low levels. The amelioration of saline aquifers in coastal areas is achieved in
many cases by recharging the aquifers with water during the winter.
25
The Ministerial Decision of the Ministry of Agriculture F.16/6631, as it was published in the
Governmental Gazette Issue 428 B - 2/6/1989 provides information regarding water needs of basic
crop categories and the irrigation period for each hydrological area of the country.
The legislative framework for wastewater reclamation and reuse has been established in Greece some
years ago (Joint Ministerial Decision 145116/02-02-2011). Depending on the type of reuse, there are
certain requirements regarding level of treatment, quality standards and monitoring frequency. In
addition, there are two main options for irrigation: (i) restricted irrigation and (ii) unrestricted irrigation
in which further strict limitations were imposed.
In the Regions of Epirus and Western Greece the general image is this of the whole country. Epirus is
characterised by high rainfall but the plains typically do not have a lot of rain during summer and
irrigation is needed. Most farmers protest against the luck or the bad condition of central public
irrigation networks. In Western Greece there are more problems regarding water deficiency. A major
irrigation connected project at the Regional Unity of Aetoloakarnania is the split of route of Acheloos
river in order to cover irrigation needs of the great plain of Thessaly which is at the East side of country.
The project is unfinished for more than 15 years due to environmental issues.
Regarding landscape works, municipalities are in charge for their irrigation (they operate special
Environmental and Green Works Departments). The main source of water is municipal drillings. Most
municipalities have installed modern sprinkler and micro irrigation systems but very few apply
calculated schedules or use electronic management systems.
Irrigation systems for public landscapes are designed by teams of agriculturalists, mechanical and
electrical engineers (depending of the size of the project). Anybody can design install a private end-
user irrigation system in Greece (no certification is needed). Also irrigation systems auditing is an
unknown word.
26
Application of WFD and irrigation water governance in Italy The implementation of WFD in Italy (www.direttivaacque.minambiente.it) is a responsibility of the
Ministry for the Environment, Land and Sea. A very integral presentation of WFD adoption and
application in Italy is provided by Balzarolo et al. (2011). According to that study, the first law
anticipating the WFD in Italy was called “Norms for the organizational and functional rearrangement
of soil protection” (Law no. 183/1989) which stated the need of planning at the hydrographical basin
scale and created new public agencies: the River Basin Authorities (RBA). The main objective of these
authorities was to develop and apply the River Basin Management Plan. This plan includes four
transitional modules, which concern:
• the restoration of hydraulic structures,
• the hydro-geological Settlement (PAI), also containing the transitional plan for fluvial areas,
• the planning for areas with high hydro-geological risks and
• the control of eutrophication.
The same law introduced the innovative concepts of the minimum stream low (also called
environmental low), aimed at the protection and safeguarding of river ecosystems and several issues
of water quality remediation. Furthermore, its following modification and upgrading resulted in the
concept of water balance in standard classical sense, as the central element for water resources
management. In 1994 on the basis of the law no. 36 “Provisions concerning water resources” (also
known as Galli Law) water supply, urban drainage and wastewater treatment systems were
reorganized in Optimal Territorial Areas (ATO) on the basis of efficiency, effectiveness and economic
criteria, leading to integrated and comprehensive management of water resources under the ATO
authority. The law assigns pollution control and environmental monitoring to the Regional
Environmental Agencies. It also states that water quality has to be seen in the context of final use
requirements. In fact, the “polluter pays” principle was introduced. Moreover, the law also affirmed
the concept of the public nature of all surface and groundwater and gave priority to water for human
consumption.
A milestone, regarding the integration of the protection of water ecosystems into Italian legislation
was the legislative decree no. 152/1999 “Arrangements for the protection of waters against pollution”
and implementing directive 91/271/EC concerning urban wastewater treatment and directive
91/676/EC concerning the protection of waters against pollution caused by nitrates from agricultural
sources. This was integrated with and amended by legislative decree no. 258/2000 on the protection
27
of waters against pollution that re-examined environmental protection from a new pro-active
perspective and anticipated some aspects of the WFD. The decree defines the general procedures to
safeguard water, pursuing the objectives of (i) preventing and reducing pollution, (ii) reclaiming and
improving the water status, (iii) protecting the water allocated to special uses, (iv) ensuring the
sustainable use of the resources and (v) supporting well diversified animal and plant communities.
These objectives can be achieved through the application of proper water quality and quantity
planning, represented in the Water Protection. The River Basin Authorities charged to set up a
preliminary definition of objectives and priorities at basin scale for the protection plans.
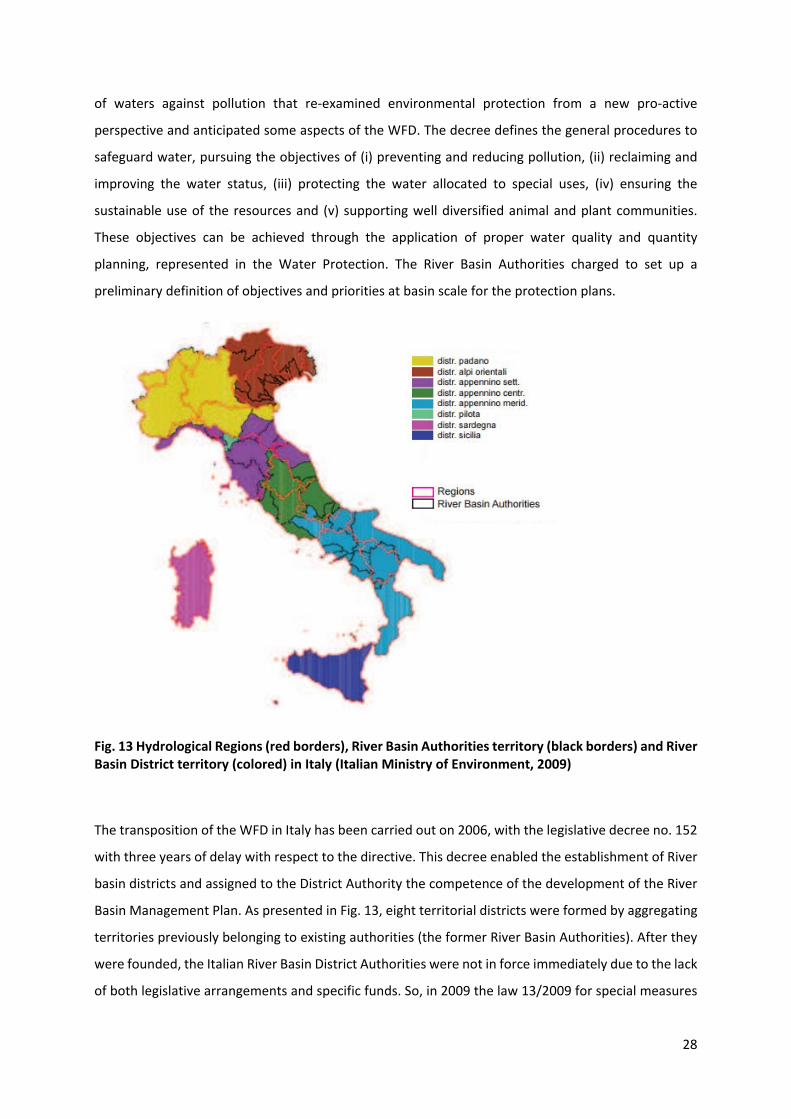
Fig. 13 Hydrological Regions (red borders), River Basin Authorities territory (black borders) and River Basin District territory (colored) in Italy (Italian Ministry of Environment, 2009)
The transposition of the WFD in Italy has been carried out on 2006, with the legislative decree no. 152
with three years of delay with respect to the directive. This decree enabled the establishment of River
basin districts and assigned to the District Authority the competence of the development of the River
Basin Management Plan. As presented in Fig. 13, eight territorial districts were formed by aggregating
territories previously belonging to existing authorities (the former River Basin Authorities). After they
were founded, the Italian River Basin District Authorities were not in force immediately due to the lack
of both legislative arrangements and specific funds. So, in 2009 the law 13/2009 for special measures
28
on water resources and environment protection was issued, to attribute the task to develop the
RBMPs, to the River Basin Authorities at National level working together with the regional
representatives. The delay in the identification of the Districts and in the attribution of competences
reduced the available time for developing the RBMPs. The Authorities, or the competent Regions,
should be in charge of the contents and the objectives of the RBMPS, while the Ministry for the
Environment should be in charge of the publication of specific guidelines for the editing of the plans.
After being published, the first version of the eight RBMPs was adopted by the end of July 2009 and at
the same time they were submitted to the Strategic Environmental Evaluation (SEE) for a three months
period, as required by the national legislation, and to public consultation for a six months period, as
foreseen by the WFD.
Since the public participation period that should end by January 2010 contradicted the respect of the
deadline (22 December 2009) for the adoption of most of the RBMPs, the Italian administration
obtained from the European Commission the permission to shift the adoption date. This shift should
also guarantee the proper and correct participation of the population and institutions to the RBMP
development process.
While the initial approval of the final RBMP was the responsibility of the River Basin Authorities, the
formal approval will be by a specific on-coming decree by the Presidency of the Council of Ministers.
This decree will also contain the main outcomes from the SEE and the public participation, together
with some prescriptions on the integration of the less thoroughly investigated aspects. In particular, it
will contain some important observations from the Ministry for the Environment required for a rapid
integration of the plans, in order to avoid in European Commission infraction procedures. For this
reason, the above mentioned decree foresees an intermediate deadline for the revision and
integration of the plans in one year starting from the approval date of the decree.
A special remark is necessary about the content and the needed measurement for the preparation of
the Italian RBMPs. The Italian legislation already foresaw a planning at hydrographical basin scale with
the establishment of the River Basin Authorities (law no.183/1989), actually anticipating the WFD.
Therefore, the background for the elaboration of the Plans exists and is part of already existing plans
that are in force at the hydrographical basin level together with the integration and harmonization of
the planning tools at the sub-district scale. The basin-wide ‘Hydro-geological Risk Exposure Plan’
constituted the knowledge base for the management of alluvial risk and the protection of river basins,
for hydro-morphological characterization of the hydrographical net, for impacts on the lateral and
longitudinal continuity of the rivers, for bed load transport and for channel dynamics. The Water
Quality Protection Plans of the regional areas designed and developed the monitoring systems for both
29
the surface and groundwater bodies, it also identified the interventions and the measures necessary
to reach and maintain both the quality and the quantity objectives for the water system. These
evaluations are based on the concepts of water balance and compatible water uses with respect to
the use priority and both the quality and the quantity characteristics of the different uses.
Fig. 14 An indicative activities report of an Italian Consorzio di Bonifica (Consorzio Brenta, 2015)
The last, relevant and most critical aspect of the development of the RBMP is represented by the
economic analysis. This aspect, following the directive’s indications, should support the decision
process in all phases, integrating with all other components. Actually Italy, as other Member States, is
having difficulties to carry out a complete extensive economic analysis and to define the mechanism
of water cost recovery. Now Italy has carried out only a preliminary economic analysis based upon the
characterization of the productive and economical structure of the different basins, where available,
and on the evaluation of the cost of the different water uses. However, a serious gap exists in the
needed information. This gap will be filled by using data coming from the monitoring systems that have
now been activated. When the economic analysis is integrated, the Italian RBMPs will be really
effective to evaluate the efficiency of the costs linked to the different scenarios. This integration will
be performed in the revision phase foreseen by the directive.
30
The integration of prescriptions and observations issued by the Ministry for the Environment will,
however, facilitate the integration of some important issues, such as these economics, within one year.
The management of irrigation water in Italy is mainly done via a number of Consorzi Bonifice (ANBI,
2015). These local organisations for irrigation, drainage and land improvement are responsible for
implementing and managing flood defenses and hydraulic regulation, funding and use of water at the
prevailing irrigation, environmental protection measures. Consortia therefore play a multifunctional,
targeted to territorial security, environmental and food of the country, thus contributing to sustainable
economic development (Fig. 14).
31
Efficient use of water and Irrigation efficiency
It is unavoidable to start with some terminology. A watershed is a basin-like landform defined by
highpoints and ridgelines that descend into lower elevations and stream valleys. A watershed carries
water "shed" from the land after rain falls and snow melts. Drop by drop, water is channeled into soils,
groundwater, creeks, and streams, making its way to larger rivers and eventually the sea. Water is a
universal solvent, affected by all that it comes in contact with: the land it traverses, and the soils
through which it travels. The important thing about watersheds is: what we do on the land affects
water quality for all communities living downstream.
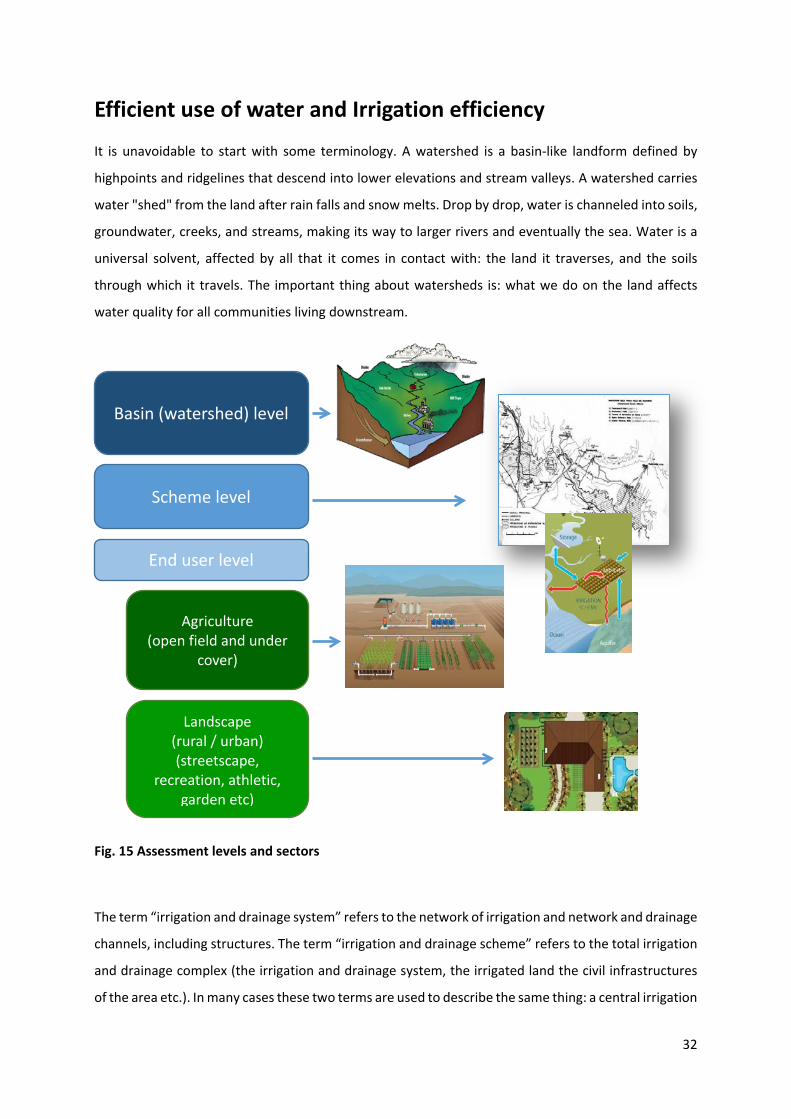
Fig. 15 Assessment levels and sectors
The term “irrigation and drainage system” refers to the network of irrigation and network and drainage
channels, including structures. The term “irrigation and drainage scheme” refers to the total irrigation
and drainage complex (the irrigation and drainage system, the irrigated land the civil infrastructures
of the area etc.). In many cases these two terms are used to describe the same thing: a central irrigation
Basin (watershed) level
Scheme level
End user level
Agriculture (open field and under
cover)
Landscape (rural / urban) (streetscape,
recreation, athletic, garden etc)
32
and drainage system which manages water sources, carries water to the fields and removes excessive
water from the area. A watershed can contain more than one irrigation and drainage schemes or
systems. In a system the various fields are irrigated and drained by end-user systems.
When the discussion has to do with an irrigation system we should always have in mind the couple
irrigation - drainage and the objective of such a system is to deliver water to the area, implement the
right amount of water in the root zone with an appropriate rate and at the right time while it has to be
capable of removing the excess quantity of water from the soil when this is necessary. A basic goal of
an irrigation managing authority, a farmer or a park manager is to use the available water resources in
a way that will assist the plants do what they are expected to i.e. produce a lot of good quality fruits
or look good and create a pleasant landscape and at the same time this to cost as low as possible. This
approach can be applied to all levels from end-user to irrigation scheme and hydrological basin. One
difference between the various levels is that for the last two the losses of one system could be the
gains of another. Another difference is that the various levels have probably different priorities and
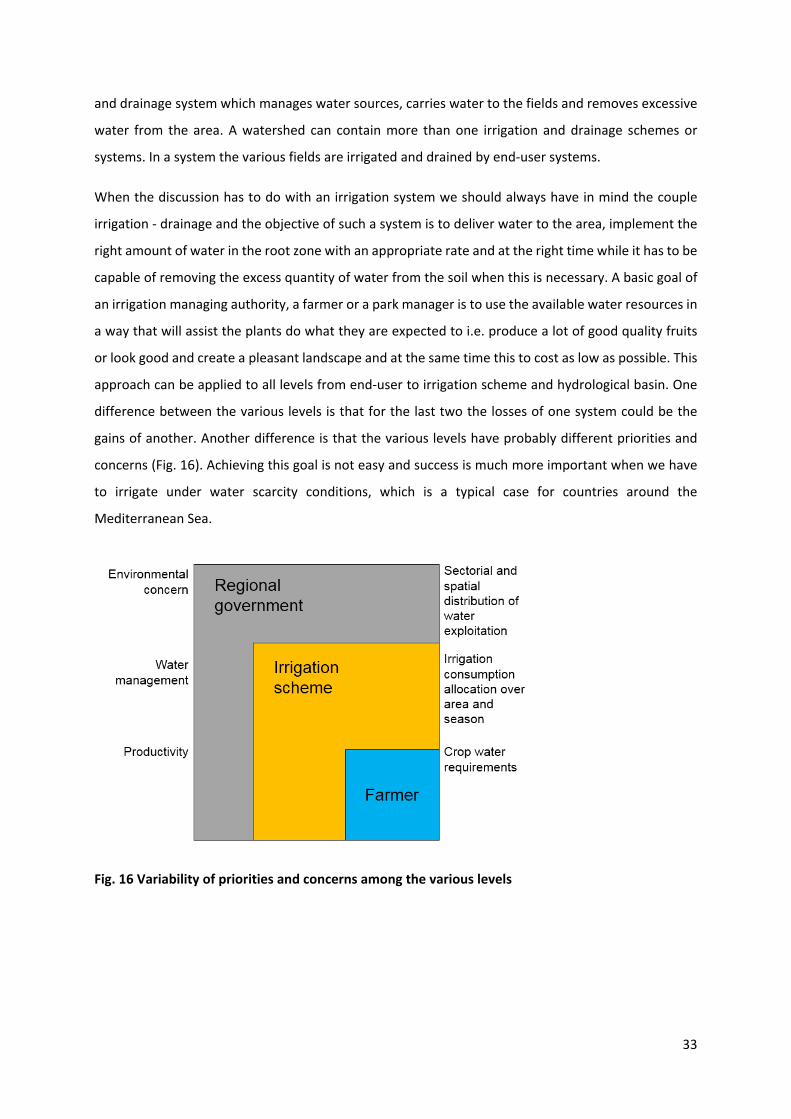
concerns (Fig. 16). Achieving this goal is not easy and success is much more important when we have
to irrigate under water scarcity conditions, which is a typical case for countries around the
Mediterranean Sea.
Fig. 16 Variability of priorities and concerns among the various levels
33
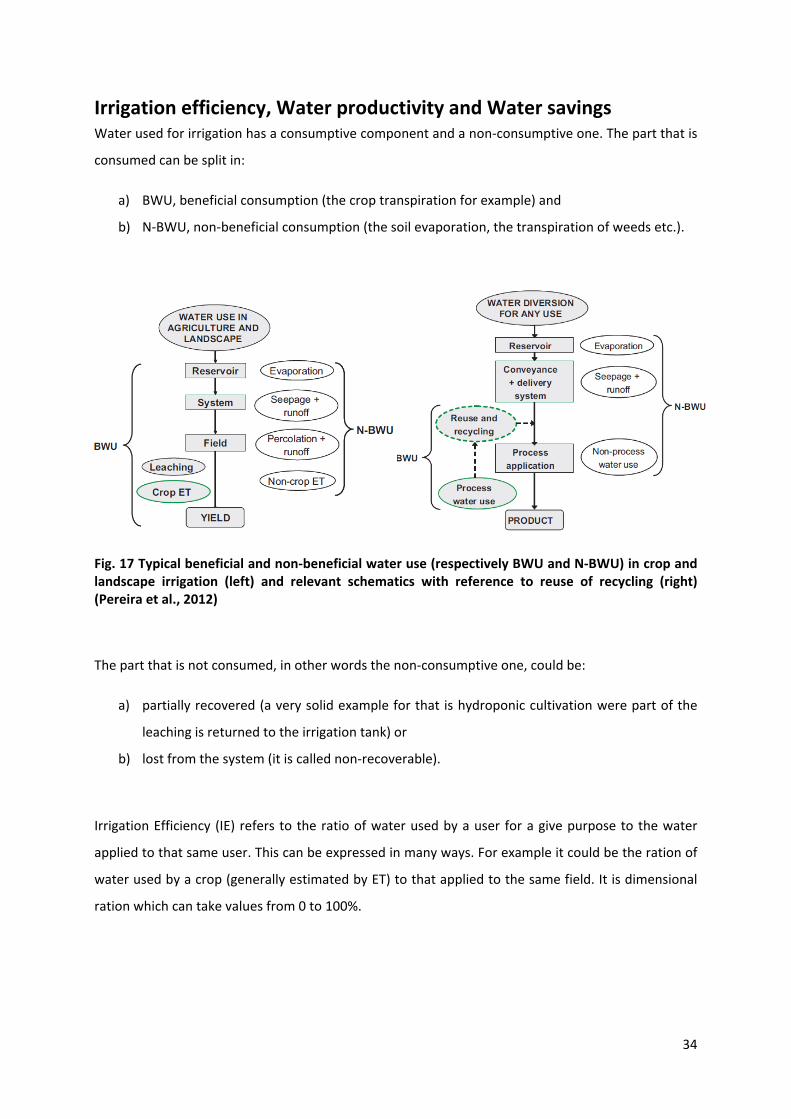
Irrigation efficiency, Water productivity and Water savings Water used for irrigation has a consumptive component and a non-consumptive one. The part that is
consumed can be split in:
a) BWU, beneficial consumption (the crop transpiration for example) and
b) N-BWU, non-beneficial consumption (the soil evaporation, the transpiration of weeds etc.).
Fig. 17 Typical beneficial and non-beneficial water use (respectively BWU and N-BWU) in crop and landscape irrigation (left) and relevant schematics with reference to reuse of recycling (right) (Pereira et al., 2012)
The part that is not consumed, in other words the non-consumptive one, could be:
a) partially recovered (a very solid example for that is hydroponic cultivation were part of the
leaching is returned to the irrigation tank) or
b) lost from the system (it is called non-recoverable).
Irrigation Efficiency (IE) refers to the ratio of water used by a user for a give purpose to the water
applied to that same user. This can be expressed in many ways. For example it could be the ration of
water used by a crop (generally estimated by ET) to that applied to the same field. It is dimensional
ration which can take values from 0 to 100%.
34
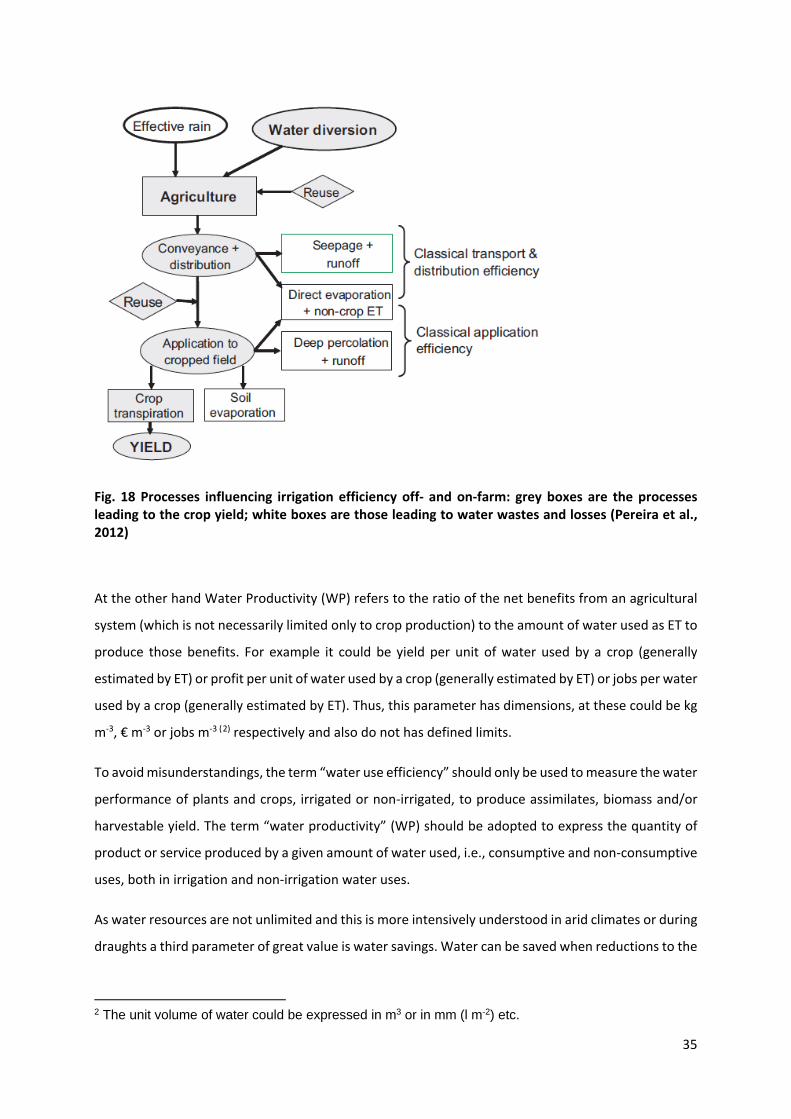
Fig. 18 Processes influencing irrigation efficiency off- and on-farm: grey boxes are the processes leading to the crop yield; white boxes are those leading to water wastes and losses (Pereira et al., 2012)
At the other hand Water Productivity (WP) refers to the ratio of the net benefits from an agricultural
system (which is not necessarily limited only to crop production) to the amount of water used as ET to
produce those benefits. For example it could be yield per unit of water used by a crop (generally
estimated by ET) or profit per unit of water used by a crop (generally estimated by ET) or jobs per water
used by a crop (generally estimated by ET). Thus, this parameter has dimensions, at these could be kg
m-3, € m-3 or jobs m-3 (2) respectively and also do not has defined limits.
To avoid misunderstandings, the term “water use efficiency” should only be used to measure the water
performance of plants and crops, irrigated or non-irrigated, to produce assimilates, biomass and/or
harvestable yield. The term “water productivity” (WP) should be adopted to express the quantity of
product or service produced by a given amount of water used, i.e., consumptive and non-consumptive
uses, both in irrigation and non-irrigation water uses.
As water resources are not unlimited and this is more intensively understood in arid climates or during
draughts a third parameter of great value is water savings. Water can be saved when reductions to the
2 The unit volume of water could be expressed in m3 or in mm (l m-2) etc.
35
non-beneficial part of the consumptive use and/or in the non-recoverable part of the non-consumptive
use are achieved (or vice versa).
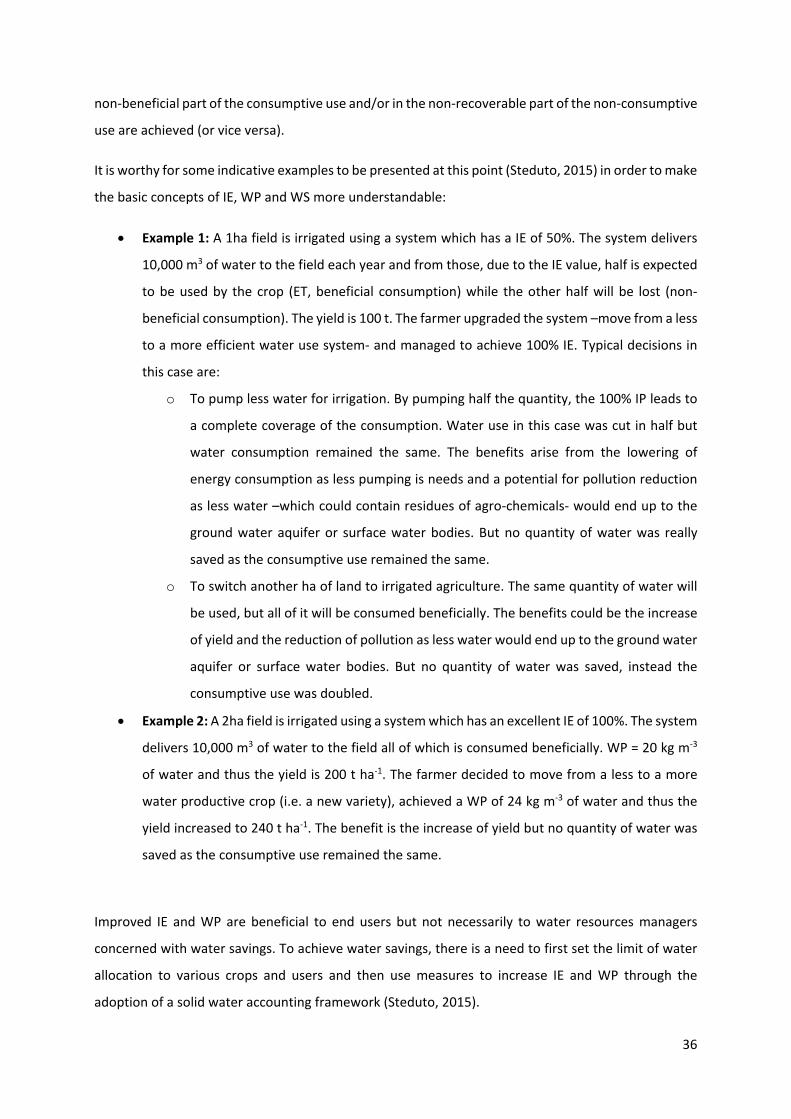
It is worthy for some indicative examples to be presented at this point (Steduto, 2015) in order to make
the basic concepts of IE, WP and WS more understandable:
• Example 1: A 1ha field is irrigated using a system which has a IE of 50%. The system delivers
10,000 m3 of water to the field each year and from those, due to the IE value, half is expected
to be used by the crop (ET, beneficial consumption) while the other half will be lost (non-
beneficial consumption). The yield is 100 t. The farmer upgraded the system –move from a less
to a more efficient water use system- and managed to achieve 100% IE. Typical decisions in
this case are:
o To pump less water for irrigation. By pumping half the quantity, the 100% IP leads to
a complete coverage of the consumption. Water use in this case was cut in half but
water consumption remained the same. The benefits arise from the lowering of
energy consumption as less pumping is needs and a potential for pollution reduction
as less water –which could contain residues of agro-chemicals- would end up to the
ground water aquifer or surface water bodies. But no quantity of water was really
saved as the consumptive use remained the same.
o To switch another ha of land to irrigated agriculture. The same quantity of water will
be used, but all of it will be consumed beneficially. The benefits could be the increase
of yield and the reduction of pollution as less water would end up to the ground water
aquifer or surface water bodies. But no quantity of water was saved, instead the
consumptive use was doubled.
• Example 2: A 2ha field is irrigated using a system which has an excellent IE of 100%. The system
delivers 10,000 m3 of water to the field all of which is consumed beneficially. WP = 20 kg m-3
of water and thus the yield is 200 t ha-1. The farmer decided to move from a less to a more
water productive crop (i.e. a new variety), achieved a WP of 24 kg m-3 of water and thus the
yield increased to 240 t ha-1. The benefit is the increase of yield but no quantity of water was
saved as the consumptive use remained the same.
Improved IE and WP are beneficial to end users but not necessarily to water resources managers
concerned with water savings. To achieve water savings, there is a need to first set the limit of water
allocation to various crops and users and then use measures to increase IE and WP through the
adoption of a solid water accounting framework (Steduto, 2015).
36
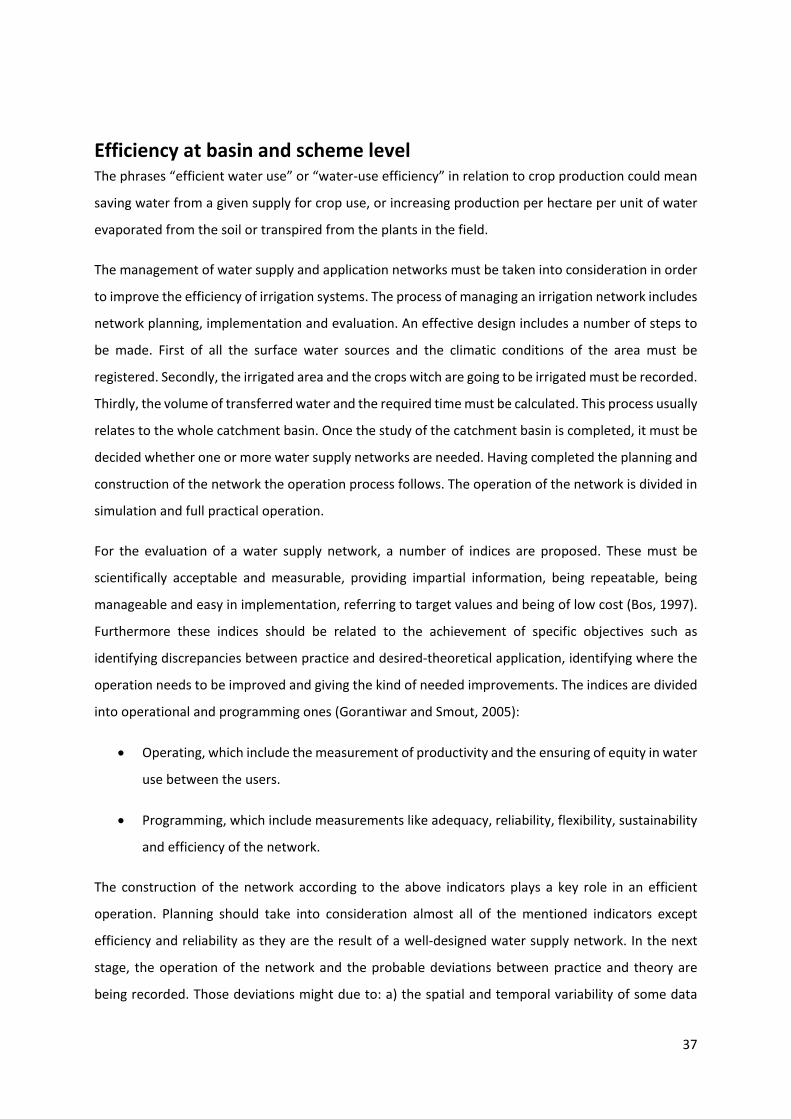
Efficiency at basin and scheme level The phrases “efficient water use” or “water-use efficiency” in relation to crop production could mean
saving water from a given supply for crop use, or increasing production per hectare per unit of water
evaporated from the soil or transpired from the plants in the field.
The management of water supply and application networks must be taken into consideration in order
to improve the efficiency of irrigation systems. The process of managing an irrigation network includes
network planning, implementation and evaluation. An effective design includes a number of steps to
be made. First of all the surface water sources and the climatic conditions of the area must be
registered. Secondly, the irrigated area and the crops witch are going to be irrigated must be recorded.
Thirdly, the volume of transferred water and the required time must be calculated. This process usually
relates to the whole catchment basin. Once the study of the catchment basin is completed, it must be
decided whether one or more water supply networks are needed. Having completed the planning and
construction of the network the operation process follows. The operation of the network is divided in
simulation and full practical operation.
For the evaluation of a water supply network, a number of indices are proposed. These must be
scientifically acceptable and measurable, providing impartial information, being repeatable, being
manageable and easy in implementation, referring to target values and being of low cost (Bos, 1997).
Furthermore these indices should be related to the achievement of specific objectives such as
identifying discrepancies between practice and desired-theoretical application, identifying where the
operation needs to be improved and giving the kind of needed improvements. The indices are divided
into operational and programming ones (Gorantiwar and Smout, 2005):
• Operating, which include the measurement of productivity and the ensuring of equity in water
use between the users.
• Programming, which include measurements like adequacy, reliability, flexibility, sustainability
and efficiency of the network.
The construction of the network according to the above indicators plays a key role in an efficient
operation. Planning should take into consideration almost all of the mentioned indicators except
efficiency and reliability as they are the result of a well-designed water supply network. In the next
stage, the operation of the network and the probable deviations between practice and theory are
being recorded. Those deviations might due to: a) the spatial and temporal variability of some data
37
used in the planning stage; b) the inaccurate description and calculation of some physical parameters
and c) the possible divergences between theory and practice of certain interventions. For this reason,
usually, before the network is fully operated it must be evaluated through a simulation process during
which problems are identified and operating rules are being set if it is needed. Afterwards the network
is fully operated and real-time measures of those indicators are recorded and the observed deviations
between practice and theoretical-optimal operation are evaluated. If any malfunction is noted then a
number of improvement actions are proposed to optimize the network’s operation. Finally, it should
be taken into consideration the temporal variability of the values of the indicators during the irrigation
period or during the whole year.
The operating indices are defined as follow:
• Productivity is measured through other indicators such as: a) the achieved production
compared to the desired one, b) the achieved economic benefit compared to the desired one
and c) the irrigated area compared to the desired one.
• Equity, according to Gorantiwar and Smout (2005) is defined as “the distribution of input
resources in the irrigation scheme (area and water) or the resulting output (crop production
or net benefits) among users (farmers, outlet) in a fair manner which is prescribed in the
objectives of the irrigation scheme in the form of social welfare. Equity refers to: a) the
irrigated area compared to the total area covered by the network; b) the amount of applied
water compared to the delivered amount through the network; c) the achieved yield
compared to the expected and d) the achieved economic benefit compared to the expected.
”. Various indicators have been proposed to measure equity.
The programming indices are defined as follow:
• Adequacy, according to Corantiwar and Smout (2005), is defined as “the ratio of supply due to
irrigation and effective rainfall to the demand due to evapotranspiration and other needs”.
The adequacy of the network measured by either the maximum crop evapotranspiration or by
the amount of applied water so that the soil moisture to reach the field capacity. In irrigation
schedules where certain amount of water is applied during given interval, the second method
of adequacy measures is better adapted. This indicator is important because it determines the
type of irrigation (full or deficit) particularly if the network is not able to meet the irrigation
needs of the covered area.
• Reliability of is defined (Gorantiwar and Smout, 2005) as “the ability of the water delivery
system and the schedule to meet the scheduled demand of the crop”. Likely, this is due to: a)
the lower reall water availability of the network compared to the calculated one, b) the
38
unexpected changes in non-irrigation water demands, c) the miscalculation of water
requirements, d) the loss of water from the network as arusult of destructions or thieves and
e) the inability of the managing authority to provide the needed water. In most cases it is
desirable the network to provide more water than the calculated amount so that a high
reliability to be met.
• The flexibility of the network is another indicator of evaluation. According to Gorantiwar and
Smout (2005) it defined as “the ability of the water delivery schedule of the allocation plan to
recover from any changes caused in the schedule”. During operation of irrigation systems
various changes which have not been predicted is likely to be noticed. In these cases it should
have been taken care any change in the network’s operation to be assimilated without causing
any impact on its efficiency. Usually networks designed for full or over irrigation conditions.
• Care should be taken regarding the sustainability of an irrigation network. This indicator refers
to leaching, cleaning the tubes from transported salts with the irrigation water and drainage.
Systems where the above parameters are not taken into account might lose their efficiency.
Then extra amount of water is required, usually pumped from the underground aquifer, with
adverse effects in irrigation cost and salinisation. Usually, sustainability measures are tested
through simulation processes which based on real data from each year of implementation
does.
• Efficiency of an irrigation network is the last indicator used in evaluation process. Most of
times, when the designer of a network takes into account all the mentioned parameters, the
network operates efficiently. Efficiency is an important indicator not only because it measures
how efficient the network operates but also because it is a helpful index for the authorities.
Through efficiency they are able to notice if any problem in operation process occur taking the
necessary decisions to fix it especially when parts of the whole network is evaluated.
van Halsema and Linden (2012), argued that water management decisions are best informed by using
Irrigation Efficiency and Water Productivity at the irrigation scheme and catchment level, respectively.
They also proposed that this use can identify context specific opportunities and potentials for
increased water use efficiency and productivity as well as the potential trade-offs in water re-
allocations between diverse water users and uses.
39
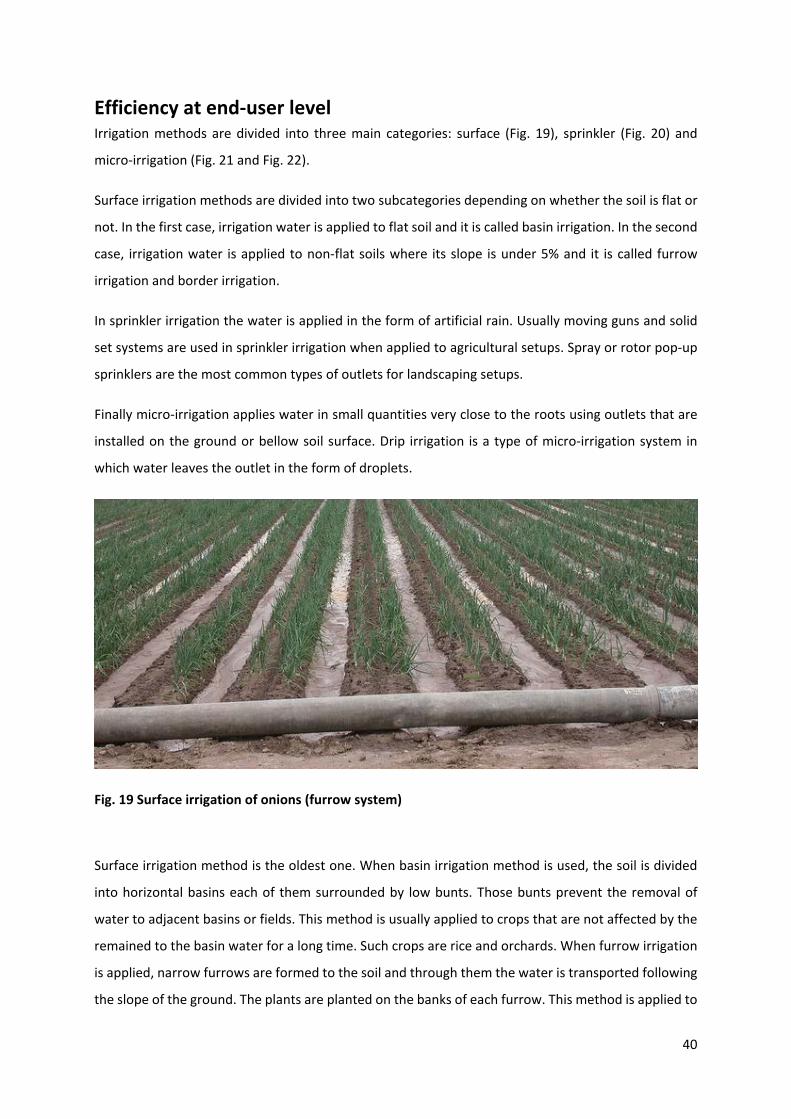
Efficiency at end-user level Irrigation methods are divided into three main categories: surface (Fig. 19), sprinkler (Fig. 20) and
micro-irrigation (Fig. 21 and Fig. 22).
Surface irrigation methods are divided into two subcategories depending on whether the soil is flat or
not. In the first case, irrigation water is applied to flat soil and it is called basin irrigation. In the second
case, irrigation water is applied to non-flat soils where its slope is under 5% and it is called furrow
irrigation and border irrigation.
In sprinkler irrigation the water is applied in the form of artificial rain. Usually moving guns and solid
set systems are used in sprinkler irrigation when applied to agricultural setups. Spray or rotor pop-up
sprinklers are the most common types of outlets for landscaping setups.
Finally micro-irrigation applies water in small quantities very close to the roots using outlets that are
installed on the ground or bellow soil surface. Drip irrigation is a type of micro-irrigation system in
which water leaves the outlet in the form of droplets.
Fig. 19 Surface irrigation of onions (furrow system)
Surface irrigation method is the oldest one. When basin irrigation method is used, the soil is divided
into horizontal basins each of them surrounded by low bunts. Those bunts prevent the removal of
water to adjacent basins or fields. This method is usually applied to crops that are not affected by the
remained to the basin water for a long time. Such crops are rice and orchards. When furrow irrigation
is applied, narrow furrows are formed to the soil and through them the water is transported following
the slope of the ground. The plants are planted on the banks of each furrow. This method is applied to
40
crops that are sensitive in flood water conditions for a long time. When border irrigation is used, the
soil is divided in long strips separated by bunts to prevent the removal of water to adjacent strips or
fields.
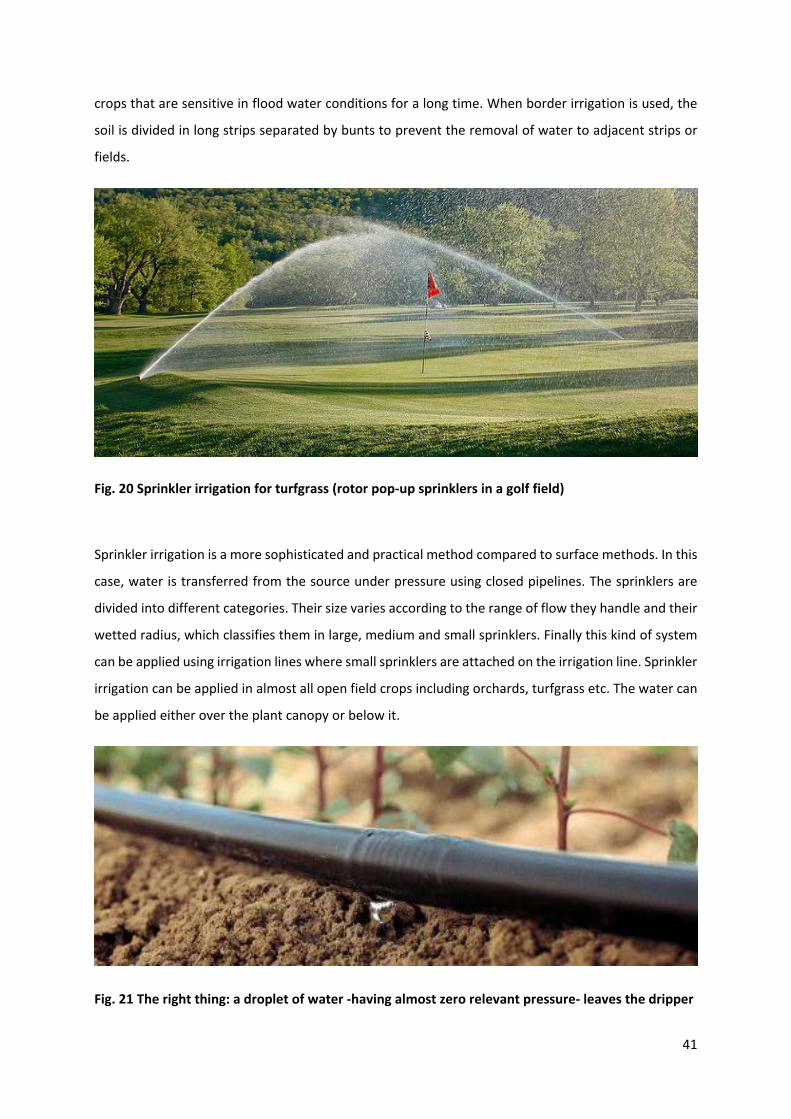
Fig. 20 Sprinkler irrigation for turfgrass (rotor pop-up sprinklers in a golf field)
Sprinkler irrigation is a more sophisticated and practical method compared to surface methods. In this
case, water is transferred from the source under pressure using closed pipelines. The sprinklers are
divided into different categories. Their size varies according to the range of flow they handle and their
wetted radius, which classifies them in large, medium and small sprinklers. Finally this kind of system
can be applied using irrigation lines where small sprinklers are attached on the irrigation line. Sprinkler
irrigation can be applied in almost all open field crops including orchards, turfgrass etc. The water can
be applied either over the plant canopy or below it.
Fig. 21 The right thing: a droplet of water -having almost zero relevant pressure- leaves the dripper
41
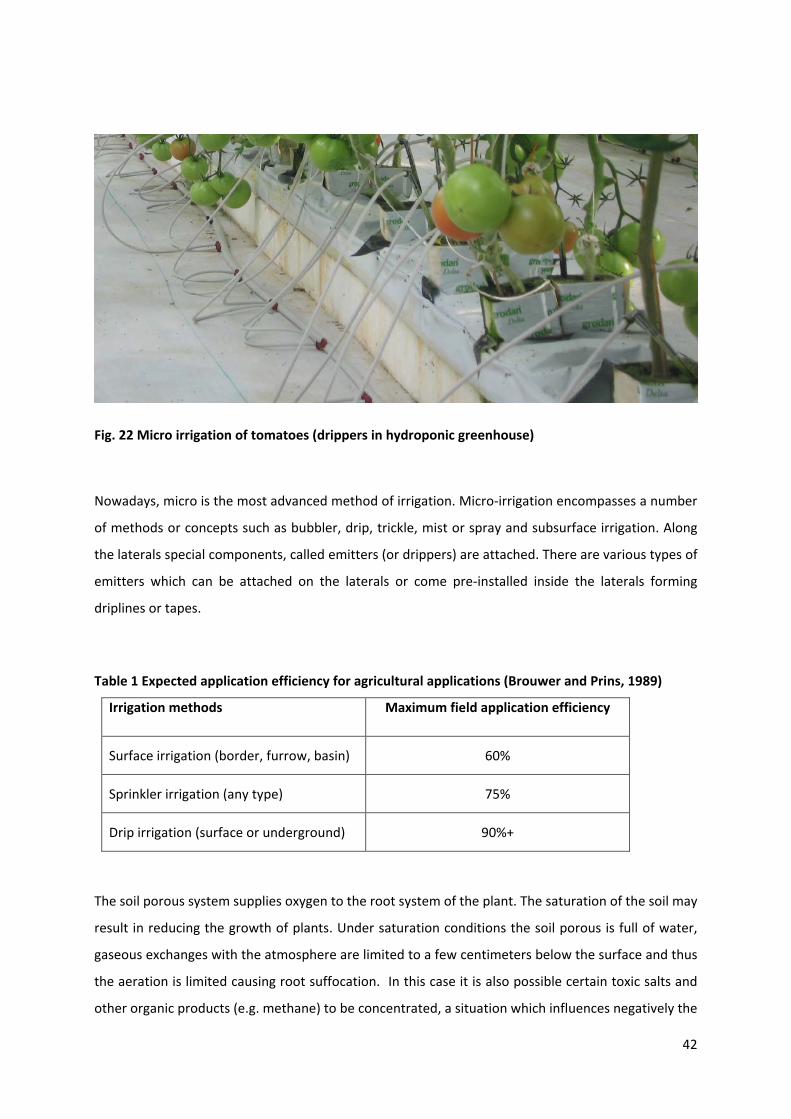
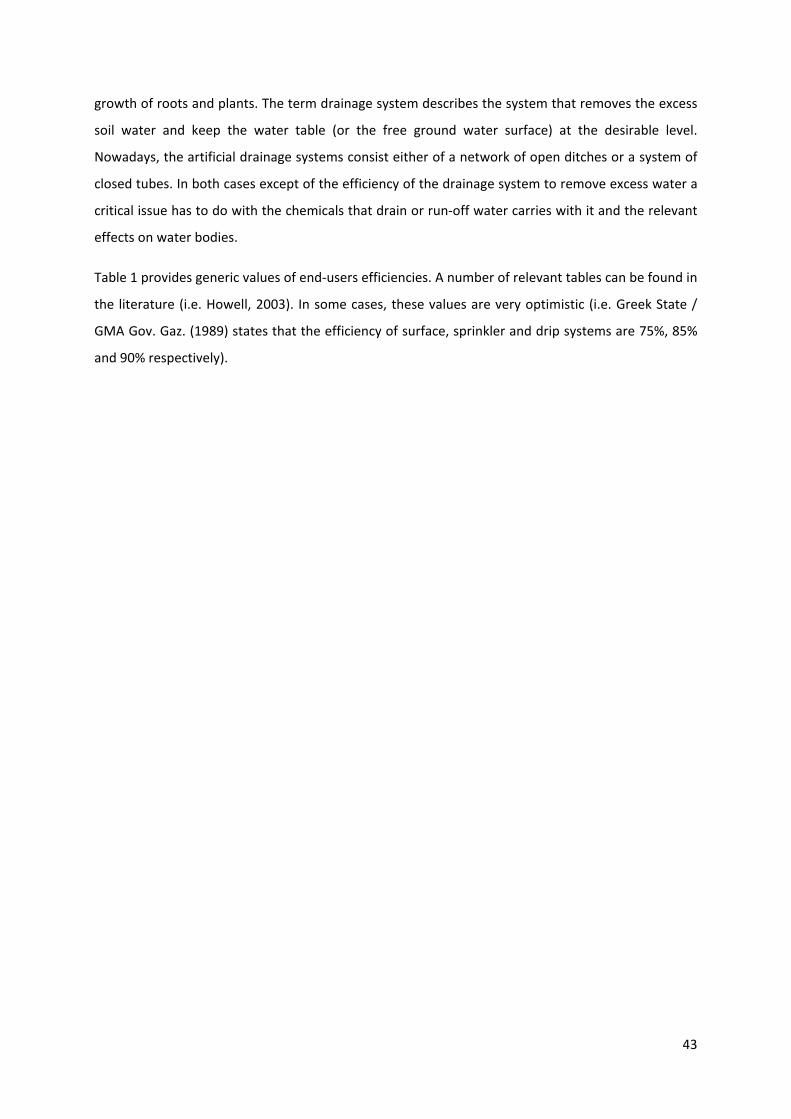
Fig. 22 Micro irrigation of tomatoes (drippers in hydroponic greenhouse)
Nowadays, micro is the most advanced method of irrigation. Micro-irrigation encompasses a number
of methods or concepts such as bubbler, drip, trickle, mist or spray and subsurface irrigation. Along
the laterals special components, called emitters (or drippers) are attached. There are various types of
emitters which can be attached on the laterals or come pre-installed inside the laterals forming
driplines or tapes.
Table 1 Expected application efficiency for agricultural applications (Brouwer and Prins, 1989)
Irrigation methods Maximum field application efficiency
Surface irrigation (border, furrow, basin) 60%
Sprinkler irrigation (any type) 75%
Drip irrigation (surface or underground) 90%+
The soil porous system supplies oxygen to the root system of the plant. The saturation of the soil may
result in reducing the growth of plants. Under saturation conditions the soil porous is full of water,
gaseous exchanges with the atmosphere are limited to a few centimeters below the surface and thus
the aeration is limited causing root suffocation. In this case it is also possible certain toxic salts and
other organic products (e.g. methane) to be concentrated, a situation which influences negatively the
42
growth of roots and plants. The term drainage system describes the system that removes the excess
soil water and keep the water table (or the free ground water surface) at the desirable level.
Nowadays, the artificial drainage systems consist either of a network of open ditches or a system of
closed tubes. In both cases except of the efficiency of the drainage system to remove excess water a
critical issue has to do with the chemicals that drain or run-off water carries with it and the relevant
effects on water bodies.
Table 1 provides generic values of end-users efficiencies. A number of relevant tables can be found in
the literature (i.e. Howell, 2003). In some cases, these values are very optimistic (i.e. Greek State /
GMA Gov. Gaz. (1989) states that the efficiency of surface, sprinkler and drip systems are 75%, 85%
and 90% respectively).
43
Tools for achieving, maintaining and improving water use
efficiency and irrigation application efficiency
A common question of managers is “how to manage what you do not measure”. Irrigation efficiency is
measured in terms of: 1) irrigation system performance, 2) uniformity of the water application and 3)
response of the crop to irrigation. All of these terms are interrelated and vary with scale and time
(Howell, 2003):
• the spatial scale can vary from a single irrigation application device (a siphon tube, a gated
pipe gate, a sprinkler, a micro-irrigation emitter) to an irrigation set (basin plot, a furrow set,
a single sprinkler lateral, or a micro-irrigation lateral) to broader land scales (field, farm, an
irrigation canal lateral, a whole irrigation district, a basin or watershed, a river system, or an
aquifer).
• the timescale can vary from a single application (or irrigation event), a part of the crop season
(field preparation, emergence to bloom or pollination, or reproduction to maturity), the
irrigation season, to a crop season, or a year, partial year (i.e. summer, etc.), or a water year
(typically from the beginning of spring snow melt through the end of irrigation diversion, or a
rainy season), or a period of years (a drought or a “wet” cycle).
Irrigation efficiency affects the economics of irrigation, the amount of water needed to irrigate a
specific land area, the spatial uniformity of the crop and its yield, the amount of water that might
percolate beneath the crop root zone, the amount of water that can return to surface sources for
downstream uses or to groundwater aquifers that might supply other water uses, and the amount of
water lost to unrecoverable sources (salt sink, saline aquifer, ocean, or unsaturated vadose zone).
According to Bos (1983 and 1990) the irrigation efficiency of each network can be measured in each
one of its levels: a) conveyance, b) distribution and c) field application. This is usually the case and thus
during auditing an irrigation network is divided in several parts and each one is being evaluated
separately according to its efficiency (conveyance efficiency, distribution efficiency, application
efficiency, overall network efficiency) (Fig. 23).
Efficiency is affected by several factors. According to Irrigation New Zealand (2010) some of those are:
a) climatic parameters (effective rainfalls, evapotranspiration etc.), b) soil and terrain characteristics
(texture, depth, slope etc), c) design and materials of irrigation systems, d) central control of systems
(entities organisation and applied management), e) maintenance of central systems, f) method and
44
management of water application at end-user level and g) expertise level and training of managers
and end-users.
Hamdy (2007) stressed the importance of increasing water use efficiency in the irrigation sector
considering the growing water scarcity and the misuse of the available water resources in the
Mediterranean region, by means of identifying the various components and improvements that can
be made in irrigation practices.
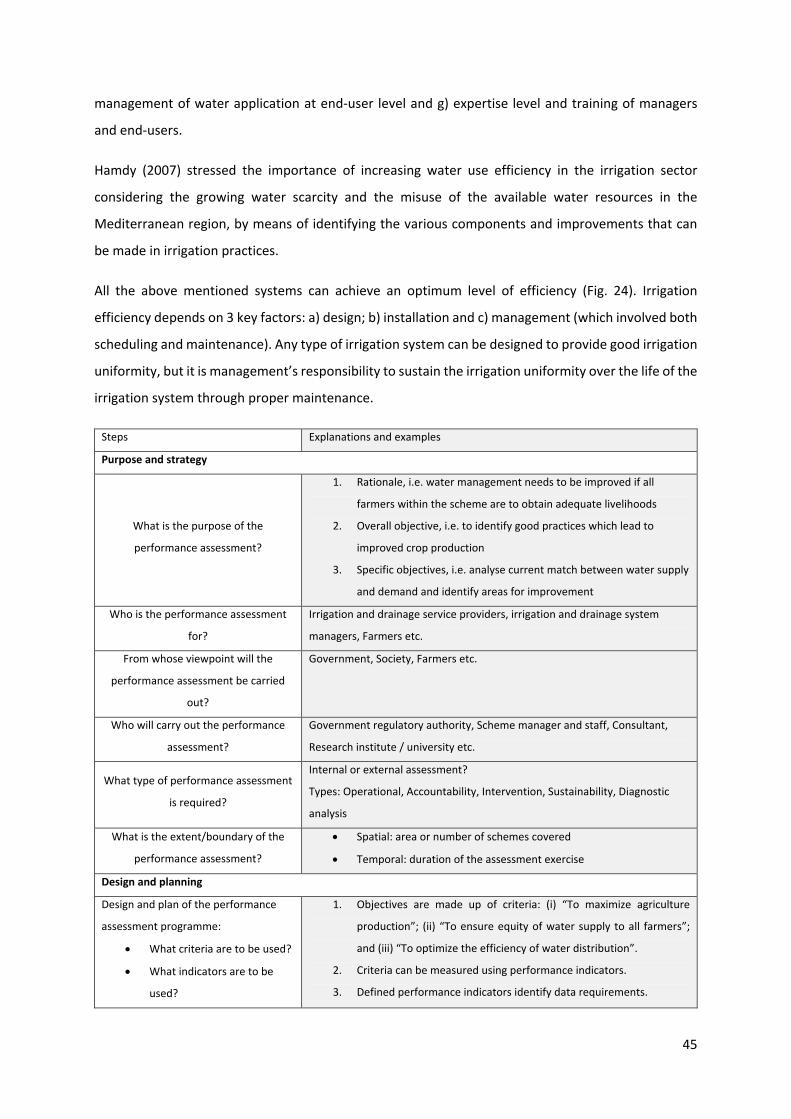
All the above mentioned systems can achieve an optimum level of efficiency (Fig. 24). Irrigation
efficiency depends on 3 key factors: a) design; b) installation and c) management (which involved both
scheduling and maintenance). Any type of irrigation system can be designed to provide good irrigation
uniformity, but it is management’s responsibility to sustain the irrigation uniformity over the life of the
irrigation system through proper maintenance.
Steps Explanations and examples
Purpose and strategy
What is the purpose of the
performance assessment?
1. Rationale, i.e. water management needs to be improved if all
farmers within the scheme are to obtain adequate livelihoods
2. Overall objective, i.e. to identify good practices which lead to
improved crop production
3. Specific objectives, i.e. analyse current match between water supply
and demand and identify areas for improvement
Who is the performance assessment
for?
Irrigation and drainage service providers, irrigation and drainage system
managers, Farmers etc.
From whose viewpoint will the
performance assessment be carried
out?
Government, Society, Farmers etc.
Who will carry out the performance
assessment?
Government regulatory authority, Scheme manager and staff, Consultant,
Research institute / university etc.
What type of performance assessment
is required?
Internal or external assessment?
Types: Operational, Accountability, Intervention, Sustainability, Diagnostic
analysis
What is the extent/boundary of the
performance assessment?
• Spatial: area or number of schemes covered
• Temporal: duration of the assessment exercise
Design and planning
Design and plan of the performance
assessment programme:
• What criteria are to be used?
• What indicators are to be
used?
1. Objectives are made up of criteria: (i) “To maximize agriculture
production”; (ii) “To ensure equity of water supply to all farmers”;
and (iii) “To optimize the efficiency of water distribution”.
2. Criteria can be measured using performance indicators.
3. Defined performance indicators identify data requirements.
45
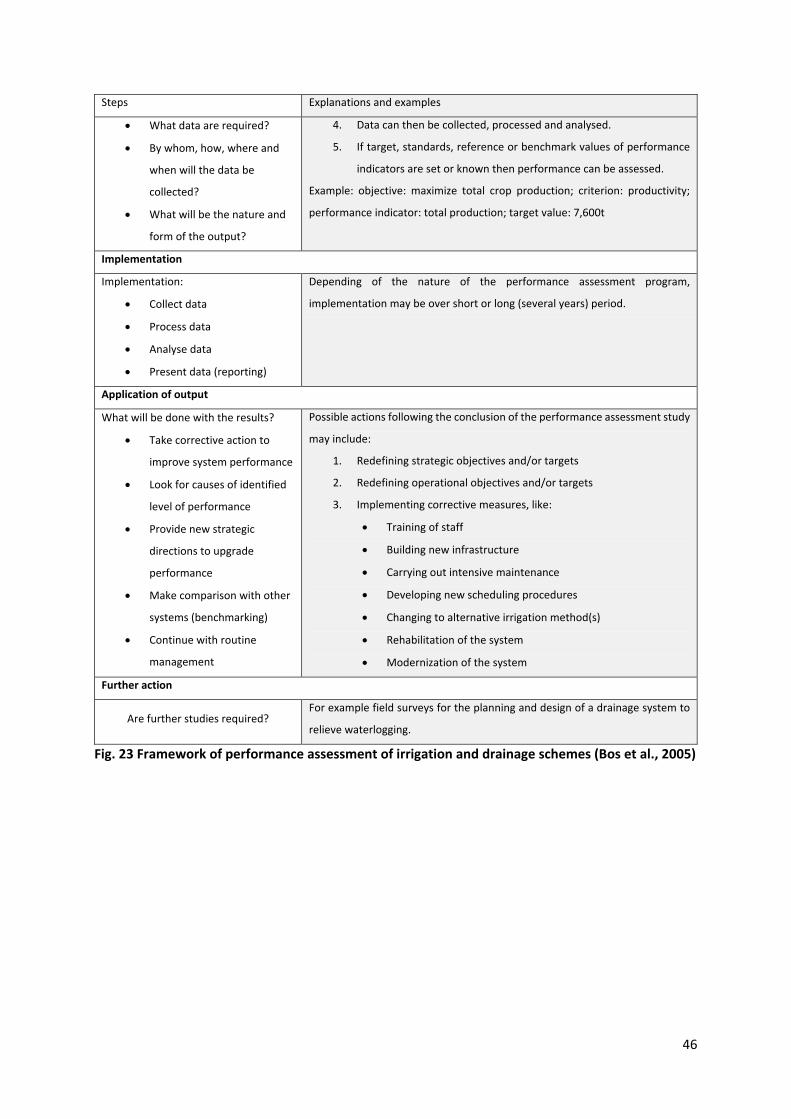
Steps Explanations and examples
• What data are required?
• By whom, how, where and
when will the data be
collected?
• What will be the nature and
form of the output?
4. Data can then be collected, processed and analysed.
5. If target, standards, reference or benchmark values of performance
indicators are set or known then performance can be assessed.
Example: objective: maximize total crop production; criterion: productivity;
performance indicator: total production; target value: 7,600t
Implementation
Implementation:
• Collect data
• Process data
• Analyse data
• Present data (reporting)
Depending of the nature of the performance assessment program,
implementation may be over short or long (several years) period.
Application of output
What will be done with the results?
• Take corrective action to
improve system performance
• Look for causes of identified
level of performance
• Provide new strategic
directions to upgrade
performance
• Make comparison with other
systems (benchmarking)
• Continue with routine
management
Possible actions following the conclusion of the performance assessment study
may include:
1. Redefining strategic objectives and/or targets
2. Redefining operational objectives and/or targets
3. Implementing corrective measures, like:
• Training of staff
• Building new infrastructure
• Carrying out intensive maintenance
• Developing new scheduling procedures
• Changing to alternative irrigation method(s)
• Rehabilitation of the system
• Modernization of the system
Further action
Are further studies required? For example field surveys for the planning and design of a drainage system to
relieve waterlogging.
Fig. 23 Framework of performance assessment of irrigation and drainage schemes (Bos et al., 2005)
46
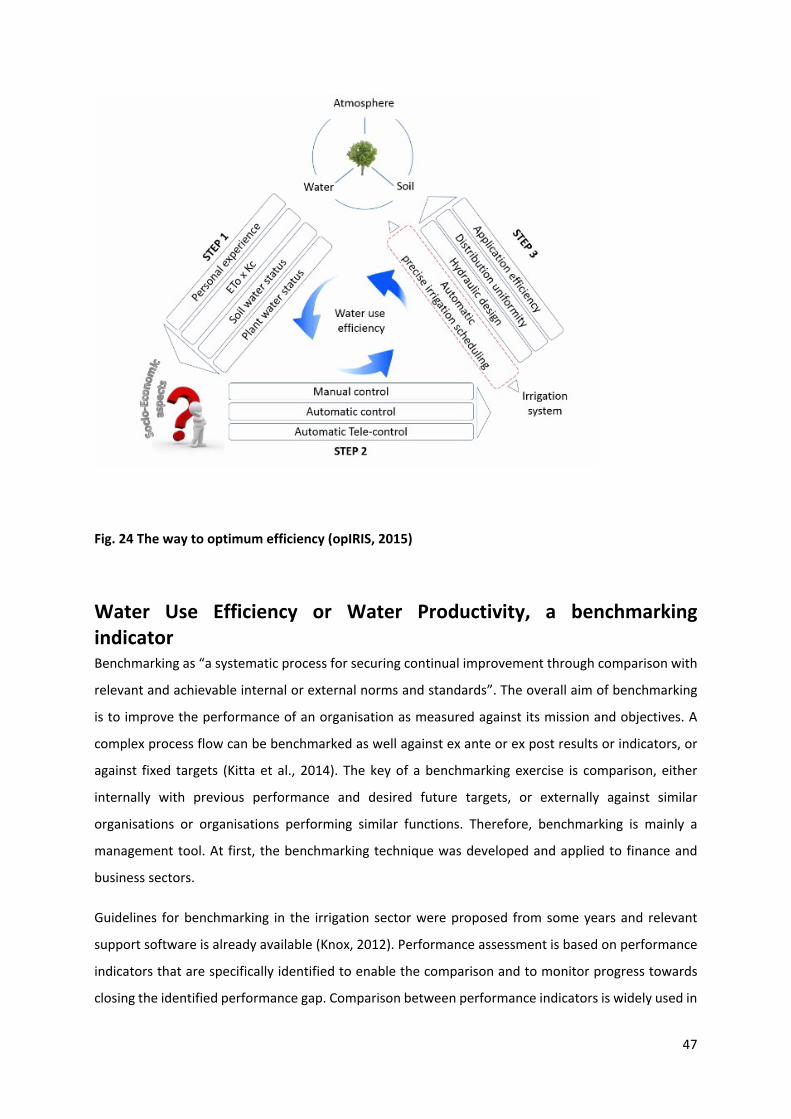
Fig. 24 The way to optimum efficiency (opIRIS, 2015)
Water Use Efficiency or Water Productivity, a benchmarking indicator Benchmarking as “a systematic process for securing continual improvement through comparison with
relevant and achievable internal or external norms and standards”. The overall aim of benchmarking
is to improve the performance of an organisation as measured against its mission and objectives. A
complex process flow can be benchmarked as well against ex ante or ex post results or indicators, or
against fixed targets (Kitta et al., 2014). The key of a benchmarking exercise is comparison, either
internally with previous performance and desired future targets, or externally against similar
organisations or organisations performing similar functions. Therefore, benchmarking is mainly a
management tool. At first, the benchmarking technique was developed and applied to finance and
business sectors.
Guidelines for benchmarking in the irrigation sector were proposed from some years and relevant
support software is already available (Knox, 2012). Performance assessment is based on performance
indicators that are specifically identified to enable the comparison and to monitor progress towards
closing the identified performance gap. Comparison between performance indicators is widely used in
47
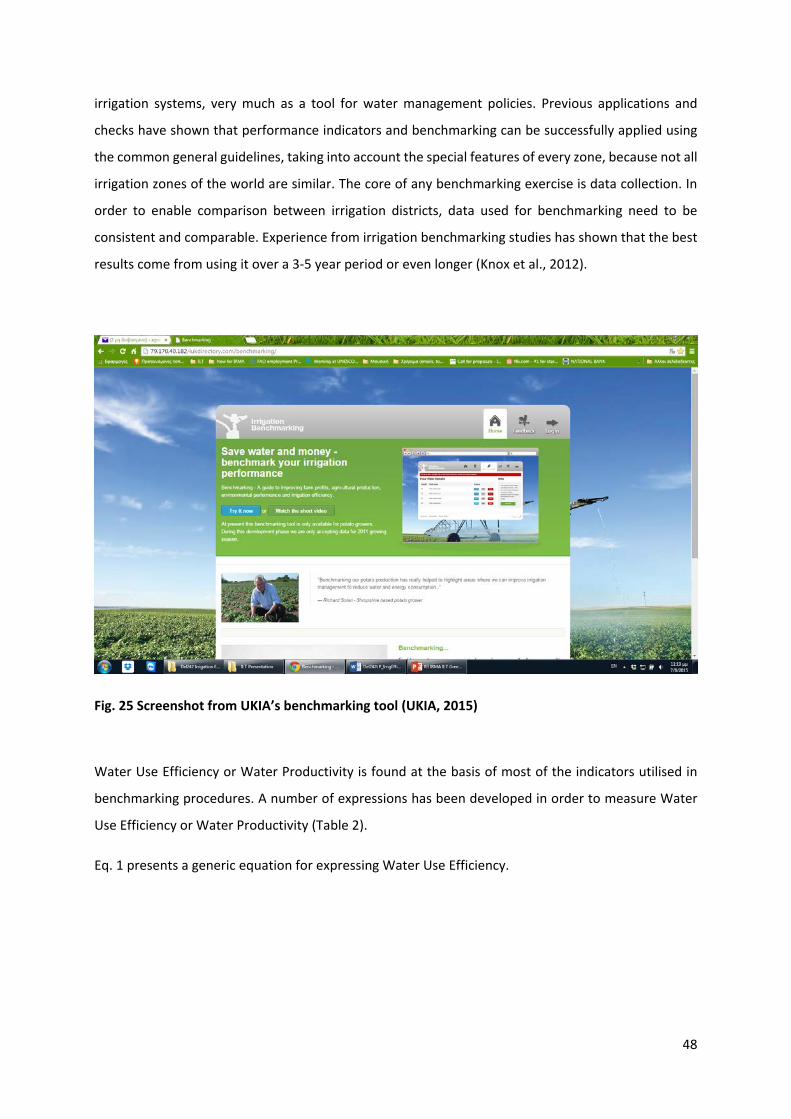
irrigation systems, very much as a tool for water management policies. Previous applications and
checks have shown that performance indicators and benchmarking can be successfully applied using
the common general guidelines, taking into account the special features of every zone, because not all
irrigation zones of the world are similar. The core of any benchmarking exercise is data collection. In
order to enable comparison between irrigation districts, data used for benchmarking need to be
consistent and comparable. Experience from irrigation benchmarking studies has shown that the best
results come from using it over a 3-5 year period or even longer (Knox et al., 2012).
Fig. 25 Screenshot from UKIA’s benchmarking tool (UKIA, 2015)
Water Use Efficiency or Water Productivity is found at the basis of most of the indicators utilised in
benchmarking procedures. A number of expressions has been developed in order to measure Water
Use Efficiency or Water Productivity (Table 2).
Eq. 1 presents a generic equation for expressing Water Use Efficiency.
48
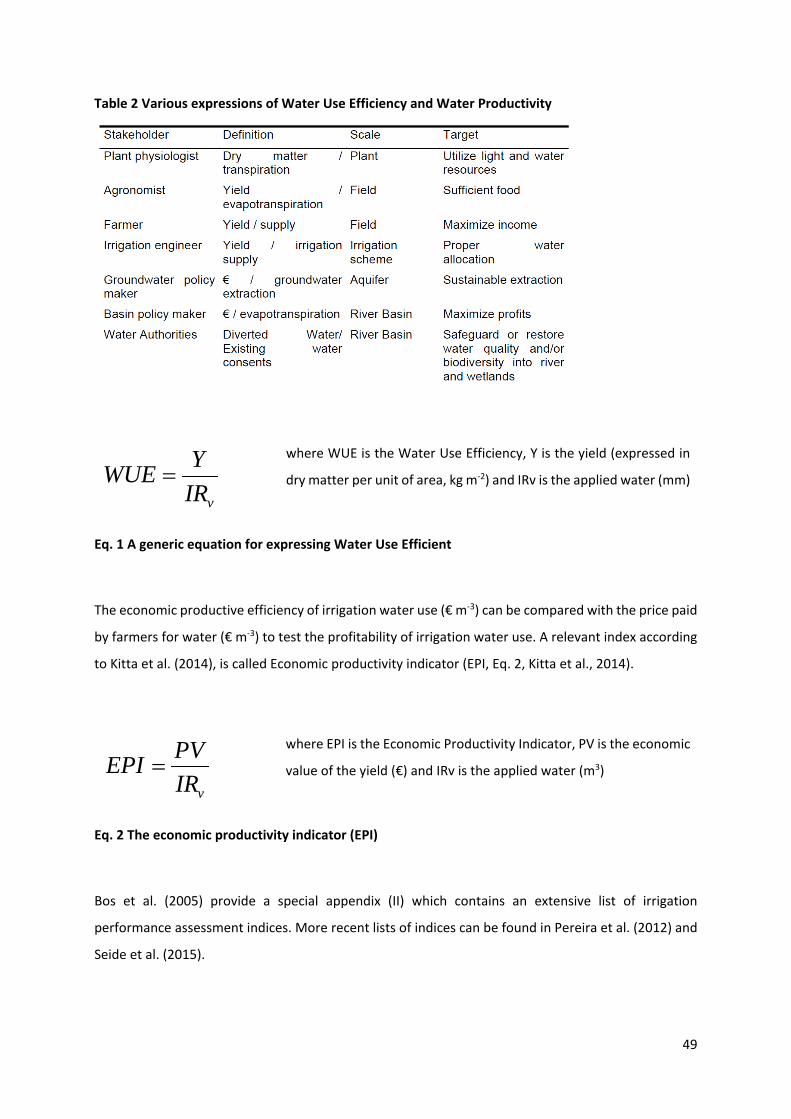
Table 2 Various expressions of Water Use Efficiency and Water Productivity
vIRYWUE =
where WUE is the Water Use Efficiency, Y is the yield (expressed in
dry matter per unit of area, kg m-2) and IRv is the applied water (mm)
Eq. 1 A generic equation for expressing Water Use Efficient
The economic productive efficiency of irrigation water use (€ m-3) can be compared with the price paid
by farmers for water (€ m-3) to test the profitability of irrigation water use. A relevant index according
to Kitta et al. (2014), is called Economic productivity indicator (EPI, Eq. 2, Kitta et al., 2014).
vIRPVEPI =
where EPI is the Economic Productivity Indicator, PV is the economic
value of the yield (€) and IRv is the applied water (m3)
Eq. 2 The economic productivity indicator (EPI)
Bos et al. (2005) provide a special appendix (II) which contains an extensive list of irrigation
performance assessment indices. More recent lists of indices can be found in Pereira et al. (2012) and
Seide et al. (2015).
49
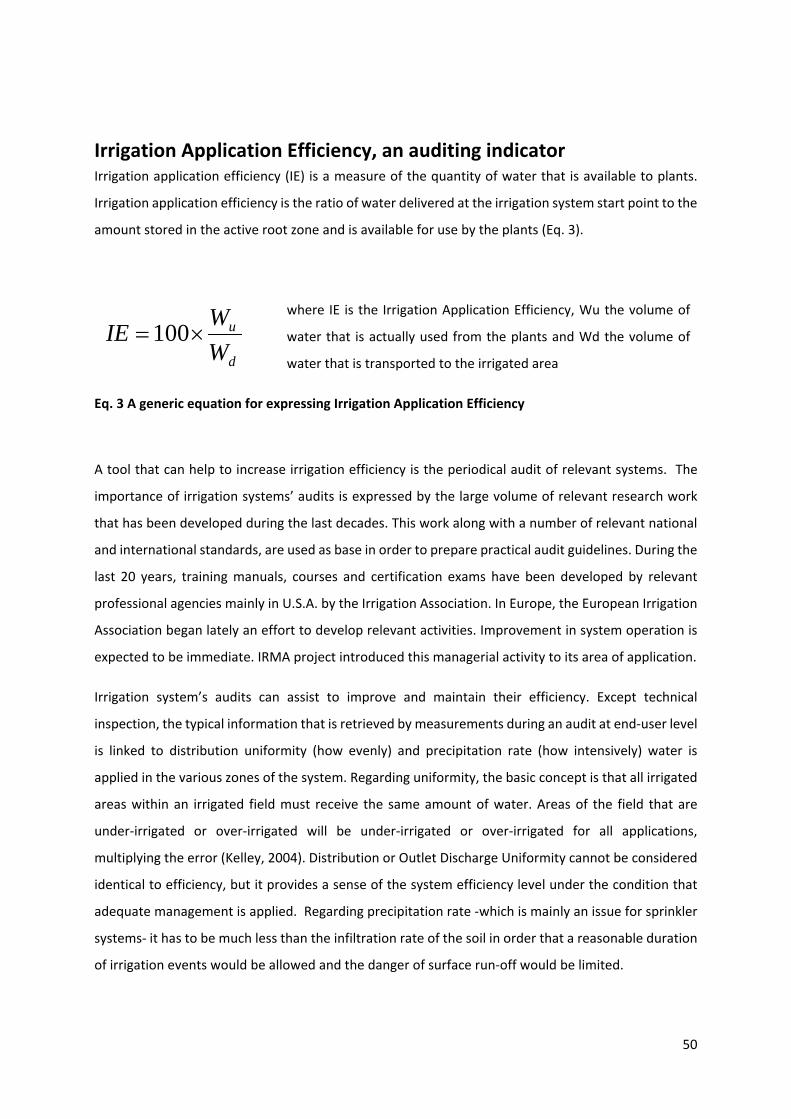
Irrigation Application Efficiency, an auditing indicator Irrigation application efficiency (IE) is a measure of the quantity of water that is available to plants.
Irrigation application efficiency is the ratio of water delivered at the irrigation system start point to the
amount stored in the active root zone and is available for use by the plants (Eq. 3).
d
u
WWIE ×=100
where IE is the Irrigation Application Efficiency, Wu the volume of
water that is actually used from the plants and Wd the volume of
water that is transported to the irrigated area
Eq. 3 A generic equation for expressing Irrigation Application Efficiency
A tool that can help to increase irrigation efficiency is the periodical audit of relevant systems. The
importance of irrigation systems’ audits is expressed by the large volume of relevant research work
that has been developed during the last decades. This work along with a number of relevant national
and international standards, are used as base in order to prepare practical audit guidelines. During the
last 20 years, training manuals, courses and certification exams have been developed by relevant
professional agencies mainly in U.S.A. by the Irrigation Association. In Europe, the European Irrigation
Association began lately an effort to develop relevant activities. Improvement in system operation is
expected to be immediate. IRMA project introduced this managerial activity to its area of application.
Irrigation system’s audits can assist to improve and maintain their efficiency. Except technical
inspection, the typical information that is retrieved by measurements during an audit at end-user level
is linked to distribution uniformity (how evenly) and precipitation rate (how intensively) water is
applied in the various zones of the system. Regarding uniformity, the basic concept is that all irrigated
areas within an irrigated field must receive the same amount of water. Areas of the field that are
under-irrigated or over-irrigated will be under-irrigated or over-irrigated for all applications,
multiplying the error (Kelley, 2004). Distribution or Outlet Discharge Uniformity cannot be considered
identical to efficiency, but it provides a sense of the system efficiency level under the condition that
adequate management is applied. Regarding precipitation rate -which is mainly an issue for sprinkler
systems- it has to be much less than the infiltration rate of the soil in order that a reasonable duration
of irrigation events would be allowed and the danger of surface run-off would be limited.
50
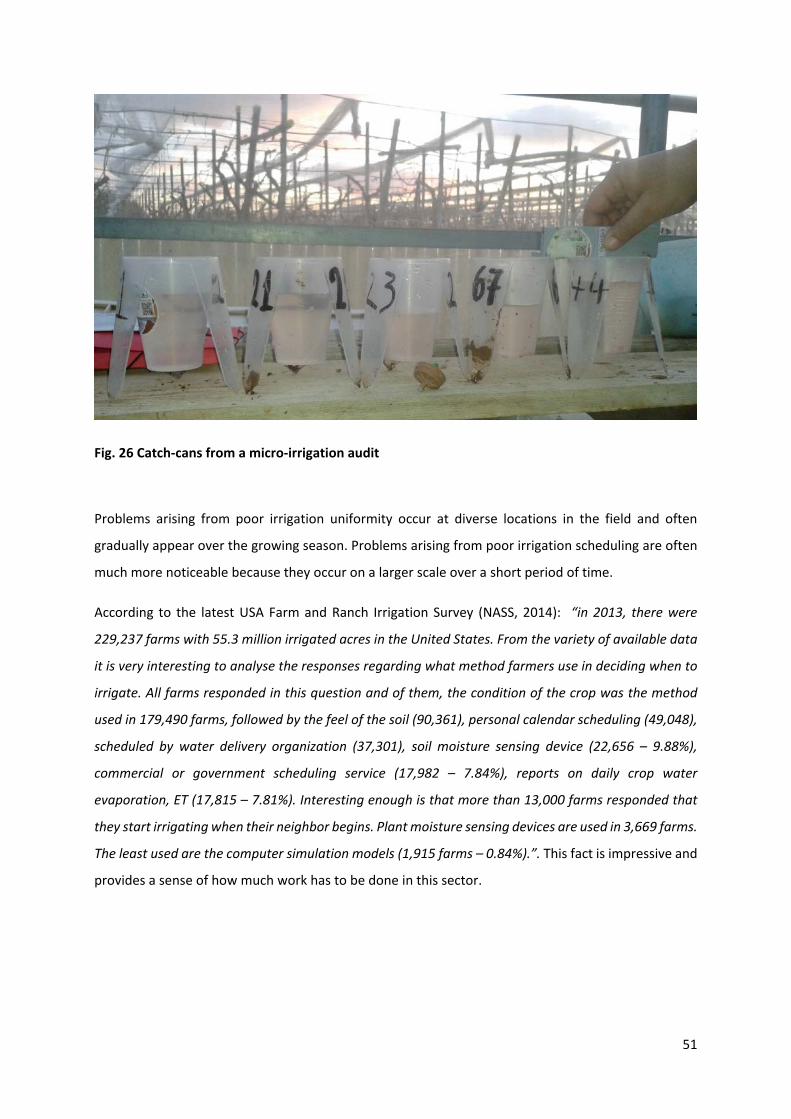
Fig. 26 Catch-cans from a micro-irrigation audit
Problems arising from poor irrigation uniformity occur at diverse locations in the field and often
gradually appear over the growing season. Problems arising from poor irrigation scheduling are often
much more noticeable because they occur on a larger scale over a short period of time.
According to the latest USA Farm and Ranch Irrigation Survey (NASS, 2014): “in 2013, there were
229,237 farms with 55.3 million irrigated acres in the United States. From the variety of available data
it is very interesting to analyse the responses regarding what method farmers use in deciding when to
irrigate. All farms responded in this question and of them, the condition of the crop was the method
used in 179,490 farms, followed by the feel of the soil (90,361), personal calendar scheduling (49,048),
scheduled by water delivery organization (37,301), soil moisture sensing device (22,656 – 9.88%),
commercial or government scheduling service (17,982 – 7.84%), reports on daily crop water
evaporation, ET (17,815 – 7.81%). Interesting enough is that more than 13,000 farms responded that
they start irrigating when their neighbor begins. Plant moisture sensing devices are used in 3,669 farms.
The least used are the computer simulation models (1,915 farms – 0.84%).”. This fact is impressive and
provides a sense of how much work has to be done in this sector.
51

Notes
52
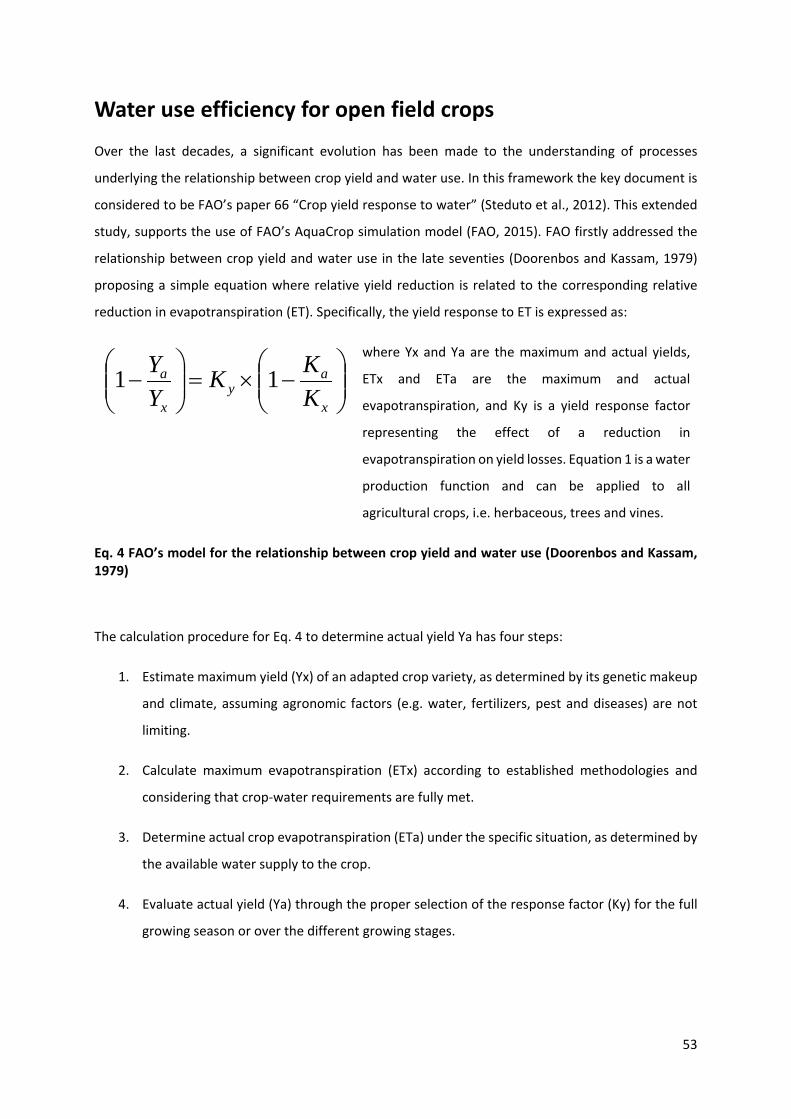
Water use efficiency for open field crops
Over the last decades, a significant evolution has been made to the understanding of processes
underlying the relationship between crop yield and water use. In this framework the key document is
considered to be FAO’s paper 66 “Crop yield response to water” (Steduto et al., 2012). This extended
study, supports the use of FAO’s AquaCrop simulation model (FAO, 2015). FAO firstly addressed the
relationship between crop yield and water use in the late seventies (Doorenbos and Kassam, 1979)
proposing a simple equation where relative yield reduction is related to the corresponding relative
reduction in evapotranspiration (ET). Specifically, the yield response to ET is expressed as:
−×=
−
x
ay
x
a
KKK
YY 11
where Yx and Ya are the maximum and actual yields,
ETx and ETa are the maximum and actual
evapotranspiration, and Ky is a yield response factor
representing the effect of a reduction in
evapotranspiration on yield losses. Equation 1 is a water
production function and can be applied to all
agricultural crops, i.e. herbaceous, trees and vines.
Eq. 4 FAO’s model for the relationship between crop yield and water use (Doorenbos and Kassam, 1979)
The calculation procedure for Eq. 4 to determine actual yield Ya has four steps:
1. Estimate maximum yield (Yx) of an adapted crop variety, as determined by its genetic makeup
and climate, assuming agronomic factors (e.g. water, fertilizers, pest and diseases) are not
limiting.
2. Calculate maximum evapotranspiration (ETx) according to established methodologies and
considering that crop-water requirements are fully met.
3. Determine actual crop evapotranspiration (ETa) under the specific situation, as determined by
the available water supply to the crop.
4. Evaluate actual yield (Ya) through the proper selection of the response factor (Ky) for the full
growing season or over the different growing stages.
53

In the next pages information regarding olive, kiwifruit and citrus water usage will be provided. The
selection of these crops was based on the fact that they are wide spread in the IRMA project area in
both Italy and Greece.
Notes
54
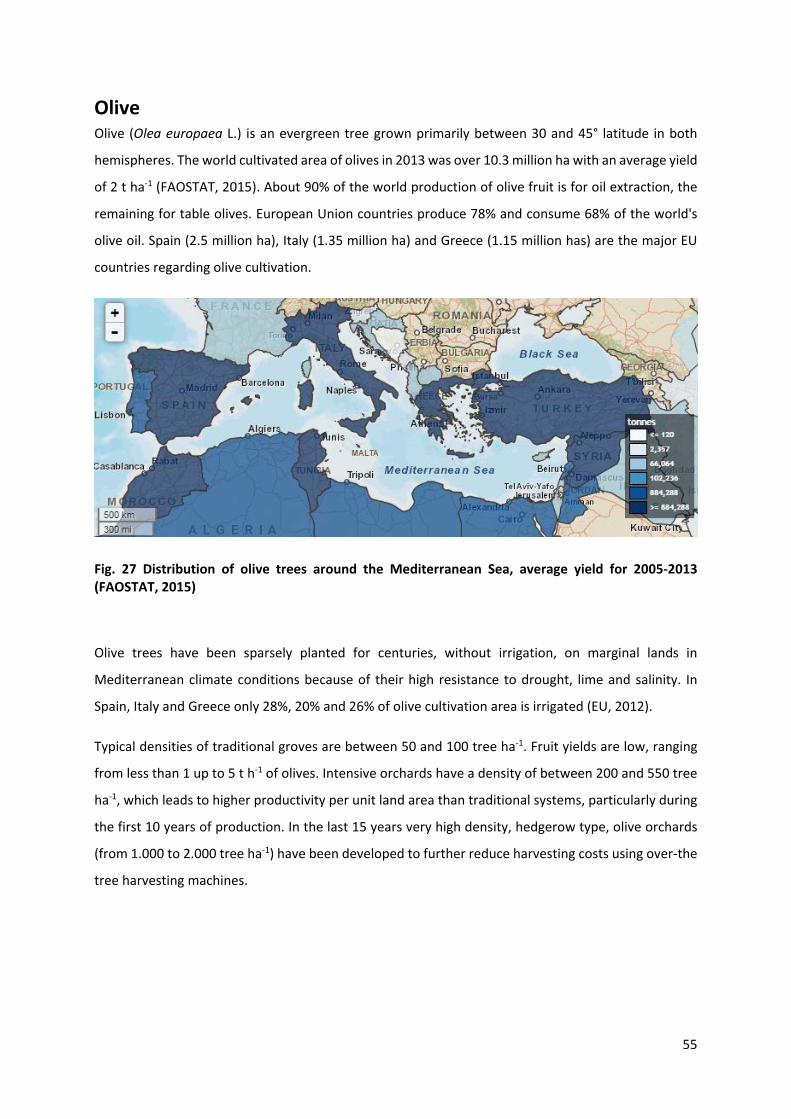
Olive Olive (Olea europaea L.) is an evergreen tree grown primarily between 30 and 45° latitude in both
hemispheres. The world cultivated area of olives in 2013 was over 10.3 million ha with an average yield
of 2 t ha-1 (FAOSTAT, 2015). About 90% of the world production of olive fruit is for oil extraction, the
remaining for table olives. European Union countries produce 78% and consume 68% of the world's
olive oil. Spain (2.5 million ha), Italy (1.35 million ha) and Greece (1.15 million has) are the major EU
countries regarding olive cultivation.
Fig. 27 Distribution of olive trees around the Mediterranean Sea, average yield for 2005-2013 (FAOSTAT, 2015)
Olive trees have been sparsely planted for centuries, without irrigation, on marginal lands in
Mediterranean climate conditions because of their high resistance to drought, lime and salinity. In
Spain, Italy and Greece only 28%, 20% and 26% of olive cultivation area is irrigated (EU, 2012).
Typical densities of traditional groves are between 50 and 100 tree ha-1. Fruit yields are low, ranging
from less than 1 up to 5 t h-1 of olives. Intensive orchards have a density of between 200 and 550 tree
ha-1, which leads to higher productivity per unit land area than traditional systems, particularly during
the first 10 years of production. In the last 15 years very high density, hedgerow type, olive orchards
(from 1.000 to 2.000 tree ha-1) have been developed to further reduce harvesting costs using over-the
tree harvesting machines.
55
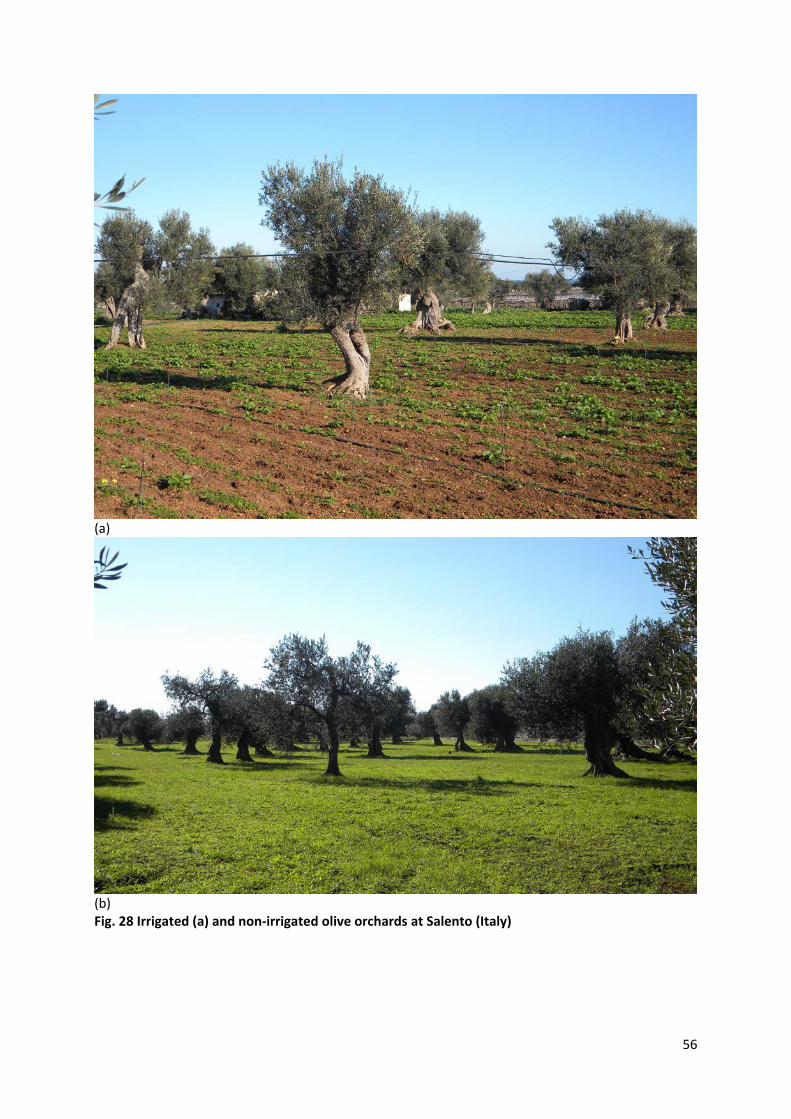
(a)
(b) Fig. 28 Irrigated (a) and non-irrigated olive orchards at Salento (Italy)
56
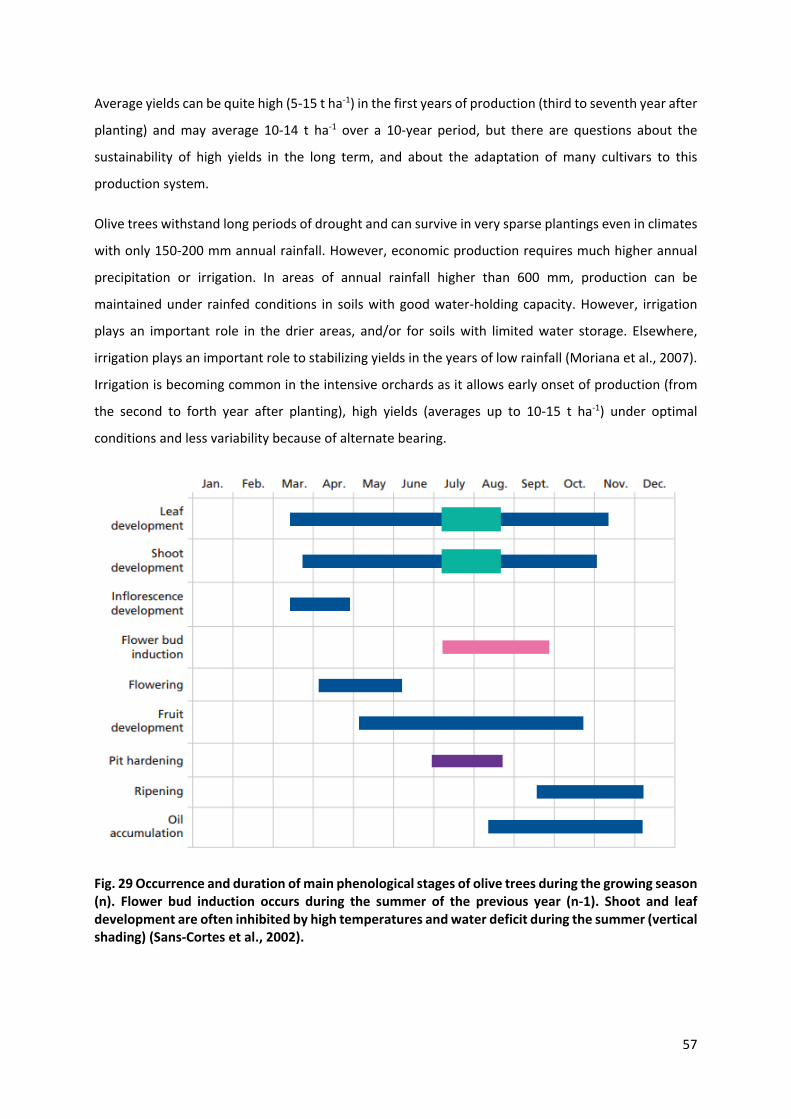
Average yields can be quite high (5-15 t ha-1) in the first years of production (third to seventh year after
planting) and may average 10-14 t ha-1 over a 10-year period, but there are questions about the
sustainability of high yields in the long term, and about the adaptation of many cultivars to this
production system.
Olive trees withstand long periods of drought and can survive in very sparse plantings even in climates
with only 150-200 mm annual rainfall. However, economic production requires much higher annual
precipitation or irrigation. In areas of annual rainfall higher than 600 mm, production can be
maintained under rainfed conditions in soils with good water-holding capacity. However, irrigation
plays an important role in the drier areas, and/or for soils with limited water storage. Elsewhere,
irrigation plays an important role to stabilizing yields in the years of low rainfall (Moriana et al., 2007).
Irrigation is becoming common in the intensive orchards as it allows early onset of production (from
the second to forth year after planting), high yields (averages up to 10-15 t ha-1) under optimal
conditions and less variability because of alternate bearing.
Fig. 29 Occurrence and duration of main phenological stages of olive trees during the growing season (n). Flower bud induction occurs during the summer of the previous year (n-1). Shoot and leaf development are often inhibited by high temperatures and water deficit during the summer (vertical shading) (Sans-Cortes et al., 2002).
57
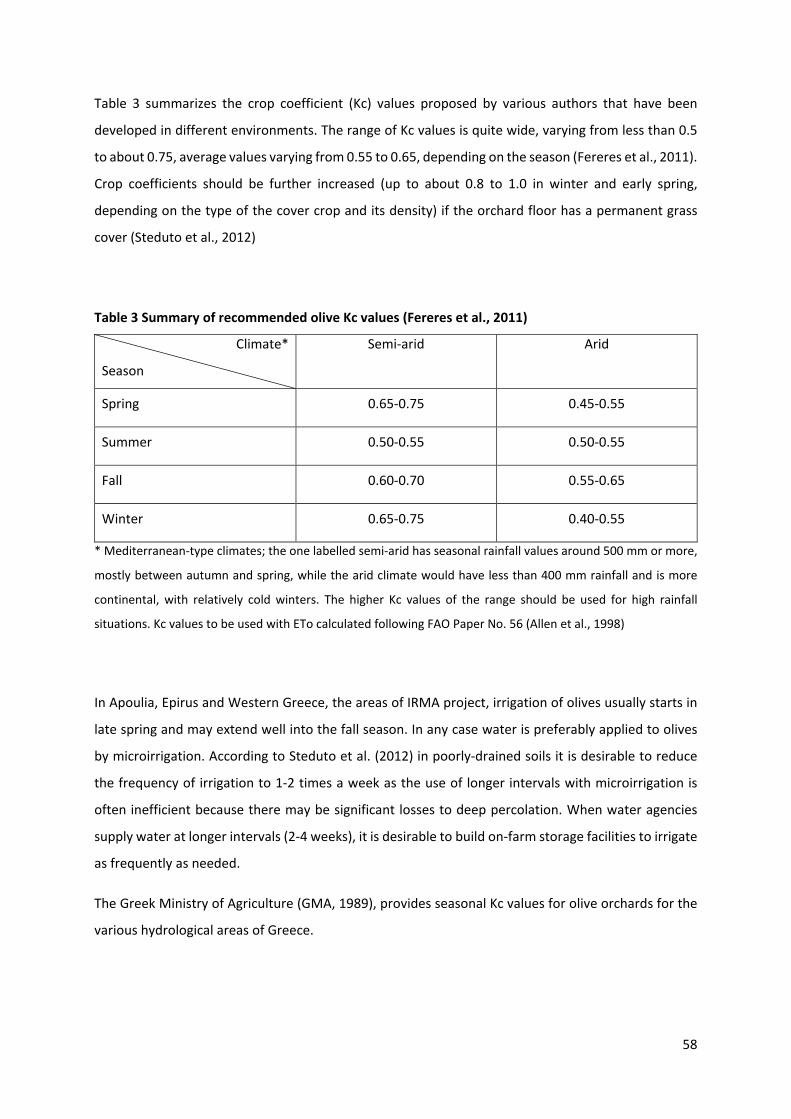
Table 3 summarizes the crop coefficient (Kc) values proposed by various authors that have been
developed in different environments. The range of Kc values is quite wide, varying from less than 0.5
to about 0.75, average values varying from 0.55 to 0.65, depending on the season (Fereres et al., 2011).
Crop coefficients should be further increased (up to about 0.8 to 1.0 in winter and early spring,
depending on the type of the cover crop and its density) if the orchard floor has a permanent grass
cover (Steduto et al., 2012)
Table 3 Summary of recommended olive Kc values (Fereres et al., 2011)
Climate*
Season
Semi-arid Arid
Spring 0.65-0.75 0.45-0.55
Summer 0.50-0.55 0.50-0.55
Fall 0.60-0.70 0.55-0.65
Winter 0.65-0.75 0.40-0.55
* Mediterranean-type climates; the one labelled semi-arid has seasonal rainfall values around 500 mm or more,
mostly between autumn and spring, while the arid climate would have less than 400 mm rainfall and is more
continental, with relatively cold winters. The higher Kc values of the range should be used for high rainfall
situations. Kc values to be used with ETo calculated following FAO Paper No. 56 (Allen et al., 1998)
In Apoulia, Epirus and Western Greece, the areas of IRMA project, irrigation of olives usually starts in
late spring and may extend well into the fall season. In any case water is preferably applied to olives
by microirrigation. According to Steduto et al. (2012) in poorly-drained soils it is desirable to reduce
the frequency of irrigation to 1-2 times a week as the use of longer intervals with microirrigation is
often inefficient because there may be significant losses to deep percolation. When water agencies
supply water at longer intervals (2-4 weeks), it is desirable to build on-farm storage facilities to irrigate
as frequently as needed.
The Greek Ministry of Agriculture (GMA, 1989), provides seasonal Kc values for olive orchards for the
various hydrological areas of Greece.
58
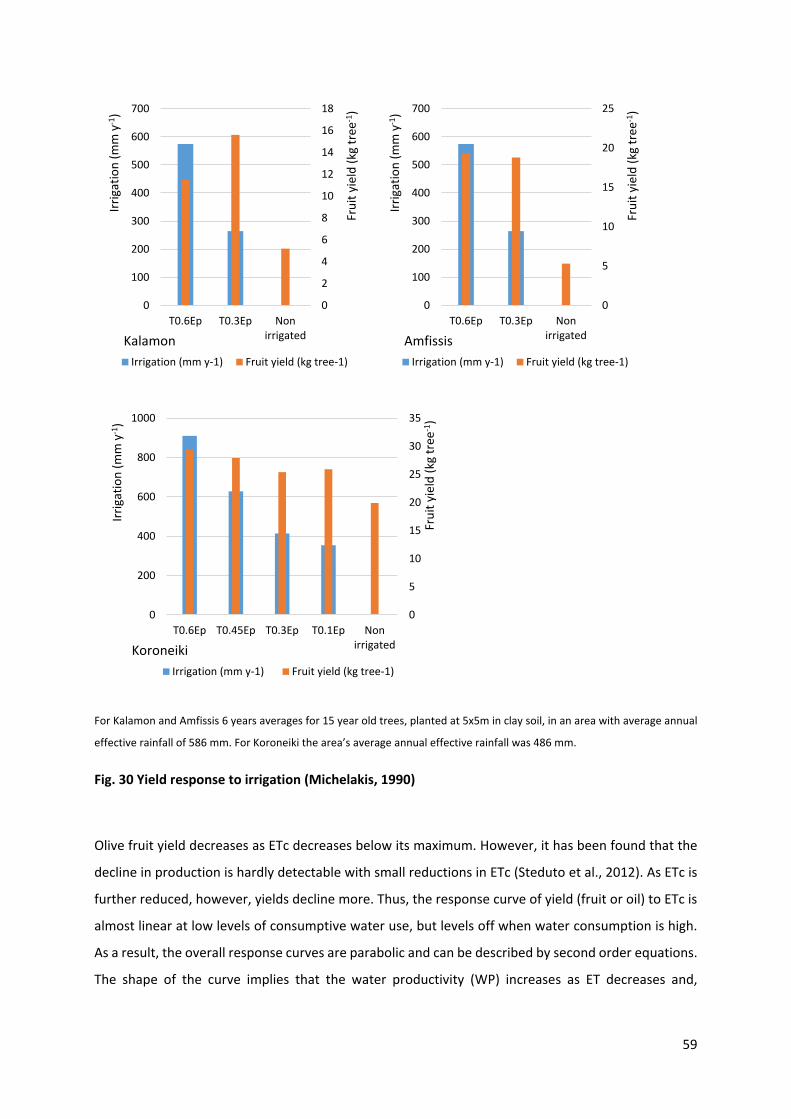
For Kalamon and Amfissis 6 years averages for 15 year old trees, planted at 5x5m in clay soil, in an area with average annual
effective rainfall of 586 mm. For Koroneiki the area’s average annual effective rainfall was 486 mm.
Fig. 30 Yield response to irrigation (Michelakis, 1990)
Olive fruit yield decreases as ETc decreases below its maximum. However, it has been found that the
decline in production is hardly detectable with small reductions in ETc (Steduto et al., 2012). As ETc is
further reduced, however, yields decline more. Thus, the response curve of yield (fruit or oil) to ETc is
almost linear at low levels of consumptive water use, but levels off when water consumption is high.
As a result, the overall response curves are parabolic and can be described by second order equations.
The shape of the curve implies that the water productivity (WP) increases as ET decreases and,
0
2
4
6
8
10
12
14
16
18
0
100
200
300
400
500
600
700
T0.6Ep T0.3Ep Nonirrigated
Frui
t yie
ld (k
g tr
ee-1
)
Irrig
atio
n (m
m y
-1)
KalamonIrrigation (mm y-1) Fruit yield (kg tree-1)
0
5
10
15
20
25
0
100
200
300
400
500
600
700
T0.6Ep T0.3Ep Nonirrigated
Frui
t yie
ld (k
g tr
ee-1
)
Irrig
atio
n (m
m y
-1)
AmfissisIrrigation (mm y-1) Fruit yield (kg tree-1)
0
5
10
15
20
25
30
35
0
200
400
600
800
1000
T0.6Ep T0.45Ep T0.3Ep T0.1Ep Nonirrigated
Frui
t yie
ld (k
g tr
ee-1
)
Irrig
atio
n (m
m y
-1)
KoroneikiIrrigation (mm y-1) Fruit yield (kg tree-1)
59
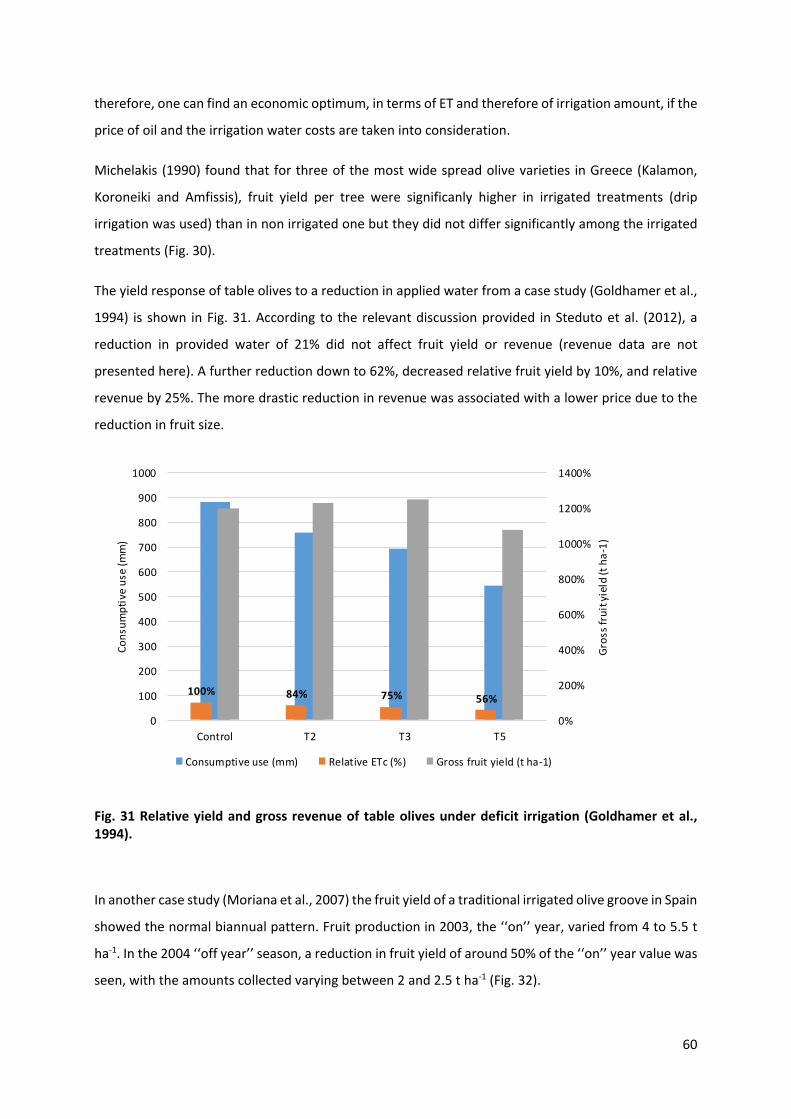
therefore, one can find an economic optimum, in terms of ET and therefore of irrigation amount, if the
price of oil and the irrigation water costs are taken into consideration.
Michelakis (1990) found that for three of the most wide spread olive varieties in Greece (Kalamon,
Koroneiki and Amfissis), fruit yield per tree were significanly higher in irrigated treatments (drip
irrigation was used) than in non irrigated one but they did not differ significantly among the irrigated
treatments (Fig. 30).
The yield response of table olives to a reduction in applied water from a case study (Goldhamer et al.,
1994) is shown in Fig. 31. According to the relevant discussion provided in Steduto et al. (2012), a
reduction in provided water of 21% did not affect fruit yield or revenue (revenue data are not
presented here). A further reduction down to 62%, decreased relative fruit yield by 10%, and relative
revenue by 25%. The more drastic reduction in revenue was associated with a lower price due to the
reduction in fruit size.
100% 84% 75% 56%
0%
200%
400%
600%
800%
1000%
1200%
1400%
0
100
200
300
400
500
600
700
800
900
1000
Control T2 T3 T5
Gros
s fru
it yi
eld
(t ha
-1)
Cons
umpt
ive
use
(mm
)
Consumptive use (mm) Relative ETc (%) Gross fruit yield (t ha-1)
Fig. 31 Relative yield and gross revenue of table olives under deficit irrigation (Goldhamer et al., 1994).
In another case study (Moriana et al., 2007) the fruit yield of a traditional irrigated olive groove in Spain
showed the normal biannual pattern. Fruit production in 2003, the ‘‘on’’ year, varied from 4 to 5.5 t
ha-1. In the 2004 ‘‘off year’’ season, a reduction in fruit yield of around 50% of the ‘‘on’’ year value was
seen, with the amounts collected varying between 2 and 2.5 t ha-1 (Fig. 32).
60
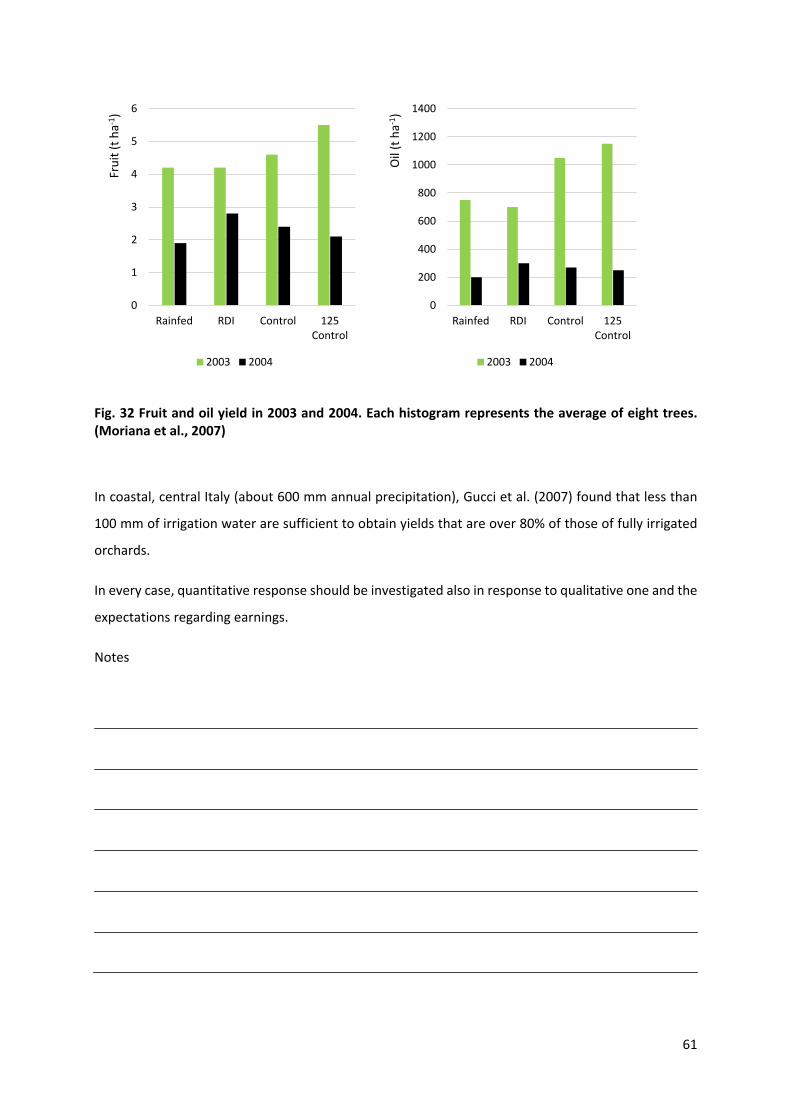
Fig. 32 Fruit and oil yield in 2003 and 2004. Each histogram represents the average of eight trees. (Moriana et al., 2007)
In coastal, central Italy (about 600 mm annual precipitation), Gucci et al. (2007) found that less than
100 mm of irrigation water are sufficient to obtain yields that are over 80% of those of fully irrigated
orchards.
In every case, quantitative response should be investigated also in response to qualitative one and the
expectations regarding earnings.
Notes
0
1
2
3
4
5
6
Rainfed RDI Control 125Control
Frui
t (t h
a-1)
2003 2004
0
200
400
600
800
1000
1200
1400
Rainfed RDI Control 125Control
Oil
(t h
a-1)
2003 2004
61

Notes
62
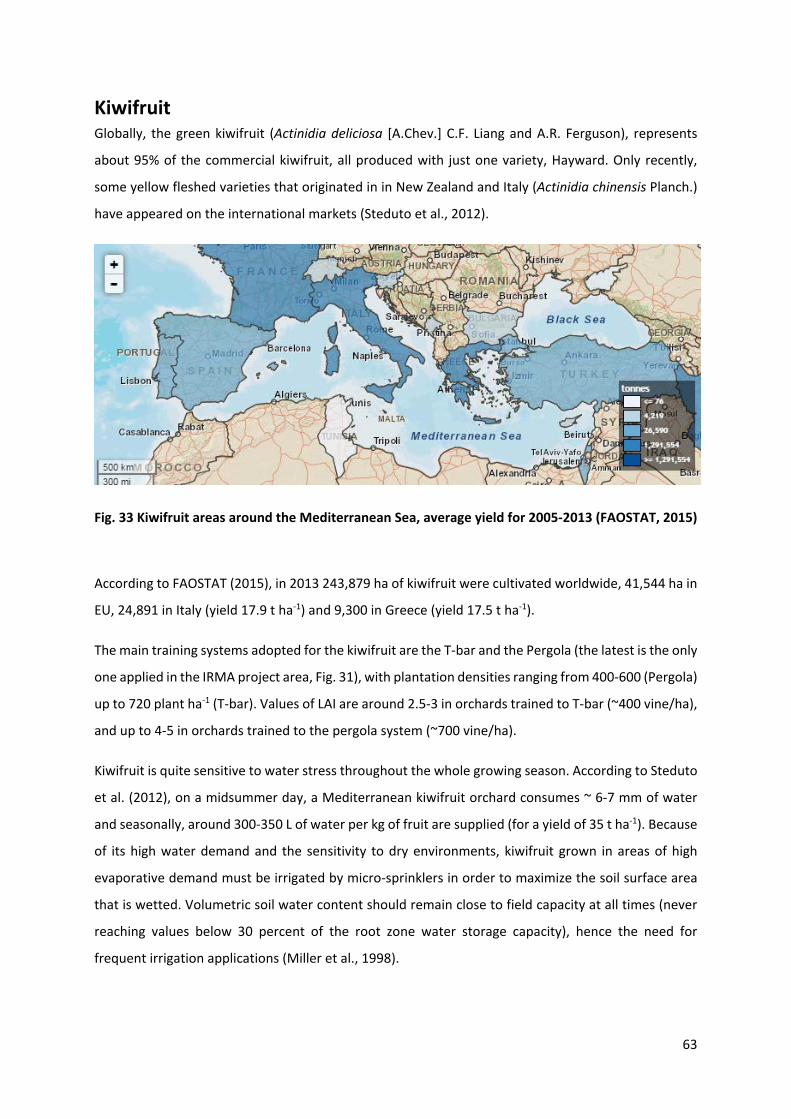
Kiwifruit Globally, the green kiwifruit (Actinidia deliciosa [A.Chev.] C.F. Liang and A.R. Ferguson), represents
about 95% of the commercial kiwifruit, all produced with just one variety, Hayward. Only recently,
some yellow fleshed varieties that originated in in New Zealand and Italy (Actinidia chinensis Planch.)
have appeared on the international markets (Steduto et al., 2012).
Fig. 33 Kiwifruit areas around the Mediterranean Sea, average yield for 2005-2013 (FAOSTAT, 2015)
According to FAOSTAT (2015), in 2013 243,879 ha of kiwifruit were cultivated worldwide, 41,544 ha in
EU, 24,891 in Italy (yield 17.9 t ha-1) and 9,300 in Greece (yield 17.5 t ha-1).
The main training systems adopted for the kiwifruit are the T-bar and the Pergola (the latest is the only
one applied in the IRMA project area, Fig. 31), with plantation densities ranging from 400-600 (Pergola)
up to 720 plant ha-1 (T-bar). Values of LAI are around 2.5-3 in orchards trained to T-bar (~400 vine/ha),
and up to 4-5 in orchards trained to the pergola system (~700 vine/ha).
Kiwifruit is quite sensitive to water stress throughout the whole growing season. According to Steduto
et al. (2012), on a midsummer day, a Mediterranean kiwifruit orchard consumes ~ 6-7 mm of water
and seasonally, around 300-350 L of water per kg of fruit are supplied (for a yield of 35 t ha-1). Because
of its high water demand and the sensitivity to dry environments, kiwifruit grown in areas of high
evaporative demand must be irrigated by micro-sprinklers in order to maximize the soil surface area
that is wetted. Volumetric soil water content should remain close to field capacity at all times (never
reaching values below 30 percent of the root zone water storage capacity), hence the need for
frequent irrigation applications (Miller et al., 1998).
63
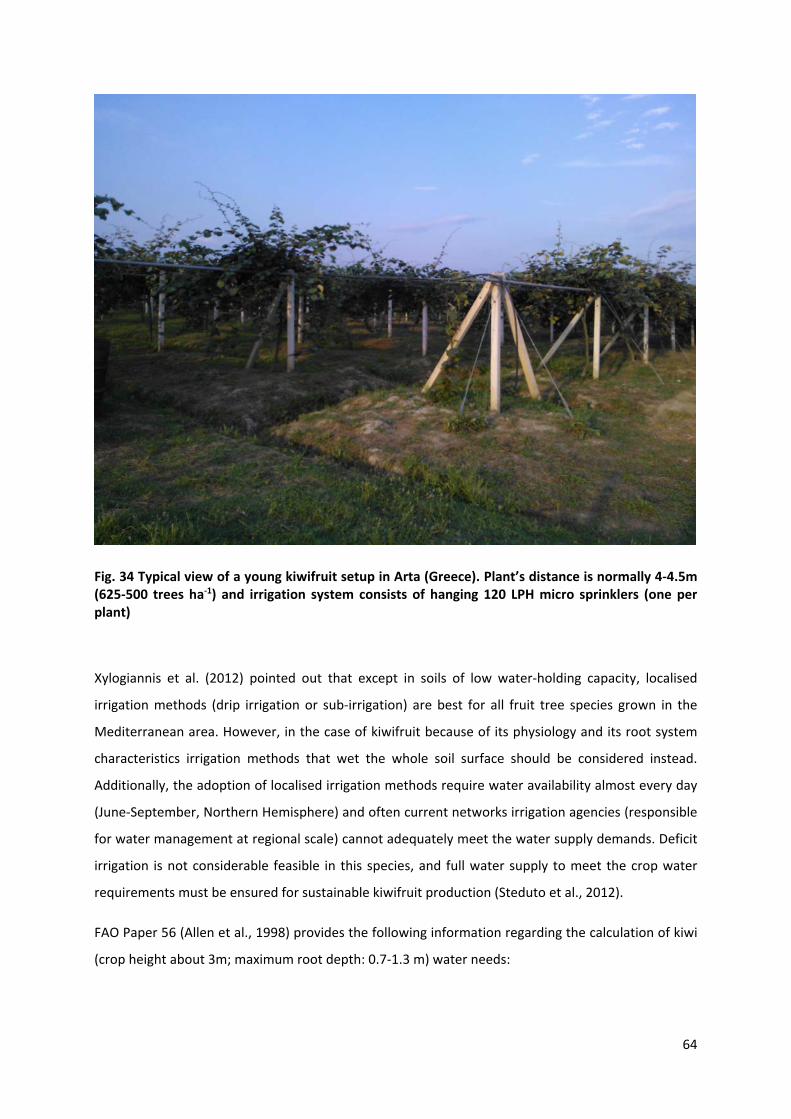
Fig. 34 Typical view of a young kiwifruit setup in Arta (Greece). Plant’s distance is normally 4-4.5m (625-500 trees ha-1) and irrigation system consists of hanging 120 LPH micro sprinklers (one per plant)
Xylogiannis et al. (2012) pointed out that except in soils of low water-holding capacity, localised
irrigation methods (drip irrigation or sub-irrigation) are best for all fruit tree species grown in the
Mediterranean area. However, in the case of kiwifruit because of its physiology and its root system
characteristics irrigation methods that wet the whole soil surface should be considered instead.
Additionally, the adoption of localised irrigation methods require water availability almost every day
(June-September, Northern Hemisphere) and often current networks irrigation agencies (responsible
for water management at regional scale) cannot adequately meet the water supply demands. Deficit
irrigation is not considerable feasible in this species, and full water supply to meet the crop water
requirements must be ensured for sustainable kiwifruit production (Steduto et al., 2012).
FAO Paper 56 (Allen et al., 1998) provides the following information regarding the calculation of kiwi
(crop height about 3m; maximum root depth: 0.7-1.3 m) water needs:
64
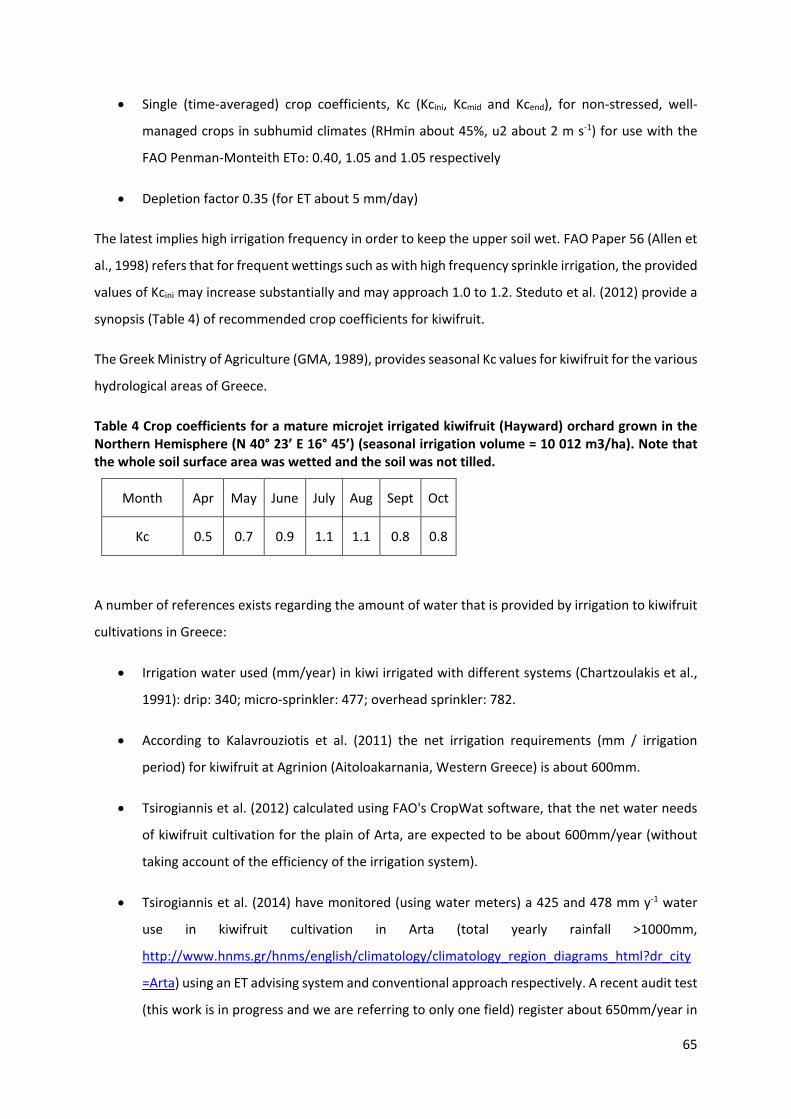
• Single (time-averaged) crop coefficients, Kc (Kcini, Kcmid and Kcend), for non-stressed, well-
managed crops in subhumid climates (RHmin about 45%, u2 about 2 m s-1) for use with the
FAO Penman-Monteith ETo: 0.40, 1.05 and 1.05 respectively
• Depletion factor 0.35 (for ET about 5 mm/day)
The latest implies high irrigation frequency in order to keep the upper soil wet. FAO Paper 56 (Allen et
al., 1998) refers that for frequent wettings such as with high frequency sprinkle irrigation, the provided
values of Kcini may increase substantially and may approach 1.0 to 1.2. Steduto et al. (2012) provide a
synopsis (Table 4) of recommended crop coefficients for kiwifruit.
The Greek Ministry of Agriculture (GMA, 1989), provides seasonal Kc values for kiwifruit for the various
hydrological areas of Greece.
Table 4 Crop coefficients for a mature microjet irrigated kiwifruit (Hayward) orchard grown in the Northern Hemisphere (N 40° 23’ E 16° 45’) (seasonal irrigation volume = 10 012 m3/ha). Note that the whole soil surface area was wetted and the soil was not tilled.
Month Apr May June July Aug Sept Oct
Kc 0.5 0.7 0.9 1.1 1.1 0.8 0.8
A number of references exists regarding the amount of water that is provided by irrigation to kiwifruit
cultivations in Greece:
• Irrigation water used (mm/year) in kiwi irrigated with different systems (Chartzoulakis et al.,
1991): drip: 340; micro-sprinkler: 477; overhead sprinkler: 782.
• According to Kalavrouziotis et al. (2011) the net irrigation requirements (mm / irrigation
period) for kiwifruit at Agrinion (Aitoloakarnania, Western Greece) is about 600mm.
• Tsirogiannis et al. (2012) calculated using FAO's CropWat software, that the net water needs
of kiwifruit cultivation for the plain of Arta, are expected to be about 600mm/year (without
taking account of the efficiency of the irrigation system).
• Tsirogiannis et al. (2014) have monitored (using water meters) a 425 and 478 mm y-1 water
use in kiwifruit cultivation in Arta (total yearly rainfall >1000mm,
http://www.hnms.gr/hnms/english/climatology/climatology_region_diagrams_html?dr_city
=Arta) using an ET advising system and conventional approach respectively. A recent audit test
(this work is in progress and we are referring to only one field) register about 650mm/year in
65
a kiwifruit cultivation in Arta. Have in mind that the fuel cost is considerable in Greece and it
is a restricting factor regarding irrigation duration.
• According to ProBioSis (2008) in organic cultivation of kiwifruit, about 400-500mm are used in
rainy areas while this number can be shifted up to 1,000 mm for semi-arid areas.
In Italy, Villani et al. (2011) registered between 1996-2008 yearly irrigation ranged from 250 to 450
mm in the Faenza area (Emilia-Romagna). Steduto et al. (2012) refer a study of Montanaro et al. (in
preparation) in which irrigation of a Hayward kiwifruit orchard (southern Italy 40°08’ N; 16°38’ E, soil
was not tilled, vines were irrigated by microjet wetting the whole soil surface) has been scheduled
when soil water content was below the lower threshold of the readily available water (RAW). The
seasonal irrigation volume was 10,012 m3 ha-1 (ETo from April to September: 993.7 mm).
Notes
66
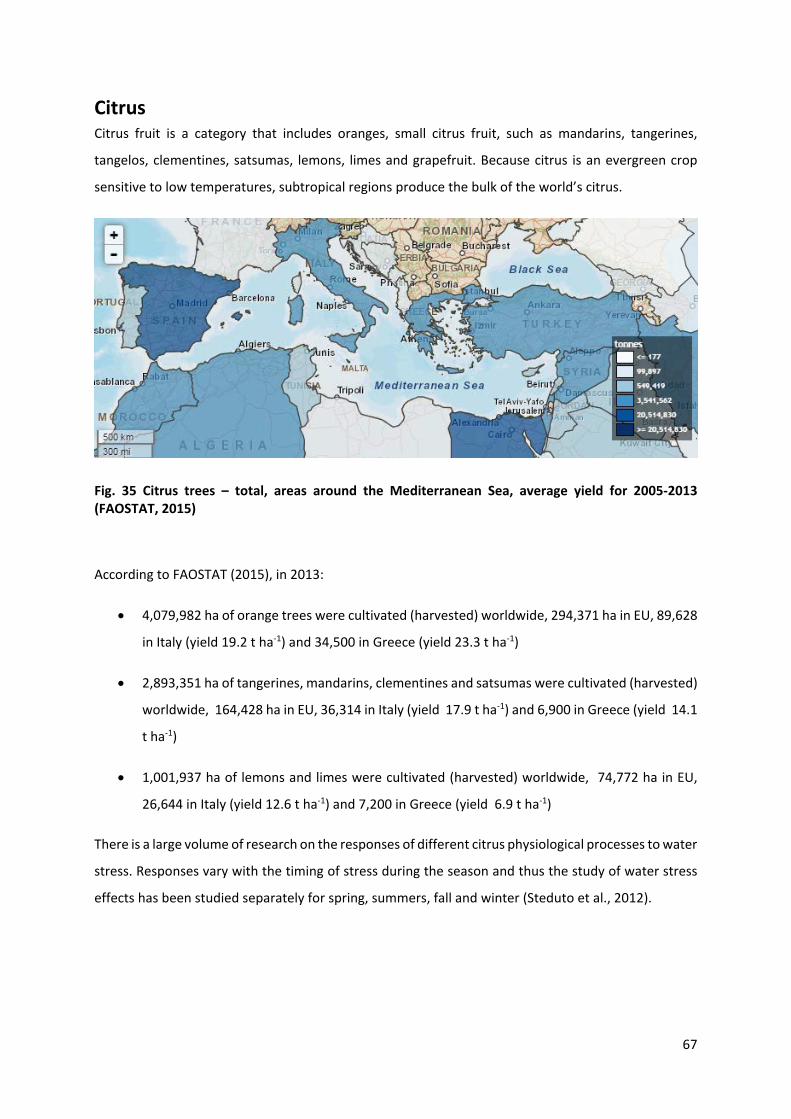
Citrus Citrus fruit is a category that includes oranges, small citrus fruit, such as mandarins, tangerines,
tangelos, clementines, satsumas, lemons, limes and grapefruit. Because citrus is an evergreen crop
sensitive to low temperatures, subtropical regions produce the bulk of the world’s citrus.
Fig. 35 Citrus trees – total, areas around the Mediterranean Sea, average yield for 2005-2013 (FAOSTAT, 2015)
According to FAOSTAT (2015), in 2013:
• 4,079,982 ha of orange trees were cultivated (harvested) worldwide, 294,371 ha in EU, 89,628
in Italy (yield 19.2 t ha-1) and 34,500 in Greece (yield 23.3 t ha-1)
• 2,893,351 ha of tangerines, mandarins, clementines and satsumas were cultivated (harvested)
worldwide, 164,428 ha in EU, 36,314 in Italy (yield 17.9 t ha-1) and 6,900 in Greece (yield 14.1
t ha-1)
• 1,001,937 ha of lemons and limes were cultivated (harvested) worldwide, 74,772 ha in EU,
26,644 in Italy (yield 12.6 t ha-1) and 7,200 in Greece (yield 6.9 t ha-1)
There is a large volume of research on the responses of different citrus physiological processes to water
stress. Responses vary with the timing of stress during the season and thus the study of water stress
effects has been studied separately for spring, summers, fall and winter (Steduto et al., 2012).
67
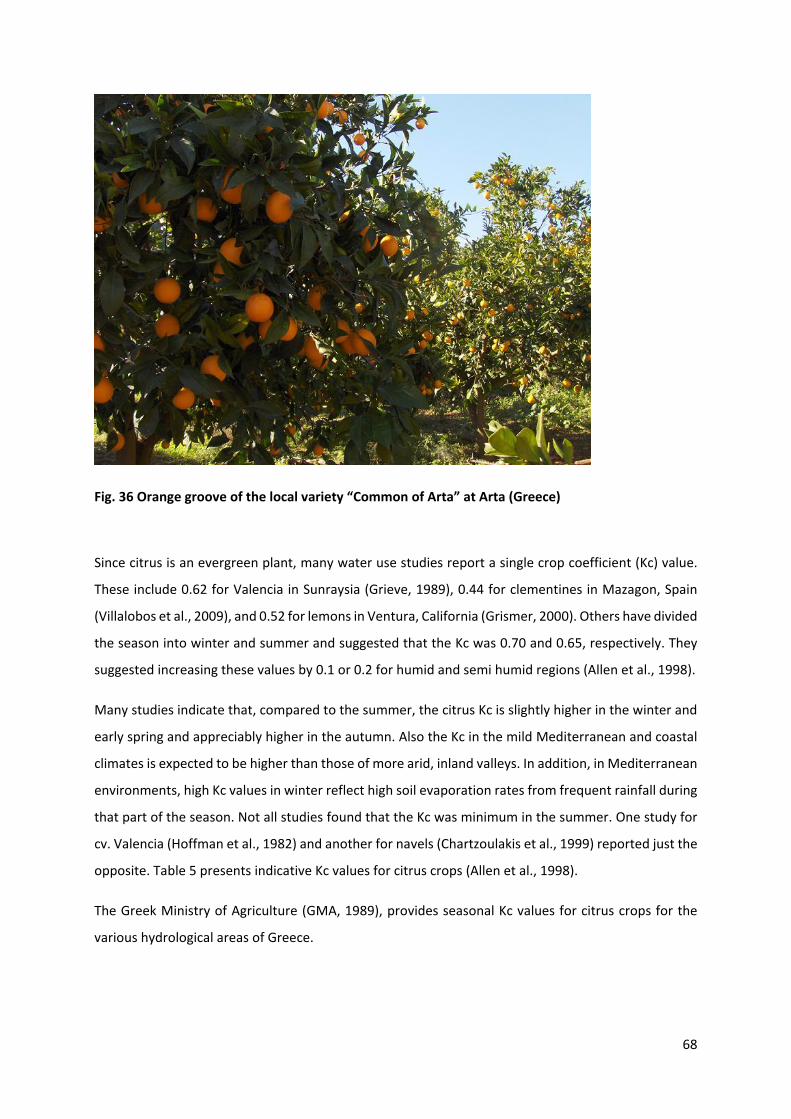
Fig. 36 Orange groove of the local variety “Common of Arta” at Arta (Greece)
Since citrus is an evergreen plant, many water use studies report a single crop coefficient (Kc) value.
These include 0.62 for Valencia in Sunraysia (Grieve, 1989), 0.44 for clementines in Mazagon, Spain
(Villalobos et al., 2009), and 0.52 for lemons in Ventura, California (Grismer, 2000). Others have divided
the season into winter and summer and suggested that the Kc was 0.70 and 0.65, respectively. They
suggested increasing these values by 0.1 or 0.2 for humid and semi humid regions (Allen et al., 1998).
Many studies indicate that, compared to the summer, the citrus Kc is slightly higher in the winter and
early spring and appreciably higher in the autumn. Also the Kc in the mild Mediterranean and coastal
climates is expected to be higher than those of more arid, inland valleys. In addition, in Mediterranean
environments, high Kc values in winter reflect high soil evaporation rates from frequent rainfall during
that part of the season. Not all studies found that the Kc was minimum in the summer. One study for
cv. Valencia (Hoffman et al., 1982) and another for navels (Chartzoulakis et al., 1999) reported just the
opposite. Table 5 presents indicative Kc values for citrus crops (Allen et al., 1998).
The Greek Ministry of Agriculture (GMA, 1989), provides seasonal Kc values for citrus crops for the
various hydrological areas of Greece.
68
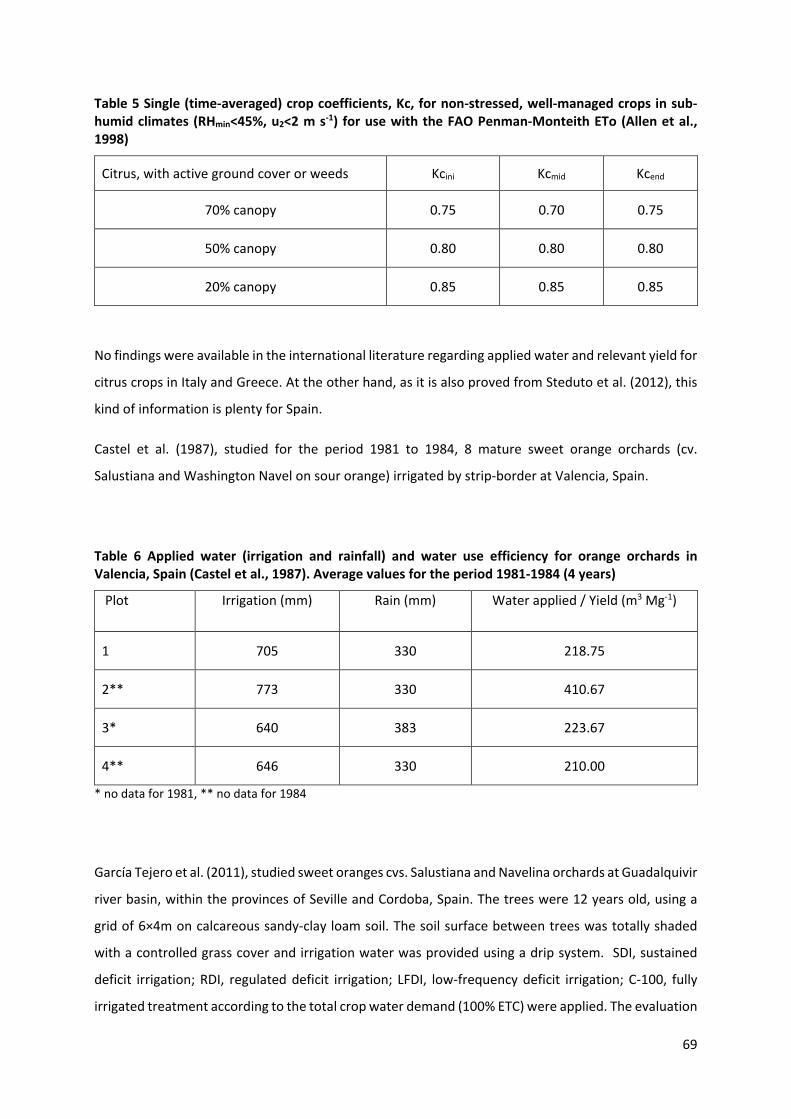
Table 5 Single (time-averaged) crop coefficients, Kc, for non-stressed, well-managed crops in sub-humid climates (RHmin<45%, u2<2 m s-1) for use with the FAO Penman-Monteith ETo (Allen et al., 1998)
Citrus, with active ground cover or weeds Kcini Kcmid Kcend
70% canopy 0.75 0.70 0.75
50% canopy 0.80 0.80 0.80
20% canopy 0.85 0.85 0.85
No findings were available in the international literature regarding applied water and relevant yield for
citrus crops in Italy and Greece. At the other hand, as it is also proved from Steduto et al. (2012), this
kind of information is plenty for Spain.
Castel et al. (1987), studied for the period 1981 to 1984, 8 mature sweet orange orchards (cv.
Salustiana and Washington Navel on sour orange) irrigated by strip-border at Valencia, Spain.
Table 6 Applied water (irrigation and rainfall) and water use efficiency for orange orchards in Valencia, Spain (Castel et al., 1987). Average values for the period 1981-1984 (4 years)
Plot Irrigation (mm) Rain (mm) Water applied / Yield (m3 Mg-1)
1 705 330 218.75
2** 773 330 410.67
3* 640 383 223.67
4** 646 330 210.00
* no data for 1981, ** no data for 1984
García Tejero et al. (2011), studied sweet oranges cvs. Salustiana and Navelina orchards at Guadalquivir
river basin, within the provinces of Seville and Cordoba, Spain. The trees were 12 years old, using a
grid of 6×4m on calcareous sandy-clay loam soil. The soil surface between trees was totally shaded
with a controlled grass cover and irrigation water was provided using a drip system. SDI, sustained
deficit irrigation; RDI, regulated deficit irrigation; LFDI, low-frequency deficit irrigation; C-100, fully
irrigated treatment according to the total crop water demand (100% ETC) were applied. The evaluation
69
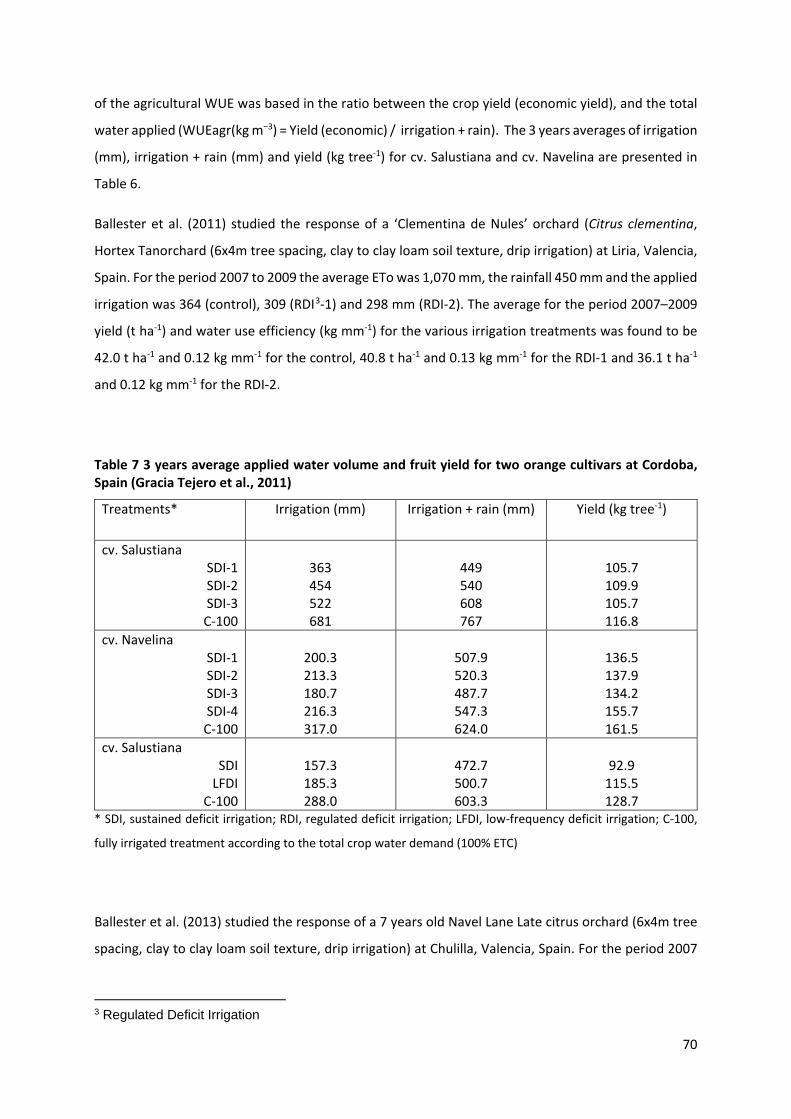
of the agricultural WUE was based in the ratio between the crop yield (economic yield), and the total
water applied (WUEagr(kg m−3) = Yield (economic) / irrigation + rain). The 3 years averages of irrigation
(mm), irrigation + rain (mm) and yield (kg tree-1) for cv. Salustiana and cv. Navelina are presented in
Table 6.
Ballester et al. (2011) studied the response of a ‘Clementina de Nules’ orchard (Citrus clementina,
Hortex Tanorchard (6x4m tree spacing, clay to clay loam soil texture, drip irrigation) at Liria, Valencia,
Spain. For the period 2007 to 2009 the average ETo was 1,070 mm, the rainfall 450 mm and the applied
irrigation was 364 (control), 309 (RDI3-1) and 298 mm (RDI-2). The average for the period 2007–2009
yield (t ha-1) and water use efficiency (kg mm-1) for the various irrigation treatments was found to be
42.0 t ha-1 and 0.12 kg mm-1 for the control, 40.8 t ha-1 and 0.13 kg mm-1 for the RDI-1 and 36.1 t ha-1
and 0.12 kg mm-1 for the RDI-2.
Table 7 3 years average applied water volume and fruit yield for two orange cultivars at Cordoba, Spain (Gracia Tejero et al., 2011)
Treatments* Irrigation (mm) Irrigation + rain (mm) Yield (kg tree-1)
cv. Salustiana SDI-1 SDI-2 SDI-3 C-100
363 454 522 681
449 540 608 767
105.7 109.9 105.7 116.8
cv. Navelina SDI-1 SDI-2 SDI-3 SDI-4 C-100
200.3 213.3 180.7 216.3 317.0
507.9 520.3 487.7 547.3 624.0
136.5 137.9 134.2 155.7 161.5
cv. Salustiana SDI
LFDI C-100
157.3 185.3 288.0
472.7 500.7 603.3
92.9
115.5 128.7
* SDI, sustained deficit irrigation; RDI, regulated deficit irrigation; LFDI, low-frequency deficit irrigation; C-100,
fully irrigated treatment according to the total crop water demand (100% ETC)
Ballester et al. (2013) studied the response of a 7 years old Navel Lane Late citrus orchard (6x4m tree
spacing, clay to clay loam soil texture, drip irrigation) at Chulilla, Valencia, Spain. For the period 2007
3 Regulated Deficit Irrigation
70
to 2010 the average ETo was 1,221 mm, the rainfall 506 mm and the applied irrigation was 407
(control), 332 (RDI4-1) and 316 mm (RDI-2). The average for the period 2007–2010 yield (t ha-1) and
water use efficiency (kg m-3) for the various irrigation treatments was found to be 40.0 t ha-1 and 4.4
kg m-3 for the control, 36.1 t ha-1 and 4.4 kg m-3 for the RDI-1 and 33.9 t ha-1 and 4.2 kg m-3 for the RDI-
2. The conclusion was that moderate water restrictions during summer can be applied in commercial
orchards in case of water scarcity, allowing water savings up to 19% without significant reductions in
yield or in the economic return.
Notes
4 Regulated Deficit Irrigation
71

Notes
72
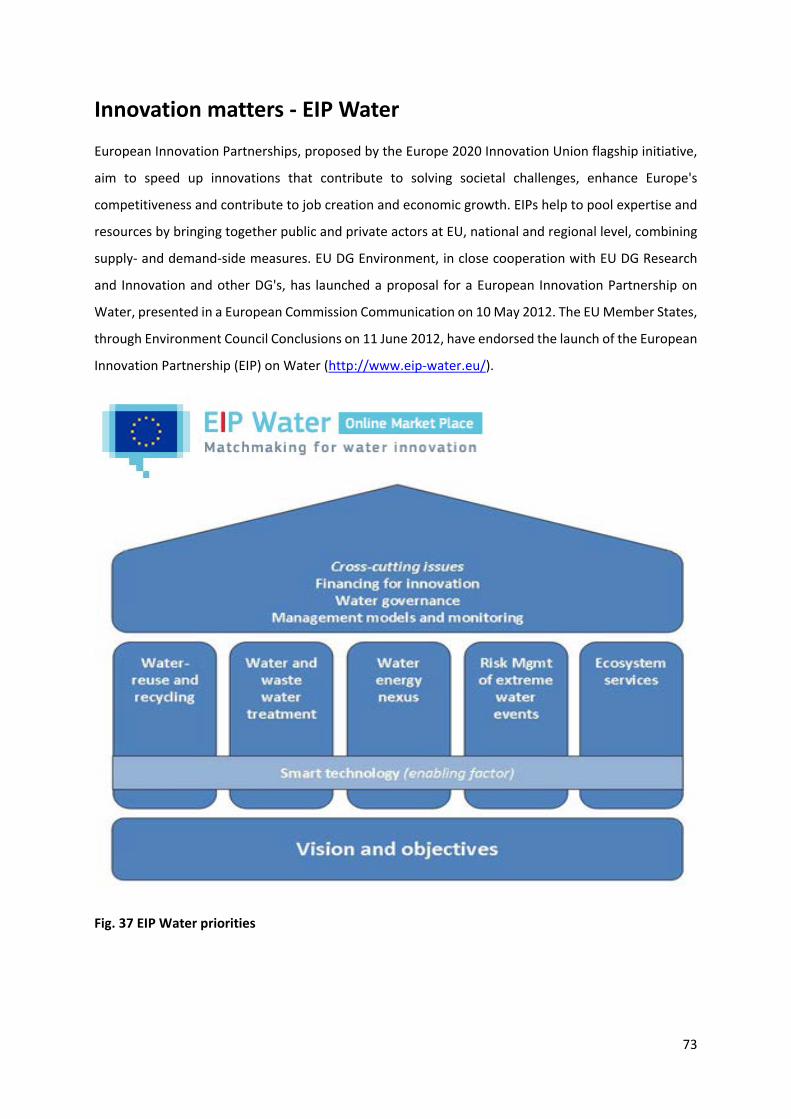
Innovation matters - EIP Water
European Innovation Partnerships, proposed by the Europe 2020 Innovation Union flagship initiative,
aim to speed up innovations that contribute to solving societal challenges, enhance Europe's
competitiveness and contribute to job creation and economic growth. EIPs help to pool expertise and
resources by bringing together public and private actors at EU, national and regional level, combining
supply- and demand-side measures. EU DG Environment, in close cooperation with EU DG Research
and Innovation and other DG's, has launched a proposal for a European Innovation Partnership on
Water, presented in a European Commission Communication on 10 May 2012. The EU Member States,
through Environment Council Conclusions on 11 June 2012, have endorsed the launch of the European
Innovation Partnership (EIP) on Water (http://www.eip-water.eu/).
Fig. 37 EIP Water priorities
73
The aims of the EIP Water are: “to facilitate, support and speed up the development and deployment
of innovative solutions to water challenges” and “to create market opportunities for these innovations
both inside and outside of Europe.”
The vision of the EIP Water is: “To stimulate creative and innovative solutions that contribute
significantly to tackling water challenges at the European and global level, while these solutions are
stimulating sustainable economic growth and job creation”.
In order to reach the aims of the EIP Water, a wide perspective to innovation needs to be taken into
account that embraces new products, processes and ways of working in the public as well as the private
sector. In addition to research and technology, drivers to innovation such as financing, awareness-
raising, ICT, governance, training and others need to be integrated in order to successfully identify and
remove barriers to innovation and to ensure the uptake of innovative solutions. In addition, a global
perspective is required, as many innovative actions are based on cooperation with international
partners, or target international opportunities.
Eight priority areas have been chosen for the EIP Water within its Strategic Implementation Plan (SIP).
They centre on challenges and opportunities in the water sector, and on innovation driven actions that
will deliver the highest impact. Five thematic priorities have been selected:
• Water reuse and recycling
• Water and wastewater treatment, including recovery of resources
• Water-energy nexus
• Flood and drought risk management
• Ecosystem services
In addition, selected cross cutting priorities are:
• Water governance
• Decision support systems and monitoring
• Financing for innovation
Smart technology has been defined as an enabling factor for all priorities.
The common EU market and environmental standards bring an advantage for designing and validating
innovations. Boosting the development of innovative solutions to deal with water challenges and
supporting their deployment and market uptake brings significant economic opportunities in a rapidly
growing world market for water solutions, in which many European companies are active and where
there is strong potential for job creation. Furthermore, the costs of inaction are significant in terms of
74
losing global market business opportunities for the European industry, including Small and Medium
Enterprises (SMEs). Inaction could even lead to an increase in the need to imports of adequate
technologies. Innovations in reducing water intensity of production processes, water recycling and
water reuse in water using industries can bring important opportunities and are prominent in the
public-private innovation agendas.
Although water is predominantly a local issue, water problems are increasingly globalised, requiring
focus at a range of scales, from local responses to global strategies. While there are many opportunities
for innovation based on experiences within the EU, there is a need to look, learn and develop strategic
partnership with countries and regions already experiencing the challenges of Europe’s future.
To fully exploit the opportunities for water related innovations in all related sectors, a European
strategy and support actions are required to complement national and regional activities and secure
synergies among them, while including local perspectives. The opportunities for sustainable economic
growth through facilitating innovation are being recognized and have been placed central in the
Europe 2020 strategy and its Innovation Union flagship initiative, which has proposed European
Innovation Partnerships to deal with grand societal challenges such as water. The EIP Water is not a
mechanism to enforce implementation of legislation. But, in addition to economic growth, the EIP-
Water expects also to create environmental opportunities by serving as an important tool to support
the policy options identified in the Blueprint to safeguard Europe's water resources and the wider
European resource efficiency agenda.
75

Notes
76
Conclusions, proposals and future trends
The objective of water governance is to determine who gets, what water, when and how. As we live in
an era of water security problems which will probably become more intense in the future, water
savings is a main goal of water governance.
Water governance models need to be assessed for each area and adapted to local constraints by:
exploiting local experience and local instruments; combining public and private initiative, capital and
procedures. Performance improvements can be attained via both infrastructure and governance,
having in mind that while infrastructure is fast, visible, disruptive, expensive and risky; governance is
slow, low-profile, endogenous and very cost-effective (Playan et al., 2015).
Improved IE and WP are beneficial to end users but not necessarily to water resources managers
concerned with water savings. To achieve water savings, there is a need to first set the limits of water
allocation to various crops and users and then use measures to increase IE and WP through the
adoption of a solid water accounting framework (Steduto, 2015). In other words the so-called “water
crisis” is essentially a crisis of water governance.
In order to increase IE and WP a number of tools are available: a) introduction of new high WP varieties;
b) extension of the use of more efficient irrigation systems (i.e. drip irrigation); c) improvement of
irrigation management using sensors and DSS; d) application of new irrigation techniques like weeding,
mulching; shading; regulated deficit irrigation etc. 5; e) use of alternative water resources; f)
intensification of training of professionals, education and public awareness.
The economic benefits of modern irrigation tend to make water more valuable to farmers so that they
continue to demand more water. To obtain water saving towards sustainable water resources
management, sequencing of measures is key: control of water consumption must precede on farm
interventions (Steduto, 2015).
5 Greenhouses are not refered at this point –event that they are included in the efficient ways to manage water- as a special publication regarding water efficiency in under cover crops is included in IRMA deliverables (2.4.2.).
77

Notes
78

References
ANBI (National Association Consortia Management and protection of land and irrigation water), 2015.
General information. Retrieved 1/2015 from http://www.anbi.it/
Ballester C., Castel J., Intrigliolo D. S., Castel J.R., 2011. Response of Clementina de Nules citrus trees
to summer deficit irrigation. Yield components and fruit composition. Agricultural Water Management
98: 1027–1032
Ballester C., Castel J., Intrigliolo D. S., Castel J.R., 2013. Response of Navel Lane Late citrus trees to
regulated deficit irrigation: yield components and fruit composition. Irrigation Science 31:333–341
Balzarolo D., Lazzara P., Colonna P., Becciu G., Rana G. 2011. The implementation of the Water
Framework Directive in Italy. In : Junier S. (ed.), El Moujabber M. (ed.), Trisorio-Liuzzi G. (ed.), Tigrek S.
(ed.), Serneguet M. (ed.), Choukr-Allah R. (ed.), Shatanawi M. (ed.), Rodríguez R. (ed.). Dialogues on
Mediterranean water challenges: Rational water use, water price versus value and lessons learned
from the European Water Framework Directive. CIHEAM Bari. Options Méditerranéennes: Série A.
Séminaires Méditerranéens, 98: 155-167. Retrieved 12/2014 from
http://om.ciheam.org/article.php?IDPDF=801477
Bartolini E., Gallerani V., Raggi M., Viaggi D., 2010. Water management and irrigated agriculture in
Italy: multicriteria analysis of alternative policy scenarios. Water Policy Journal. pp. 135-147
Bos M.G. 1983. Discussion on: The V-Shaped Broad-Crested Weir, by W. Boiten and R.H. Pitlo. Proc.
Paper 17162, Journal of Irrigation and Drainage Engineering, ASCE. Vol. 109 (2): 290-293
Bos M.G. 1990. On Irrigation Efficiencies (4th edn. P 141). International Institute for Land Reclamation
and Improvement, Wageningen, The Netherlands
Bos M.G. 1997. Performance indicators for irrigation and drainage. Irrigation and Drainage Systems 11:
119-137
Castel J.R., Bautista I., Ramos C., Cruz G., 1987. Evapotranspiration and irrigation effeciency of mature
orange orchards in Valencia (Spain). Irrigation and Drainage Systems, 3:205-217 (1987) 205
Chartzoulakis K., Michelakis N. and Vougioukalou E., 1991. Growth and production of kiwi under
different irrigation systems. Fruits 46 (1):75-81
Chartzoulakis K., Michelakis N., Stefanoudaki E., 1999. Water use, growth, yieldand fruit quality of
‘Bonanza’ oranges under different soil water. Advances in Horticultural Science 13:6-11
79
Consorzio Brenta, 2015. Report 2010-2014. Retrieved 4/2015 from http://www.consorziobrenta.it/
EC Environment (European Commission – Environment), 2015. The EU Water Framework Directive -
integrated river basin management for Europe. Retrieved 6/2015 from
http://ec.europa.eu/environment/water/water-framework/index_en.html
EEA/EU (European Environmental Agency / European Union), 2014. Irrigation water requirement
(CLIM 033) - Assessment published Jul 2014. Retrieved: 6/2014 from http://www.eea.europa.eu/data-
and-maps/indicators/water-requirement-1/assessment-1
EU (European Commission) / Directorate-General for Agriculture and Rural Development, 2012.
Economic analysis of the olive sector. Retrieved 5/2015 from http://ec.europa.eu/agriculture/olive-
oil/economic-analysis_en.pdf
FAO (UN Food Agriculture Organisation) / Allen, G.R., Pereira, S.L., Dirk, R. and Martin, S. 1998. Crop
evapotranspiration - Guidelines for computing crop water requirements - FAO Irrigation and drainage
#56. Retrieved 9/2013 from http://www.fao.org/docrep/x0490e/x0490e00.htm
FAO (UN Food Agriculture Organisation) / Brouwer C., Prins K., Heibloem M., 1989. FAO - Irrigation
Water Management, Training Manual #4: Irrigation Scheduling. Retrieved 9/2013 from:
http://www.fao.org/docrep/t7202e/t7202e00.HTM
FAO (UN Food Agriculture Organisation) / Doorenbos J., Kassam A. H. , 1979. Yield response to water.
FAO Irrigation and Drainage Paper #33. Rome.
FAO (UN Food Agriculture Organisation) / Steduto P., Hsiao T.C., Fereres E., 2012. Crop Yield Response
to Water. FAO Irrigation and Drainage Paper #66. Retrieved 9/2013 from
http://www.fao.org/nr/water/aquacrop.html
FAO (UN Food Agriculture Organisation) Aquastat, 2015a. Country Fact Sheet: Greece. Retrieved
1/2015 from: http://www.fao.org/nr/water/aquastat/data/cf/readPdf.html?f=GRC-CF_eng.pdf
FAO (UN Food Agriculture Organisation) Aquastat, 2015b. Country Fact Sheet: Italy. Retrieved 1/2015
from: http://www.fao.org/nr/water/aquastat/data/cf/readPdf.html?f=ITA-CF_eng.pdf
FAO AquaCrop. AquaCrop Web Page. Available at: http://www.fao.org/nr/water/aquacrop.html
FAOSTAT (UN Food Agriculture Organisation, Statistics Dep.), 2013. FAOSTAT online database.
Retrieved 7/2015 from http://faostat3.fao.org/download/Q/QC/E
80
Fereres E., Villalobos FJ, Orgaz F., Testi L., 2011. Water requirements and irrigation scheduling in olive.
Acta Horticulturae (ISHS), 888:31-40
García Tejero I., Durán Zuazo V.H., Jiménez Bocanegra J.A., Fernández J.L.M., 2011. Improved water-
use efficiency by deficit-irrigation programmes: Implications for saving water in citrus orchards.
Scientia Horticulturae 128: 274–282
GMA (Greek Ministry of Agriculture), 1989. Determination of minimum and maximum limits of the
necessary quantities for the sustainable use of water for irrigation (GG 428 Β' 2/6/1989, GMA D.
Φ(F).16/6631)
GOEV (General Organisations of Land Reclamation), 2015. Legislative framework. Retrieved 3/2015
from http://www.goevthes.gr/GOEV/organization.html
Goldhamer D., Dunai J., Ferguson L. F., 1994. Irrigation requirements of olive trees and responses to
sustained deficit irrigation. Acta Horticulturae (ISHS) 356: 172-176
Gorantiwar D.S, Smout K.I. 2005. Performance assessment of irrigation water management of
heterogeneous irrigation schemes: 1. A framework for evaluation. Irrigation and Drainage Systems 19:
1-36
Grieve A.M., 1989. Water use efficiency, nutrient uptake and productivity of micro-irrigated citrus.
Australian Journal of Experimental Agriculture, 29(1):111-118
Grismer M.E., 2000. Long-term evapotranspiration from coastal avocado/citrus orchard. Journal of
Irrigation and Drainage Engineering, 126(1):1-7
GSW (General Secretariat of Water), 2015. Regional Water Management Plans in Greece. Retrieved
6/2015 from http://wfd.ypeka.gr/index.php?option=com_content&task=section&id=2&Itemid=12
Gucci R., Lodolini E.M., Rapoport H.F., 2007. Productivity of olive trees with different water status and
crop load. Journal Horticultural Science Biotechnology, 82(4): 648-656
Hamdy A. 2007. Water use efficiency in irrigated agriculture: an analytical review. In: Lamaddalena N.,
Shatanawi M., Todorovic M., Bogliotti C., Albrizio R. (Eds). Water use efficiency and water productivity:
WASAMED project. Bari: CIHEAM, 2007. 9-19 (Options Méditerranéennes: Série B. Etudes et
Recherches, n. 57
81
Hoffman G. J., Oster J. D., Alves, W.J., 1982. Evapotranspiration of mature orange trees under drip
irrigation in an arid climate. Transactions of the ASAE (American Society of Agricultural Engineers),
25(4): 992-996
Howell T.A., 2003. Irrigation Efficiency. USDA Encyclopedia of Water Science. Publ. Marcel Dekker Inc.
Retrieved 8/2013 from: http://www.cprl.ars.usda.gov/pdfs/Howell-Irrig%20Efficiency-
Ency%20Water%20Sci.pdf
IA (Irrigation Association, USA), 2013. Bringing Water to Life - The Energy and Water Efficiency Nexus
(by Zoldoske D. and Sampson R.). Retrieved 12/2013 from:
https://www.youtube.com/watch?v=5b_TIGggivQ
IRMA, 2015. Auditing Toolcase. Accessed 3/2015, http://www.irrigation-management.eu/tools/facts-
guides
Irrigation New Zealand, Sustainable Farming Fund, Page Bloomer Associates Ltd, 2010. Irrigation
Evaluation Code of Practice. Sustainable Farming Fund Project 02-051. Retrieved 11/2014 from:
http://irrigationnz.co.nz/wp-content/uploads/2010-INZ-EvaluationCoP.pdf
Italian Ministry of Environment (Ministero dellí Ambiente e della Tutela del Territorio e del Mare),
2009. Implementation Water Framework Directive. Retrieved 12/2014 from
www.direttivaacque.minambiente.it
Kalavrouziotis Ι.Κ., Arambatzis C., Kalfountzos D., Varnavas S.P., 2011. Wastewater Reuse Planning in
Agriculture: The Case of Aitoloakarnania, Western Greece. Water 3, 988-1004
Karamanos A., Angellides S. and Londra P. 2005. Irrigation systems performance in Greece. In
Lamaddalena N., Lebdi F., Todorovic M., Bogliotti C. (eds.). Irrigation systems performance Bari:
CIHEAM Options Méditerranéennes : Série B. Etudes et Recherches; n. 52. pp. 99-110
Kelley L., 2004. Evaluating Irrigation System Uniformity. Michigan State University Extention, USA.
Retrieved 8/2013 from: http://web1.msue.msu.edu/stjoseph/anr/Irrigation%20LK/
Kitta E., Bartzanas T., Katsoulas N., Kittas C., 2014. Benchmark irrigated under cover agriculture crops.
Agriculture and Agricultural Science Procedia, 4 (IRLA2014. The Effects of Irrigation and Drainage on
Rural and Urban Landscapes, Patras, Greece): 348-355. Retrieved 3/2015 from
http://www.sciencedirect.com/science/article/pii/S2210784315001023
82
Knox J., Melvyn K., Hess T., Daccache A., 2012. Irrigation benchmarking. Comparing performance to
improve water efficiency, value and productivity. Cranfield University. Retrieved 6/2015 from
http://www.ukia.org/pdfs/irrigationbooklet.pdf
Lupia, F., 2013. A model-based irrigation water consumption estimation at farm level. Instituto
Nazionale di Economia Agraria, Rome. pp. 17-24
Massarutto A., 2000. Agriculture, water resources and water policies in Italy. FEEM Working Paper No.
33.99. Retrieved 8/2013 from: http://ssrn.com/abstract=200151 (also available at:
http://dx.doi.org/10.2139/ssrn.200151)
Michelakis, N. 1990. Yield response of table and oil olive varieties to different water use levels under
drip irrigation. Acta Horticulturae (ISHS) 286:271-274
Miller S.A., Smith G.S., Boldingh H.L., Johansson A., 1998. Effects of water stress on fruit quality
attributes of kiwifruit. Annals of Botany 81: 73– 81
Moriana A., Perez-Lopez D., Gomez-Rico A., de los Desamparados Salvador M., Olmedilla N., Ribas F.,
Fregapane G., 2007. Irrigation scheduling for traditional, low-density olive orchards: Water relations
and influence on oil characteristics. Agricultural Water Management, 87: 171-179
NASS (U.S. Department of Agriculture’s National Agricultural Statistics Service), 2014. USA 2013 Farm
and Ranch Irrigation Survey. Retrieved: 1/2014 from
http://www.agcensus.usda.gov/Publications/2012/Online_Resources/Aquaculture/
OECD (Organisation for Economic Co-operation and Development), 2008. Environmental performance
of agriculture in OECD countries since 1990: Greece Country Section. Retrieved 1/2015 from:
http://www.oecd.org/greece/40800494.pdf
OECD (Organisation for Economic Co-operation and Development), 2015. Principles on Water
Governance. Directorate for Public Governance and Territorial Development / Council Meeting on 4
June 2015. Retrieved 9/2014 from: http://www.oecd.org/governance/oecd-principles-on-water-
governance-from-vision-to-action.htm
opIRIS, 2015. The concept of opIRIS FP7 project. Retrieved 6/2015 from http://www.opiris.eu/
Pereira L.S., Cordery I., Iacovides I., 2012, Improved indicators of water use performance and
productivity for sustainable water conservation and saving. Agricultural Water Management 108: 39–
51
83
Playan E., Sagardoy J.A., Castillo R., 2015. Water Governance in irrigated areas:
Models, principles and innovative solutions. Keynote speech in the framework of IRRIMED, Bari - Italy,
23-25 September 2015. Retrieved 9/2015 from:
https://www.youtube.com/watch?v=1_2t_Tt5np4&index=2&list=PLXjaPcQfVApqSJ7SLPGCC6ZQIZ28I
4dvi
ProBioSiS, 2008. Critical points and directions for kiwifruit cultivation according to organic farming
obligations. Pro.Bio.Sis project / INTERREG IIIΑ GR-IT 2000-2006. p. 15
Sanz-Cortés F., Martínez-Calvo J., Badenes M.L., Bleiholder H., Hack H., Llacer G., Meier U., 2002.
Phenological growth stages of olive trees (Olea europaea). Annals Applied Biology 140: 151-157
Seide S.J., Schutze N., Fahle M., Mailhol J.C., Ruelle P., 2015. Optimal irrigation scheduling, irrigation
control and drip line layout to increase water productivity and profit in subsurface drip-irrigated
agriculture. Irrigation and Drainage, 64: 501–518
Steduto P., 2015. Water Efficiency - Water Productivity - Water Saving / Between Confusion and
Effective Solutions. Keynote speech in the framework of IRRIMED, Bari - Italy, 23-25 September 2015.
Retrieved 9/2015 from:
https://www.youtube.com/watch?v=m4B6o0tGa7I&index=3&list=PLXjaPcQfVApqSJ7SLPGCC6ZQIZ28
I4dvi
Tsirogiannis I.L., Filis E., Psomas E., Malamos N., 2012. Estimating irrigation water requirements in Arta
plain and relevant savings in water and money by implementation of IRMA project. Report for the
support of IRMA project concept. TEIEP, Arta, Greece
Tsirogiannis I.L., Fragaki V., Malamos N., Barouchas P., Fillis E., Scamarcio L., Vanino S., Parente A.,
2014. Evaluation Presentation and Development of a Web Based Irrigation Management Tool. IHC2014
(www.ihc2014.org, to be published)
UKIA (UK Irrigation Association), 2015. Irrigation benchmarking tool. Accessed 3/2015,
http://79.170.40.182/iukdirectory.com/benchmarking/
UN Water, 2015. Water day 2015 Campaign. Retrieved 6/2015 from
http://www.unwater.org/worldwaterday
Van Halsema G.E. and L. Vincent. 2012. Efficiency and productivity terms for water management: A
matter of contextual relativism versus general absolutism. Journal of Agricultural Water Management
108: 9-15.
84
Villani G., Tomei F., TomozeiuR., Marletto V., 2011. Climatic scenarios and their impacts on irrigated
agriculture in Emilia-Romagna, Italy. Italian Journal of Agrometeorology (1): 5-16
Xiloyannis C., Montanaro G. and Dichio B., 2012. Irrigation in Mediterranean Fruit Tree Orchards,
Irrigation Systems and Practices in Challenging Environments, Dr. Teang Shui Lee (Ed.), InTech,
available from: http://www.intechopen.com/books/irrigation-systems-and-practices-inchallenging-
environments/irrigation-in-mediterranean-fruit-tree-orchards
Notes
85

Notes
86
Αποτελεσματική άρδευση - Σύνοψη στην ελληνική γλώσσα
Διακυβέρνηση Η αύξηση των πιέσεων στο υδατικό περιβάλλον καθιστά αναγκαία την εφαρμογή βιώσιμων πολιτικών
ανάπτυξης και διαχείρισης των υδατικών πόρων, μέσω σχεδιασμού, υλοποίησης και βέλτιστης
λειτουργίας έργων υποδομής και παρεμβάσεων διαχείρισης τόσο της προσφοράς όσο και της
ζήτησης, πχ. μέσω μέτρων εξοικονόμησης και επαναχρησιμοποίησης του νερού.
Μια ορθολογική πολιτική ανάπτυξης οφείλει επίσης να λαμβάνει υπ’όψη της και τη διαχείριση
ακραίων φαινομένων και κρίσεων όπως τα προβλήματα λειψυδρίας και πλημμυρών αλλά και πιο
μακροπρόθεσμους περιβαλλοντικούς στόχους, όπως η σε βάθος χρόνου προστασία των νερών και
των σχετιζόμενων με αυτά οικοσυστημάτων, η βελτίωση της ποιότητας και της οικολογικής τους
κατάστασης και βέβαια η σταδιακή μείωση απορριπτόμενων ρυπαντικών ουσιών και η προοδευτική
εξάλειψη τοξικών αποβλήτων.
Ο στόχος της διακυβέρνησης των υδάτων είναι να καθοριστεί ποιος θα πάρει το νερό, πότε και υπό
ποιους όρους.
Αποτελεσματικότητα Στην εποχή µας αποτελεί σημαντικό πρόβλημα η αύξηση της ζήτησης και η ταυτόχρονη μείωση της
διαθεσιμότητας, των υδατικών πόρων. Κρίνεται επομένως απαραίτητη η επιστημονική μελέτη και η
ακριβής ποσοτικοποίηση των συνιστωσών του υδατικού ισοζυγίου σε κάθε κλίμακα.
Η αποτελεσματικότητα της άρδευσης (ΙΕ) αποτελεί μέτρο της ποσότητας του νερού που
χρησιμοποιείται ωφέλιμα από τα φυτά. Η αποτελεσματικότητα προκύπτει από μετρήσεις και
εκτιμήσεις των χαρακτηριστικών του αρδευτικού συστήματος καθώς και των πρακτικών διαχείρισης
που ακολουθούνται. Μια απλή έκφραση της αποτελεσματικότητας είναι ο λόγος της ποσότητας του
νερού που χρησιμοποιείται από τα φυτά ως προς την ποσότητα του νερού που εφαρμόζεται.
Σε γεωργικές εφαρμογές για τη σύγκριση της αποτελεσματικότητας αρδευτικών συστημάτων
χρησιμοποιούνται οι δείκτες παραγωγικότητας χρήσης νερού (WP). Ένας τέτοιος δείκτης (Water
Productivity σε kg m-3) εκφράζεται ως η παραγωγή (Y σε kg ή kg m-2 κοκ) ανά μονάδα
εξατμισοδιαπνοής ( ET σε m3 ή mm κοκ).
Άρδευση στην Ελλάδα Η γεωργία είναι ο κύριος άξονας προόδου σε πολλές περιοχές της Ελλάδας και δεν είναι δυνατή χωρίς
σύγχρονα και αποδοτικά εγγειοβελτιωτικά – αρδευτικά έργα και χωρίς ορθολογική διαχείριση των
87
υδατικών πόρων. Η γεωργία αποτελεί σημαντικό παράγοντα για την επιτυχή εφαρμογή της Οδηγίας
Πλαίσιο για τα νερά (2000/60 Ε.Κ) και την επίτευξη του στόχου της καλής οικολογικής κατάστασης
των υδάτων, όπως αυτή έχει εναρμονισθεί με το Ν. 3199/03 «Προστασία και διαχείριση υδάτων –
Εναρμόνιση με την Οδηγίας 2000/60/ΕΚ του Ευρωπαϊκού Κοινοβουλίου και του Συμβουλίου της 23ης
Οκτωβρίου 2000»
Οι αγροτικές καλλιέργειες αποτελούν τον κυριότερο καταναλωτή νερού στην Ελλάδα (ποσοστό
περίπου 80%). Το ποσοστό των αρδευόμενων γεωργικών γαιών φθάνει στο 40% του συνόλου, ενώ
επάνω από το 60% των πεδινών περιοχών αρδεύεται. Οι ανάγκες της άρδευσης καλύπτονται σε
περίπου ίσα ποσοστά (50%) από υδραυλικά έργα και από γεωτρήσεις. Το σημαντικότερο πρόβλημα
είναι η ανισορροπία μεταξύ του ρυθμού ανάπτυξης των αρδευόμενων εκτάσεων (2%/έτος ήτοι
240.000 στρέμματα/έτος) και των έργων αξιοποίησης επιφανειακών υδάτων (κύρια υδραυλικά έργα,
λιγότερο του 1%/έτος, έναντι των αρδευόμενων εκτάσεων) γεγονός που προκαλεί την υπεράντληση
των υπόγειων υδροφορέων με γεωτρήσεις (εκτιμάται ότι ο αριθμός τους έφθανε τις 300.000 το 2010).
Οι υδάτινοι πόροι στην Ελλάδα υπόκεινται σε εκμετάλλευση, η οποία χαρακτηρίζεται από ανεπαρκή
διαχείριση, για κάλυψη κυρίως περιστασιακών αναγκών, με περιορισμένη εφαρμογή σχεδιασμών και
με έλλειψη συντονισμού και συνεργασίας των φορέων που ασχολούνται με τον γενικό ή τον τοπικό
σχεδιασμό των απαιτούμενων έργων.
Οι κύριοι άξονες ορθολογικής διαχείρισης του νερού είναι: α) η γνώση του υδατικού πόρου (ποιοτικά
και ποσοτικά χαρακτηριστικά και δυναμικότητα ανανέωσης), β) τα αναγκαία έργα (χωροχρονικός
σχεδιασμός και ιεράρχηση υλοποίησης) και γ) το πλαίσιο χρήσης του υδατικού πόρου (οδηγίες,
κανονισμοί λειτουργίας, νομοθεσία κοκ)
Την ευθύνη και την αρμοδιότητα για τη διοίκηση, λειτουργία και συντήρηση των συλλογικών
εγγειοβελτιωτικών έργων στην Ελλάδα έχουν οι οργανισμοί εγγείων βελτιώσεων (γενικοί (ΓΟΕΒ) και
τοπικοί (ΤΟΕΒ)). Μέλη των ΤΟΕΒ γίνονται υποχρεωτικά τα φυσικά και νομικά πρόσωπα τα οποία
έχουν εμπράγματα δικαιώματα ή είναι ιδιοκτήτες των ακινήτων τα οποία ωφελούνται από τη
λειτουργία του συλλογικού έργου που λειτουργεί με ευθύνη του ΤΟΕΒ. Οι ΓΟΕΒ συστήνονται από το
κράτος, είναι υπεύθυνοι για τη διαχείριση, λειτουργία και συντήρηση των έργων γενικότερης
σημασίας (Α΄ τάξεως). Ως δευτεροβάθμιοι οργανισμοί παρακολουθούν, συντονίζουν και καθοδηγούν
τους ΤΟΕΒ που βρίσκονται στην περιοχή δικαιοδοσίας τους, εξασφαλίζοντας την κανονική
υδροδότηση και λειτουργία των τοπικών έργων Β΄ τάξεως, τα οποία διοικούνται από τους ΤΟΕΒ.
88
Συμπεράσματα Δεδομένου ότι ζούμε σε μια εποχή όπου τα προβλήματα που σχετίζονται με τη διαθεσιμότητα του
νερού, προβλέπεται να ενταθούν η εξοικονόμηση νερού είναι βασικός στόχος της διαχείρισης των
υδάτων.
Μοντέλα διαχείρισης των υδάτων θα πρέπει να αξιολογούνται για κάθε περιοχή και να
προσαρμόζονται στις τοπικές συνθήκες μέσα από από: την αξιοποίηση των τοπικών εμπειριών και
των τοπικών μέσων, το συνδυασμό δημόσιας και ιδιωτικής πρωτοβουλίας, των κεφαλαίων και των
διαδικασιών. Βελτίωση στην απόδοση μπορεί να επιτευχθεί τόσο μέσω των υποδομών όσο και μέσω
της διακυβέρνησης.
Βελτίωση στην αποτελεσματικότητα άρδευσης (IE) και παραγωγικότητα χρήσης νερού (WP) είναι
σίγουρα επωφελής για τους τελικούς χρήστες, αλλά όχι κατά ανάγκη σε όσους ασχολούνται με την
διαχείριση του νερού. Για να επιτευχθεί εξοικονόμηση νερού, υπάρχει ανάγκη να καθοριστούν πρώτα
τα όρια της κατανομής του νερού στις διάφορες καλλιέργειες και τους χρήστες και στη συνέχεια να
εφαρμοστούν μέτρα για την αύξηση του IE και WP μέσω της υιοθέτησης ενός σταθερού πλαισίου
υπολογισμών όσο αφορά τις παραμέτρους χρήσης του νερού. Με άλλα λόγια, η λεγόμενη «κρίση του
νερού" είναι ουσιαστικά μια κρίση διακυβέρνησης νερού.
Προκειμένου να αυξηθεί η IE και η WP μια σειρά από εργαλεία που είναι ήδη διαθέσιμα πρέπει να
εφαρμοστούν: α) εισαγωγή νέων ποικιλιών υψηλής WP; β) επέκταση της χρήσης των πιο αποδοτικών
συστημάτων άρδευσης (π.χ. στάγδην άρδευση); γ) βελτίωση της διαχείρισης της άρδευσης με τη
χρήση αισθητήρων και DSS; δ) εφαρμογή νέων αρδευτικών τεχνικών, ε) χρήση εναλλακτικών
υδάτινων πόρων; στ) εντατικοποίηση της κατάρτισης των επαγγελματιών, της εκπαίδευσης και της
ευαισθητοποίηση του κοινού.
Τα οικονομικά οφέλη που προκύπτουν από την εφαρμογή σύγχρονων συστημάτων άρδευσης έχουν
την τάση να κάνουν το νερό ακόμη πιο πολύτιμο για τους αγρότες με αποτέλεσμα να απαιτούν
συνεχώς περισσότερο νερό. Για να επιτευχθεί πραγματική εξοικονόμηση νερού στο πλαίσιο της
αειφόρου διαχείρισης των υδάτινων πόρων, το κλειδί είναι η σωστή σειρά εφαρμογής των μέτρων: ο
έλεγχος της κατανάλωσης νερού (διακυβέρνηση) πρέπει να προηγείται των παρεμβάσεων στον αγρό.
89

Notes
90

Back page inside part [intentionally left blank]
91
European Territorial Cooperation
Programmes (ETCP) GREECE-ITALY 2007-
2013
www.greece-italy.eu
Efficient Irrigation Management Tools for
Agricultural Cultivations and Urban
Landscapes (IRMA)
www.irrigation-management.eu
92


![An Efficient Synthesis of [n]Cycloparaphenylenes (n = 9 ...](https://static.fdocument.org/doc/165x107/61db43ea24df4847704089c7/an-efficient-synthesis-of-ncycloparaphenylenes-n-9-.jpg)