Effect of Financial Leverage on Performance of the Firms...
9
SPOUDAI Journal of Economics and Business, Vol.65 (2015), Issue 1-2, pp. 87-95 87 University of Piraeus SPOUDAI Journal of Economics and Business Σπουδαί http://spoudai.unipi.gr Effect of Financial Leverage on Performance of the Firms: Empirical Evidence from Pakistan Zahoor Hussain Javed a , Huma Rao b , Bader Akram c , Muhammad Fayyaz Nazir d a Associate Professor, Bahauddin Zakeriya University, Multan, Pakistan Email: [email protected] b PhD Cand., Bahauddin Zakeriya University, Multan, Pakistan c,d MPhil Cand., Bahauddin Zakeriya University, Multan, Pakistan Abstract This research finds the effect of financial leverage on efficiency of firms in Pakistan. The ordinary least square technique is used to detect efficiency of financial leverage of 154 textile firms in Pakistan over the period 2006-2011. The regression results indicate that leverage has s negative association with the efficiency of firms. Financial leverage is negatively associated with return of assets and equity, which shows that firms borrow less, while market-to-book ratio shows positive profitable association with firms. Consequently firms tend to borrow more and pay their contractual payments in time. JEL: E44, L1, M31, F38 Key words: Leverage, structure of capital, firm performance, theory of pecking order, theory of trade-off 1. Introduction Here we see that either financial leverage affects the performance of firms or not. Notwithstanding, cooperate governance shows ugly picture between ownership and control of firms regarding financial leverage. Therefore, the managers could not achieve main objectives against the owner of firms. To handle this situation, some specific mechanisms are used to earn maximum profit. For enrichment of high market value, firms and investors use different amalgamations of financial tools of debt and equity. Financial management make capital structure decisions to enhance returns of the firms in the area of corporate finance (Raza 2013). The basic responsibility corporate financial managers are to boost up the property of participators, raise of investment and capital cost should be reduced. Thus we reach at this conclusion from the theory of capital structure that cost of outside equity reduces through the
Transcript of Effect of Financial Leverage on Performance of the Firms...
SPOUDAI Journal of Economics and Business, Vol.65 (2015), Issue 1-2, pp. 87-95
87
University
of Piraeus
SPOUDAI
Journal of Economics and Business
Σπουδαί http://spoudai.unipi.gr
Effect of Financial Leverage on Performance of the Firms:
Empirical Evidence from Pakistan
Zahoor Hussain Javed
a, Huma Rao
b, Bader Akram
c ,
Muhammad Fayyaz Nazir
d
aAssociate Professor, Bahauddin Zakeriya University, Multan, Pakistan
Email: [email protected] bPhD Cand., Bahauddin Zakeriya University, Multan, Pakistan
c,dMPhil Cand., Bahauddin Zakeriya University, Multan, Pakistan
Abstract This research finds the effect of financial leverage on efficiency of firms in Pakistan. The ordinary
least square technique is used to detect efficiency of financial leverage of 154 textile firms in Pakistan
over the period 2006-2011. The regression results indicate that leverage has s negative association
with the efficiency of firms. Financial leverage is negatively associated with return of assets and
equity, which shows that firms borrow less, while market-to-book ratio shows positive profitable
association with firms. Consequently firms tend to borrow more and pay their contractual payments in
time.
JEL: E44, L1, M31, F38
Key words: Leverage, structure of capital, firm performance, theory of pecking order, theory of
trade-off
1. Introduction
Here we see that either financial leverage affects the performance of firms or not.
Notwithstanding, cooperate governance shows ugly picture between ownership and control
of firms regarding financial leverage. Therefore, the managers could not achieve main
objectives against the owner of firms. To handle this situation, some specific mechanisms are
used to earn maximum profit.
For enrichment of high market value, firms and investors use different amalgamations of
financial tools of debt and equity. Financial management make capital structure decisions to
enhance returns of the firms in the area of corporate finance (Raza 2013).
The basic responsibility corporate financial managers are to boost up the property of
participators, raise of investment and capital cost should be reduced. Thus we reach at this
conclusion from the theory of capital structure that cost of outside equity reduces through the
Zahoor Hussain Javed et al., SPOUDAI Journal, Vol.65 (2015), Issue 1-2, pp. 87-95
88
high leverage. Managers of firms do right way jobs in favor of the interest of shareholders
(Berger and Patti, 2006).
In corporate finance future growth opportunities and financing policy is a central issue.
There are two types of financial leverage: Market value of equity and booked value of equity.
In perfect capital markets we can easily see impact of capital structure on profit value of a
firm, and then can see presence of taxes and bankruptcy costs. Financial managers and
researchers face the problem of association among a firm's assets configuration and its equity
worth. Consequently we may say that existent finance literature supports the idea that the
benefits of firms are based on choice of capital structure. (Higgins, 1977; Miller, 1977;
Myers & Majluf 1984; Harris & Raviv, 1991) (Lööf, 2003) Modigliani and Miller (1958,
1963).
Organization of the study
The organization the study is described such as. The review of literature is given in section
II. Data description and description of variables and research methodology are argued in
segment III. The empirical analysis is elaborated in segment IV. Section V is based on
empirical conclusion and discussion. Finally section VI provides the conclusion of the study.
2. Literature Review
The study shows efficiency of leverage on capital structure and on earning of firms. The
finance managers receive or gather the funds very hardly. Therefore, the maximum benefit
which is attained by using of these funds is also very difficult. Mostly, some finance
managers get benefit from the use of financial funds, while some cannot get successes in the
use of financial funds (Madan 2007).
The corporate performance provides provision of investment which is based on debt and
equity (Grinblatt, Titman 2003), (Pandey 2008) and (Raza 2011). The short- term and long-
term benefits are attained through the idea of capital structure (Horne, 2002) and (Jensen
1989).
The tax reward of debt and the choice of debt, cost of debt and managerial discretion are
based on capital structures theories (Modigliani and Miller 1963), Ross (1977) and Leland
and Pyle (1977), (Jensen and Meckling 1976) (Myers 1977) (Harris and Raviv 1988), (Harris
and Raviv 1988), (Jensen and Meckling 1976), (Myers 1977) and (Jensen 1986) and (Harris
and Raviv 1991), (Titman and Wessels 1988).
According to idea of Pecking order theory that firms will try to provide liquid assets
without giving proper consideration to the best capital arrangement Myers & Majluf (1984)
(Sunder & Myers, 1999) and (Alinezhad & Taghizadeh, 2012).
The associations between productivity cost of capital and structure of capital amongst the
construction and development of companies of Hong Kong is inspected by Hung et. al
(2002). The outcome advocates that structure of capital is significantly positively associated
with assets and is negatively associated with earning. Madan, K (2007), Ebaid, (2009)
Fosberg (2004) suggests that generally efficiency of the foremost hotels in India is checked
by the role financing decision. The financing decision show that financial leverage works for
only for a few companies.
Zahoor Hussain Javed et al., SPOUDAI Journal, Vol.65 (2015), Issue 1-2, pp. 87-95
89
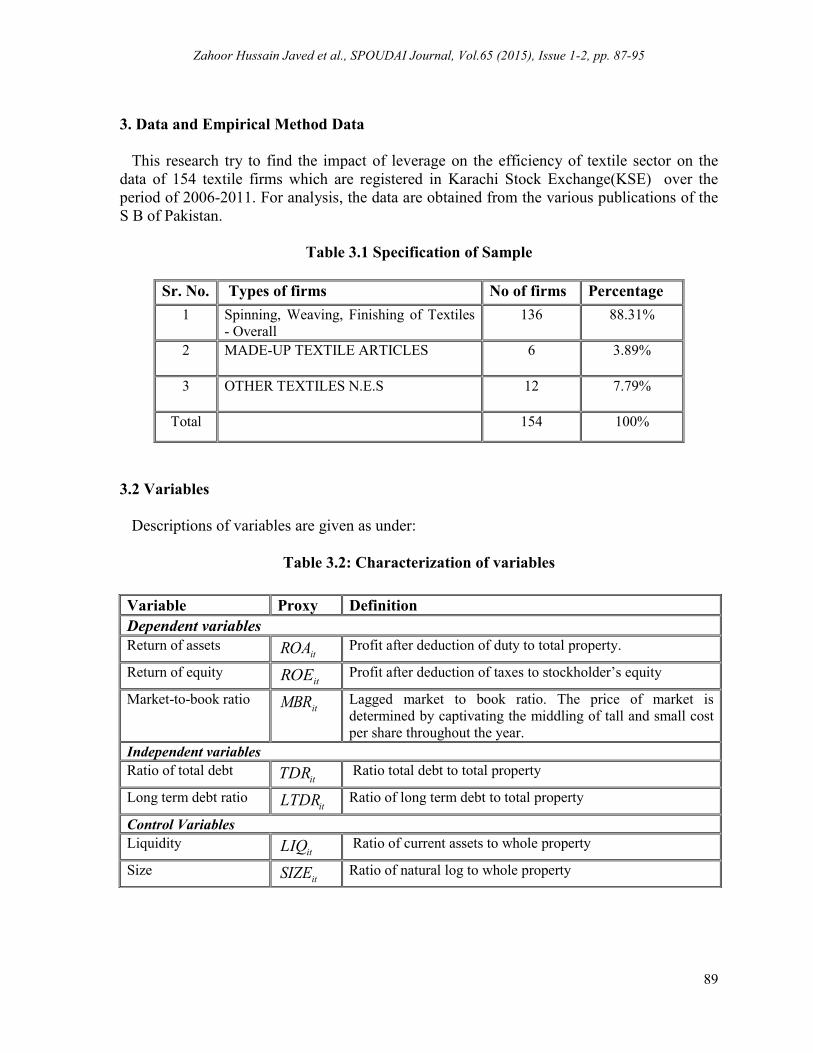
3. Data and Empirical Method Data
This research try to find the impact of leverage on the efficiency of textile sector on the
data of 154 textile firms which are registered in Karachi Stock Exchange(KSE) over the
period of 2006-2011. For analysis, the data are obtained from the various publications of the
S B of Pakistan.
Table 3.1 Specification of Sample
3.2 Variables
Descriptions of variables are given as under:
Table 3.2: Characterization of variables
Sr. No. Types of firms No of firms Percentage
1 Spinning, Weaving, Finishing of Textiles
- Overall
136 88.31%
2 MADE-UP TEXTILE ARTICLES
6 3.89%
3 OTHER TEXTILES N.E.S
12 7.79%
Total 154 100%
Variable Proxy Definition
Dependent variables
Return of assets itROA Profit after deduction of duty to total property.
Return of equity itROE Profit after deduction of taxes to stockholder’s equity
Market-to-book ratio itMBR Lagged market to book ratio. The price of market is
determined by captivating the middling of tall and small cost
per share throughout the year.
Independent variables
Ratio of total debt itTDR Ratio total debt to total property
Long term debt ratio itLTDR Ratio of long term debt to total property
Control Variables
Liquidity itLIQ Ratio of current assets to whole property
Size itSIZE Ratio of natural log to whole property
Zahoor Hussain Javed et al., SPOUDAI Journal, Vol.65 (2015), Issue 1-2, pp. 87-95
90
3.3 Methodology
The panel data methodology is used for estimation. Pool observations are collected
through published and non published materials.
The general form of panel data is given as:
itititit XY
i=1,…………………,154, t=1,…………………, 6
Where the subscript I denote the cross-sectional measurement. t Stand for the time-series.
itY stand for the dependent variable in the model. α is constant term over time t . Individual
firm is i . A predictable coefficient of the vector is β. itX contains a set of descriptive
variables and it is the error term. The error vector given by
ititit uv
whereitv is the individual effect of each of the firm.
itu is the error term.
itititititit LIQSIZETDRROA 321 (1)
itititititit LIQSIZELTDRROA 321 (2)
itititititit LIQSIZETDRROE 321 (3)
itititititit LIQSIZELTDRROE 321 (4)
itititititit LIQSIZETDRMBR 321 (5)
itititititit LIQSIZELTDRMBR 321 (6)
Where itROA is the profit on asset for the thi firm at time t , itROE is the profit on equity
for the thi firm at time t , itMBR is book ratio for the thi markets at time t , the dimension
for the thi firm at time t is itSIZE , itLIQ is the asset tangibility for the thi firm at time t ,
21, &3 are the coefficients. In the above equations,
itROA , itROE and
itMBR are
dependent variables and the itTDR ,
itLTDR , itLIQ and
itSIZE are independent variables.
itROA is the productivity of the thi firm at time t .
4. Results
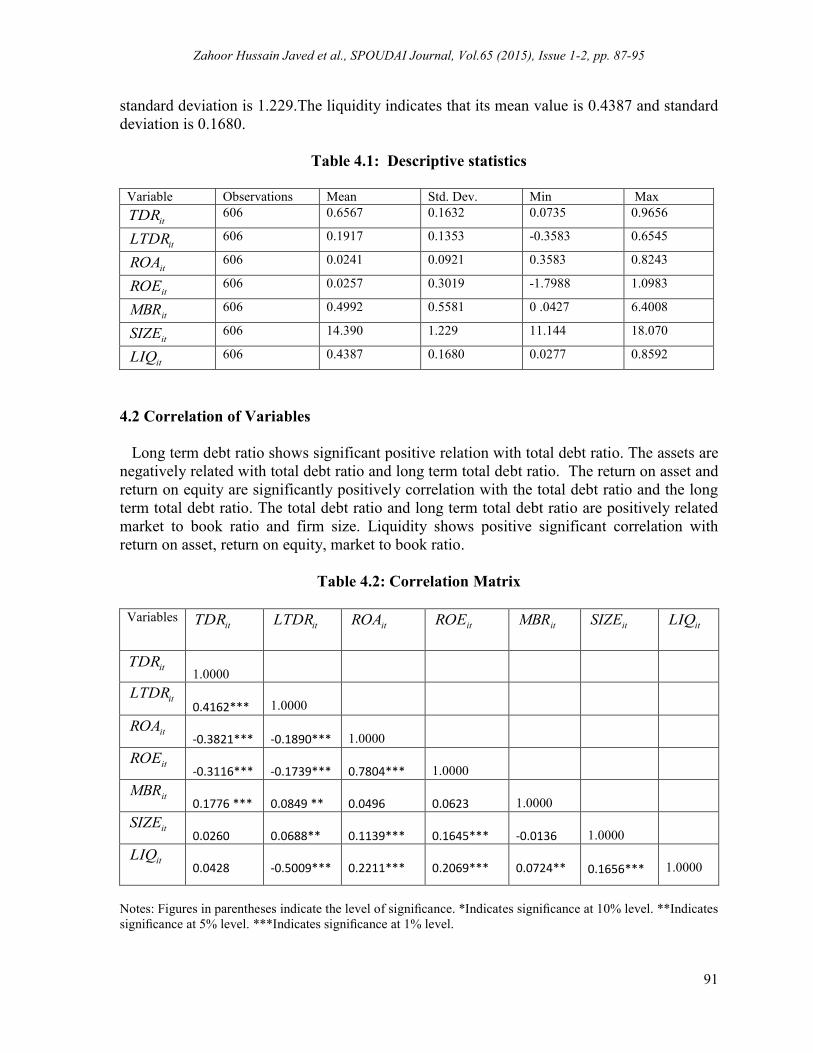
The values of descriptive statistics for all the variables are given in Table 4.1. Standard
deviation is the measure of dispersal that shows the uppermost and the lowly values of the
variables. The Mean value of debt ratio is 0.6567 and 0.1632 is standard deviation. The long
term debt ratio has mean value which is equal 0.1917 and its standard deviation is 0.1353.
The return of assets has mean value which is equal to 0.0241 and its standard deviation is
0.0921. The return on equity has mean value which is equal to 0.0257and its standard
deviation is 0.3019. The market-to-book ratio indicate that its mean value is 0.4992 and
standard deviation is 0.5581. The size of firms show that its mean value is 14.390 and
Zahoor Hussain Javed et al., SPOUDAI Journal, Vol.65 (2015), Issue 1-2, pp. 87-95
91
standard deviation is 1.229.The liquidity indicates that its mean value is 0.4387 and standard
deviation is 0.1680.
Table 4.1: Descriptive statistics
Variable Observations Mean Std. Dev. Min Max
itTDR 606 0.6567 0.1632 0.0735 0.9656
itLTDR 606 0.1917 0.1353 -0.3583 0.6545
itROA 606 0.0241 0.0921 0.3583 0.8243
itROE 606 0.0257 0.3019 -1.7988 1.0983
itMBR 606 0.4992 0.5581 0 .0427 6.4008
itSIZE 606 14.390 1.229 11.144 18.070
itLIQ 606 0.4387 0.1680 0.0277 0.8592
4.2 Correlation of Variables
Long term debt ratio shows significant positive relation with total debt ratio. The assets are
negatively related with total debt ratio and long term total debt ratio. The return on asset and
return on equity are significantly positively correlation with the total debt ratio and the long
term total debt ratio. The total debt ratio and long term total debt ratio are positively related
market to book ratio and firm size. Liquidity shows positive significant correlation with
return on asset, return on equity, market to book ratio.
Table 4.2: Correlation Matrix
Variables
itTDR itLTDR
itROA itROE
itMBR itSIZE
itLIQ
itTDR
1.0000
itLTDR 0.4162***
1.0000
itROA
-0.3821***
-0.1890***
1.0000
itROE
-0.3116***
-0.1739***
0.7804***
1.0000
itMBR
0.1776 ***
0.0849 **
0.0496
0.0623
1.0000
itSIZE
0.0260
0.0688**
0.1139***
0.1645***
-0.0136
1.0000
itLIQ
0.0428
-0.5009***
0.2211***
0.2069***
0.0724** 0.1656***
1.0000
Notes: Figures in parentheses indicate the level of significance. *Indicates significance at 10% level. **Indicates
significance at 5% level. ***Indicates significance at 1% level.
Zahoor Hussain Javed et al., SPOUDAI Journal, Vol.65 (2015), Issue 1-2, pp. 87-95
92
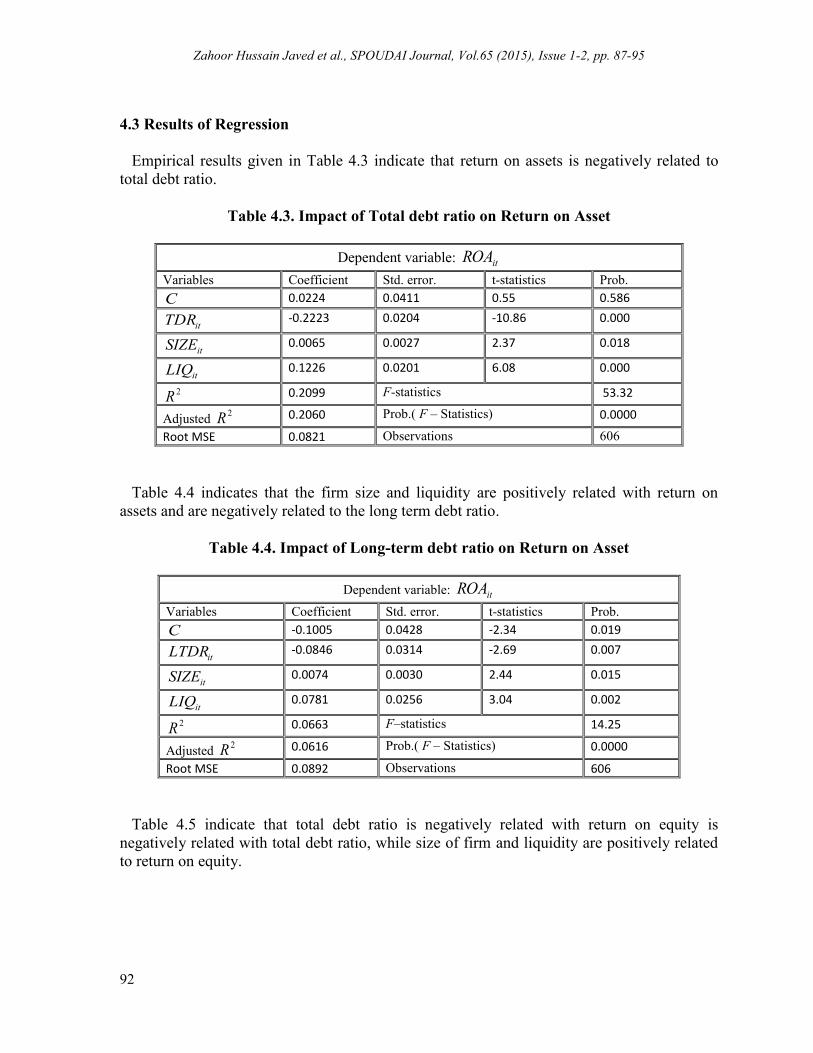
4.3 Results of Regression
Empirical results given in Table 4.3 indicate that return on assets is negatively related to
total debt ratio.
Table 4.3. Impact of Total debt ratio on Return on Asset
Dependent variable: itROA
Variables Coefficient Std. error. t-statistics Prob.
C 0.0224 0.0411 0.55 0.586
itTDR -0.2223 0.0204 -10.86 0.000
itSIZE 0.0065 0.0027 2.37 0.018
itLIQ 0.1226 0.0201 6.08 0.000
2R 0.2099 F-statistics 53.32
Adjusted 2R 0.2060 Prob.( F – Statistics) 0.0000
Root MSE 0.0821 Observations 606
Table 4.4 indicates that the firm size and liquidity are positively related with return on
assets and are negatively related to the long term debt ratio.
Table 4.4. Impact of Long-term debt ratio on Return on Asset
Dependent variable: itROA
Variables Coefficient Std. error. t-statistics Prob.
C -0.1005 0.0428 -2.34 0.019
itLTDR -0.0846 0.0314 -2.69 0.007
itSIZE 0.0074 0.0030 2.44 0.015
itLIQ 0.0781 0.0256 3.04 0.002
2R 0.0663 F–statistics 14.25
Adjusted 2R 0.0616 Prob.( F – Statistics) 0.0000
Root MSE 0.0892 Observations 606
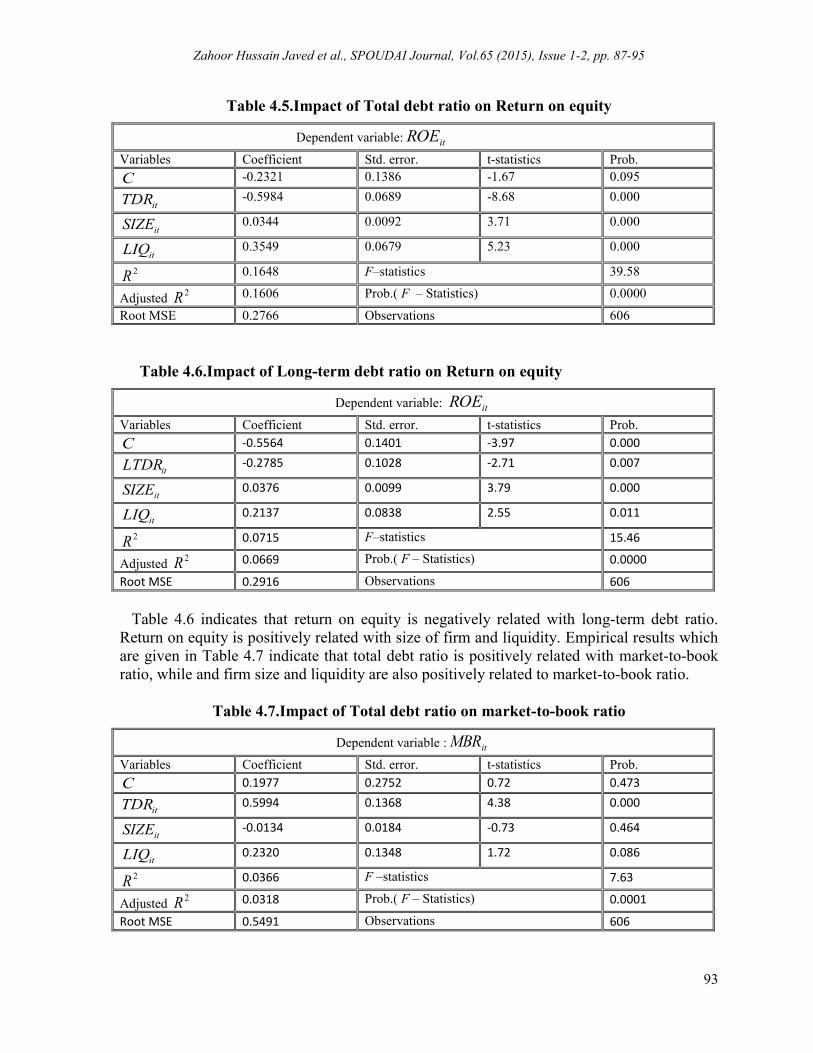
Table 4.5 indicate that total debt ratio is negatively related with return on equity is
negatively related with total debt ratio, while size of firm and liquidity are positively related
to return on equity.
Zahoor Hussain Javed et al., SPOUDAI Journal, Vol.65 (2015), Issue 1-2, pp. 87-95
93
Table 4.5.Impact of Total debt ratio on Return on equity
Dependent variable: itROE
Variables Coefficient Std. error. t-statistics Prob.
C -0.2321 0.1386 -1.67 0.095
itTDR -0.5984 0.0689 -8.68 0.000
itSIZE 0.0344 0.0092 3.71 0.000
itLIQ 0.3549 0.0679 5.23 0.000
2R 0.1648 F–statistics 39.58
Adjusted 2R 0.1606 Prob.( F – Statistics) 0.0000
Root MSE 0.2766 Observations 606
Table 4.6.Impact of Long-term debt ratio on Return on equity
Dependent variable: itROE
Variables Coefficient Std. error. t-statistics Prob.
C -0.5564 0.1401 -3.97 0.000
itLTDR -0.2785 0.1028 -2.71 0.007
itSIZE 0.0376 0.0099 3.79 0.000
itLIQ 0.2137 0.0838 2.55 0.011
2R 0.0715 F–statistics 15.46
Adjusted 2R 0.0669 Prob.( F – Statistics) 0.0000
Root MSE 0.2916 Observations 606
Table 4.6 indicates that return on equity is negatively related with long-term debt ratio.
Return on equity is positively related with size of firm and liquidity. Empirical results which
are given in Table 4.7 indicate that total debt ratio is positively related with market-to-book
ratio, while and firm size and liquidity are also positively related to market-to-book ratio.
Table 4.7.Impact of Total debt ratio on market-to-book ratio
Dependent variable : itMBR
Variables Coefficient Std. error. t-statistics Prob.
C 0.1977 0.2752 0.72 0.473
itTDR 0.5994 0.1368 4.38 0.000
itSIZE -0.0134 0.0184 -0.73 0.464
itLIQ 0.2320 0.1348 1.72 0.086
2R 0.0366 F –statistics 7.63
Adjusted 2R 0.0318 Prob.( F – Statistics) 0.0001
Root MSE 0.5491 Observations 606
Zahoor Hussain Javed et al., SPOUDAI Journal, Vol.65 (2015), Issue 1-2, pp. 87-95
94
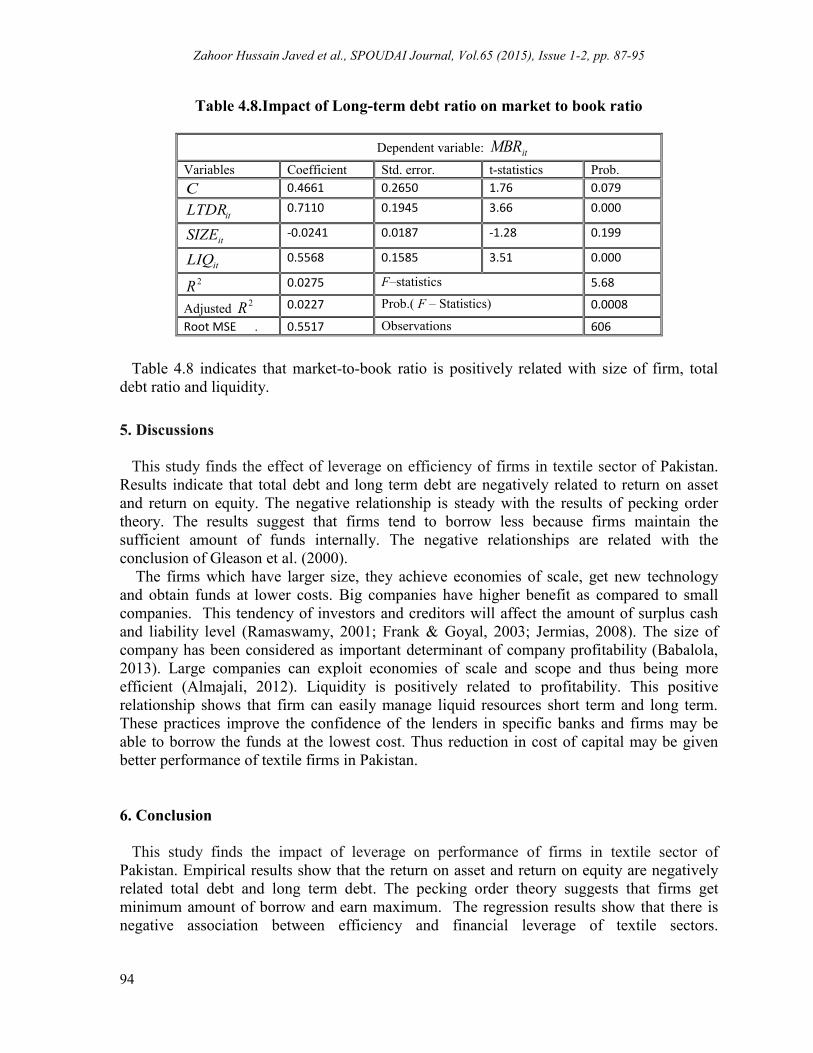
Table 4.8.Impact of Long-term debt ratio on market to book ratio
Dependent variable: itMBR
Variables Coefficient Std. error. t-statistics Prob.
C 0.4661 0.2650 1.76 0.079
itLTDR 0.7110 0.1945 3.66 0.000
itSIZE -0.0241 0.0187 -1.28 0.199
itLIQ 0.5568 0.1585 3.51 0.000
2R 0.0275 F–statistics 5.68
Adjusted 2R 0.0227 Prob.( F – Statistics) 0.0008
Root MSE . 0.5517 Observations 606
Table 4.8 indicates that market-to-book ratio is positively related with size of firm, total
debt ratio and liquidity.
5. Discussions
This study finds the effect of leverage on efficiency of firms in textile sector of Pakistan.
Results indicate that total debt and long term debt are negatively related to return on asset
and return on equity. The negative relationship is steady with the results of pecking order
theory. The results suggest that firms tend to borrow less because firms maintain the
sufficient amount of funds internally. The negative relationships are related with the
conclusion of Gleason et al. (2000).
The firms which have larger size, they achieve economies of scale, get new technology
and obtain funds at lower costs. Big companies have higher benefit as compared to small
companies. This tendency of investors and creditors will affect the amount of surplus cash
and liability level (Ramaswamy, 2001; Frank & Goyal, 2003; Jermias, 2008). The size of
company has been considered as important determinant of company profitability (Babalola,
2013). Large companies can exploit economies of scale and scope and thus being more
efficient (Almajali, 2012). Liquidity is positively related to profitability. This positive
relationship shows that firm can easily manage liquid resources short term and long term.
These practices improve the confidence of the lenders in specific banks and firms may be
able to borrow the funds at the lowest cost. Thus reduction in cost of capital may be given
better performance of textile firms in Pakistan.
6. Conclusion
This study finds the impact of leverage on performance of firms in textile sector of
Pakistan. Empirical results show that the return on asset and return on equity are negatively
related total debt and long term debt. The pecking order theory suggests that firms get
minimum amount of borrow and earn maximum. The regression results show that there is
negative association between efficiency and financial leverage of textile sectors.
Zahoor Hussain Javed et al., SPOUDAI Journal, Vol.65 (2015), Issue 1-2, pp. 87-95
95
Nevertheless, the market-to-book ratio is positively related to long term debt and total debt
ratio.
Big companies earn maximum profit than small companies. Liquidity is positively related
to profitability. Thus reduction in cost of capital may be an important reason for better
performance of textile firms in Pakistan.
References
Ebaid, E (2009) “Impact of capital structure choice on firms performance: empirical evidence
from Egypt” the Journal of Risk Finance, 10:5, 477-487.
Harris, M. and Raviv, A. (1990), “Capital Structure and the Informational Role of Debt”. The
Journal of Finance” Vol. 45, No. 2, pp. 321-349.
Hung, Y. C, Albert, C. C, and Eddie, C. H (2002) “Capital structure and profitability of the
property and construction sectors in Hong Kong”, Journal of Property, Investment
and Finance, 20:6, 1463-578X.
Jermias. J (2008) “The relative influence of competitive intensity and business strategy on the
relationship between financial leverage and performance” The British Accounting
Review. Vol. 40, pp. 71–86.
Leland. H.E and Pyle.D.H (1997) “Informational Asymmetries, Financial Structure and
Financial Intermediation”. The Journal of Finance Vol. XXXII, No 2. pp. 371-387.
Madan, K (2007) “An analysis of Debt-Equity structure of leading hotel chains in India”,
International Journal of Hospitality Management, 19:5, 397414.
Modigliani, F. and Miller, M. (1958) “The cost of capital, corporate finance and the theory
of investment”, American Economic Review, Vol. 48, pp. 261-97.
Modigliani, F. and Miller, M. (1963) “Corporate income taxes and the cost of capital: a
correction”, American Economic Review, Vol. 53, pp. 443-53.
Raza, M. W., & Mohsin, H. M. (2011) Financial liberalization and macroeconomic
performance, empirical evidence from selected Asian countries.
Raza, M.W. (2013) “Affect of financial leverage on firm performance Empirical evidence
from Karachi Stock Exchange”.
Ross, S.A.(1977) “The Determination of Financial Structure: The Incentive Signaling
Approach” The Bell Journal of Economics, Vol. 8, No. 1 , pp. 23-40.
Singh, M. & Faircloth, S. (2005). “The impact of corporate debt on long term investment and
firm performance” Journal of Applied Economics, Vol. 37, pp. 875–883.
Sunday O, A (2012) “The Effect of Financial Leverage on Corporate Performance of Some
Selected Companies in Nigeria.” Journal of Canadian Social Science, Vol. 8, No. 1,
pp.85-91.
Tsai C. (2013) “Volatility clustering, leverage, size, or contagion effects: The fluctuations of
Asian real estate investment trust returns”. Journal of Asian Economics. Vol.27, pp.
18–32.