EE359 Wireless Communications - Arab Academy for...
33
EE359 Wireless Communications Lecture 9 Digital Modulation Performance over AWGN Channels
Transcript of EE359 Wireless Communications - Arab Academy for...
EE359Wireless Communications
Lecture 9
Digital Modulation
Performance over AWGN Channels
Dr. M. Khedr
Stamp
3
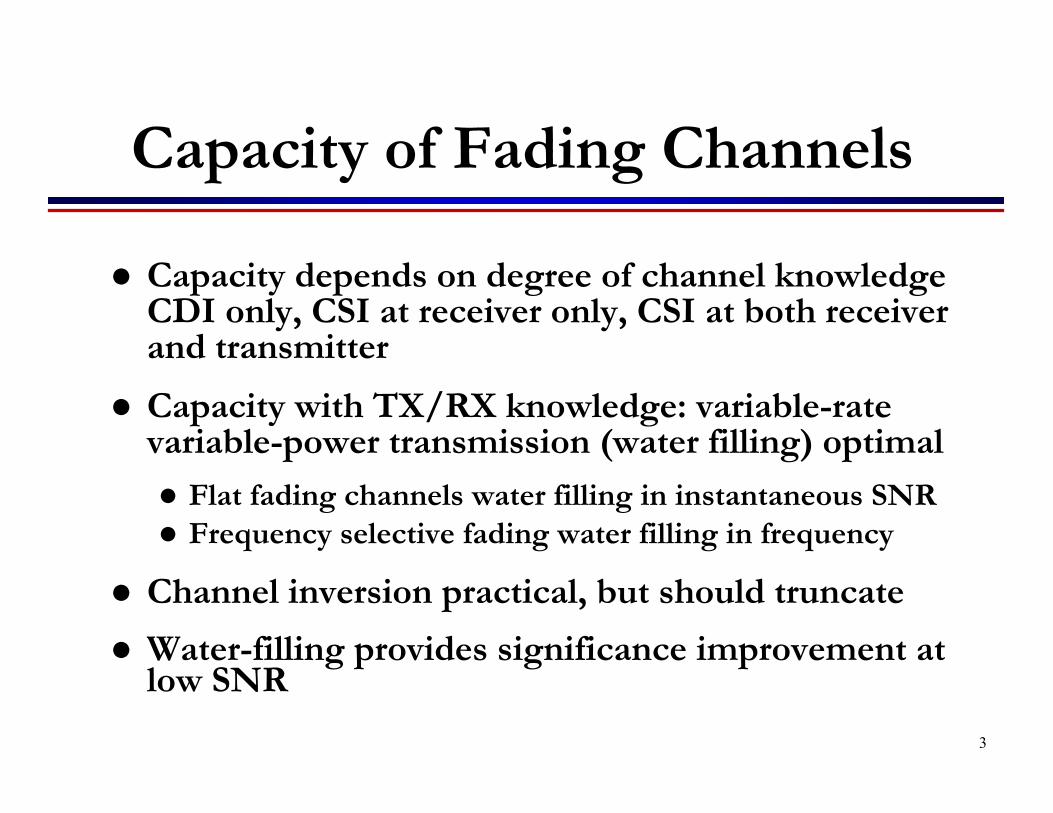
Capacity of Fading Channels
Capacity depends on degree of channel knowledgeCDI only, CSI at receiver only, CSI at both receiverand transmitter
Capacity with TX/RX knowledge: variable-ratevariable-power transmission (water filling) optimal Flat fading channels water filling in instantaneous SNR Frequency selective fading water filling in frequency
Channel inversion practical, but should truncate
Water-filling provides significance improvement atlow SNR
3
4
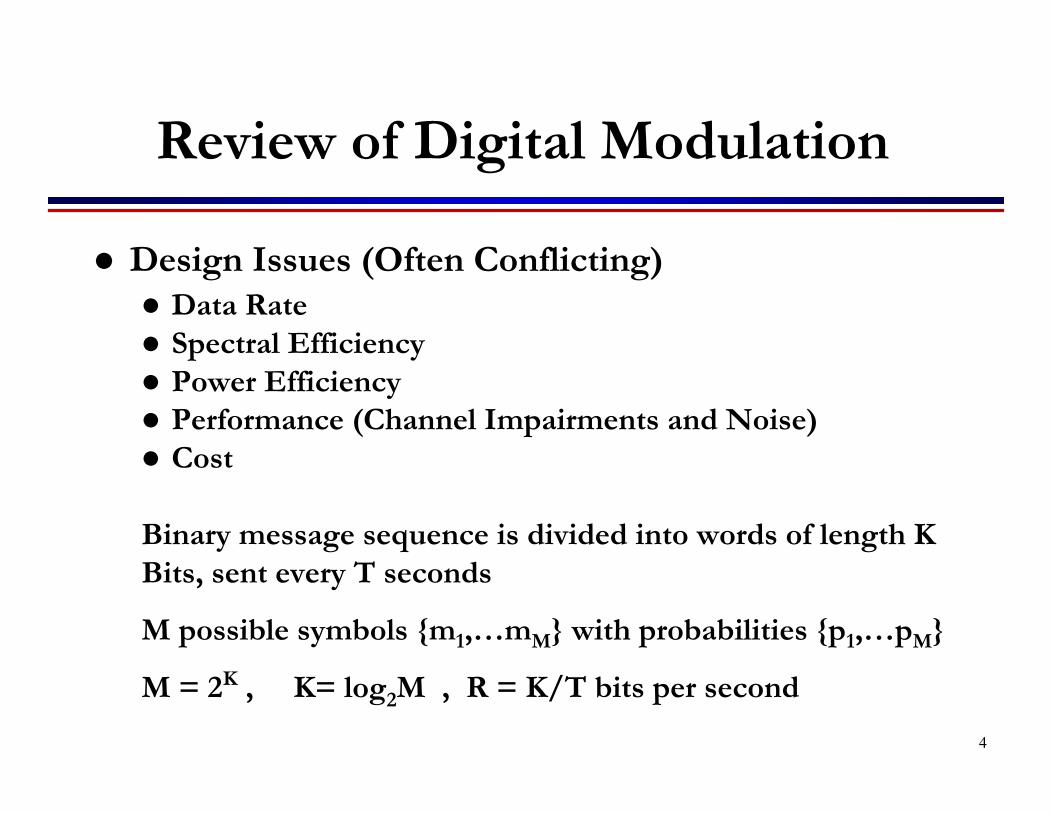
Design Issues (Often Conflicting) Data Rate Spectral Efficiency Power Efficiency Performance (Channel Impairments and Noise) Cost
Binary message sequence is divided into words of length KBits, sent every T seconds
M possible symbols {m1,…mM} with probabilities {p1,…pM}
M = 2K , K= log2M , R = K/T bits per second
Review of Digital Modulation
4
6
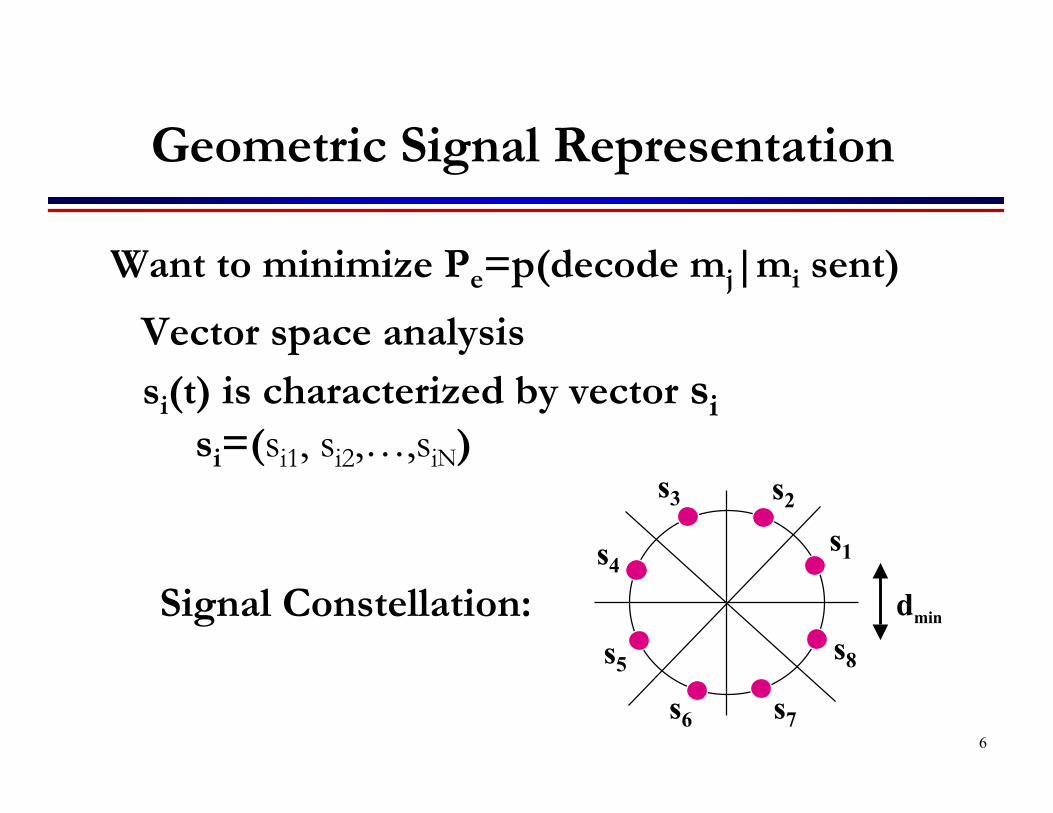
Geometric Signal Representation
Want to minimize Pe=p(decode mj|mi sent)
Signal Constellation: dmin
s1
s2s3
s4
s5
s6 s7
s8
Vector space analysissi(t) is characterized by vector si si=(si1, si2,…,siN)
6
7
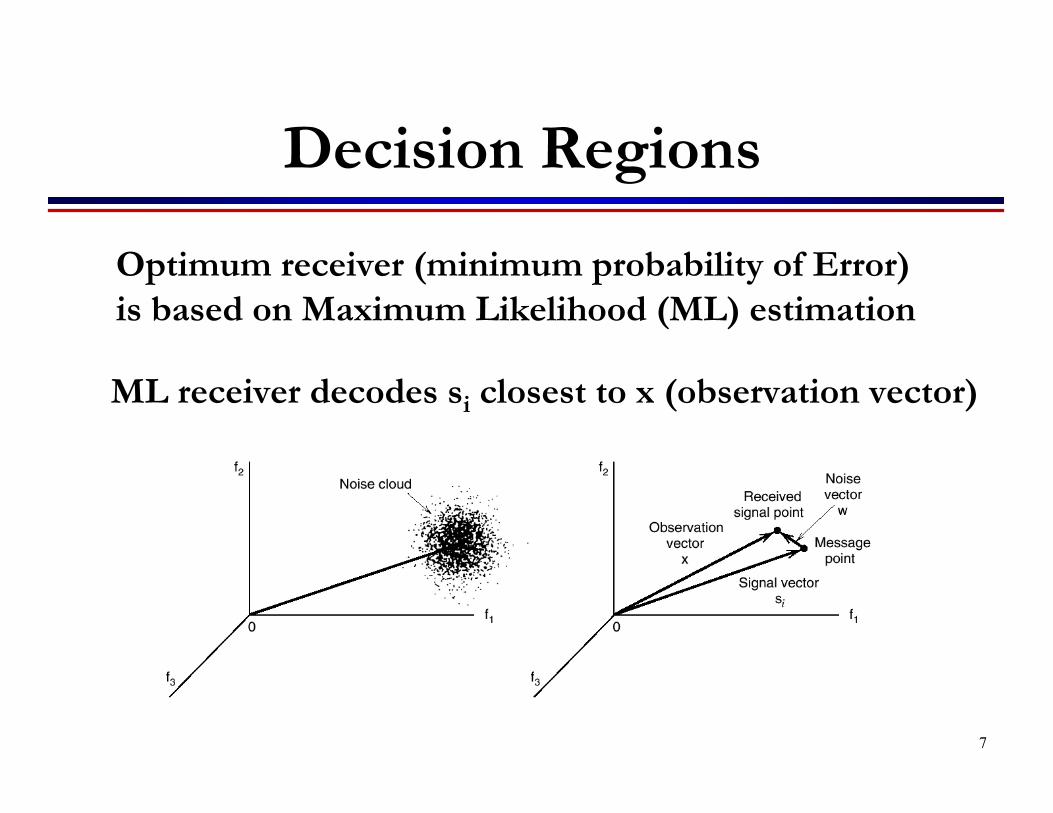
Decision Regions
ML receiver decodes si closest to x (observation vector)
Optimum receiver (minimum probability of Error) is based on Maximum Likelihood (ML) estimation
7
8
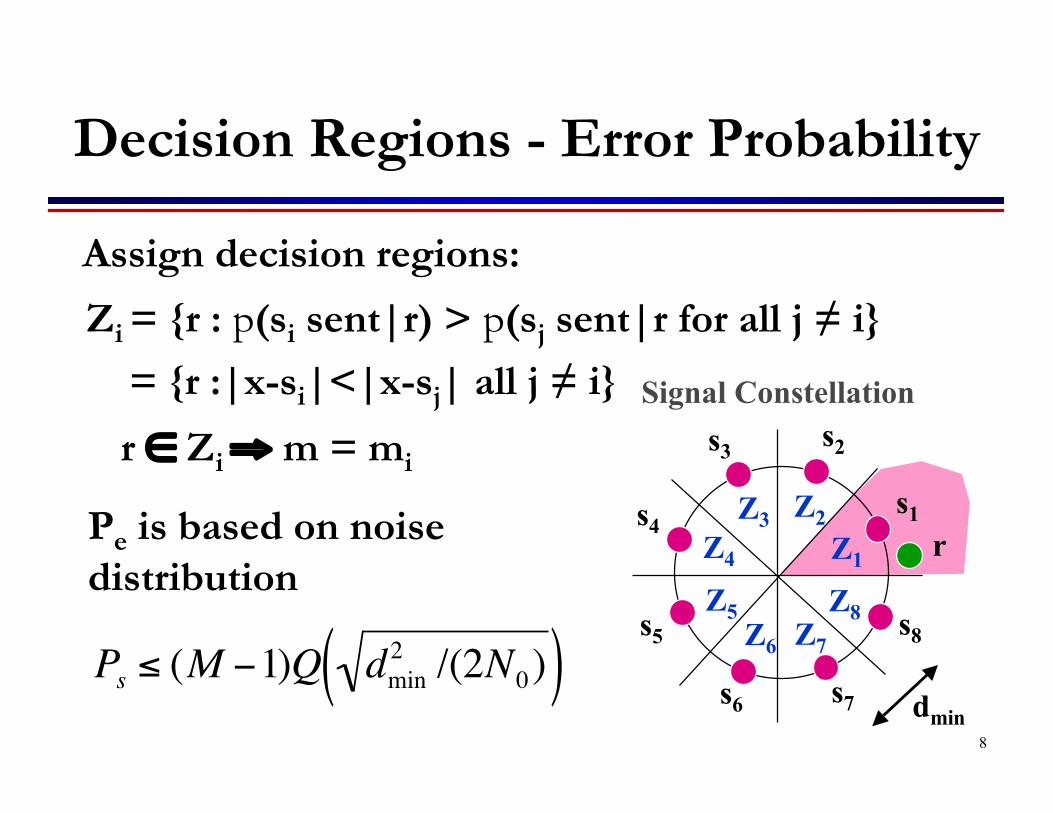
Assign decision regions:
r ∈ Zi ⇒ m = mi
Signal Constellation
Pe is based on noise distribution
r
dmin
s1
s2s3
s4
s5
s6 s7
s8
Z1
Z2Z3Z4
Z5Z6 Z7
Z8
€
Ps ≤ (M −1)Q dmin2 /(2N0)( )
= {r :|x-si|<|x-sj| all j ≠ i}
Zi = {r : p(si sent|r) > p(sj sent|r for all j ≠ i}
Decision Regions - Error Probability
8
9
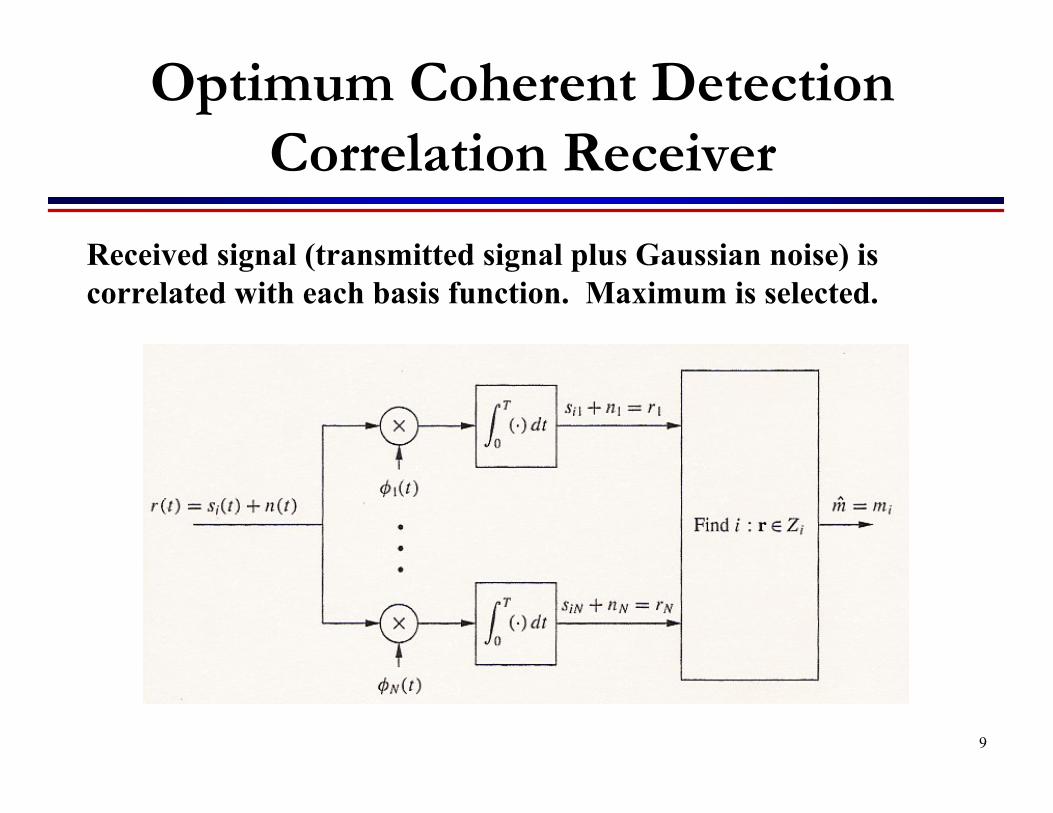
Optimum Coherent DetectionCorrelation Receiver
Received signal (transmitted signal plus Gaussian noise) is correlated with each basis function. Maximum is selected.
9
10
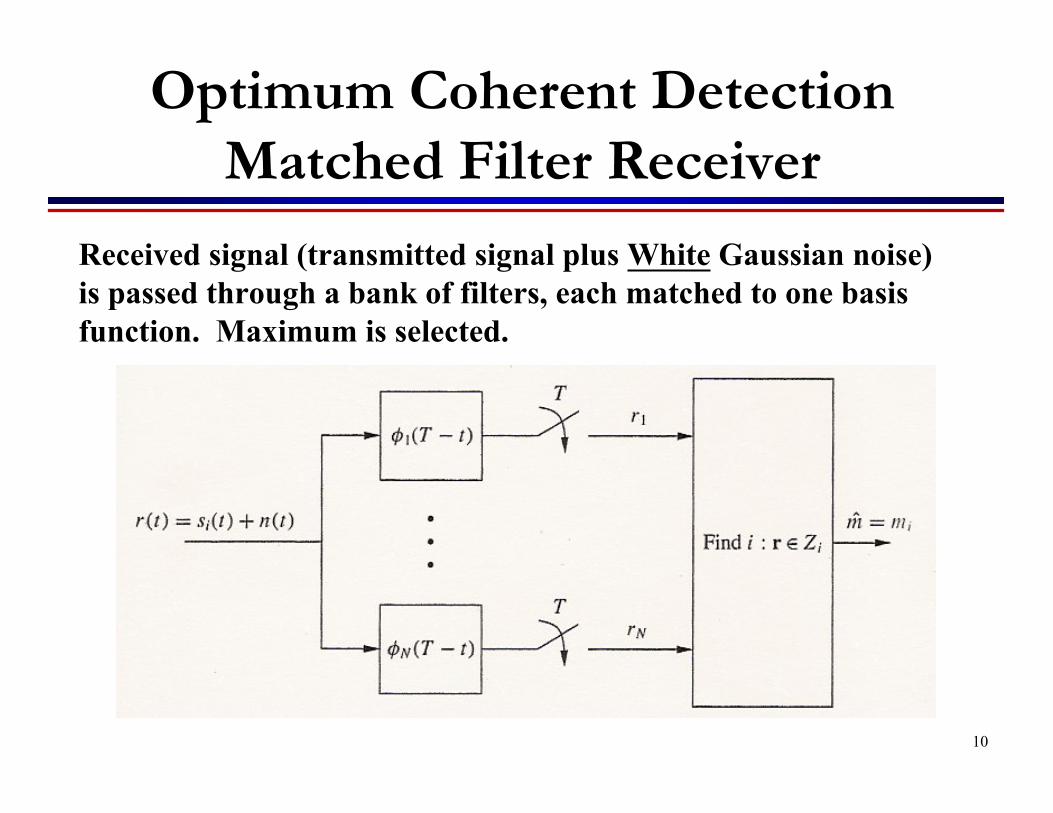
Optimum Coherent DetectionMatched Filter Receiver
Received signal (transmitted signal plus White Gaussian noise) is passed through a bank of filters, each matched to one basis function. Maximum is selected.
10
13
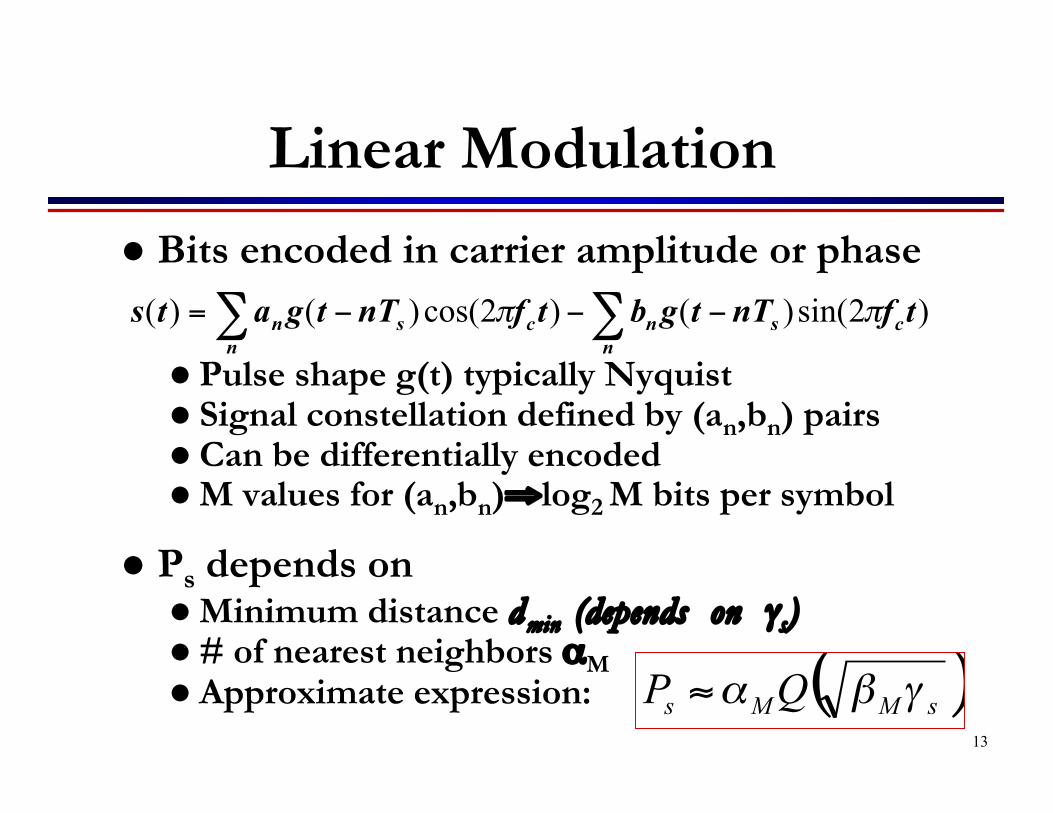
Linear Modulation
Bits encoded in carrier amplitude or phase
Pulse shape g(t) typically Nyquist Signal constellation defined by (an,bn) pairs Can be differentially encoded M values for (an,bn)⇒log2 M bits per symbol
Ps depends on Minimum distance dmin (depends on γs) # of nearest neighbors αM Approximate expression:
)2sin()()2cos()()( tfnTtgbtfnTtgats csn
ncsn
n ππ −−−= ∑∑
( )sMMs QP γβα≈13
15
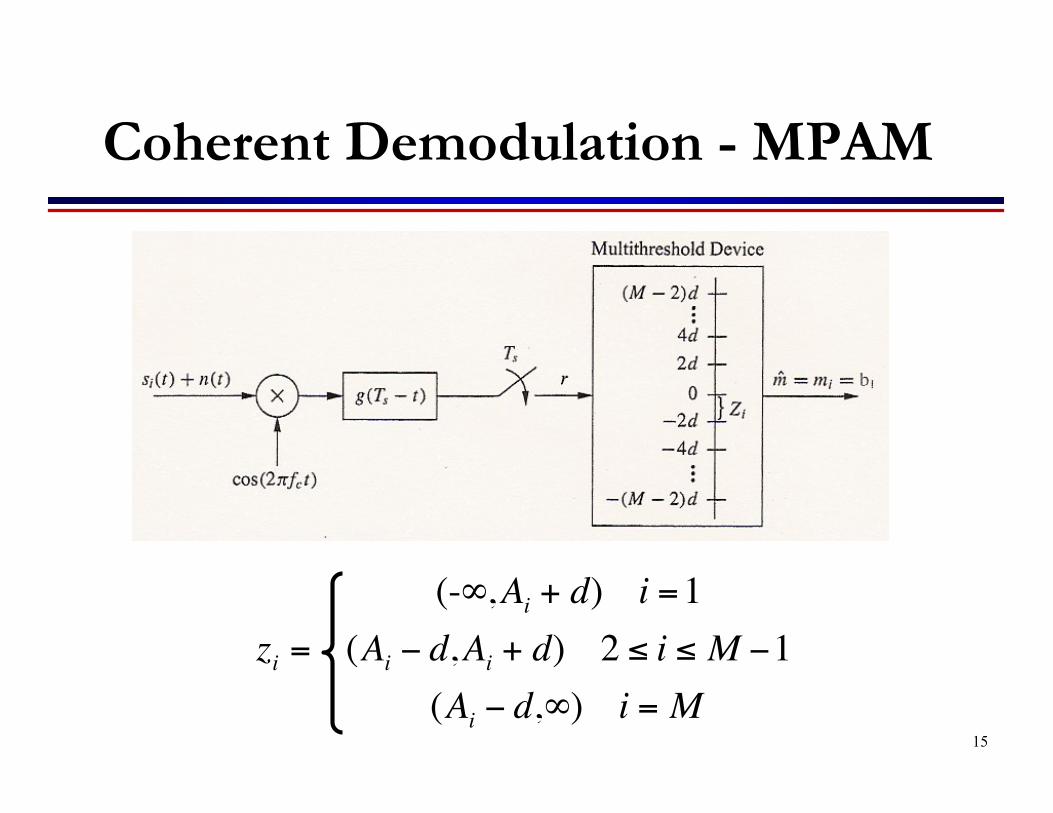
Coherent Demodulation - MPAM
€
zi =
(-∞,Ai + d) i =1(Ai − d,Ai + d) 2 ≤ i ≤ M −1
(Ai − d,∞) i = M15
16
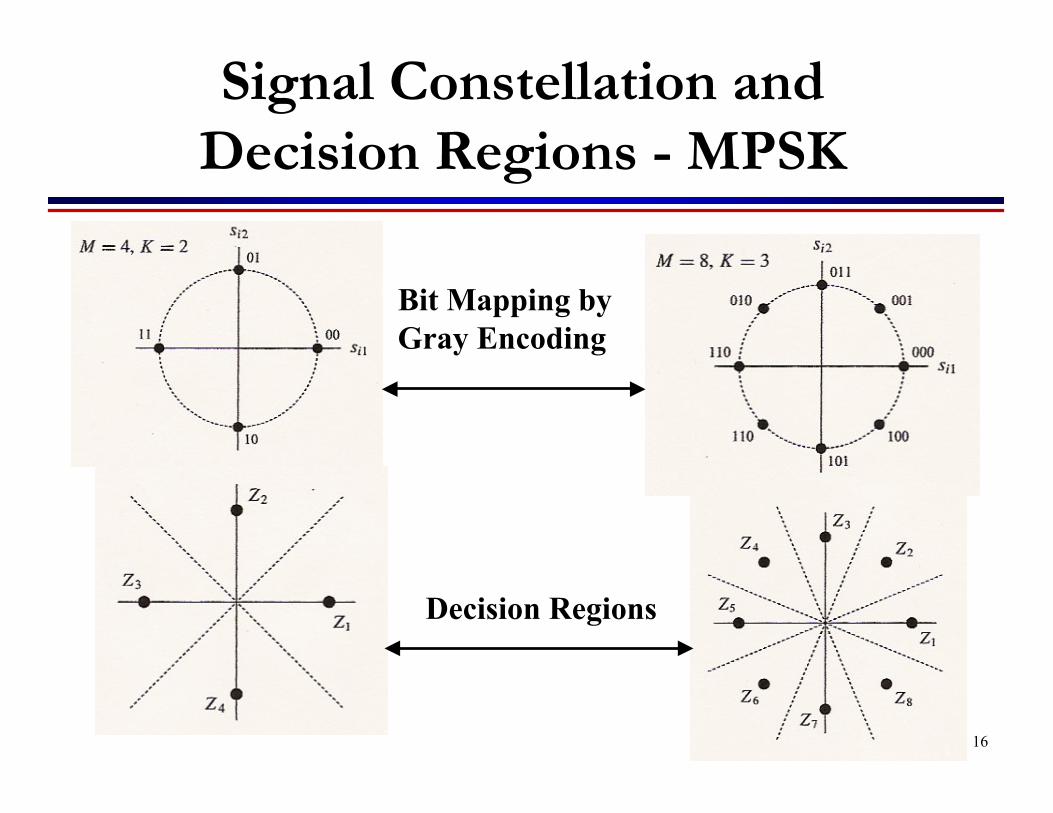
Signal Constellation andDecision Regions - MPSK
Bit Mapping by Gray Encoding
Decision Regions
16
17
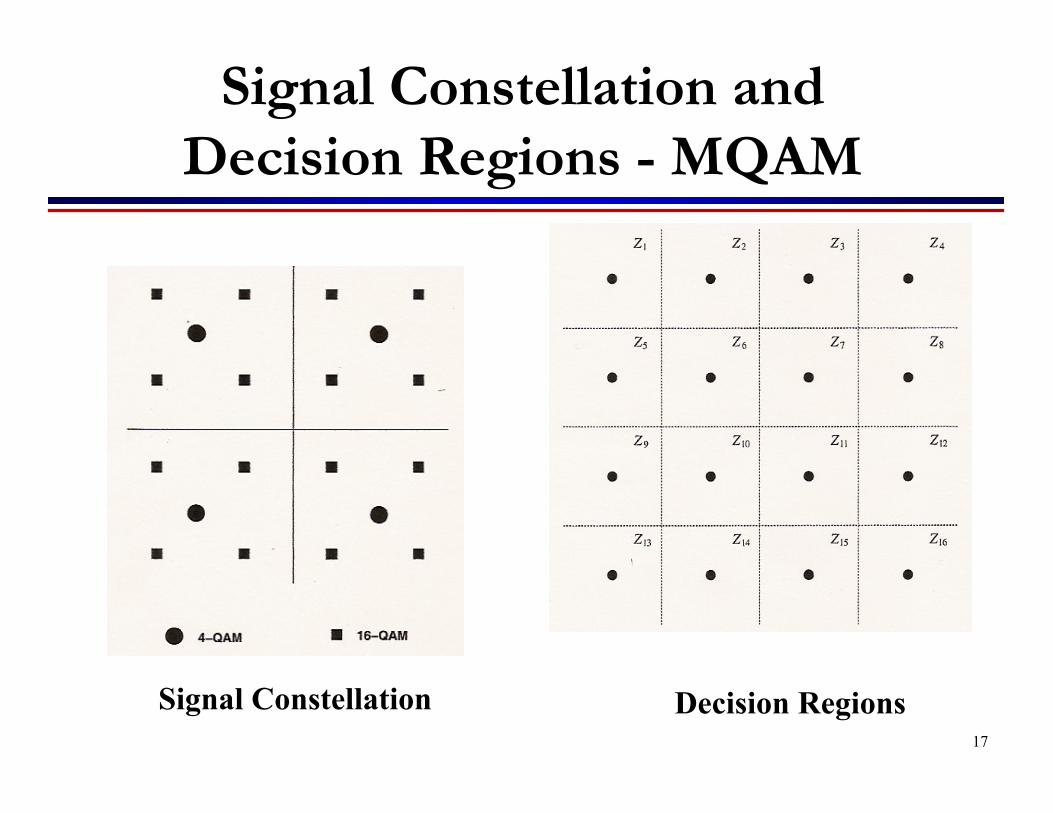
Signal Constellation andDecision Regions - MQAM
Decision RegionsSignal Constellation17
20
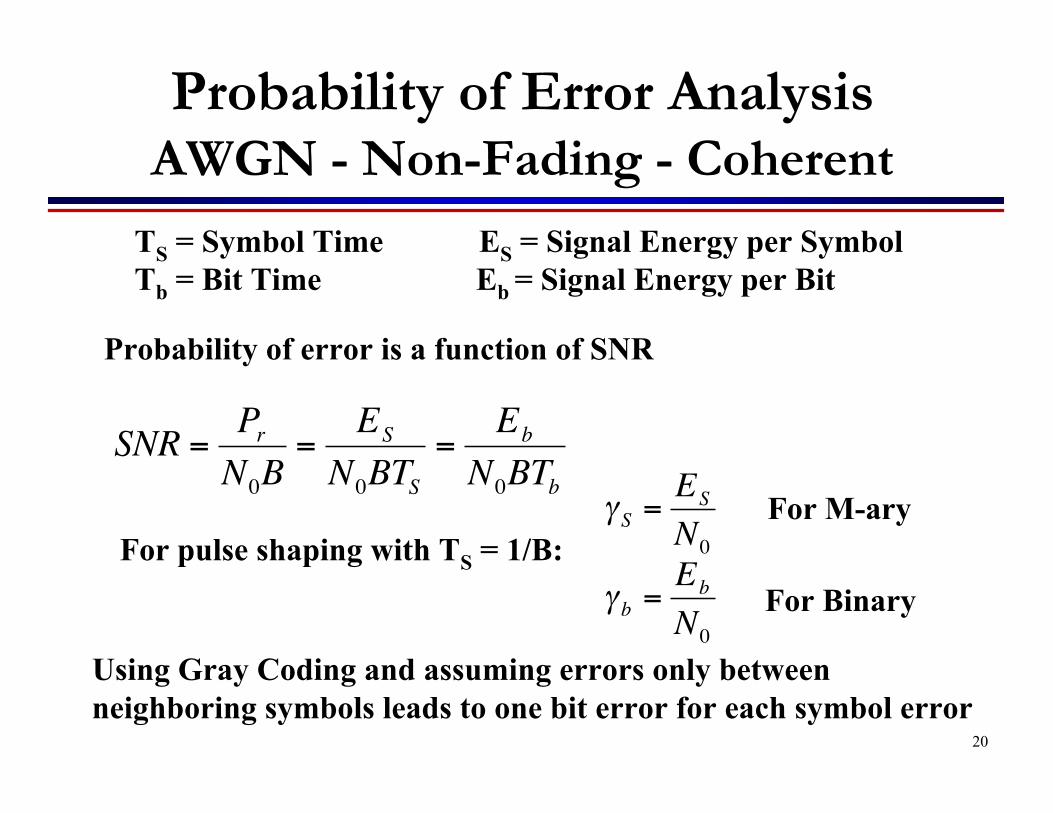
Probability of Error AnalysisAWGN - Non-Fading - Coherent
TS = Symbol Time ES = Signal Energy per SymbolTb = Bit Time Eb = Signal Energy per Bit
€
SNR =PrN0B
=ES
N0BTS=
Eb
N0BTb
Probability of error is a function of SNR
For pulse shaping with TS = 1/B:
€
γ S =ES
N0
γ b =Eb
N0For Binary
For M-ary
Using Gray Coding and assuming errors only between neighboring symbols leads to one bit error for each symbol error
20
21
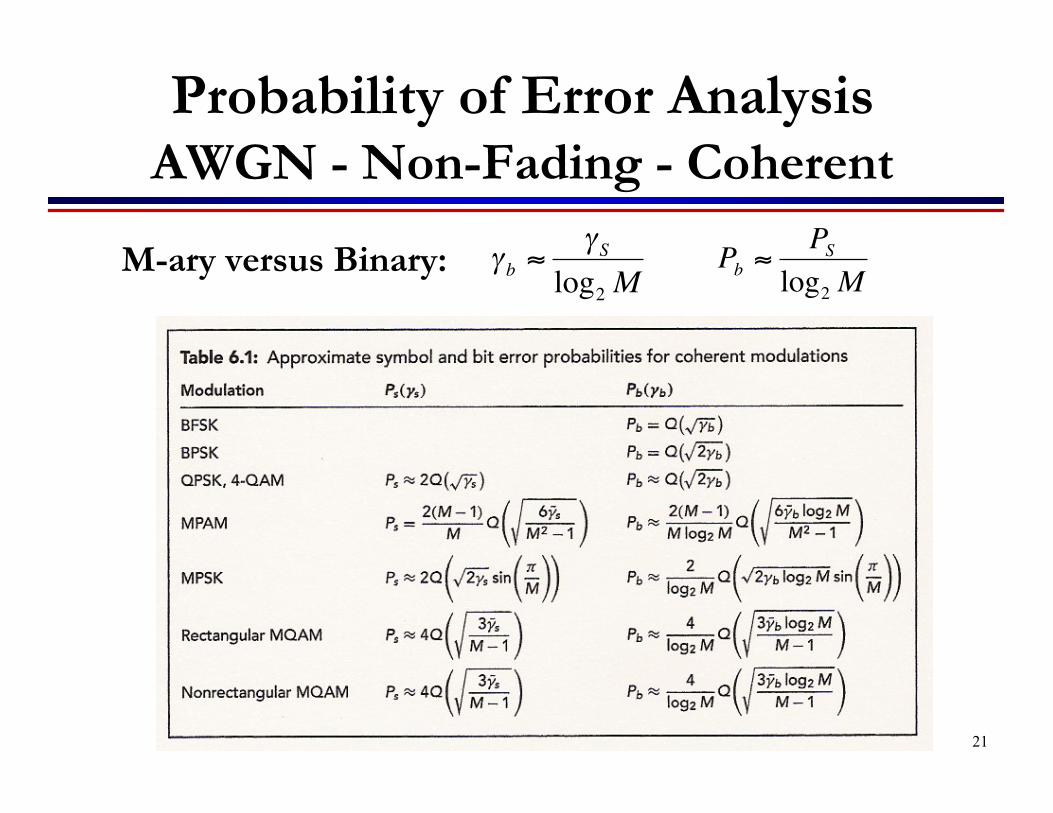
Probability of Error AnalysisAWGN - Non-Fading - Coherent
M-ary versus Binary:
€
γ b ≈γ S
log2 M
€
Pb ≈PS
log2 M
21
22
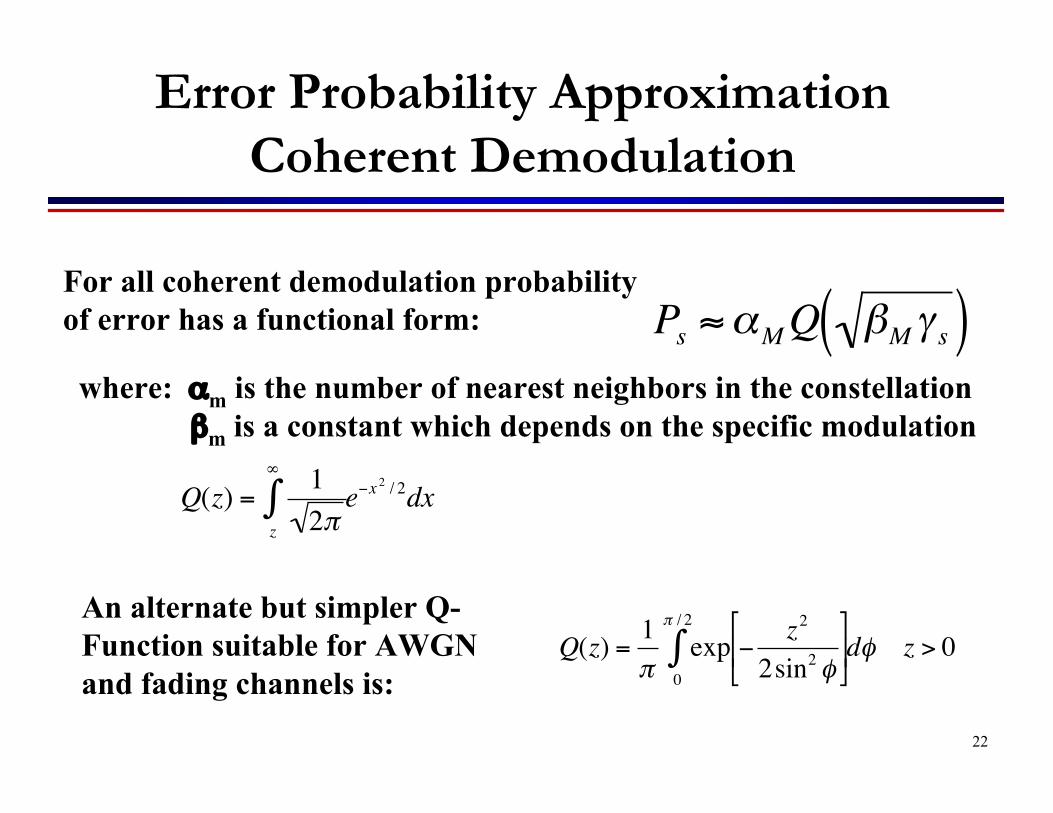
Error Probability ApproximationCoherent Demodulation
€
Ps ≈αMQ βM γ s( )For all coherent demodulation probabilityof error has a functional form:
where: αm is the number of nearest neighbors in the constellation βm is a constant which depends on the specific modulation
€
Q(z) =12πz
∞
∫ e−x2 / 2dx
€
Q(z) =1π
exp − z2
2sin2 φ
0
π / 2
∫ dφ z > 0An alternate but simpler Q-Function suitable for AWGN and fading channels is:
22
23
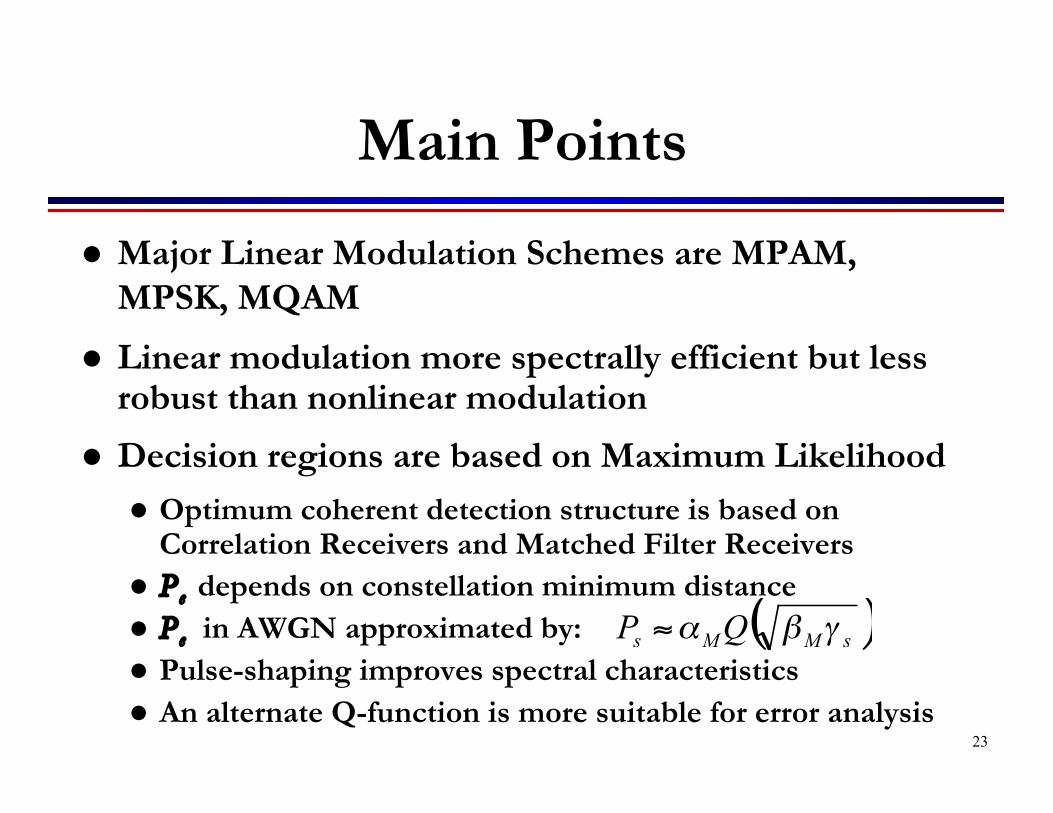
Main Points
Major Linear Modulation Schemes are MPAM,MPSK, MQAM
Linear modulation more spectrally efficient but lessrobust than nonlinear modulation
Decision regions are based on Maximum Likelihood Optimum coherent detection structure is based on
Correlation Receivers and Matched Filter Receivers Pe depends on constellation minimum distance Pe in AWGN approximated by: Pulse-shaping improves spectral characteristics An alternate Q-function is more suitable for error analysis
( )sMMs QP γβα≈
23
7
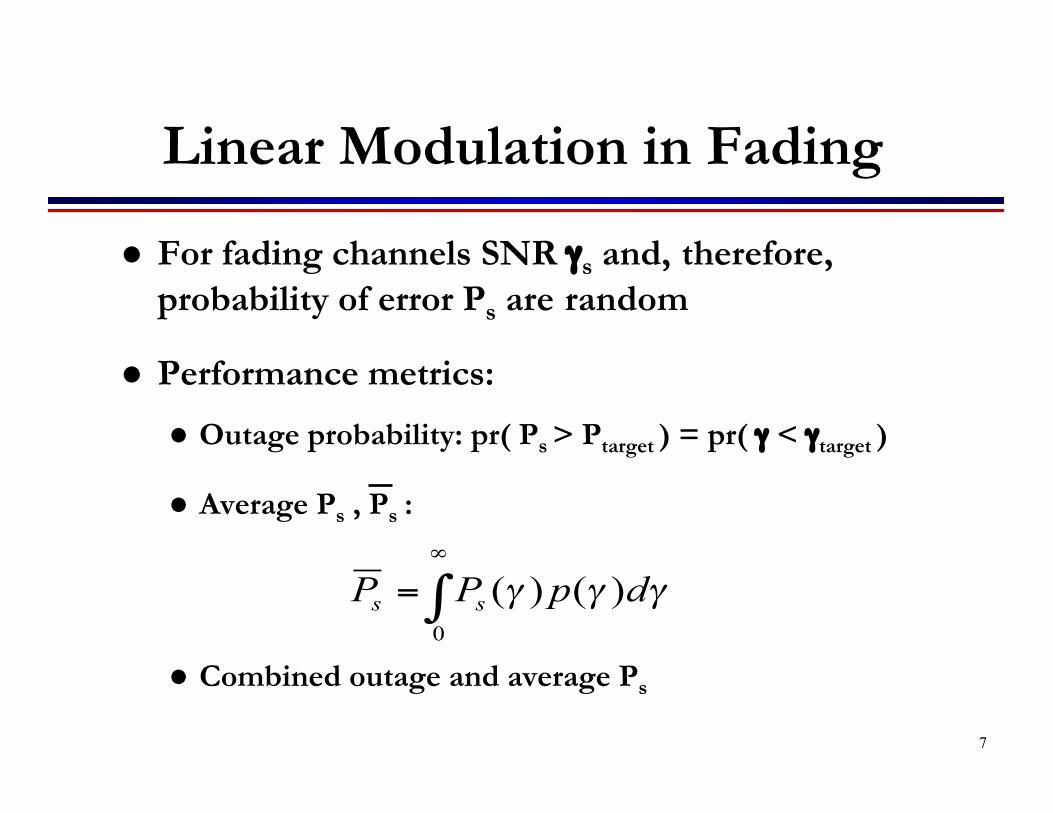
Linear Modulation in Fading
For fading channels SNR γs and, therefore,probability of error Ps are random
Performance metrics:
Outage probability: pr( Ps > Ptarget ) = pr( γ < γtarget )
Average Ps , Ps :
Combined outage and average Ps
γγγ dpPP ss )()(0∫∞
=
7
8
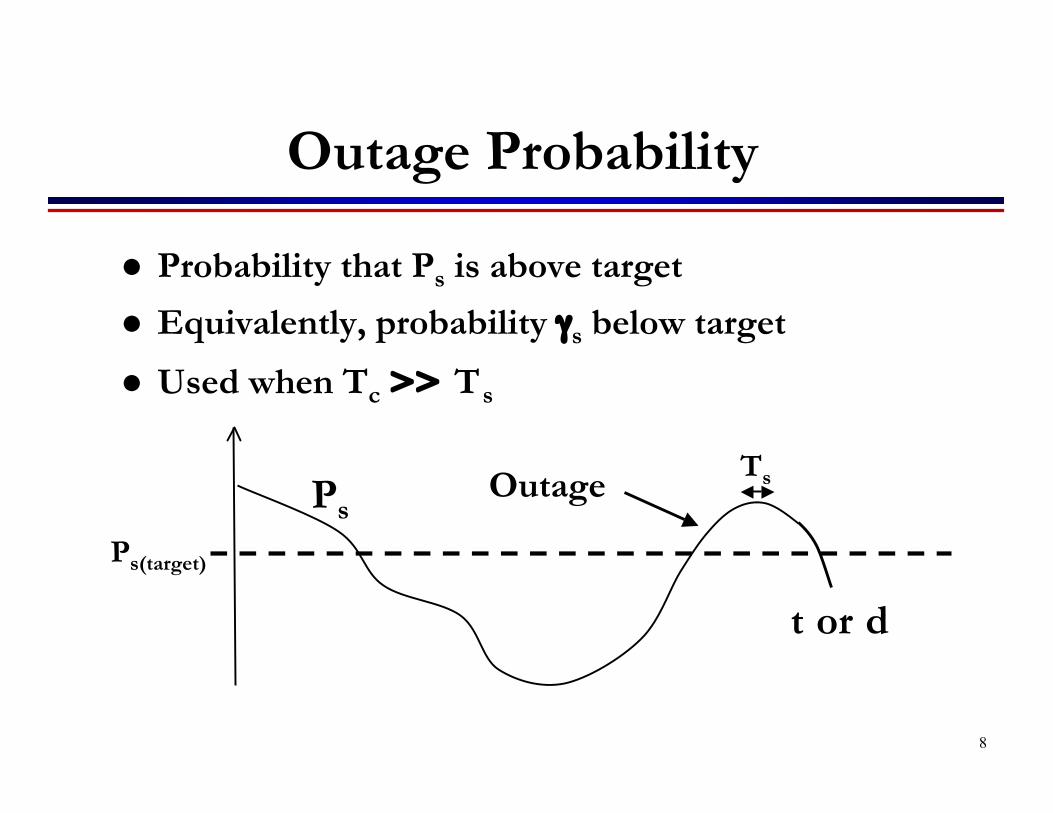
Outage Probability
Ps
Ps(target)
Outage Ts
t or d
Probability that Ps is above target
Equivalently, probability γs below target
Used when Tc >> Ts
8
9
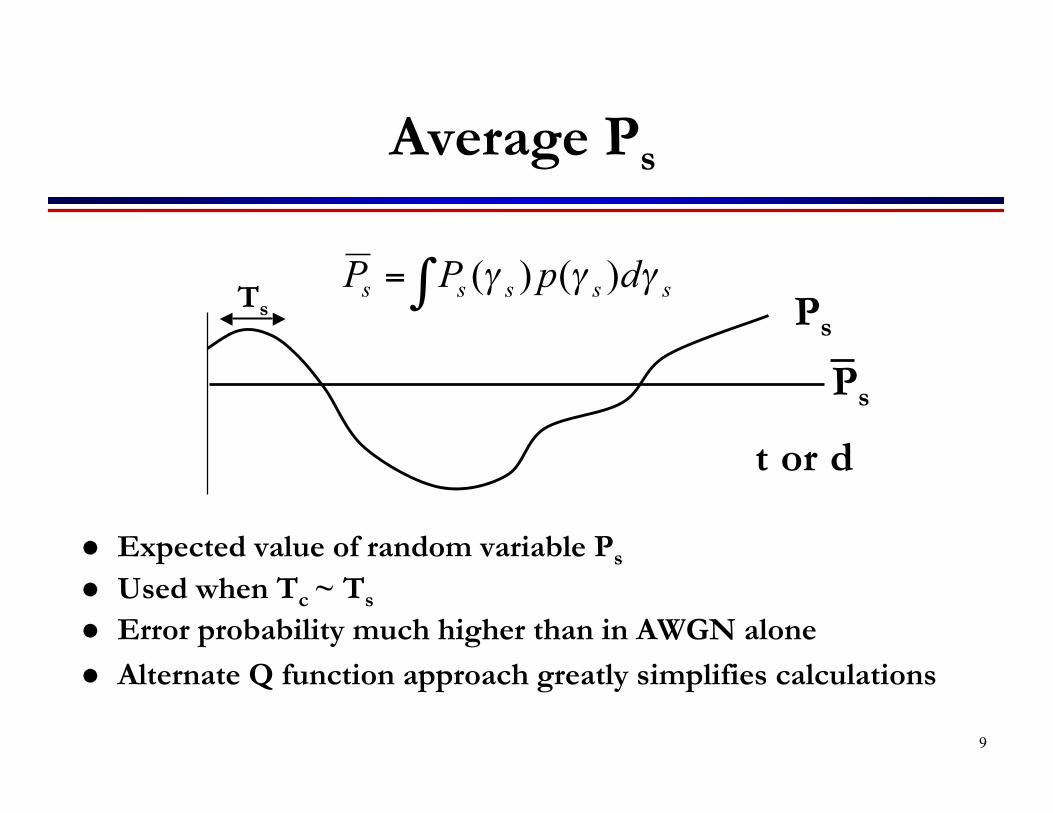
Average Ps
Expected value of random variable Ps
Used when Tc ~ Ts
Error probability much higher than in AWGN alone Alternate Q function approach greatly simplifies calculations
sssss dpPP γγγ )()(∫= Ps
Ps
Ts
t or d
9
10
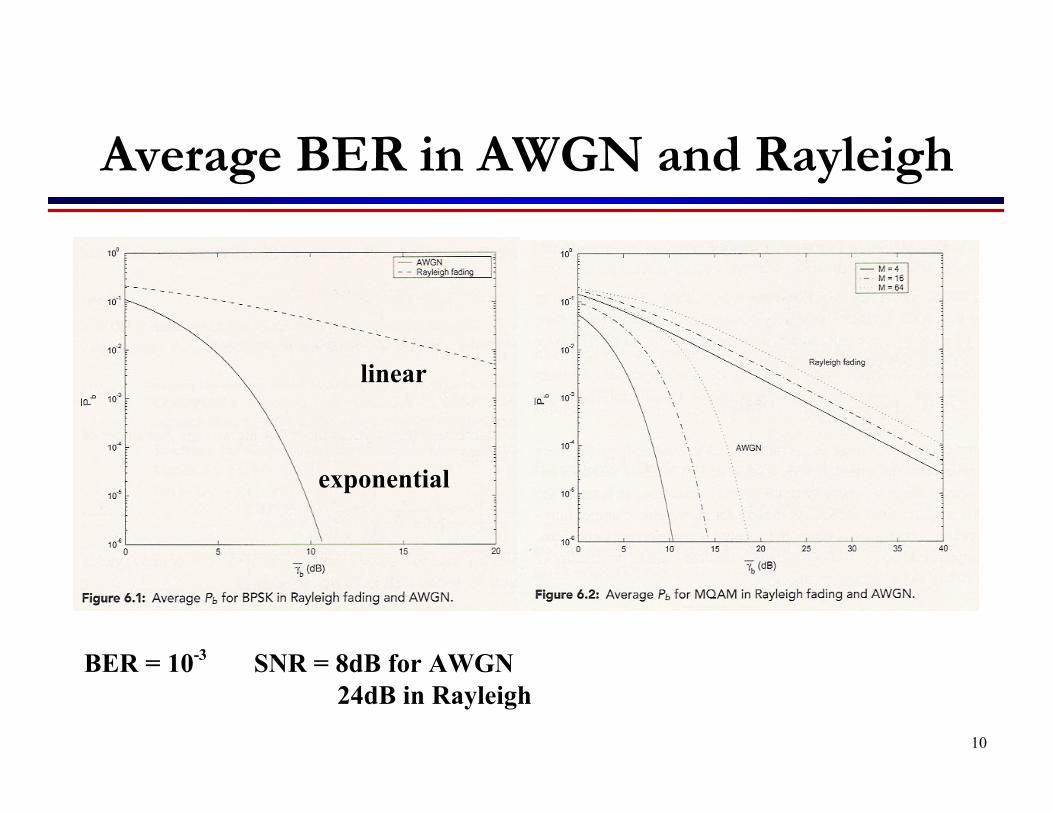
Average BER in AWGN and Rayleigh
BER = 10-3 SNR = 8dB for AWGN 24dB in Rayleigh
linear
exponential
10
11
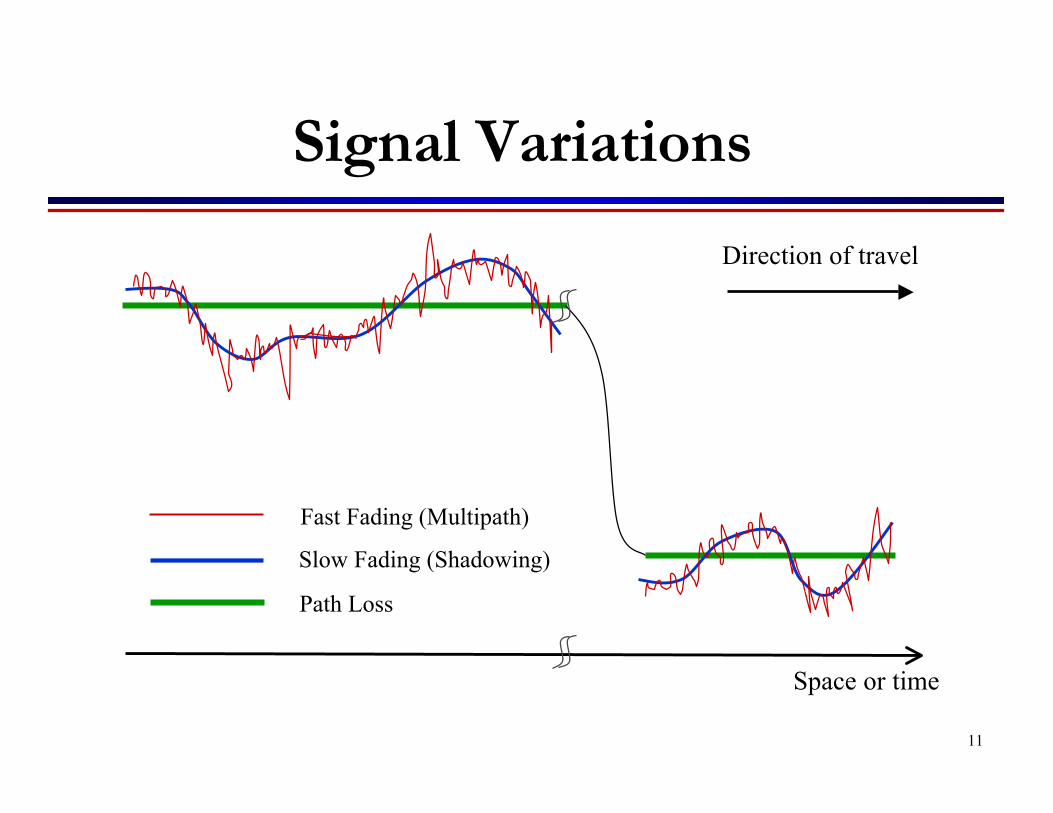
Signal Variations
Space or time
Path Loss
Slow Fading (Shadowing)
Fast Fading (Multipath)
Direction of travel
11
12
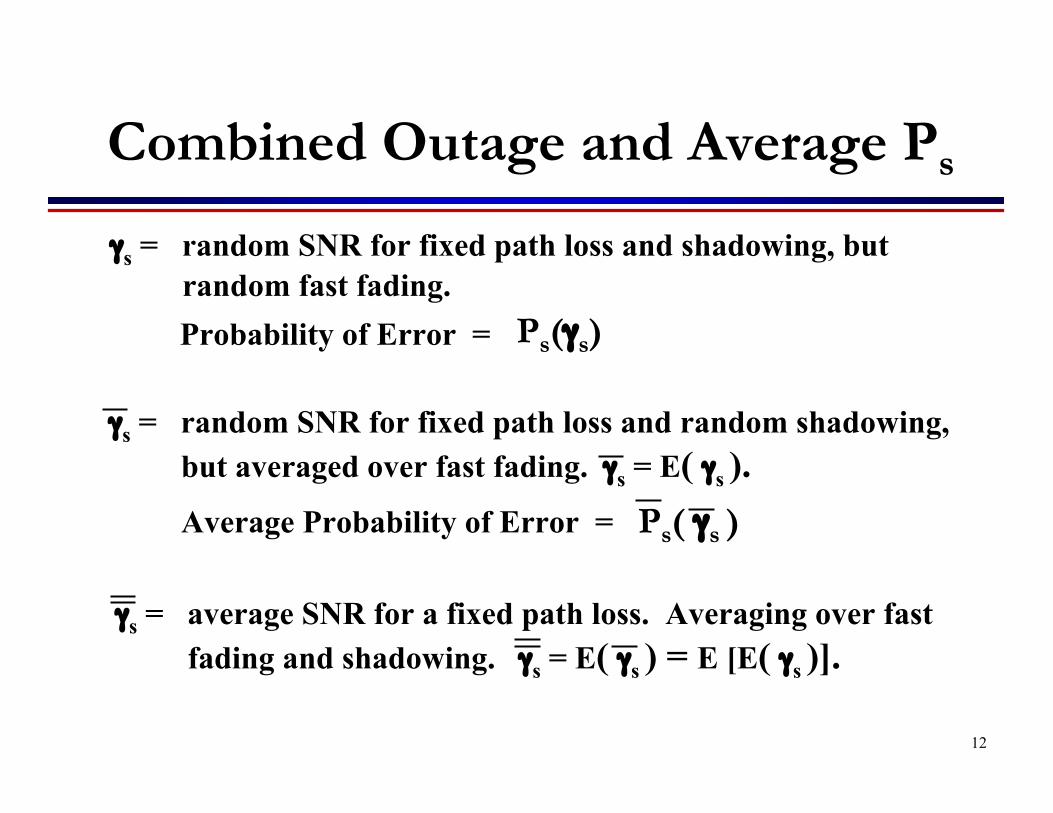
Combined Outage and Average Ps
γs = average SNR for a fixed path loss. Averaging over fast fading and shadowing. γs = E( γs ) = E [E( γs )].
γs = random SNR for fixed path loss and random shadowing, but averaged over fast fading. γs = E( γs ).
Ps( γs )Average Probability of Error =
γs = random SNR for fixed path loss and shadowing, but random fast fading.
Ps(γs)Probability of Error =
12
13
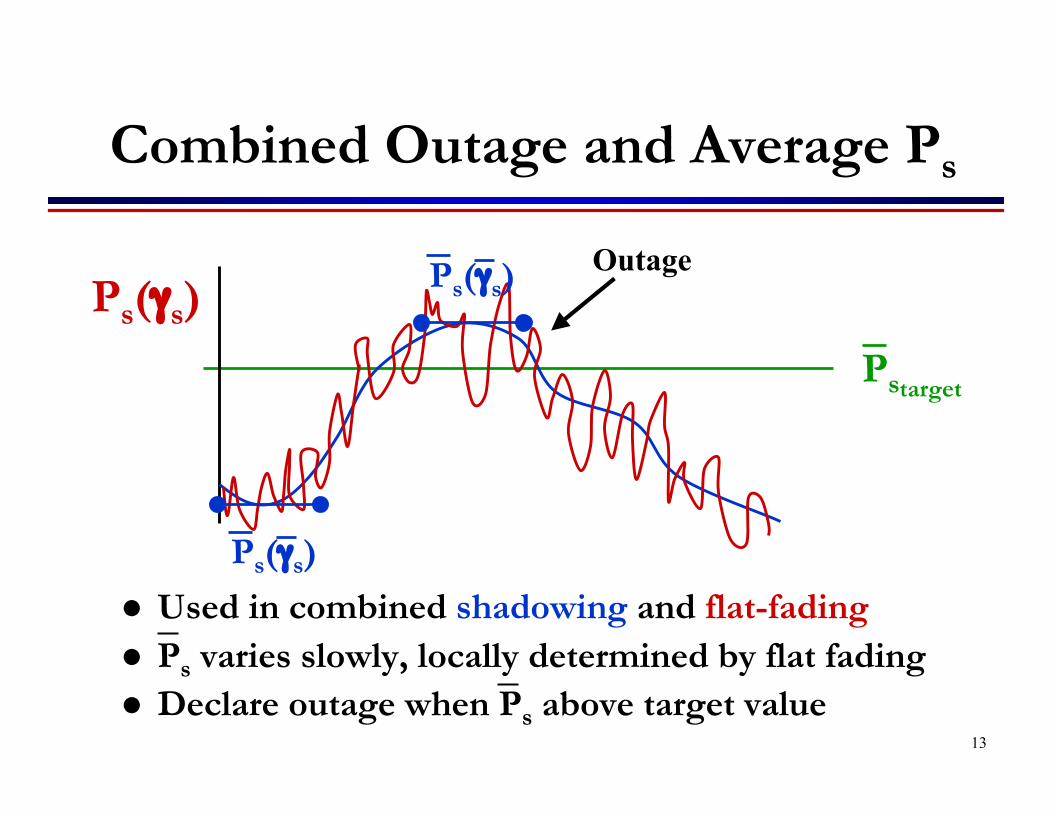
Used in combined shadowing and flat-fading Ps varies slowly, locally determined by flat fading Declare outage when Ps above target value
Ps(γs)
Pstarget
Outage
Combined Outage and Average Ps
Ps(γs)
Ps(γs)
13
14
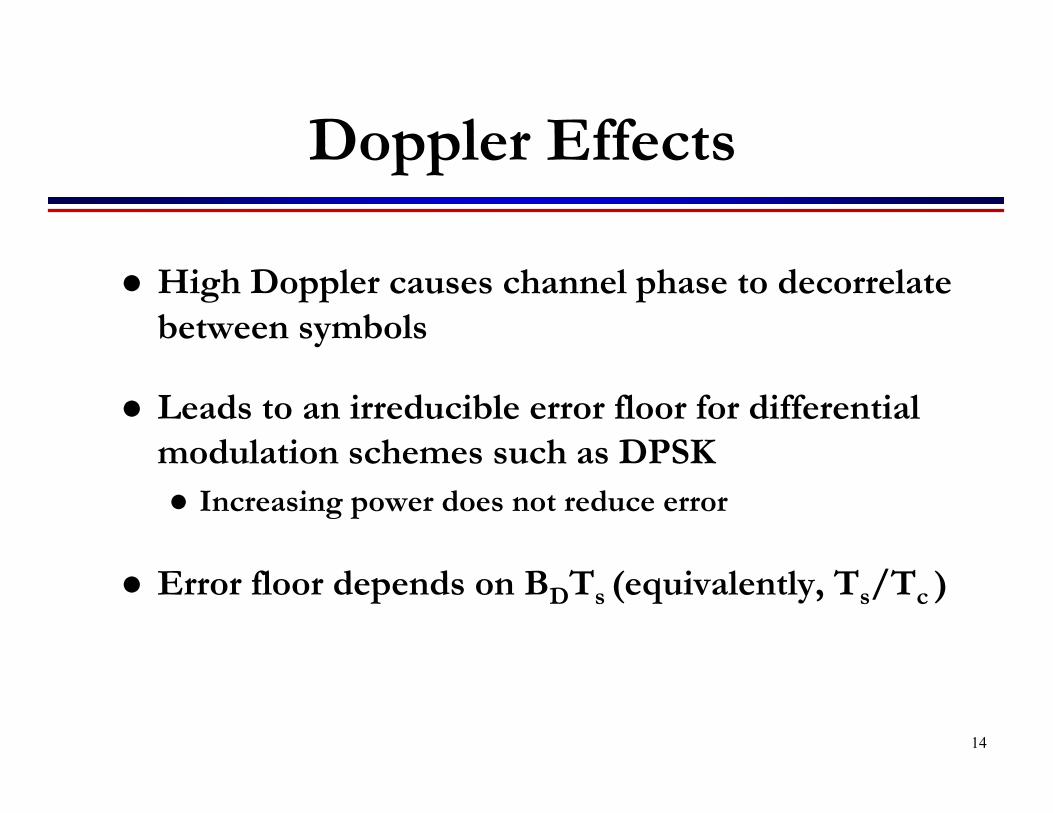
Doppler Effects
High Doppler causes channel phase to decorrelatebetween symbols
Leads to an irreducible error floor for differentialmodulation schemes such as DPSK Increasing power does not reduce error
Error floor depends on BDTs (equivalently, Ts/Tc )
14
15
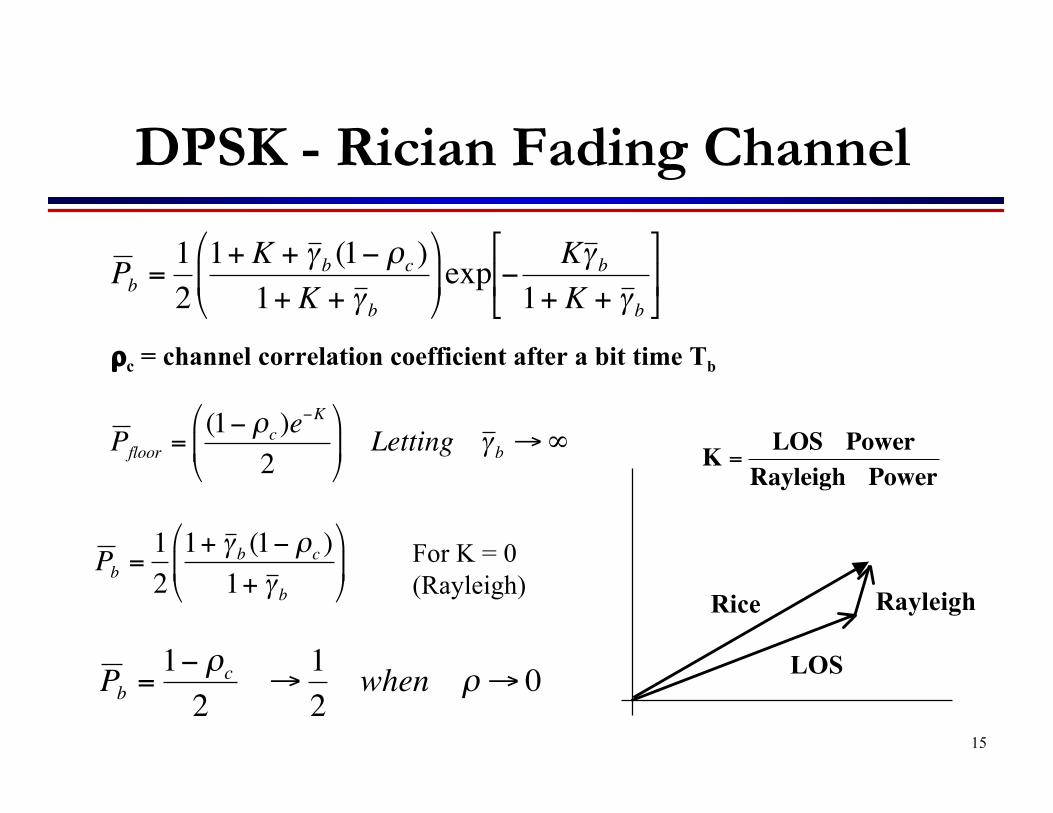
DPSK - Rician Fading Channel
LOS
RayleighRice
€
P b =121+ K + γ b (1− ρc )1+ K + γ b
exp −
Kγ b1+ K + γ b
€
P b =121+ γ b (1− ρc )1+ γ b
ρc = channel correlation coefficient after a bit time Tb
For K = 0(Rayleigh)€
P floor =(1− ρc )e
−K
2
Letting γ b →∞
€
P b =1− ρc
2→12
when ρ → 0
€
K =LOS Power
Rayleigh Power
15
16
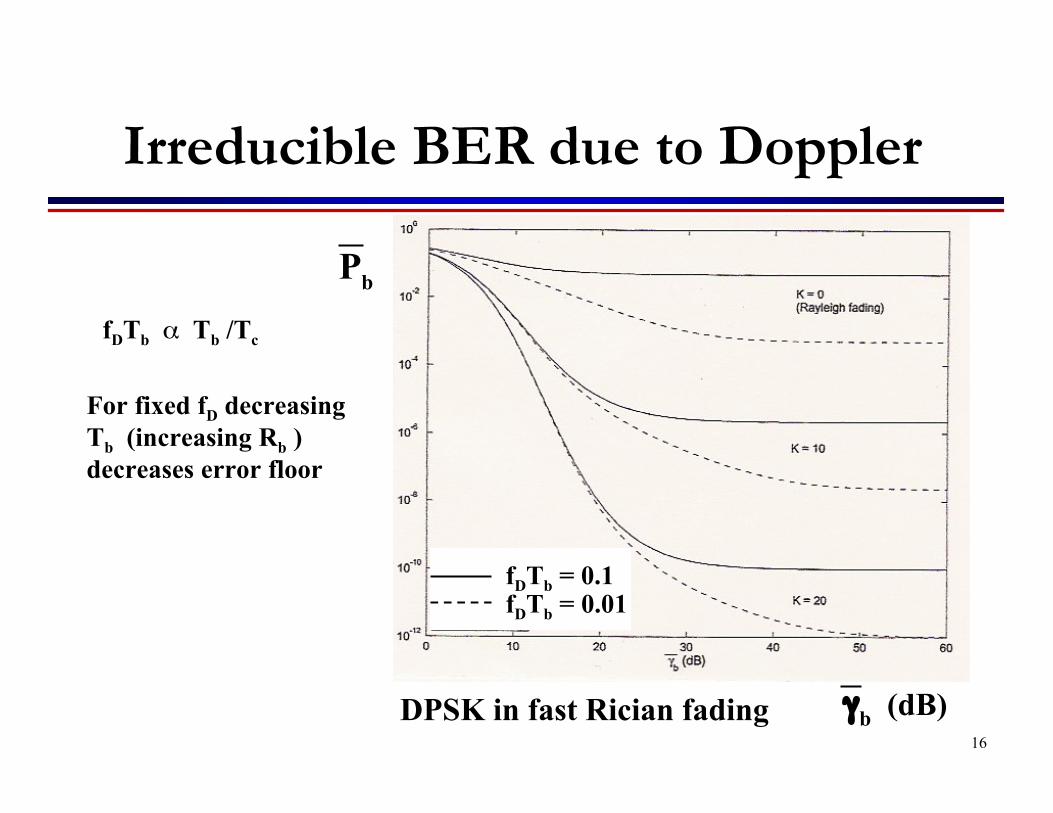
Irreducible BER due to Doppler
Pb
γb (dB)DPSK in fast Rician fading
fDTb = 0.1fDTb = 0.01
fDTb α Tb /Tc
For fixed fD decreasingTb (increasing Rb )decreases error floor
16
17
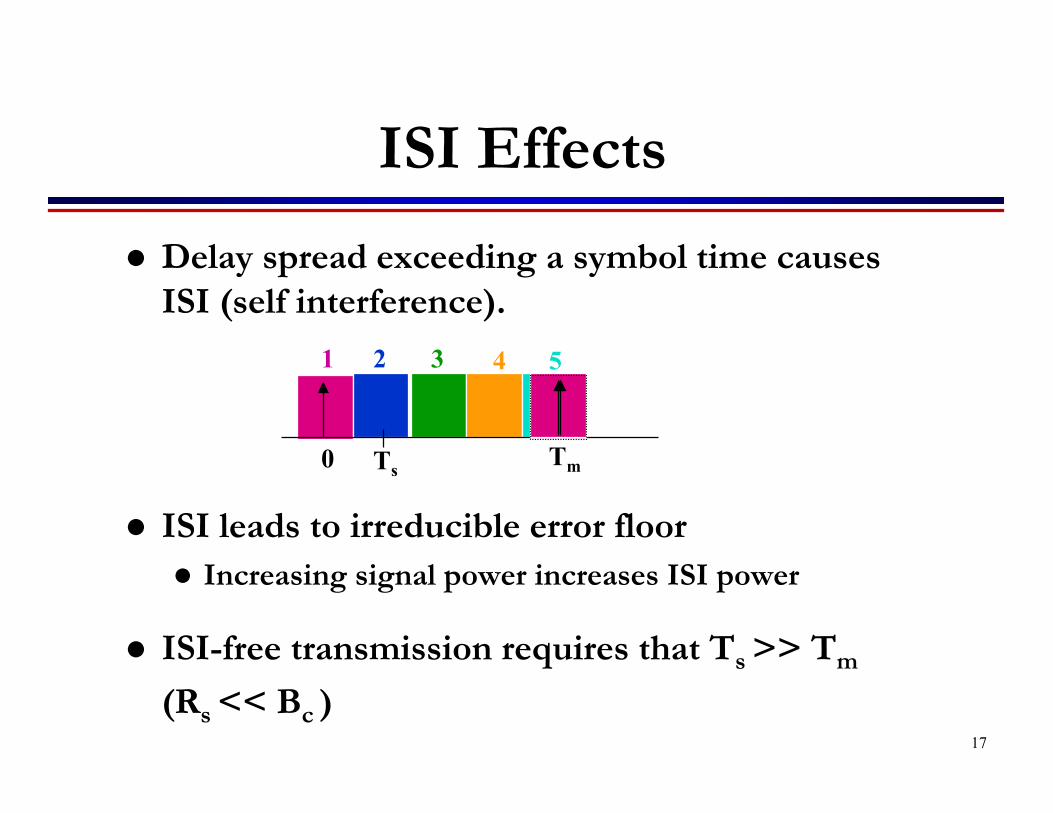
ISI Effects
Delay spread exceeding a symbol time causesISI (self interference).
ISI leads to irreducible error floor Increasing signal power increases ISI power
ISI-free transmission requires that Ts >> Tm
(Rs << Bc )
0 Tm
1 2 3 4 5
Ts
17
18
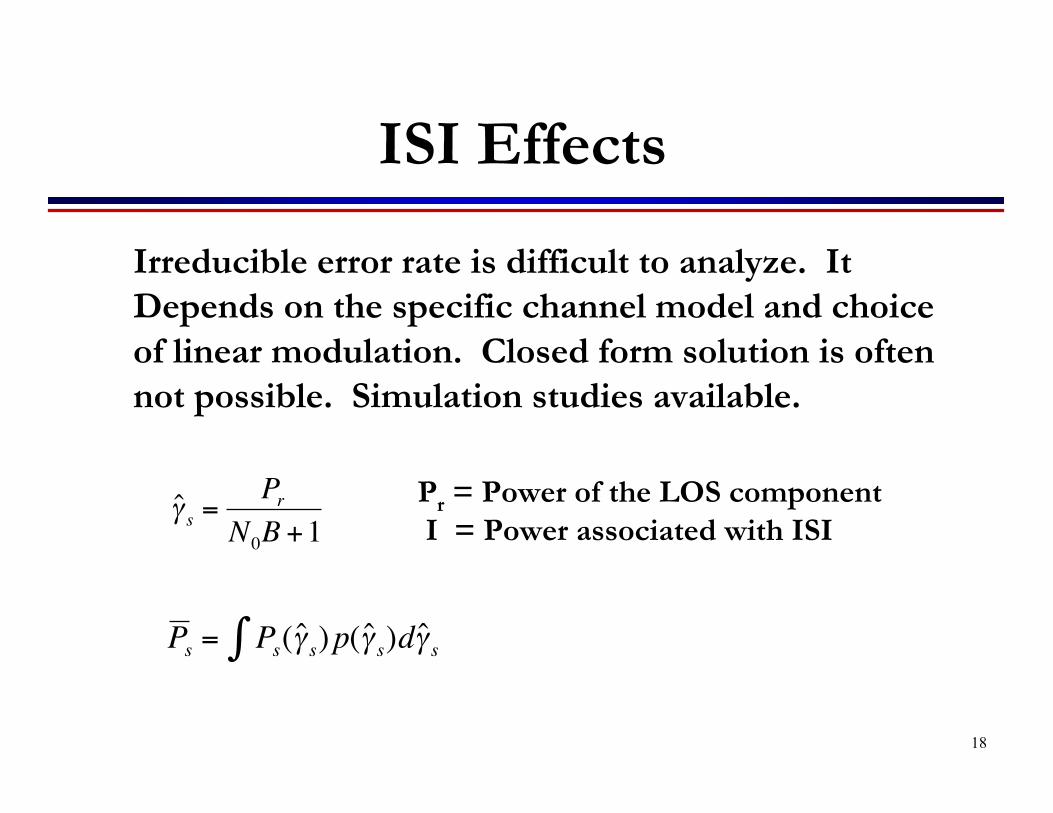
ISI Effects
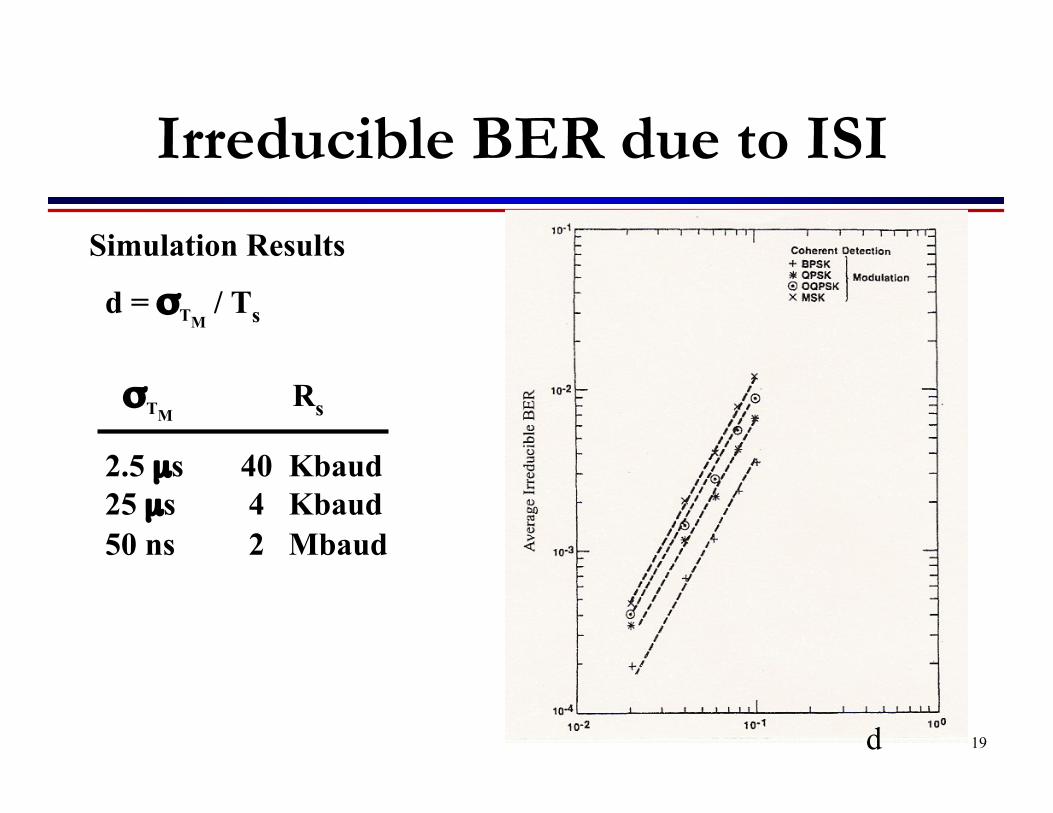
Irreducible error rate is difficult to analyze. It Depends on the specific channel model and choiceof linear modulation. Closed form solution is oftennot possible. Simulation studies available.
€
ˆ γ s =Pr
N0B +1
€
P s = Ps∫ ( ˆ γ s) p( ˆ γ s)d ˆ γ s
Pr = Power of the LOS component I = Power associated with ISI
18
19
Irreducible BER due to ISI
d
Simulation Results
d = σTM / Ts
σTM Rs
2.5 µs 40 Kbaud25 µs 4 Kbaud50 ns 2 Mbaud
19
20
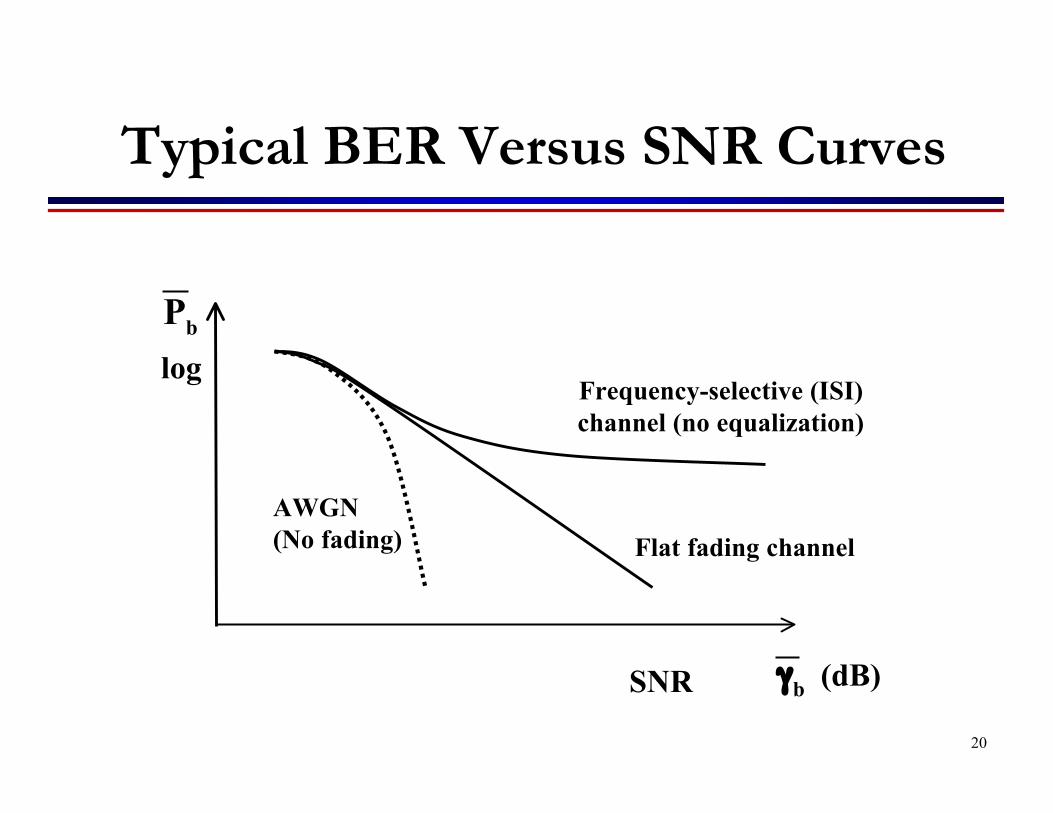
Typical BER Versus SNR Curves
Frequency-selective (ISI)channel (no equalization)
Flat fading channelAWGN(No fading)
Pb
γb (dB)
log
SNR
20
21
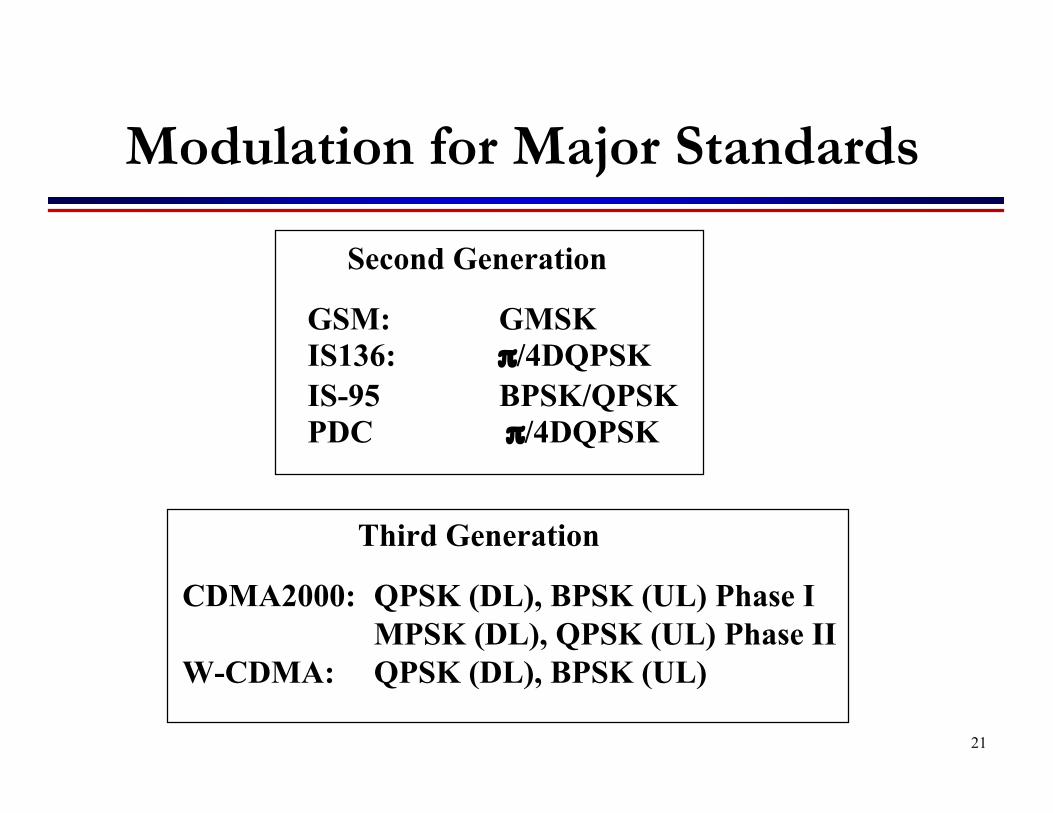
Modulation for Major Standards
Second Generation
GSM: GMSKIS136: π/4DQPSKIS-95 BPSK/QPSKPDC π/4DQPSK
Third Generation
CDMA2000: QPSK (DL), BPSK (UL) Phase IMPSK (DL), QPSK (UL) Phase II
W-CDMA: QPSK (DL), BPSK (UL)
21
22
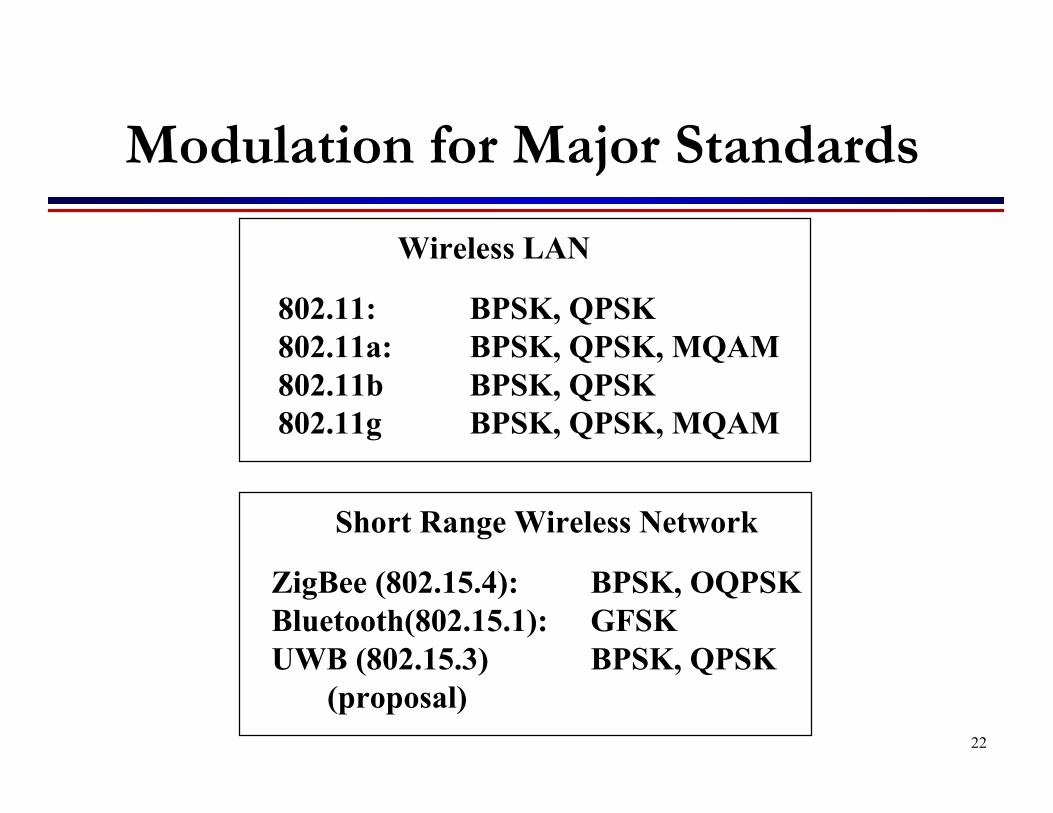
Modulation for Major Standards
Wireless LAN
802.11: BPSK, QPSK802.11a: BPSK, QPSK, MQAM802.11b BPSK, QPSK802.11g BPSK, QPSK, MQAM
Short Range Wireless Network
ZigBee (802.15.4): BPSK, OQPSKBluetooth(802.15.1): GFSKUWB (802.15.3) BPSK, QPSK (proposal)
22
23
Main Points Fading greatly increases average Ps
Alternate Q function approach simplifies Ps calculation,especially its average value in fading
Moment Generating Function approach can be used effectivelyfor average error probability calculations in fading
Doppler spread only impacts differential modulationcausing an irreducible error floor at low data rates
Delay spread causes ISI and irreducible error floor orimposes limits on transmission rates
Need to combat flat and frequency-selective fading Focus of the rest of the course.
23