Educational Course - Imaging Ultrasound I Triplex … › meetings › amos2 › pdf ›...
17
Educational Course - Imaging Ultrasound I J. Brian Fowlkes, PhD* University of Michigan Department of Radiology and Biomedical Engineering *Equipment support from GE Medical and Toshiba Medical [email protected] Triplex Mode Gas Molecules in a Sound Wave λ - Spatial f - Temporal Wave Propagation Animation from Dr. Dan Russell, Kettering University Relationships Velocity-Frequency-Wavelength c = Sound Velocity f = Frequency λ = Wavelength c = f λ Speed of Sound c (m/s)
Transcript of Educational Course - Imaging Ultrasound I Triplex … › meetings › amos2 › pdf ›...
Educational Course - Imaging Ultrasound I
J. Brian Fowlkes, PhD* University of Michigan
Department of Radiology and Biomedical Engineering
*Equipment support from GE Medical and Toshiba Medical [email protected]
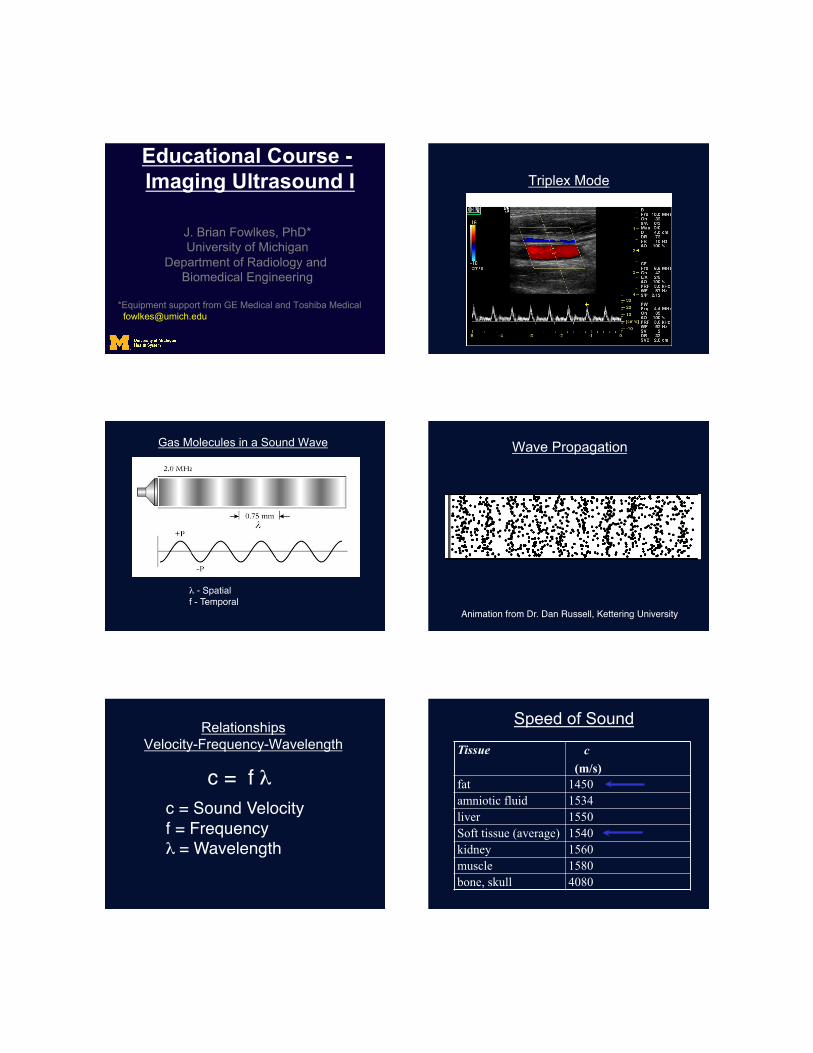
Triplex Mode
Gas Molecules in a Sound Wave
λ - Spatial f - Temporal
Wave Propagation
Animation from Dr. Dan Russell, Kettering University"
Relationships Velocity-Frequency-Wavelength
c = Sound Velocity"f = Frequency"λ = Wavelength"
c = f λ
Speed of Sound
c (m/s)
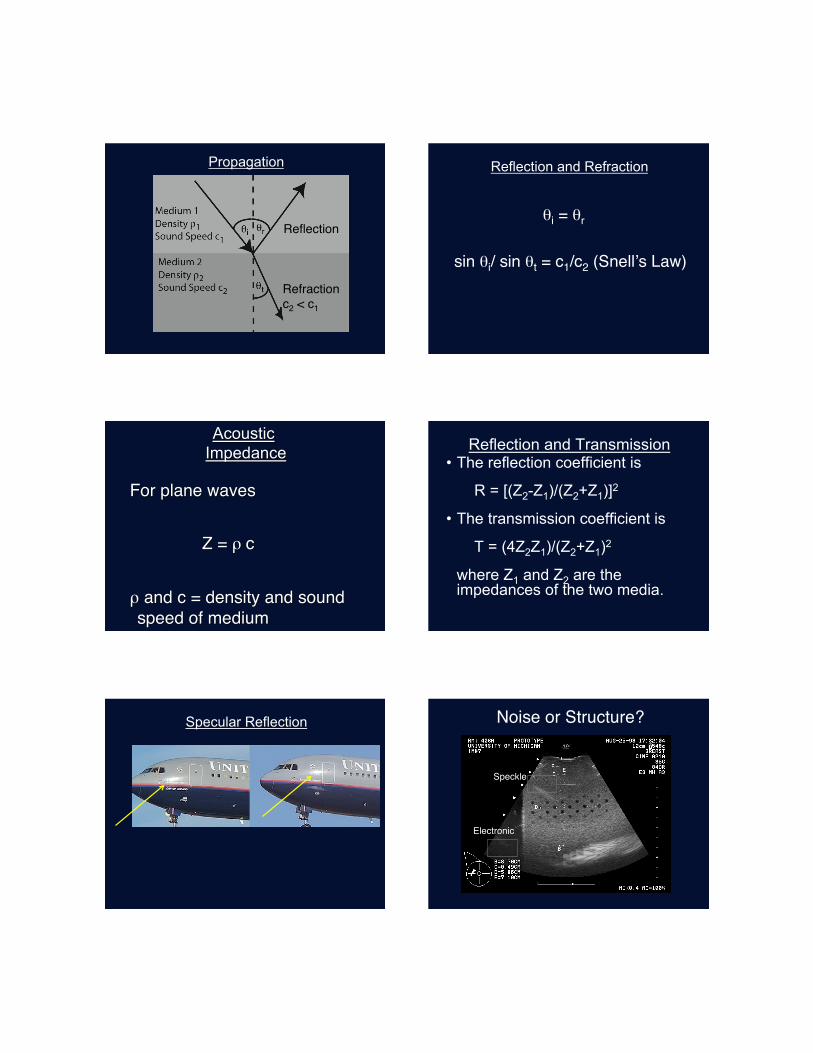
Refraction"c2 < c1"
Propagation
Reflection"
Reflection and Refraction
θi = θr "
sin θi/ sin θt = c1/c2 (Snellʼs Law)"
Reflection and Transmission • The reflection coefficient is
R = [(Z2-Z1)/(Z2+Z1)]2
• The transmission coefficient is
T = (4Z2Z1)/(Z2+Z1)2
where Z1 and Z2 are the impedances of the two media.
Specular Reflection Noise or Structure?"
Speckle"
Electronic"
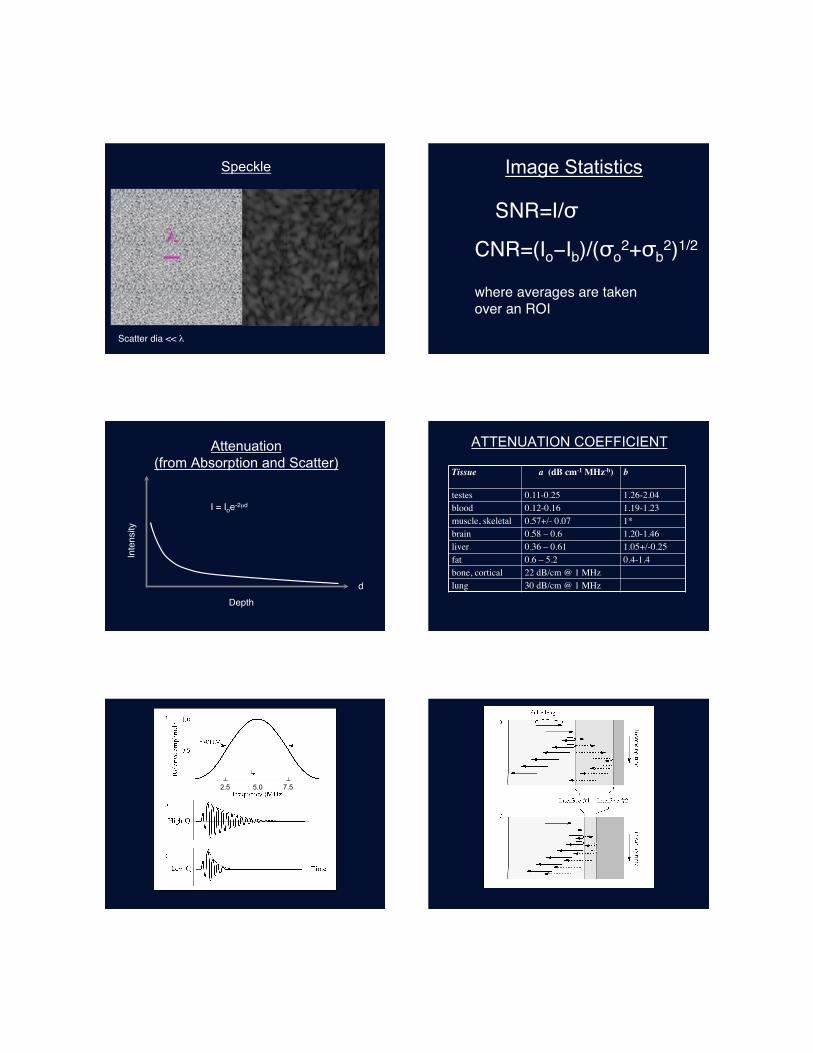
Speckle
Scatter dia << λ"
λ
Image Statistics
SNR=I/σ"
CNR=(Io−Ib)/(σo2+σb
2)1/2"
where averages are taken "over an ROI"
Attenuation (from Absorption and Scatter)
I = Ioe-2µd"
Depth"d"
Inte
nsity"
ATTENUATION COEFFICIENT
7.5 2.5 5.0
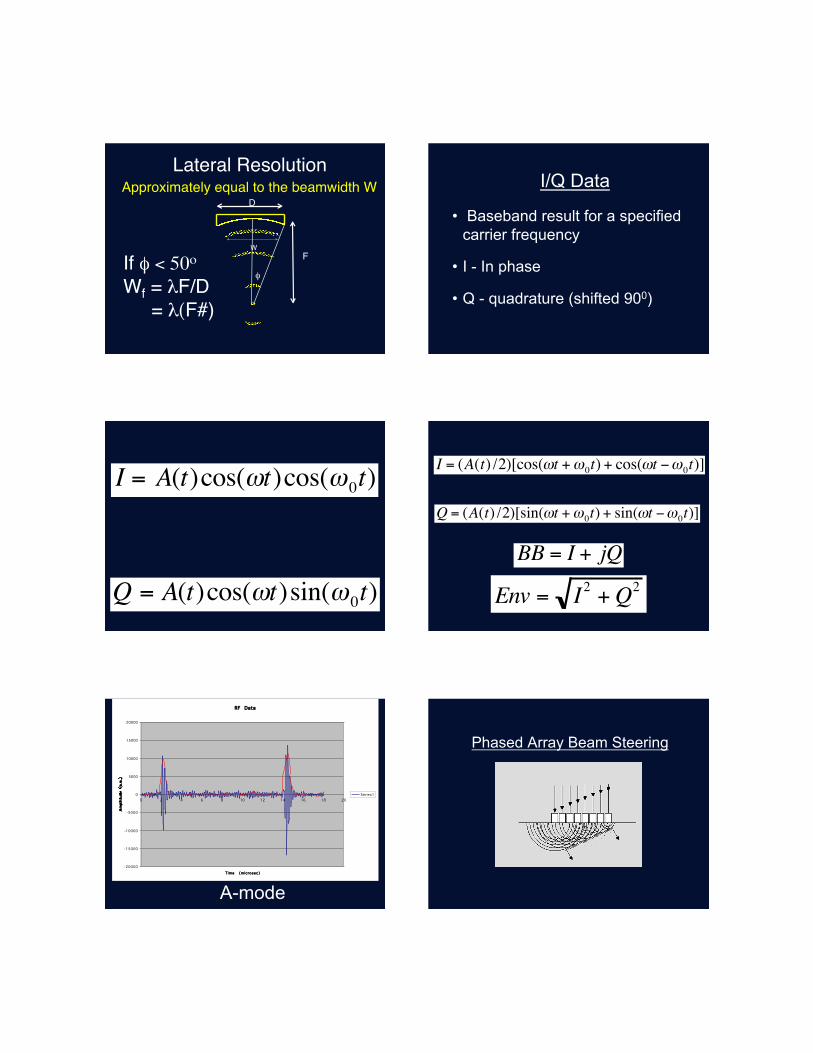
Lateral Resolution"Approximately equal to the beamwidth W"
W"
φ If φ < 50ο"Wf = λF/D""= λ(F#)"
D"
F"
I/Q Data
• Baseband result for a specified carrier frequency
• I - In phase
• Q - quadrature (shifted 900)
I = A(t)cos(ωt)cos(ω0t)
Q = A(t)cos(ωt)sin(ω0t)
€
BB = I + jQ€
I = (A(t) /2)[cos(ωt +ω0t) + cos(ωt −ω0t)]
€
Q = (A(t) /2)[sin(ωt +ω0t) + sin(ωt −ω0t)]
Env = I2 +Q2
RF Data
RF Data
-20000
-15000
-10000
-5000
0
5000
10000
15000
20000
0 2 4 6 8 10 12 14 16 18 20
Time (microsec)
Am
plit
ude
(a.u
.)
Series1
A-mode
Phased Array Beam Steering
Transducer
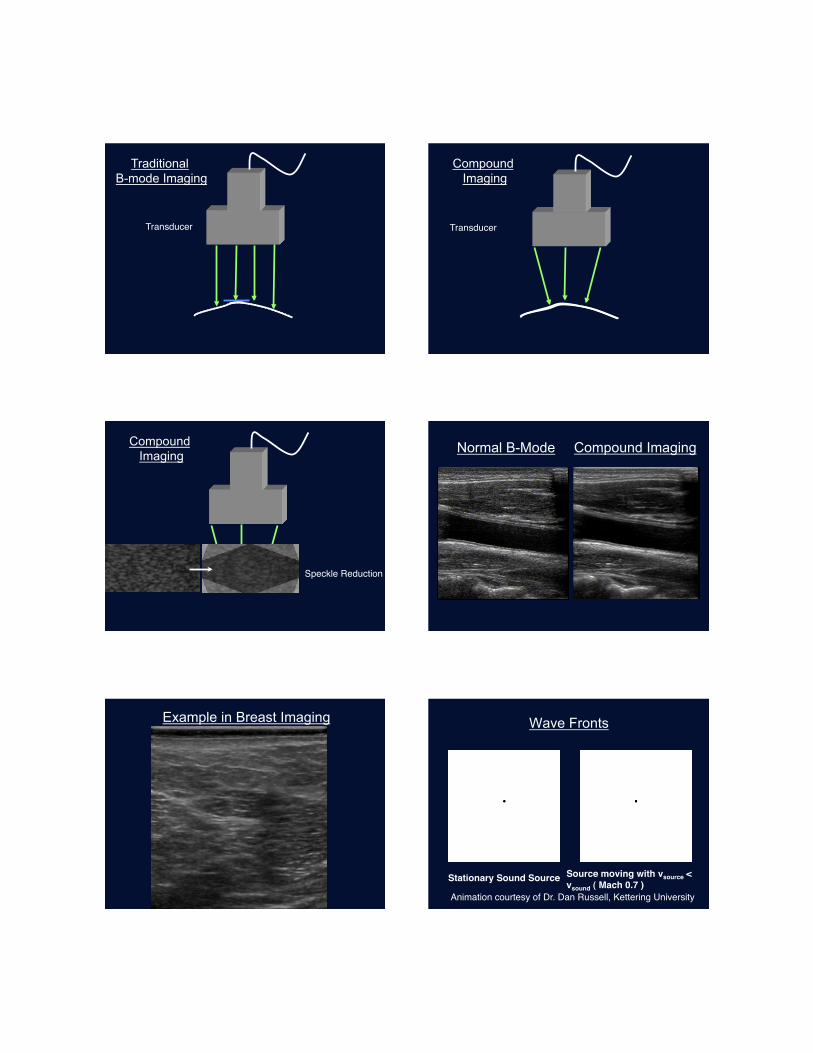
Traditional B-mode Imaging
Transducer
Compound Imaging
Compound Imaging
Speckle Reduction"
Compound Imaging
Normal B-Mode
Example in Breast Imaging Wave Fronts
Animation courtesy of Dr. Dan Russell, Kettering University"
Stationary Sound Source" Source moving with vsource < vsound ( Mach 0.7 )"
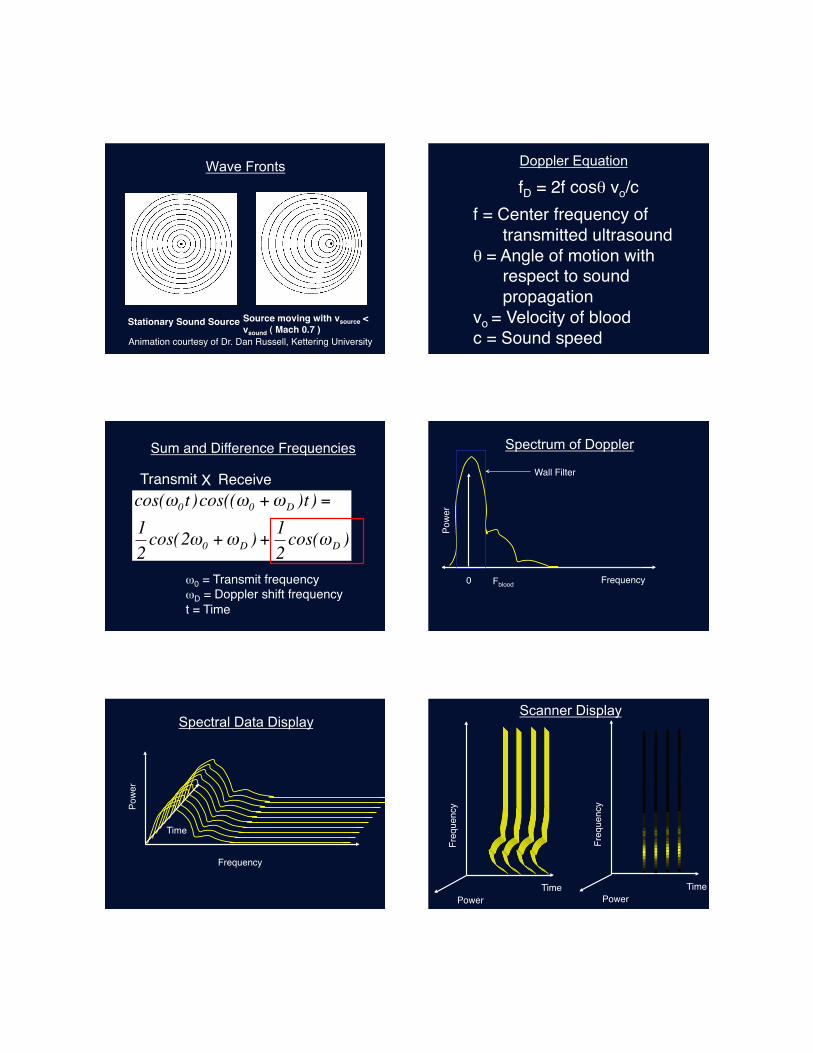
Wave Fronts
Animation courtesy of Dr. Dan Russell, Kettering University"
Stationary Sound Source"Source moving with vsource < vsound ( Mach 0.7 )"
Doppler Equation
fD = 2f cosθ vo/c"f = Center frequency of
transmitted ultrasound"
θ = Angle of motion with respect to sound propagation"
vo = Velocity of blood"c = Sound speed"
€
cos(ω0t)cos((ω0 +ωD )t) =
12cos(2ω0 +ωD ) +
12cos(ωD )
Sum and Difference Frequencies"
Transmit" Receive"
ω0 = Transmit frequency"ωD = Doppler shift frequency"t = Time"
X"
Spectrum of Doppler Po
wer"
Frequency"
Wall Filter"
0 Fblood"
Spectral Data Display
Pow
er"
Frequency"
Time"
Scanner Display
Freq
uenc
y"
Time"Power"
Freq
uenc
y"
Time"Power"
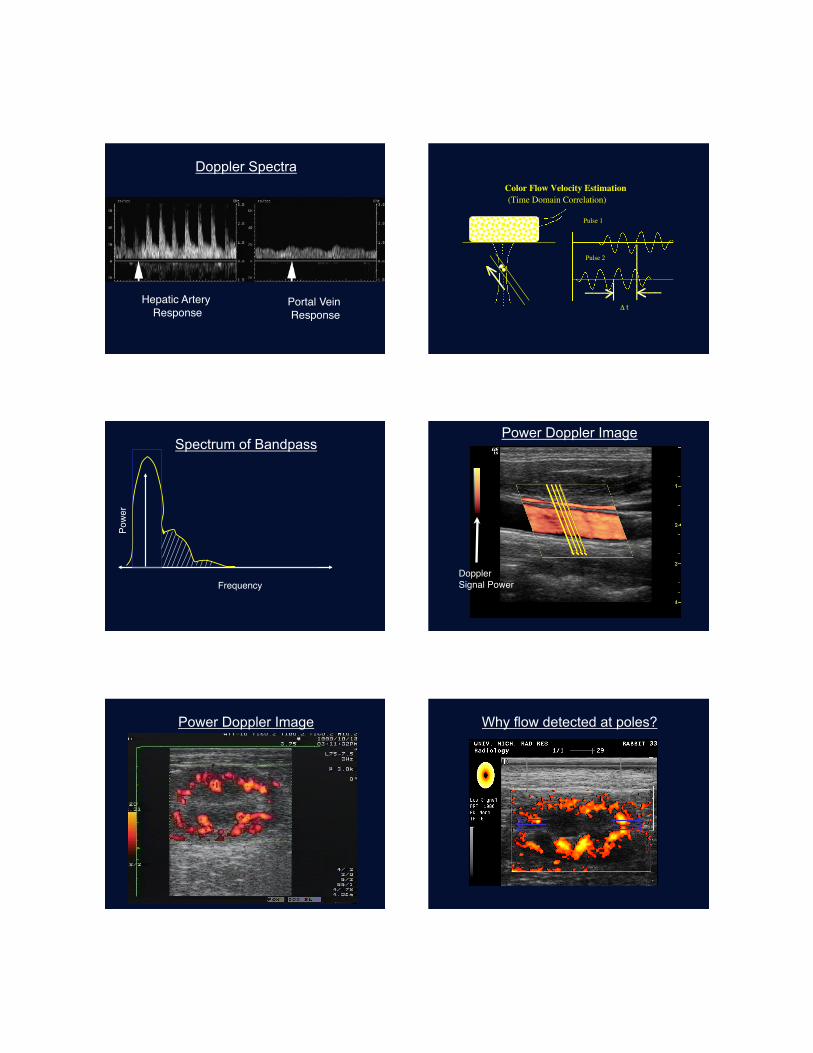
Doppler Spectra
Hepatic Artery Response"
Portal Vein Response"
Δ t
Pulse 1
Pulse 2
Color Flow Velocity Estimation (Time Domain Correlation)
Spectrum of Bandpass
Pow
er"
Frequency"
Power Doppler Image
Doppler"Signal Power"
Power Doppler Image Why flow detected at poles?
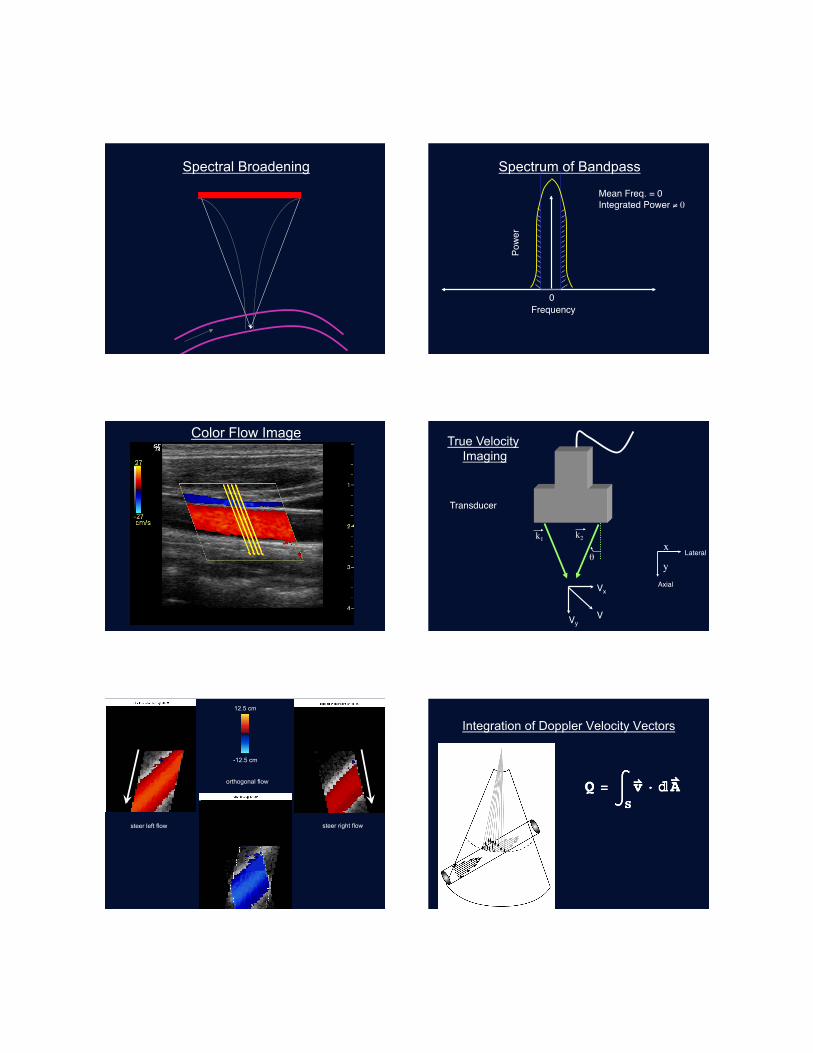
Spectral Broadening Spectrum of Bandpass
Pow
er"
Frequency"
Mean Freq. = 0"Integrated Power ≠ 0
0"
Color Flow Image
k1 k2
θ
Transducer
True Velocity Imaging
x
yAxial"
Lateral"
Vy"
Vx"
V"
orthogonal flow
steer left flow steer right flow
12.5 cm
-12.5 cm
Integration of Doppler Velocity Vectors
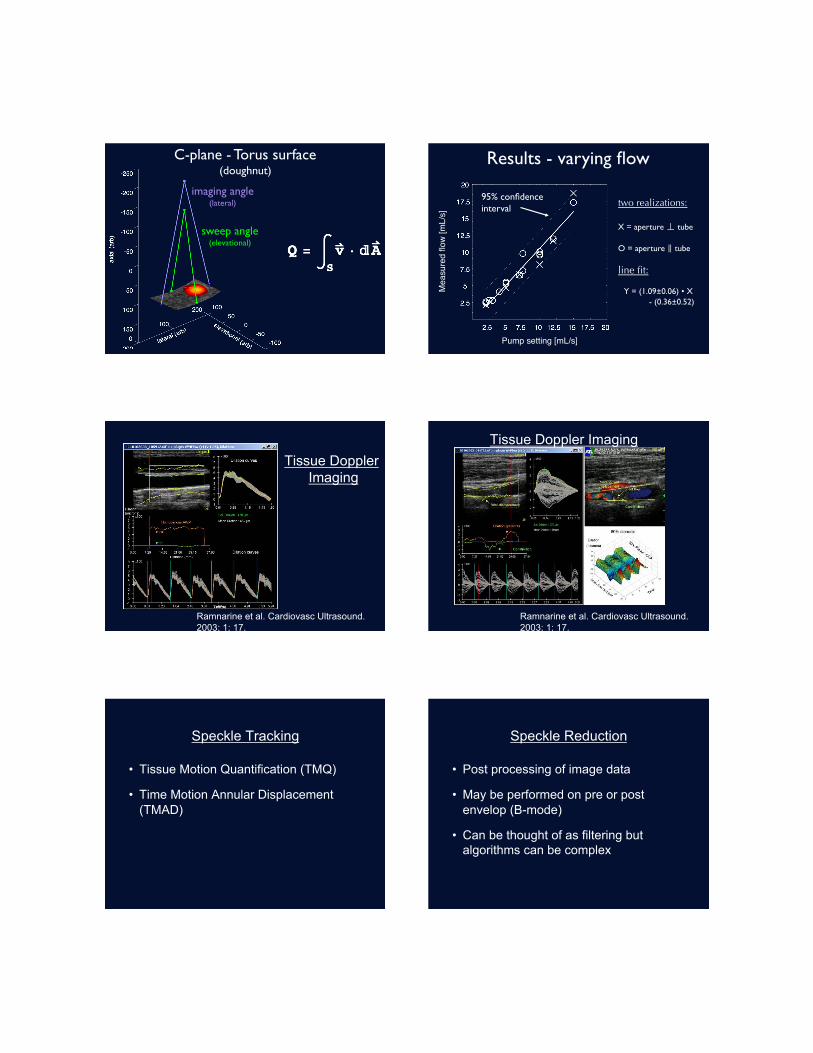
imaging angle (lateral)
sweep angle (elevational)
C-plane - Torus surface (doughnut)
Pump setting [mL/s]"
Mea
sure
d flo
w [m
L/s]"
95% confidence interval
two realizations:
X = aperture ⊥ tube
O = aperture ‖ tube
line fit:
Y = (1.09±0.06) • X - (0.36±0.52)
Results - varying flow
Ramnarine et al. Cardiovasc Ultrasound. 2003; 1: 17.
Tissue Doppler Imaging
Ramnarine et al. Cardiovasc Ultrasound. 2003; 1: 17.
Tissue Doppler Imaging
Speckle Tracking
• Tissue Motion Quantification (TMQ)
• Time Motion Annular Displacement (TMAD)
Speckle Reduction
• Post processing of image data
• May be performed on pre or post envelop (B-mode)
• Can be thought of as filtering but algorithms can be complex
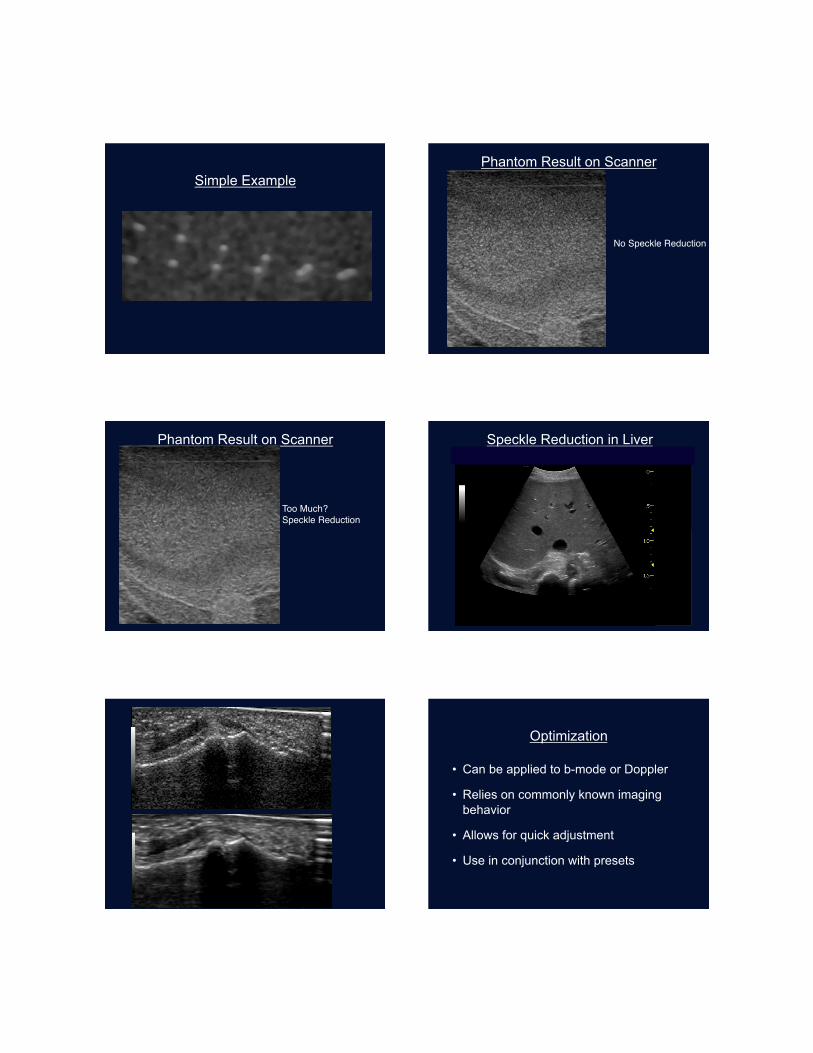
Simple Example Phantom Result on Scanner
No Speckle Reduction"
Phantom Result on Scanner
Too Much? "Speckle Reduction"
Speckle Reduction in Liver
Optimization
• Can be applied to b-mode or Doppler
• Relies on commonly known imaging behavior
• Allows for quick adjustment
• Use in conjunction with presets
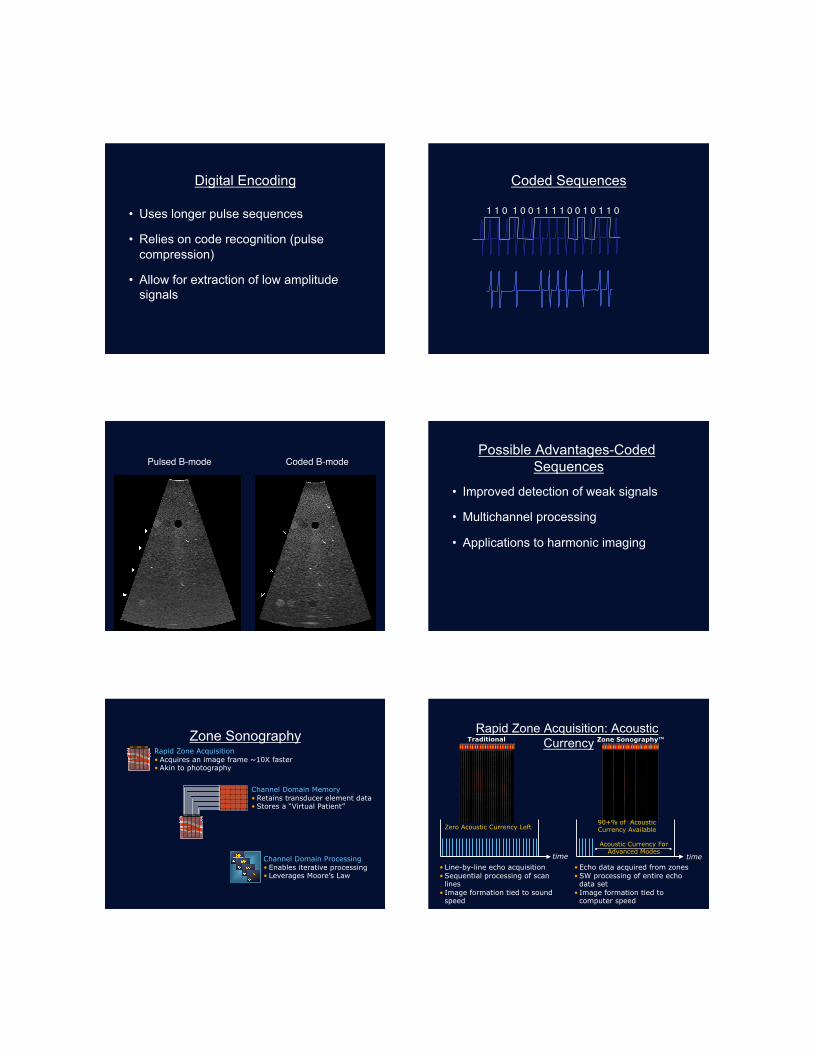
Digital Encoding
• Uses longer pulse sequences
• Relies on code recognition (pulse compression)
• Allow for extraction of low amplitude signals
Coded Sequences
1 1 0 1 0 0 1 1 1 1 0 0 1 0 1 1 0 "
Pulsed B-mode" Coded B-mode"Possible Advantages-Coded
Sequences
• Improved detection of weak signals
• Multichannel processing
• Applications to harmonic imaging
Zone Sonography Rapid Zone Acquisition • Acquires an image frame ~10X faster • Akin to photography
Channel Domain Memory • Retains transducer element data • Stores a “Virtual Patient”
Channel Domain Processing • Enables iterative processing • Leverages Moore’s Law
Rapid Zone Acquisition: Acoustic Currency
time time
Acoustic Currency For Advanced Modes
• Line-by-line echo acquisition • Sequential processing of scan
lines • Image formation tied to sound
speed
• Echo data acquired from zones • SW processing of entire echo
data set • Image formation tied to
computer speed
Zero Acoustic Currency Left 90+% of Acoustic Currency Available
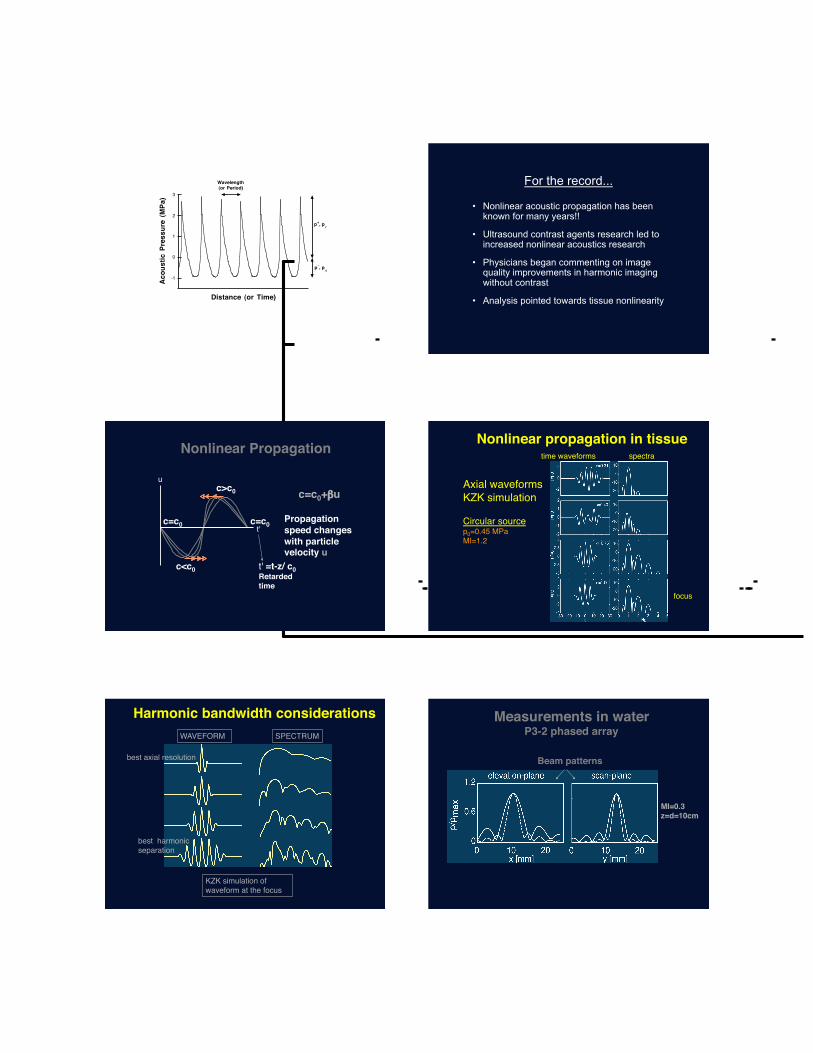
-1
0
1
2
3
Aco
ustic
Pre
ssur
e (M
Pa)
Distance (or Time)
Wavelength(or Period)
p+, pr
p–, pc
For the record...
• Nonlinear acoustic propagation has been known for many years!!
• Ultrasound contrast agents research led to increased nonlinear acoustics research
• Physicians began commenting on image quality improvements in harmonic imaging without contrast
• Analysis pointed towards tissue nonlinearity
t'"
u"
c=c0+βu!c>c0!
c<c0!
c=c0!c=c0! Propagation speed changes with particle velocity u!
t' =t-z/ c0!Retarded time!
Nonlinear Propagation!
Circular source"p0=0.45 MPa"MI=1.2"
Axial waveforms"KZK simulation"
Nonlinear propagation in tissue!
focus"
time waveforms" spectra"
Harmonic bandwidth considerations!
best axial resolution"
best harmonic separation"
WAVEFORM " SPECTRUM"
KZK simulation of waveform at the focus"
Measurements in water!P3-2 phased array!
MI=0.3!z=d=10cm!
Beam patterns!
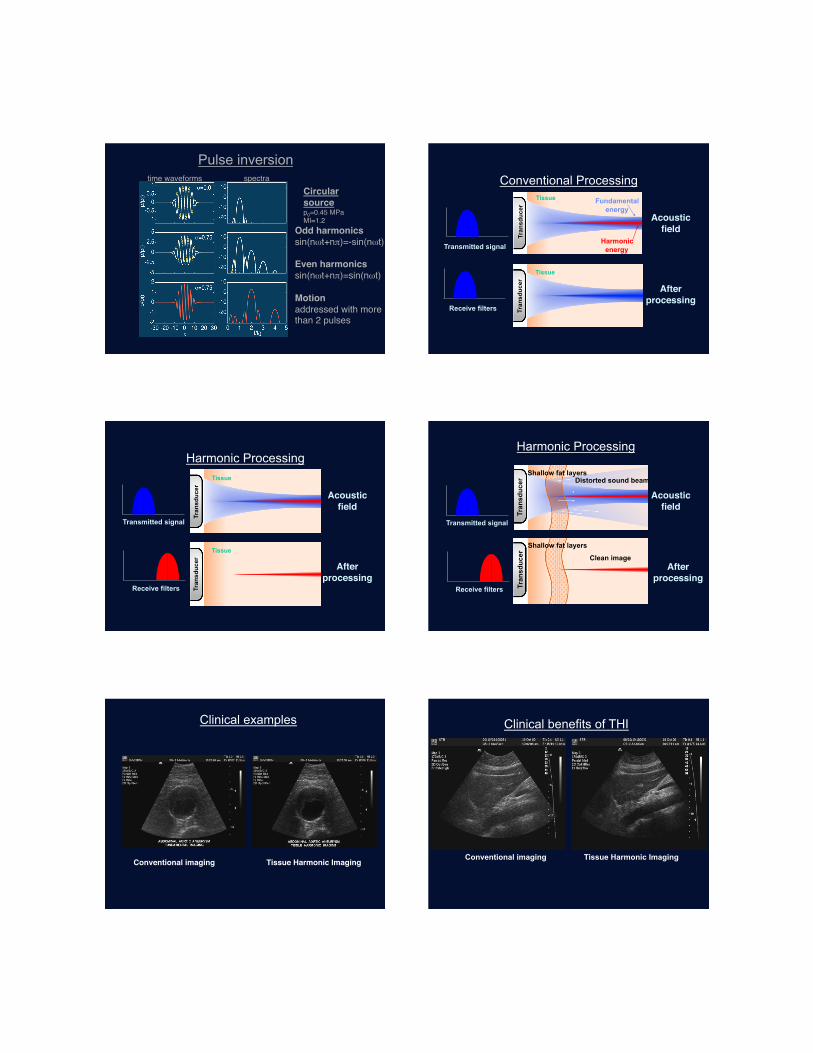
Pulse inversion
Circular source"p0=0.45 MPa"MI=1.2"
Odd harmonics"sin(nωt+nπ)=-sin(nωt)"
Even harmonics"sin(nωt+nπ)=sin(nωt)"
Motion!addressed with more than 2 pulses"
time waveforms" spectra" Conventional Processing
Acoustic!field!
After!processing!
Receive filters
Tran
sduc
er
Tissue
Tran
sduc
er
Tissue
Transmitted signal
Fundamental energy
Harmonic energy
Harmonic Processing
Acoustic!field!
After!processing!
Receive filters
Tran
sduc
er
Tissue
Tran
sduc
er
Tissue
Transmitted signal
After!processing!
Harmonic Processing
Acoustic!field!
Tran
sduc
er Shallow fat layers
Tran
sduc
er Shallow fat layers
Clean image
Distorted sound beam
Receive filters
Transmitted signal
Conventional imaging! Tissue Harmonic Imaging!
Clinical examples
Conventional imaging Tissue Harmonic Imaging
Clinical benefits of THI
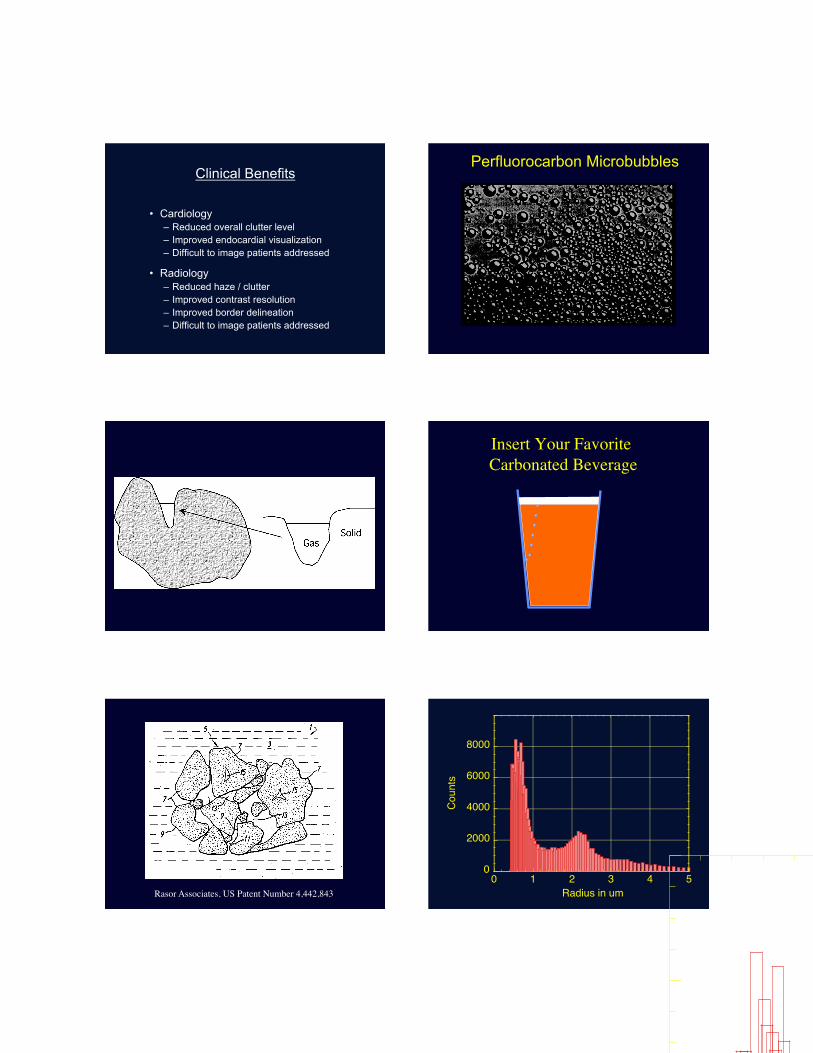
Clinical Benefits
• Cardiology – Reduced overall clutter level – Improved endocardial visualization – Difficult to image patients addressed
• Radiology – Reduced haze / clutter – Improved contrast resolution – Improved border delineation – Difficult to image patients addressed
Perfluorocarbon Microbubbles
Insert Your Favorite Carbonated Beverage
Rasor Associates, US Patent Number 4,442,843
0
2000
4000
6000
8000
0 1 2 3 4 5
Cou
nts
Radius in um
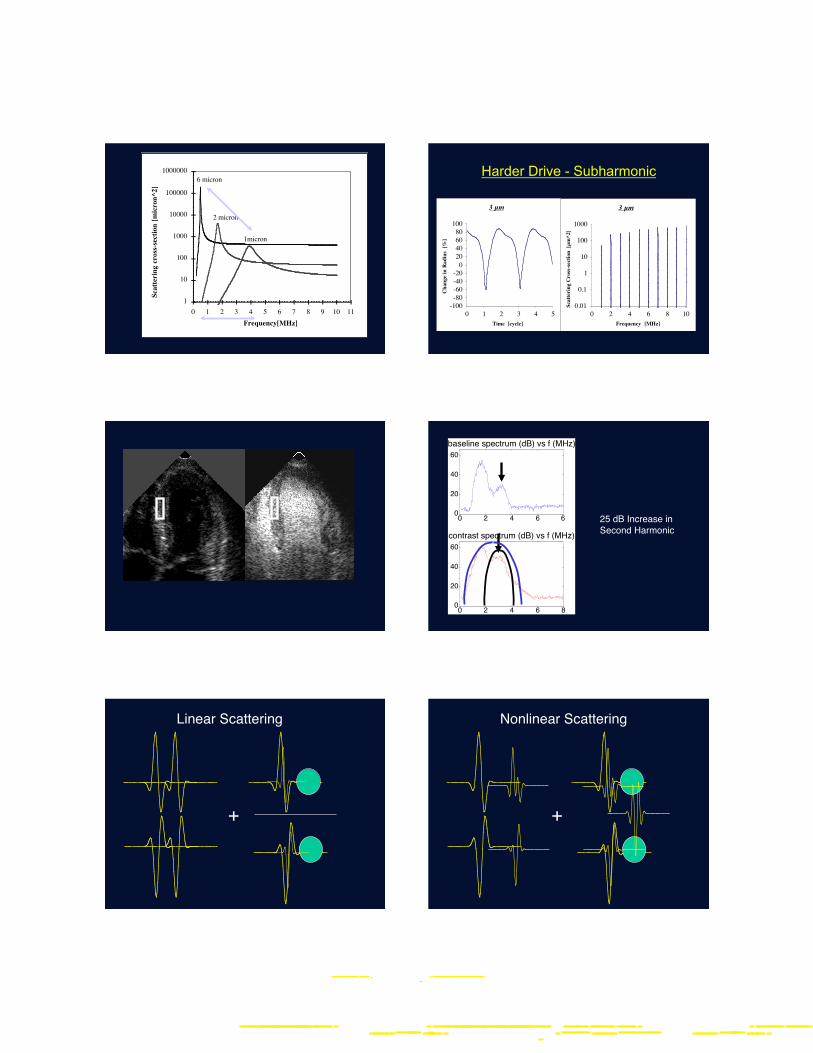
Frequency[MHz]
Scat
teri
ng c
ross
-sec
tion
[mic
ron^
2]
1
10
100
1000
10000
100000
1000000
0 1 2 3 4 5 6 7 8 9 10 11
6 micron
2 micron
1micron
Harder Drive - Subharmonic
3 µm
-100-80-60-40-20020406080100
0 1 2 3 4 5Time [cycle]
Cha
nge
in R
adiu
s [%
]
3 µm
0.01
0.1
1
10
100
1000
0 2 4 6 8 10Frequency [MHz]
Scat
teri
ng C
ross
-sec
tion
[µm
^2]
20 4 6 60
20
40
60baseline spectrum (dB) vs f (MHz)
20 4 6 80
20
40
60contrast spectrum (dB) vs f (MHz)
25 dB Increase in"Second Harmonic"
+"
Linear Scattering"
+"
Nonlinear Scattering"
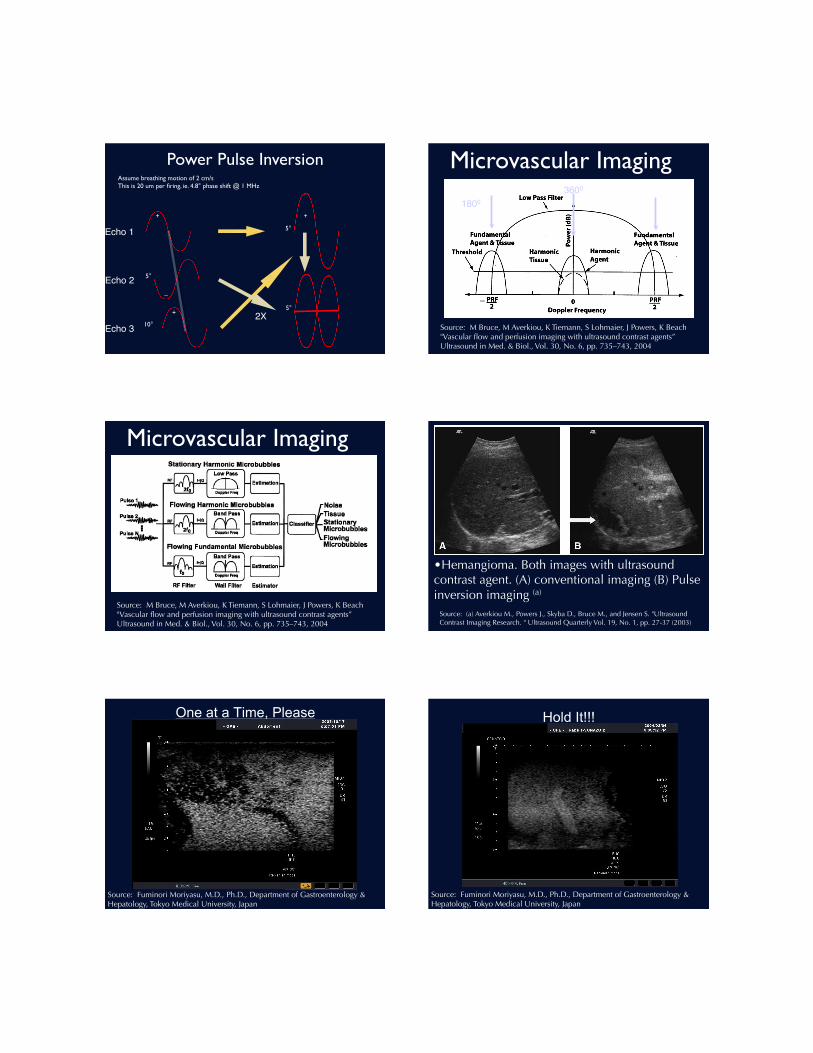
Power Pulse Inversion Assume breathing motion of 2 cm/s This is 20 um per firing, ie. 4.8° phase shift @ 1 MHz
5°
10°
_
+
+
+
5°
5°
Echo 1"
Echo 2"
Echo 3"2X"
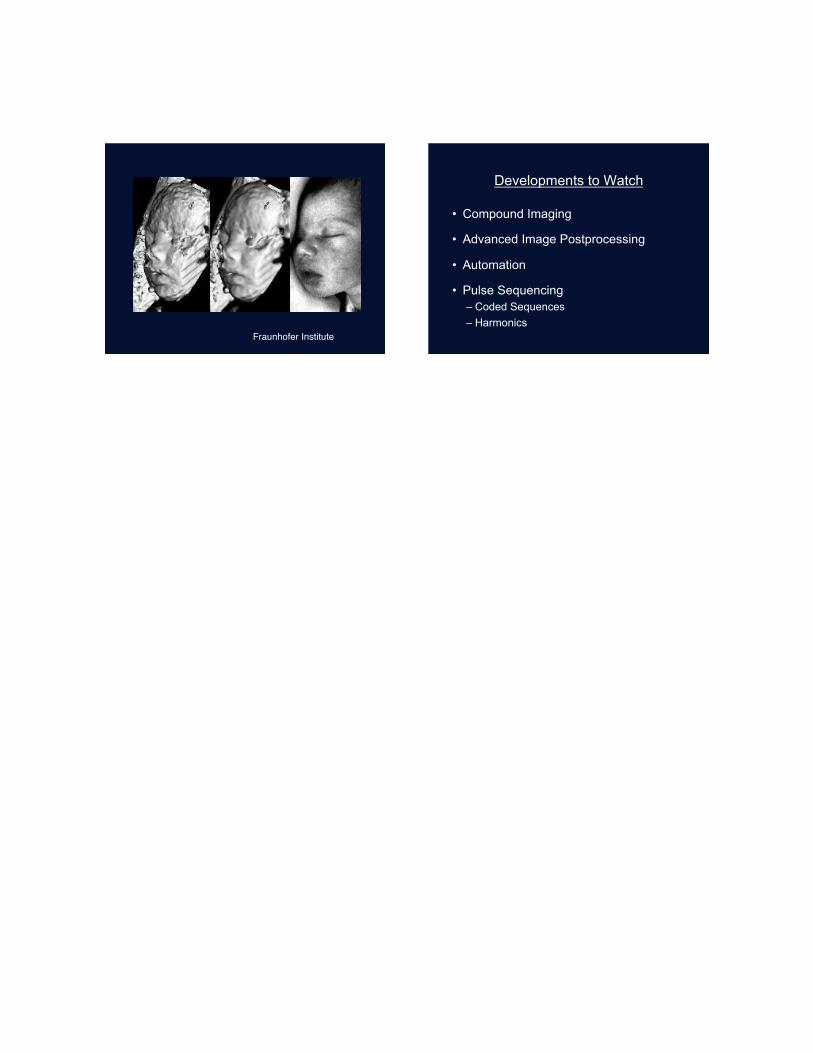
Microvascular Imaging
Source: M Bruce, M Averkiou, K Tiemann, S Lohmaier, J Powers, K Beach "Vascular flow and perfusion imaging with ultrasound contrast agents” Ultrasound in Med. & Biol., Vol. 30, No. 6, pp. 735–743, 2004
1800"3600"
Microvascular Imaging
Source: M Bruce, M Averkiou, K Tiemann, S Lohmaier, J Powers, K Beach "Vascular flow and perfusion imaging with ultrasound contrast agents” Ultrasound in Med. & Biol., Vol. 30, No. 6, pp. 735–743, 2004
• Hemangioma. Both images with ultrasound contrast agent. (A) conventional imaging (B) Pulse inversion imaging (a)
Source: (a) Averkiou M., Powers J., Skyba D., Bruce M., and Jensen S. "Ultrasound Contrast Imaging Research. " Ultrasound Quarterly Vol. 19, No. 1, pp. 27-37 (2003)
One at a Time, Please
Source: Fuminori Moriyasu, M.D., Ph.D., Department of Gastroenterology & Hepatology, Tokyo Medical University, Japan"
Hold It!!!
Source: Fuminori Moriyasu, M.D., Ph.D., Department of Gastroenterology & Hepatology, Tokyo Medical University, Japan"
Fraunhofer Institute"
Developments to Watch
• Compound Imaging
• Advanced Image Postprocessing
• Automation
• Pulse Sequencing – Coded Sequences – Harmonics


![Ultrasound Imaging Physics(Basic Principles)[1]](https://static.fdocument.org/doc/165x107/5526da784a795911118b458d/ultrasound-imaging-physicsbasic-principles1.jpg)