ECE 420 Lecture 3 Feb 4 2019 - University of Illinois ...
27
ECE 420 Lecture 3 Feb 4 2019
Transcript of ECE 420 Lecture 3 Feb 4 2019 - University of Illinois ...

ECE 420
Lecture 3
Feb 4 2019

Or
1
Everything you wanted to know about
Glottal Waveforms and Laryngeal Excitation
Cycles but were afraid to ask
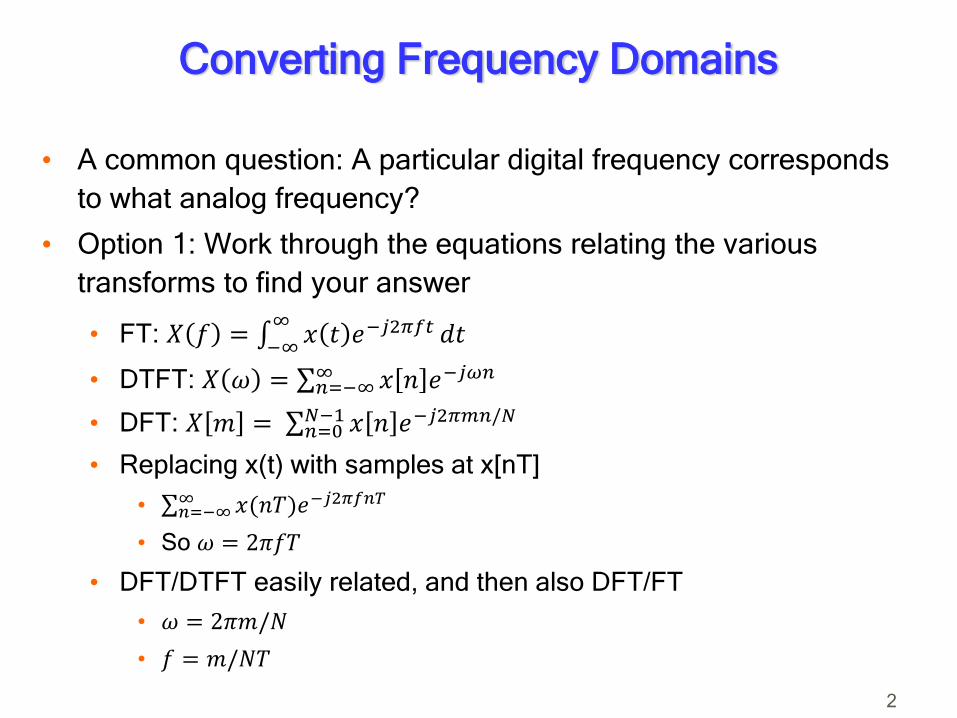
Converting Frequency Domains
• A common question: A particular digital frequency corresponds
to what analog frequency?
• Option 1: Work through the equations relating the various
transforms to find your answer
• FT: 𝑋 𝑓 = ∞−∞
𝑥 𝑡 𝑒−𝑗2𝜋𝑓𝑡 𝑑𝑡
• DTFT: 𝑋 𝜔 = σ𝑛=−∞∞ 𝑥 𝑛 𝑒−𝑗𝜔𝑛
• DFT: 𝑋 𝑚 = σ𝑛=0𝑁−1 𝑥 𝑛 𝑒−𝑗2𝜋𝑚𝑛/𝑁
• Replacing x(t) with samples at x[nT]
• σ𝑛=−∞∞ 𝑥(𝑛𝑇)𝑒−𝑗2𝜋𝑓𝑛𝑇
• So 𝜔 = 2𝜋𝑓𝑇
• DFT/DTFT easily related, and then also DFT/FT
• 𝜔 = 2𝜋𝑚/𝑁
• 𝑓 = 𝑚/𝑁𝑇
2
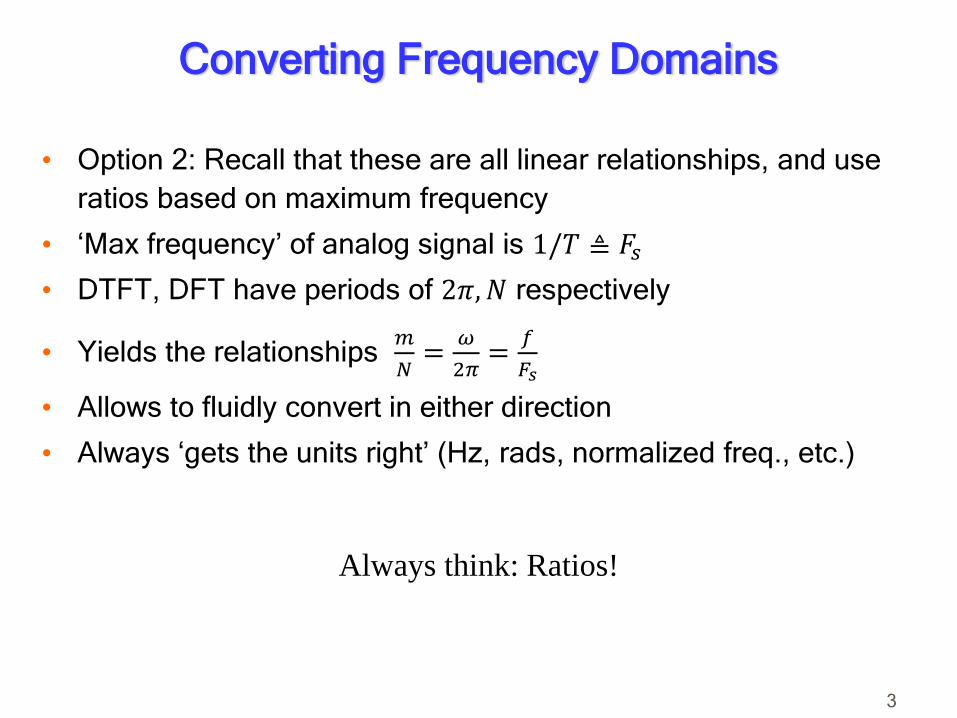
Converting Frequency Domains
• Option 2: Recall that these are all linear relationships, and use
ratios based on maximum frequency
• ‘Max frequency’ of analog signal is 1/𝑇 ≜ 𝐹𝑠
• DTFT, DFT have periods of 2𝜋,𝑁 respectively
• Yields the relationships 𝑚
𝑁=
𝜔
2𝜋=
𝑓
𝐹𝑠
• Allows to fluidly convert in either direction
• Always ‘gets the units right’ (Hz, rads, normalized freq., etc.)
3
Always think: Ratios!
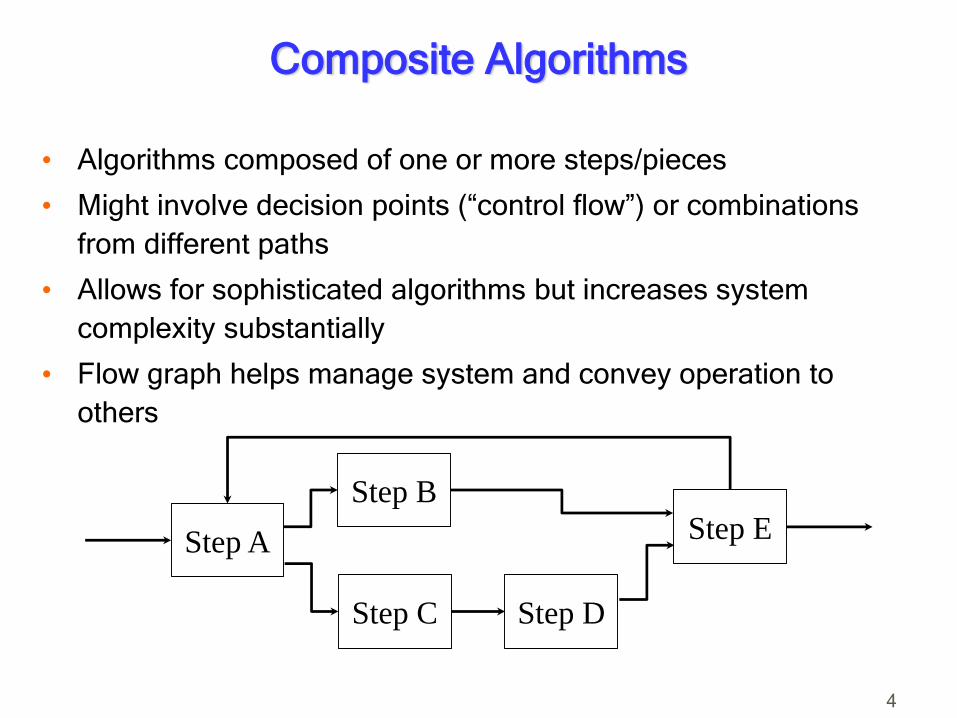
Composite Algorithms
• Algorithms composed of one or more steps/pieces
• Might involve decision points (“control flow”) or combinations
from different paths
• Allows for sophisticated algorithms but increases system
complexity substantially
• Flow graph helps manage system and convey operation to
others
4
Step A
Step B
Step C Step D
Step E

Implementing Composite Algorithms
• Always implement components as separate functions/classes
• Sometimes these will be in different libraries anyway
• Separation of concerns allows for better focus to the code,
generally resulting in better coding style and code that is much
easier to debug
• Creates code segments that can be portable among projects
and not tied to a specific implementation
5
A Note on Testing
• Good practice to validate components of your code first
• Writing each step as separate functions facilitates for good unit
testing
• Increases probability of success when putting everything together
• Types of testing
• Unit
• Integration
• System/End-to-End
• These testing categories get cover progressively larger aspects
of the system, but at higher cost
6
Unit Testing is your friend!

A Note on Testing
• How do you know if something is working?
• Test signals!
• What test signals do you use?
• They might be provided for you
• You can make them up
• You can use a repository of test data
• You can acquire them
• Classes of test data
• ‘Easy’ vs. ‘Hard’
• ‘Noisy’ vs. ‘Clean’
• Different noise characteristics
• Corner cases
7

A Note on Testing
• A key is to have ‘high quality’ data to establish ‘ground truth’
• Nothing is worse than getting misled about algorithm performance
due to incorrect data
• Allows for quantitative measures of performance if sufficiently large
set available
• Simple and clean data can facilitate establishing basic algorithm
functionality
• Always a good idea to at least try with a non-ideal test signal as
a sanity check
• Some algorithms can catastrophically break down when certain
assumptions are not met or noise is introduced!
8
Test Database / Benchmarks
• Huge value!
• Provides a suite of test cases
• Ground truth for evaluation of algorithm efficacy
• Common set to allows for apples-to-apples comparison among
algorithms
• ‘Real world’ conditions
• Facilitates automatic tuning and evaluation of algorithms
• Prevalent in many areas of engineering
9

Pitch Detection
• This lab is a pitch detection implementation
• What exactly is pitch? Not actually strictly defined.
• Period of signal in time domain
• Fundamental frequency in spectral domain (caution!)
• Perceived frequency of signal by human ear
• Anatomically as distance between pulses/cycles of larynx
10
T

Basic Pitch Detection Algorithm
• Operate on a single frame of audio input
• Initial decision: voiced or unvoiced?
• If voiced, perform pitch analysis and report pitch frequency
11
Voiced
Decision
Pitch
AnalysisF0
“No Signal”
Y
N
Frame

Challenges of Pitch Detection
• Frame size selection
• Likely not an integer multiple of period length
• Probably need at least one period, maybe more
• Larger frame sizes = more latency
• Pitch values may not be integral values of sampling rate /
frequency bins
• May distort analysis sufficiently to pick improper bin
• Speech vs. Music
• Non-ideal environmental situation
• Multiple concurrent signals
• Noise
• Bad microphone quality
12

Categorization of Frames
• Three coarse categorization of frames
• Voiced sounds – generated by vibration of the vocal cords
• Unvoiced sounds – speech generated without vibration of the
vocal cords
• Silence / noise – no active speech
• We will only be concerned with classifying and measuring pitch
for Voiced frames
13

Voiced Decision
• Voiced signals tend to be louder and more sustained
• Unvoiced signals have more abrupt characteristics
• Over the span of a frame, we would therefore expect voiced
signals to have a higher energy than unvoiced/silent frames
• Calculate the energy of the frame, compare to a threshold for
voiced decision
14
σ𝑥 𝑛 2Y
N
Frame > Es Voiced
Not Voiced

Pitch Calculation - Autocorrelation
• 𝑅𝑥𝑥 𝑙 =σ𝑛=0𝑁−1 𝑥 𝑛 𝑥[𝑛−𝑙]
σ𝑛=0𝑁−1 𝑥 𝑛 2
• Provides an estimate of how self-similar a signal is given a
particular delay (lag) 𝑙
• When offset corresponds to period of signal, values coherently
combine to yield a large correlation value
15

Challenges of Harmonics
• Pitch estimation searches for a peak value in the autocorrelation
function
• Two main challenges
• Lag of 0 will generally have the largest overall value, but is certainly
not the value we are looking for
• Multiples of the pitch (higher order harmonics) will also yield local
peaks but must be rejected
• Solving these challenges is part of the Lab design objectives
16

Basic Pitch Detection Algorithm
17
Voiced
Decision
Autocorrelation
Frame
Peak Detection
Estimated
Pitch
Not
Voiced
Algorithmic Complexity
• “Big O” notation
• 𝑂 𝑁 , 𝑂 𝑁2 , 𝑂 log𝑁 , 𝑂 1 , 𝑂(2𝑁)
• Key property of complexity analysis is that the higher order term
dominates
• 𝑂 𝑁 + 𝑁2 = 𝑂(𝑁2)
• Always a good idea to know the complexity of the algorithms you
are using
• Know what you are getting yourself into!
• For a complicated composite algorithm, each step might have
different complexity
• Knowing complexity tells you where the dominant computation step
• Optimize there!
18
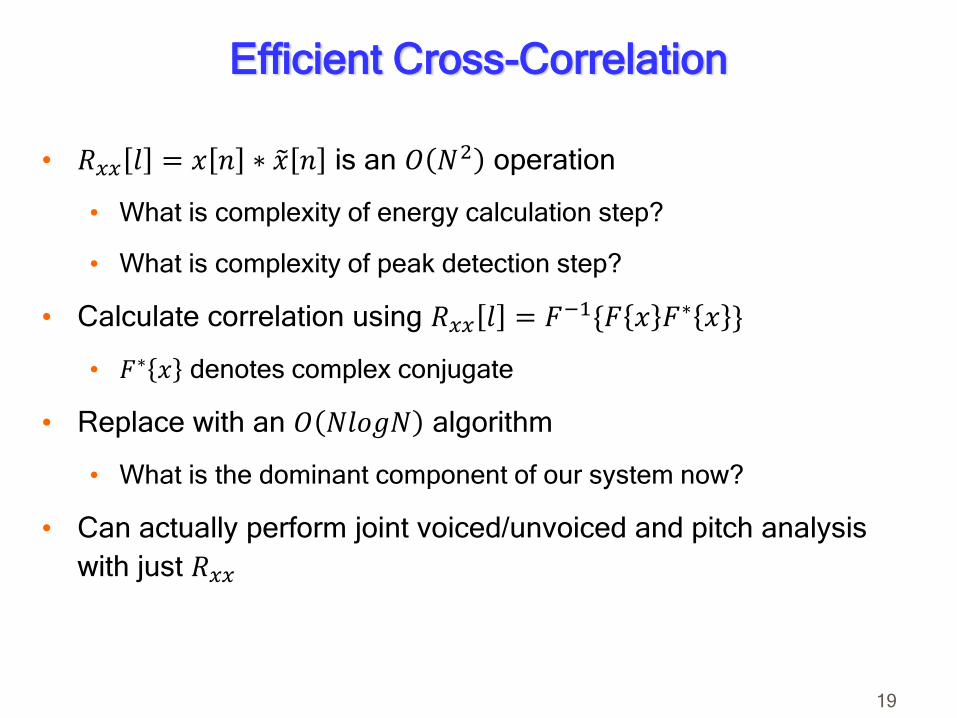
Efficient Cross-Correlation
• 𝑅𝑥𝑥 𝑙 = 𝑥 𝑛 ∗ 𝑥 𝑛 is an 𝑂 𝑁2 operation
• What is complexity of energy calculation step?
• What is complexity of peak detection step?
• Calculate correlation using 𝑅𝑥𝑥 𝑙 = 𝐹−1{𝐹 𝑥 𝐹∗ 𝑥 }
• 𝐹∗ 𝑥 denotes complex conjugate
• Replace with an 𝑂 𝑁𝑙𝑜𝑔𝑁 algorithm
• What is the dominant component of our system now?
• Can actually perform joint voiced/unvoiced and pitch analysis
with just 𝑅𝑥𝑥
19
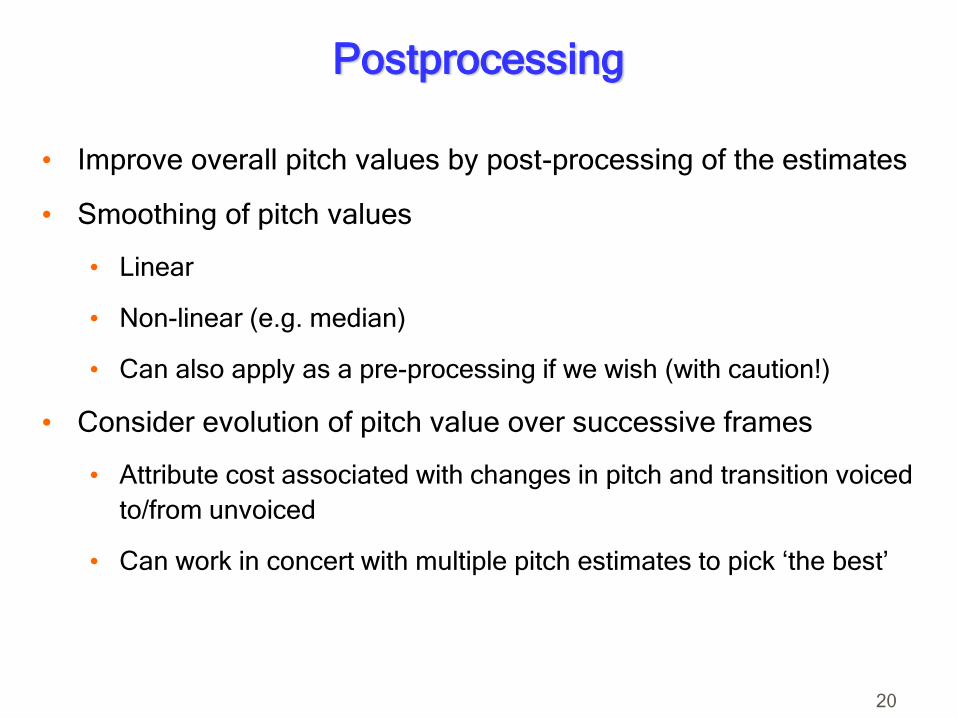
Postprocessing
• Improve overall pitch values by post-processing of the estimates
• Smoothing of pitch values
• Linear
• Non-linear (e.g. median)
• Can also apply as a pre-processing if we wish (with caution!)
• Consider evolution of pitch value over successive frames
• Attribute cost associated with changes in pitch and transition voiced
to/from unvoiced
• Can work in concert with multiple pitch estimates to pick ‘the best’
20

Categories of Pitch Analysis (subset)
21

Algorithm Selection
• Dozens of pitch detection algorithms out there
• How do you pick one? (Or decide to develop your own?)
• What is your problem domain?
• Are the algorithms targeted at this domain?
• Is it possible to quantify performance and compare?
• Training/test data
• Different aspects to compare: measurement accuracy,
computational speed, output latency
• What are your requirements?
• What is most important? What compromises can be made?
• Can an algorithm be modified to meet those requirements?
• The more specific you are, the more discriminating you can be
regarding algorithm selection
22
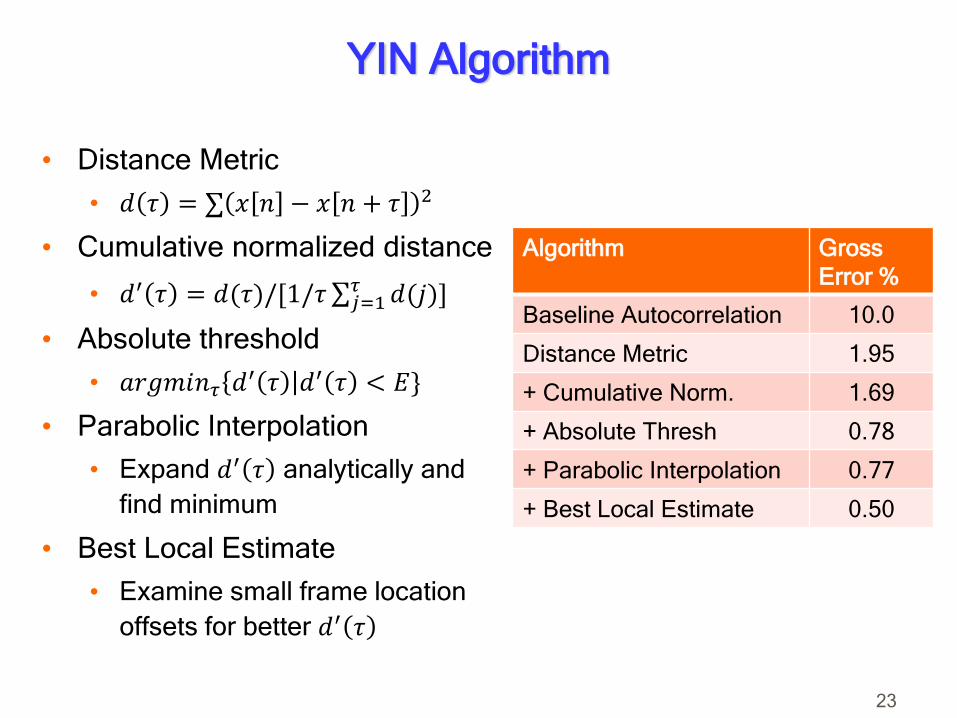
YIN Algorithm
• Distance Metric
• 𝑑 𝜏 = σ 𝑥 𝑛 − 𝑥 𝑛 + 𝜏 2
• Cumulative normalized distance
• 𝑑′ 𝜏 = 𝑑(𝜏)/[1/𝜏 σ𝑗=1𝜏 𝑑(𝑗)]
• Absolute threshold
• 𝑎𝑟𝑔𝑚𝑖𝑛𝜏 𝑑′ 𝜏 𝑑′ 𝜏 < 𝐸}
• Parabolic Interpolation
• Expand 𝑑′ 𝜏 analytically and
find minimum
• Best Local Estimate
• Examine small frame location
offsets for better 𝑑′ 𝜏
23
Algorithm Gross
Error %
Baseline Autocorrelation 10.0
Distance Metric 1.95
+ Cumulative Norm. 1.69
+ Absolute Thresh 0.78
+ Parabolic Interpolation 0.77
+ Best Local Estimate 0.50
‘Ad-hoc’ Algorithm Development
• Identify weak points / scenarios in the algorithm
• Large set of training data is helpful
• Augment the algorithm
• Change existing parameters / steps
• Add extra steps
• Validate the changes
• Did performance improve in the desired areas?
• Did good performance persist in other areas (no regressions)?
• Emergent complex system
• Potentially very powerful
• Potentially very hard to analyze
• Potentially very hard to maintain
24
Assigned Lab
• Lead-in to the Final Project
• Forming up groups for both Assigned Lab and Final Project
• Explore a DSP algorithm from the literature
• Implementation in Python for this stage, NOT on tablet yet
• Proposal for Assigned Lab
• Overview of proposed algorithm, cite source(s)
• Plan for testing and validation
• Rough idea(s) for Final Project application
• Due March 1
• Assigned Lab Report upon completion, demo incorporated into
Final Proposal design review
25
This week
• Lab 3: Real time spectral analyzer Quiz/Demo
• Lab 4: Pitch Analyzer
• Be thinking about Assigned Project Labs / Groups
• Early vetting of ideas is fine!
26