
Earth and Planetary Science Lettersshadow.eas.gatech.edu/~kcobb/pubs/moerman13.pdf · Here we...
12
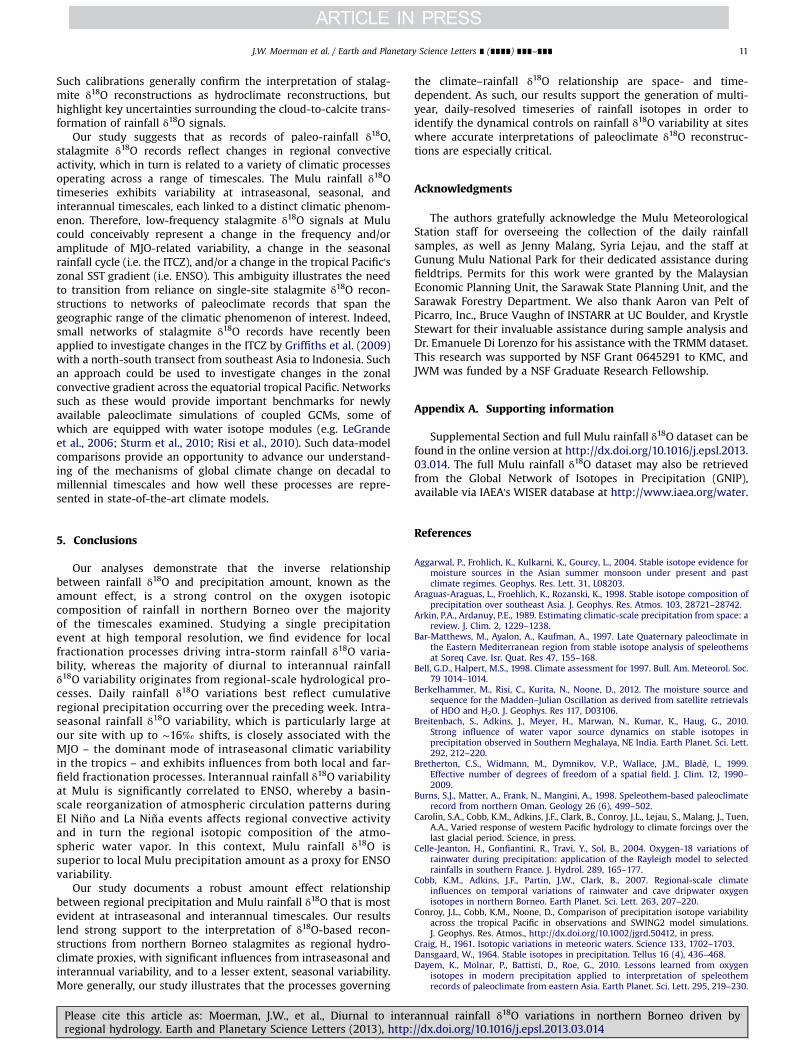
Diurnal to interannual rainfall δ 18 O variations in northern Borneo driven by regional hydrology Jessica W. Moerman a,n , Kim M. Cobb a , Jess F. Adkins b , Harald Sodemann c , Brian Clark d , Andrew A. Tuen e a School of Earth and Atmospheric Sciences, Georgia Institute of Technology, 311 Ferst Drive, Atlanta, GA 30332, United States b Division of Geological and Planetary Sciences, California Institute of Technology,1200 E. California Blvd., Pasadena, CA 91125, United States c Institute for Atmospheric and Climate Science, ETH Zürich, Universitätstrasse 16, 8092 Zürich, Switzerland d Gunung Mulu National Park, Sarawak, Malaysia e Institute of Biodiversity and Environmental Conservation, Universiti Malaysia Sarawak, 94300 Kota Samarahan, Malaysia article info Article history: Received 4 October 2012 Received in revised form 11 March 2013 Accepted 13 March 2013 Editor: G. Henderson Keywords: rainfall oxygen isotopes Madden–Julian oscillation amount effect stalagmite paleoclimate El Niño southern oscillation abstract The relationship between climate variability and rainfall oxygen isotopic (δ 18 O) variability is poorly constrained, especially in the tropics, where many key paleoclimate records rely on past rainfall isotopes as proxies for hydroclimate. Here we present a daily-resolved, 5-yr-long timeseries of rainfall δ 18 O from Gunung Mulu National Park, located in northern Borneo (41N, 1141E) in the heart of the West Pacific Warm Pool, and compare it to local and regional climatic variables. Daily rainfall δ 18 O values range from þ0.7‰ to -18.5‰ and exhibit a weak but significant inverse relationship with daily local precipitation amount (R ¼-0.19, p o0.05), consistent with the tropical amount effect. Day-to-day δ 18 O variability at Mulu is best correlated to regional precipitation amount averaged over the preceding week (R ¼-0.64, p o0.01). The inverse relationship between Mulu rainfall δ 18 O and local (regional) precipitation amount increases with increased temporal averaging, reaching R ¼-0.56 (R ¼-0.72) on monthly timescales. Large, negative, multi-day rainfall δ 18 O anomalies of up to 16‰ occur every 30–90 days and are closely associated with wet phases of the intraseasonal Madden–Julian Oscillation. A weak, semi-annual seasonal cycle in rainfall δ 18 O of 2–3‰ bears little resemblance to seasonal precipitation variability, pointing to a complex sequence of moisture sources and/or trajectories over the course of the year. Interannual rainfall δ 18 O variations of 6–8‰ are significantly correlated with indices of the El Niño Southern Oscillation, with increased rainfall δ 18 O during relatively dry El Niño conditions, and vice versa during La Nina events. We find that Mulu rainfall δ 18 O outperforms Mulu precipitation amount as a tracer of basin-scale climate variability, highlighting the time- and space-integrative nature of rainfall δ 18 O. Taken together, our results suggest that rainfall δ 18 O variability at Mulu is significantly influenced by the strength of regional convective activity. As such, our study provides further empirical support for the interpretation of δ 18 O-based paleo-reconstructions from northern Borneo stalagmites as robust indica- tors of regional-scale hydroclimate variability, where higher δ 18 O reflects regional drying. & 2013 Elsevier B.V. All rights reserved. 1. Introduction The inverse relationship between tropical precipitation amount and rainfall isotopic values, known as the ‘amount effect’ (Dansgaard, 1964; Rozanski et al., 1993; Araguas-Araguas et al., 1998), has provided the basis for numerous reconstructions of tropical paleohydrology from lake deposits (e.g. Sachs et al., 2009; Tierney et al., 2010), alpine ice cores (e.g. Hoffmann et al., 2003; Vimeux et al., 2009) and stalagmite calcite (e.g. Bar-Matthews et al., 1997; Burns et al., 1998; Wang et al., 2001). Such reconstruc- tions play a key role in resolving past tropical climate changes, as continuous, high-resolution paleoclimate archives are relatively rare in the tropics. Stalagmite δ 18 O records, in particular, have been used to probe hydroclimate variability over the last hundred years (Treble et al., 2005; Frappier et al., 2007), the last glacial cycle (Dykoski et al., 2005; Partin et al., 2007; Griffiths et al., 2009), and the last million years (Wang et al., 2001; Meckler et al., 2012). Despite robust observations of the amount effect across tropical latitudes, the climatic controls on rainfall δ 18 O at any given site remain highly uncertain as numerous processes contribute to rainfall δ 18 O variability. Rayleigh distillation, whereby cumulative fractionation during condensation and rainout leaves the residual Contents lists available at SciVerse ScienceDirect journal homepage: www.elsevier.com/locate/epsl Earth and Planetary Science Letters 0012-821X/$ - see front matter & 2013 Elsevier B.V. All rights reserved. http://dx.doi.org/10.1016/j.epsl.2013.03.014 n Corresponding author. Tel.: þ1 404 894 3893; fax: þ1 404 894 5638. E-mail addresses: [email protected] (J.W. Moerman), [email protected] (K.M. Cobb), [email protected] (J.F. Adkins), [email protected] (H. Sodemann), [email protected] (B. Clark), [email protected] (A.A. Tuen). Please cite this article as: Moerman, J.W., et al., Diurnal to interannual rainfall δ 18 O variations in northern Borneo driven by regional hydrology. Earth and Planetary Science Letters (2013), http://dx.doi.org/10.1016/j.epsl.2013.03.014i Earth and Planetary Science Letters ∎ (∎∎∎∎) ∎∎∎–∎∎∎
Transcript of Earth and Planetary Science Lettersshadow.eas.gatech.edu/~kcobb/pubs/moerman13.pdf · Here we...

Diurnal to interannual rainfall !18O variations in northern Borneo drivenby regional hydrology
Jessica W. Moerman a,n, Kim M. Cobb a, Jess F. Adkins b, Harald Sodemann c, Brian Clark d,Andrew A. Tuen e
a School of Earth and Atmospheric Sciences, Georgia Institute of Technology, 311 Ferst Drive, Atlanta, GA 30332, United Statesb Division of Geological and Planetary Sciences, California Institute of Technology, 1200 E. California Blvd., Pasadena, CA 91125, United Statesc Institute for Atmospheric and Climate Science, ETH Zürich, Universitätstrasse 16, 8092 Zürich, Switzerlandd Gunung Mulu National Park, Sarawak, Malaysiae Institute of Biodiversity and Environmental Conservation, Universiti Malaysia Sarawak, 94300 Kota Samarahan, Malaysia
a r t i c l e i n f o
Article history:Received 4 October 2012Received in revised form11 March 2013Accepted 13 March 2013Editor: G. Henderson
Keywords:rainfall oxygen isotopesMadden–Julian oscillationamount effectstalagmitepaleoclimateEl Niño southern oscillation
a b s t r a c t
The relationship between climate variability and rainfall oxygen isotopic (!18O) variability is poorlyconstrained, especially in the tropics, where many key paleoclimate records rely on past rainfall isotopesas proxies for hydroclimate. Here we present a daily-resolved, 5-yr-long timeseries of rainfall !18O fromGunung Mulu National Park, located in northern Borneo (41N, 1141E) in the heart of the West PacificWarm Pool, and compare it to local and regional climatic variables. Daily rainfall !18O values range from!0.7‰ to −18.5‰ and exhibit a weak but significant inverse relationship with daily local precipitationamount (R"−0.19, po0.05), consistent with the tropical amount effect. Day-to-day !18O variability atMulu is best correlated to regional precipitation amount averaged over the preceding week (R"−0.64,po0.01). The inverse relationship between Mulu rainfall !18O and local (regional) precipitation amountincreases with increased temporal averaging, reaching R"−0.56 (R"−0.72) on monthly timescales.Large, negative, multi-day rainfall !18O anomalies of up to 16‰ occur every 30–90 days and are closelyassociated with wet phases of the intraseasonal Madden–Julian Oscillation. A weak, semi-annualseasonal cycle in rainfall !18O of 2–3‰ bears little resemblance to seasonal precipitation variability,pointing to a complex sequence of moisture sources and/or trajectories over the course of the year.Interannual rainfall !18O variations of 6–8‰ are significantly correlated with indices of the El NiñoSouthern Oscillation, with increased rainfall !18O during relatively dry El Niño conditions, and vice versaduring La Nina events. We find that Mulu rainfall !18O outperforms Mulu precipitation amount as a tracerof basin-scale climate variability, highlighting the time- and space-integrative nature of rainfall !18O.Taken together, our results suggest that rainfall !18O variability at Mulu is significantly influenced by thestrength of regional convective activity. As such, our study provides further empirical support for theinterpretation of !18O-based paleo-reconstructions from northern Borneo stalagmites as robust indica-tors of regional-scale hydroclimate variability, where higher !18O reflects regional drying.
& 2013 Elsevier B.V. All rights reserved.
1. Introduction
The inverse relationship between tropical precipitation amountand rainfall isotopic values, known as the ‘amount effect’(Dansgaard, 1964; Rozanski et al., 1993; Araguas-Araguas et al.,1998), has provided the basis for numerous reconstructions oftropical paleohydrology from lake deposits (e.g. Sachs et al., 2009;Tierney et al., 2010), alpine ice cores (e.g. Hoffmann et al., 2003;
Vimeux et al., 2009) and stalagmite calcite (e.g. Bar-Matthewset al., 1997; Burns et al., 1998; Wang et al., 2001). Such reconstruc-tions play a key role in resolving past tropical climate changes, ascontinuous, high-resolution paleoclimate archives are relativelyrare in the tropics. Stalagmite !18O records, in particular, have beenused to probe hydroclimate variability over the last hundred years(Treble et al., 2005; Frappier et al., 2007), the last glacial cycle(Dykoski et al., 2005; Partin et al., 2007; Griffiths et al., 2009), andthe last million years (Wang et al., 2001; Meckler et al., 2012).
Despite robust observations of the amount effect across tropicallatitudes, the climatic controls on rainfall !18O at any given siteremain highly uncertain as numerous processes contribute torainfall !18O variability. Rayleigh distillation, whereby cumulativefractionation during condensation and rainout leaves the residual
Contents lists available at SciVerse ScienceDirect
journal homepage: www.elsevier.com/locate/epsl
Earth and Planetary Science Letters
0012-821X/$ - see front matter & 2013 Elsevier B.V. All rights reserved.http://dx.doi.org/10.1016/j.epsl.2013.03.014
n Corresponding author. Tel.: !1 404 894 3893; fax: !1 404 894 5638.E-mail addresses: [email protected] (J.W. Moerman),
[email protected] (K.M. Cobb), [email protected] (J.F. Adkins),[email protected] (H. Sodemann), [email protected](B. Clark), [email protected] (A.A. Tuen).
Please cite this article as: Moerman, J.W., et al., Diurnal to interannual rainfall !18O variations in northern Borneo driven byregional hydrology. Earth and Planetary Science Letters (2013), http://dx.doi.org/10.1016/j.epsl.2013.03.014i
Earth and Planetary Science Letters ∎ (∎∎∎∎) ∎∎∎–∎∎∎
atmospheric vapor depleted in !18O, has long been recognized as afirst-order mechanism driving the amount effect and rainfall !18Ovariability (Dansgaard, 1964; Rozanski et al., 1993). The Rayleighmechanism operates both locally, in the case of rainfall !18Ofractionation across a single rainfall event (e.g. Celle-Jeantonet al., 2004) and regionally, when considering the progressivevapor depletion of air parcels transiting through a region ofenhanced precipitation (e.g. Cobb et al., 2007; Vimeux et al., 2011).
Several post-condensation processes also likely contribute tothe observed amount effect relationship. For one, the evaporationof falling raindrops causes the residual rainfall to be relativelyenriched—a process that is maximized in arid regions and duringdry seasons (Dansgaard, 1964; Stewart, 1975; Gat, 1996; Lee andFung, 2008; Risi et al., 2008a). In regions characterized by strongconvection, the recycling of water vapor within the convective celldrives rainfall !18O lower during episodes of intense convection(Lawrence and Gedzelman, 1996; Lawrence et al., 2004; Risi et al.,2008a, 2008b). Numerous studies have identified additional pro-cesses, such as atmospheric mixing and/or changes in moisturesources and trajectories, that contribute to rainfall !18O variabilityat tropical and subtropical sites (Aggarwal et al., 2004; Cobb et al.,2007; Tian et al., 2007; Breitenbach et al., 2010, Gao et al., 2011).
Previous studies have referred to the amount effect in describ-ing fractionation processes that act strictly locally (e.g. Vuille et al.,2005; Lee et al., 2009; LeGrande and Schmidt, 2009) as well asfractionation processes that integrate across larger spatial scalesand longer time periods (e.g. Cobb et al., 2007; Risi et al., 2008b;Kurita et al., 2009, 2011; Tremoy et al., 2012). For the sake ofclarity, we will differentiate between a “local” versus “regional”amount effect in our study, based on the inferred spatial scale ofthe fractionation mechanism in question.
Isotope-equipped general circulation models (GCMs) allow forthe systematic investigation of the various dynamics regulatingrainfall isotopic composition (Joussaume et al., 1984; Jouzel et al.,1987; Hoffmann et al., 1998; Noone and Simmonds, 2002; Schmidtet al., 2007; Tindall et al., 2009; Risi et al., 2010). Agreementbetween observations and model output has improved as modelsincorporate processes such as post-condensation raindropre-evaporation and convective mixing (Field et al., 2010) and ashigher spatial resolution affords more realistic model topographiesand better representations of weather systems (Vimeux et al.,2011; Gao et al., 2011). Recent studies using isotope-equippedGCMs find that the dominant drivers of rainfall isotopic variabilityvary from region to region (Lee et al., 2007; Lewis et al., 2010;Conroy et al., in press), with modeled !18O values reflecting the netsum of often competing processes (Field et al., 2010). Models alsoreveal that the relationship between climate and rainfall !18O at agiven site may vary with time period (e.g. LeGrande and Schmidt,2009).
The dearth of high-resolution rainfall !18O isotope timeseriesthroughout the tropics makes it difficult to assess the accuracy offractionation mechanisms that emerge in isotope-equipped modelsimulations. Most rainfall !18O studies rely on the InternationalAtomic Energy Agency–Global Network of Isotopes in Precipitationdatabase (IAEA–GNIP; International Atomic Energy Agency, 2006).As this network is comprised almost exclusively of monthlyaveraged rainfall !18O data, such studies are limited to investigat-ing seasonal and longer timescales. As a result, relatively little isknown about rainfall !18O variability on daily to intraseasonal (30–90 day) timescales and its connection to dominant intraseasonalclimate modes, such as the Madden–Julian Oscillation (MJO;Madden and Julian, 1972; Zhang, 2005). Furthermore, the rela-tively sparse spatial coverage of the GNIP database in the deeptropics means that the relationship between interannualrainfall !18O variability and the El Niño Southern Oscillation(ENSO) is poorly constrained. Additional rainfall isotope timeseries
from the tropics help to constrain the modern-day dynamicalcontrols on rainfall !18O variability in the tropics, while providingmuch-needed interpretive frameworks for tropical rainfall !18Opaleo-reconstructions.
Here we present a 5-yr quasi-continuous collection of cumulativedaily rainfall !18O from Gunung Mulu National Park (41N, 1141E),located in northwestern Borneo, in the heart of the West PacificWarm Pool (WPWP). We investigate the variability of northernBorneo rainfall !18O and its response to local and regional climatevariations on synoptic to interannual timescales. We also investigatethe evolution of rainfall !18O across a single rainfall event in order toconstrain the sub-diurnal influences on rainfall !18O at our site. Bycomparing these rainfall !18O timeseries to local and regional climatevariables as well as to indices of large-scale climate variability, weinvestigate the relationship of rainfall !18O in northern Borneo toboth local and large-scale climate controls across a range of time-scales. We also briefly present rainfall !D data from Gunung Mulu into order to plot meteoric water lines and compute values ofdeuterium-excess, a parameter derived from !18O and !D (deuter-ium-excess"!D−8# !18O (Dansgaard, 1964)) and hereafter referredto as ‘d-excess.’ There is no GNIP station on Borneo, so our studyrepresents an important addition to the rainfall !18O data archive,while informing the climatic interpretation of numerous stalagmite!18O-based paleoclimate records from our site (Partin et al., 2007;Meckler et al., 2012; Carolin et al., under review).
2. Methods
2.1. Site description
Gunung Mulu National Park receives over 5 m of precipitationannually, which exhibits significant intraseasonal (30–90 days)and interannual variability. The vast majority of this precipitationis delivered by discrete convective events that typically occur inthe afternoon. Since northern Borneo lies within the migrationpath of the Intertropical Convergence Zone (ITCZ) year-round,seasonal variations in precipitation at Mulu are weak. As a result,the climate of northern Borneo is primarily controlled by intra-seasonal and interannual precipitation variability associated withthe MJO and ENSO respectively, with strong ENSO phases produ-cing annual precipitation anomalies of up to 750% (Bell andHalpert, 1998). During El Nino events, anomalously warm seasurface temperatures (SST) in the eastern and central tropicalPacific pull the center of deep atmospheric convection east of theMaritime continent (Rasmusson and Wallace, 1983), decreasingconvection across the WPWP (Fig. S1). Conversely, convectiveactivity in the WPWP increases during La Niña events. Compre-hensive descriptions of the climatic and geologic setting ofGunung Mulu National Park are presented in Cobb et al. (2007).
2.2. Rainfall !18O sampling procedure and analysis
Two distinct rainfall sampling campaigns were conducted forthis study: (1) a daily collection of rainfall !18O at the GunungMulu airport from July 2006 to May 2011, and (2) a high-resolutionsampling of an individual precipitation event at a remote fieldcamp at Gunung Mulu on March 7, 2010. For the daily rainfall !18Ocollection (N"1203), rainfall was collected in a splayed-bottomrain gauge (Casella model M114003; 254 mm diameter; ∼1 mabove ground level) at the Mulu Meteorological Station head-quartered at Mulu Airport (4.051N, 114.811E) and transferred toglass vials, leaving no headspace when precipitation amountsallowed, each morning at 8:00AM MYT. Precipitation amountswere logged at the same time—we refer to this timeseries as ‘localMulu precipitation’ hereafter. Rainfall aliquots collected between
J.W. Moerman et al. / Earth and Planetary Science Letters ∎ (∎∎∎∎) ∎∎∎–∎∎∎2
Please cite this article as: Moerman, J.W., et al., Diurnal to interannual rainfall !18O variations in northern Borneo driven byregional hydrology. Earth and Planetary Science Letters (2013), http://dx.doi.org/10.1016/j.epsl.2013.03.014i
July 2006 and February 2010 were stored in 4 mL glass vials withpolyseal screw caps and sealed with parafilm. Aliquots collectedfrom March 2010 onwards were stored in 3 mL glass serum vialsand sealed with rubber stoppers and crimped aluminum closures,which provided a superior seal than the screw caps.
The use of an open-air rain gauge raises the possibility ofisotopic enrichment of the rainfall samples by evaporation overthe course of the day. To assess the impact of evaporativeenrichment on rainfall isotopic values and to develop guidelinesfor identifying potentially affected samples, several quality controlassessments were performed (see Supplemental Section fordetails). Based on the findings of these assessments, rainfallsamples associated with precipitation amounts less than 1.6 mmwere excluded from the final dataset. Evaporation within a vialwith headspace represents another source of post-depositionenrichment. As a result, samples stored in vials that were lessthan 4/5 full were also excluded from the final dataset. Together,this resulted in the exclusion of 176 samples. An additional 23samples collected in December 2006 were excluded due todocumented sampling errors by Mulu personnel. In total, 199rainfall !18O samples were excluded from the final dataset tally(N"1004). The exclusion of these samples did not significantlyalter the variability of the 5-yr timeseries (Fig. S5).
We also conducted detailed rainfall sampling across a singleprecipitation event on March 7, 2010 at Camp 5 (4.141N, 114.891E),located approximately 12 km NE of Gunung Mulu National Parkheadquarters. Rainfall !18O samples were collected manually atone to four minute intervals (depending on rainfall intensity)throughout the event, for a total of 19 samples. The event lastedfor approximately one hour, including a 20-min break in rainfall.Lacking any way to quantitatively measure rainfall rates at theremote field camp, we recorded relative rainfall intensity at thetime of each sample collection, where ‘1’ represented a lightdrizzle and ‘10’ represented the heaviest of downpours. Sampleswere stored in 3 mL glass serum vials sealed with rubber stoppersand crimped aluminum closures.
Rainfall !18O and !D were measured at the Georgia Institute ofTechnology via cavity ring-down spectroscopy (Picarro L1102-iwater isotope analyzer). To calibrate the isotopic composition ofthe rainfall samples, three internal water standards, each cali-brated against NIST-VSMOW, NIST-GISP, and NIST-SLAP, wereanalyzed at the beginning and end of each analysis. An internalwater standard was analyzed after every nine rainfall samples tomonitor instrument drift. Memory corrections were applied toeach measurement based on empirical, instrument-specific mem-ory coefficients. The long-term reproducibility of this technique is
better than 70.1‰ for !18O and 70.8‰ for !D (1s). In the case ofthe screw-top vials, sampling and storage contributed an addi-tional uncertainty of 70.1‰ (1s) for !18O and 70.7‰ (1s) for !D,as determined by measuring 34 pairs of duplicate rainfall samples.Crimp-top vial duplicates provided indistinguishable !18O and !Dvalues. As such, a conservative estimate of uncertainty of 70.2‰(1s) is attributed to each rainfall !18O measurement and 71.5‰(1s) to each !D measurement. We report an uncertainty of 71.5‰for d-excess values, calculated from the quadratic combination ofthe uncertainties for !18O and !D.
2.3. Gridded climate datasets
We use daily and monthly values of both the Tropical RainfallMeasuring Mission (TRMM 3B42 V6 and 3B43 V6 respectively;0.251#0.251) precipitation data (Huffman et al., 2007) andNOAA Interpolated Outgoing Longwave Radiation dataset(OLR; 2.51#2.51; Liebmann and Smith, 1996) to investigateregional convective activity, following Arkin and Ardanuy(1989). SST-derived indices of ENSO variability (i.e. NIÑO3,NIÑO3.4, and NIÑO4) are derived from monthly NOAA OptimumInterpolation Sea Surface Temperature (OISST V2; Reynoldset al., 2002). The significance of correlations between Mulurainfall !18O, local Mulu precipitation amount, and the griddedclimate datasets listed above is assessed via the Student'st-test using effective degrees of freedom, following Brethertonet al. (1999).
3. Results
3.1. Rainfall isotope timeseries across a single convective event
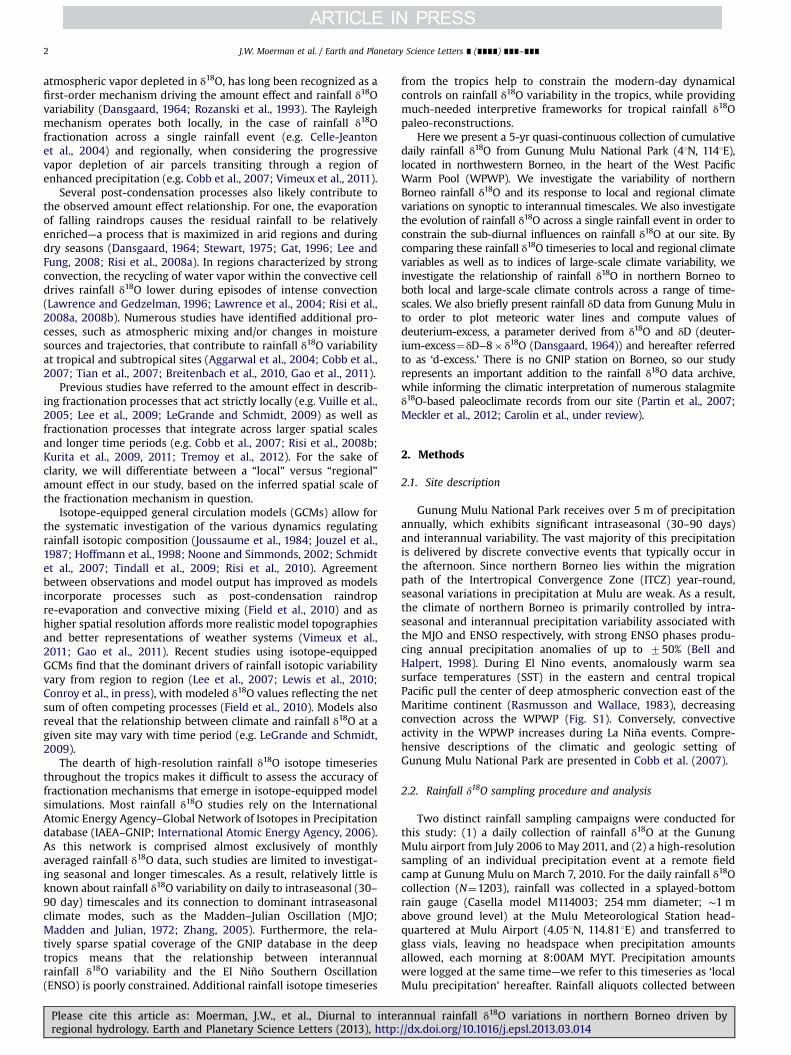
The timeseries of rainfall !18O and d-excess across the March 7,2010 rainfall event are shown in Fig. 1A. Over a 1-h period, rainfall!18O ranges from −1.5‰ to !0.8‰, and !D ranges from !1.8‰ to!10‰ (not shown), with the highest isotopic values observed inthe first minutes of the event. Rainfall isotope values reachtheir lowest values after fifteen minutes and then graduallyincrease thereafter, following a “V-shaped” progression documen-ted at higher latitude sites (Rindsberger et al., 1990; Celle-Jeantonet al., 2004).
Fig. 1B illustrates the strong inverse relationship betweenrainfall !18O and relative rainfall intensity (R"−0.82) across theMarch 7th precipitation event, consistent with the amount effect.The strong correlations between d-excess, which is an indicator of
00 10 20 30 40 50 60
-2.0
-1.5
-1.0
-0.5
0.0
0.5
1.0
18O
(‰)
18O
(‰)
18 16 14 12 10 8 6 4 2
d-ex
cess
(‰)
Elapsed time (min)
18Od-excess
R= -0.98 R= -0.82 1.0
0.5
0.0
-0.5
-1.0
-1.5
-2.01 2 3 4 5 6 7 8 9 10
Increasing rainfall intensity
Fig. 1. (A) Mulu rainfall !18O (black circles) and d-excess (red circles) during the March 7, 2010 convective event, plotted with error bars of70.2‰ (1s) for Mulu rainfall !18Oand71.5‰ (1s) for d-excess. Note that axes for !18O and d-excess are inverted. (B) Relationship between rainfall !18O and relative precipitation intensity during the March7th convective event, where ‘1’ represents a light drizzle and ‘10’ represents the most intense downpour based on qualitative assessment of relative precipitation intensities.Error bars represent70.2‰ (1s). (For interpretation of the references to color in this figure legend, the reader is referred to the web version of this article.)
J.W. Moerman et al. / Earth and Planetary Science Letters ∎ (∎∎∎∎) ∎∎∎–∎∎∎ 3
Please cite this article as: Moerman, J.W., et al., Diurnal to interannual rainfall !18O variations in northern Borneo driven byregional hydrology. Earth and Planetary Science Letters (2013), http://dx.doi.org/10.1016/j.epsl.2013.03.014i

kinetic fractionation (Dansgaard, 1964; Gat, 1996; Risi et al., 2010),and both rainfall !18O (R"−0.98) and rainfall intensity (R"0.80)suggest that the partial re-evaporation of falling raindrops likelydrives the amount effect during this event. When raindropsundergo evaporation in low relative humidity conditions, the d-excess value of the evaporate increases, leaving the raindrops withlower d-excess, as seen mostly in the beginning of the March 7thevent (Fig. 1A). Further support for post-condensation evaporationis provided by the relatively low slope (∼4) for rainfall !D vs. !18Ovariations for this event (Fig. 2), which is typical of evaporationand differs appreciably from the equilibrium !D/!18O slope of8 associated with the global meteoric water line (GMWL;Dansgaard, 1964). These data support a central role for post-condensation evaporation during the March 7th convective event,whereby a raindrop is isotopically enriched during its transit fromcloud to ground. Such a mechanism also explains the occurrenceof several positive rainfall !18O values during this event. Together,these results strongly suggest that post-condensation evaporativeprocesses drive the observed “local” amount effect, and rainfall!18O variability in general, during this convective event. Ourresults provide further observational support for recent studiesof an idealized microphysical model (Lee and Fung, 2008) and asingle column model (Risi et al., 2008a), which both suggest thatpost-condensation evaporation is an important contributor to theamount effect within individual rainfall events. Additional high-resolution sampling of water isotopes across discrete convectiveevents is needed, however, to confirm whether these results arerepresentative of precipitation events at our site.
3.2. Multi-year timeseries of daily rainfall !18O
Daily rainfall !18O values vary considerably throughout the 5-yrtimeseries, ranging from !0.7‰ to −18.5‰ (Fig. 3). Daily rainfall!18O values average −7.873.6‰ (1s, N"1004), and !D valuesaverage −51.7728.9‰ (1s, N"1004, not shown). The precipita-tion amount-weighted !18O timeseries is nearly identical to the
raw !18O timeseries (Fig. S5), except that its mean !18O value isshifted lower by roughly −0.5‰ because higher precipitation daysare also, on average, lower rainfall !18O days. Several daily rainfall!18O values fall to the right of the local meteoric water line(LMWL; Fig. 2), providing evidence for a role, albeit limited, ofevaporative forcing on daily rainfall !18O at the site (Dansgaard,1964). Overall, however, the Mulu LMWL is indistinguishable fromthe GMWL, indicating that local post-condensation evaporationhas minimal impact on cumulative daily rainfall !18O (Fig. 2). Thisfinding is further supported by a near-zero correlation betweendaily rainfall !18O and d-excess (R"−0.01).
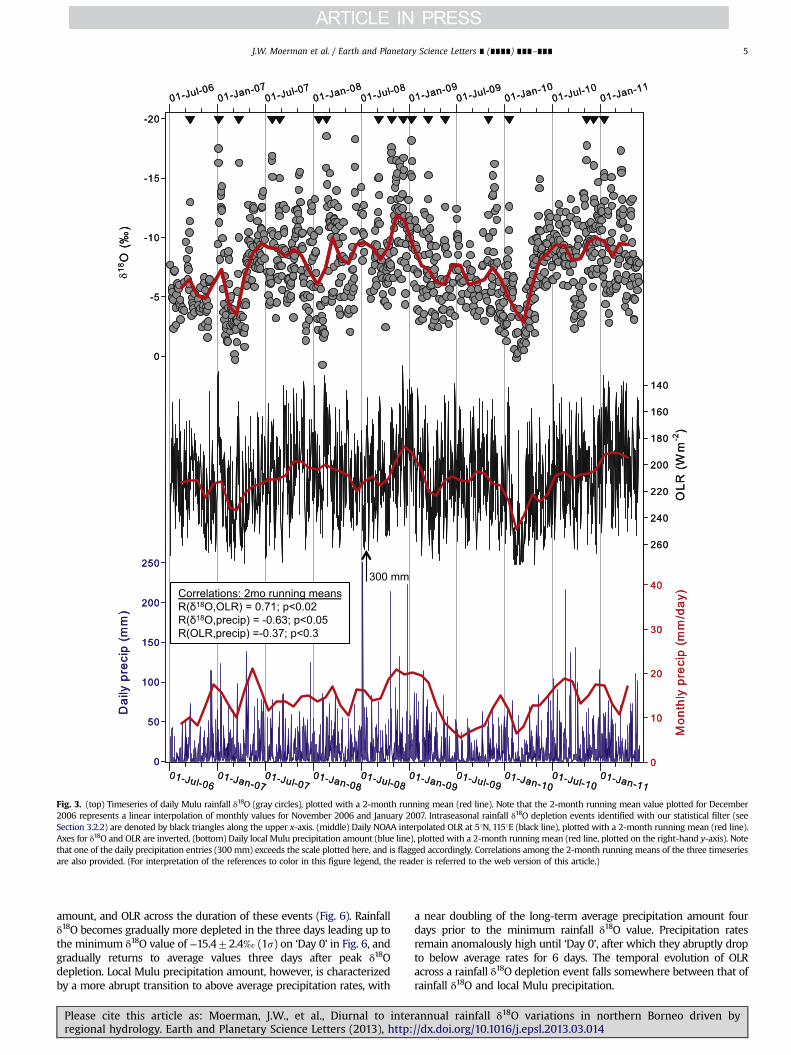
3.2.1. The amount effect at daily and longer timescalesAs shown in Fig. 4A, the inverse correlation between daily
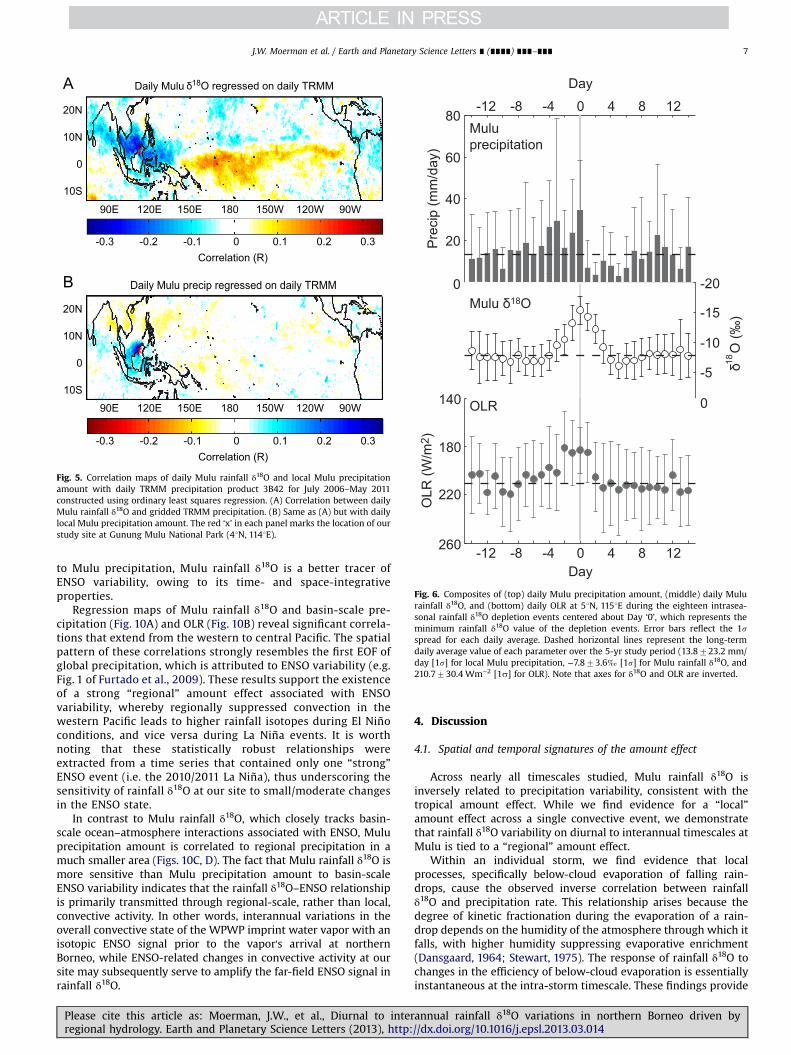
rainfall !18O and daily precipitation amount at Mulu is significantbut relatively weak (R"−0.19, po0.05). Correlations betweenrainfall !18O and local Mulu precipitation amount are higher onmonthly timescales (R"−0.56, po0.01; Fig. 4B). Indeed, Fig. 4Cfurther illustrates that the correlation between rainfall !18O andMulu precipitation increases with increased temporal averaging.Correlations with Mulu rainfall !18O are even higher for TRMMprecipitation and OLR integrated across a 2.51#2.51 gridboxcentered at 51N, 1151E containing Gunung Mulu, indicating thatregional convective activity explains a larger fraction of Mulurainfall !18O variability at daily and longer timescales than localprecipitation. Basin-wide correlations between daily Mulu rainfall!18O and gridded TRMM precipitation amount further demon-strate that daily variations in Mulu rainfall !18O are closely tied toregional-scale processes (Fig. 5A). This spatial map can be con-trasted to the map of correlations between Mulu precipitationamount and gridded TRMM precipitation amount, in which highcorrelations are confined to the immediate vicinity of the site(Fig. 5B).
While daily Mulu rainfall !18O variations are weakly correlatedto daily Mulu precipitation amount, they are highly correlated toMulu precipitation averaged over the previous 8 days (R"−0.46;Fig. 4D). Similar results are found using TRMM precipitation andOLR but with correlations peaking with ∼5 days of averaging(Fig. 4D). This result reflects the time-integrative nature of rainfall!18O that previous studies have observed (Risi et al., 2008b;Vimeux et al., 2011) and modeled (Sturm et al., 2007; Risi et al.,2008a). It should be noted that a simple 8-day lag of local Muluprecipitation (as opposed to an 8-day integration of Mulu pre-cipitation) is not correlated to daily Mulu rainfall !18O values (R"−0.07), indicating that a simple lag relationship is not responsiblefor these observations. The time-integrative nature of Mulu rainfall!18O is also illustrated by high auto-correlation of the !18O time-series (RAC"0.45) compared with that for local Mulu precipitation(RAC"0.23). We hypothesize that the week-long ‘memory’ ofrainfall !18O may reflect an approximately week-long atmosphericresidence time of water vapor at Mulu.
3.2.2. Intraseasonal variability of rainfall !18OThe daily rainfall !18O timeseries is characterized by several
exceptionally large (∼10‰) negative excursions that occur every30–90 days and last for several days to one week (Fig. 3). In orderto characterize the evolution of these dramatic excursions andinvestigate their dynamical origins, we isolated eighteen of thelargest excursions, hereafter referred to as ‘depletion events’, byapplying a statistical filter that selected excursions based on theiramplitude and abruptness (Table S1; see Supplemental Section forselection criteria). The resulting ‘depletion events’ are marked bytriangles along the upper x-axis of Fig. 3.
A composite of the eighteen rainfall !18O ‘depletion events’ revealsconsistent relationships between rainfall !18O, local Mulu precipitation
D = 4.018 O + 8.2
R = 0.98
D = 7.9 18O + 10.3 R = 0.98
GMWL D = 8 18O +10
50
25
0
-25
-50
-75
-100
-125
-150
-175-25 -20 -15 -10 -5 0 5
D (‰
)
18O (‰)
Fig. 2. Mulu rainfall !18O versus !D for the daily 5-yr timeseries (black circles) andthe March 7, 2010 convective event (blue circles). The dashed red line represents alinear fit for the 5-yr timeseries of daily Mulu rainfall samples. The dotted blue linerepresents a linear fit for the March 7, 2010 event samples. The global meteoricwater line (solid gray line) is plotted for reference (Craig, 1961). (For interpretationof the references to color in this figure legend, the reader is referred to the webversion of this article.)
J.W. Moerman et al. / Earth and Planetary Science Letters ∎ (∎∎∎∎) ∎∎∎–∎∎∎4
Please cite this article as: Moerman, J.W., et al., Diurnal to interannual rainfall !18O variations in northern Borneo driven byregional hydrology. Earth and Planetary Science Letters (2013), http://dx.doi.org/10.1016/j.epsl.2013.03.014i
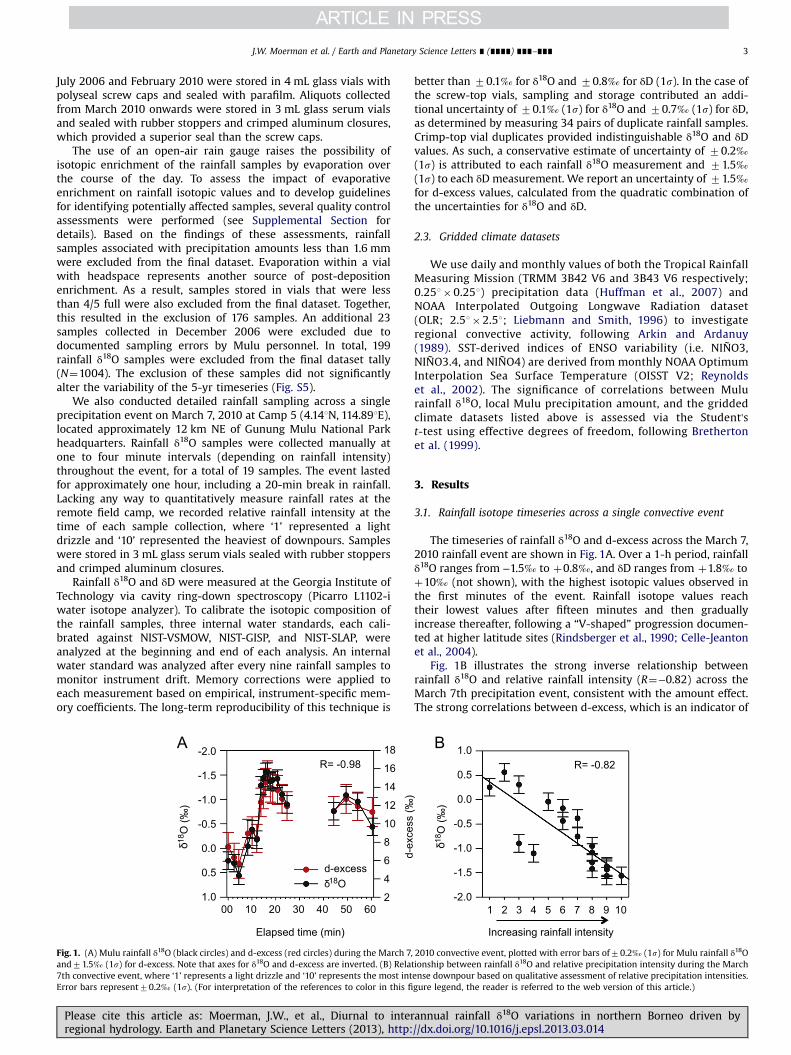
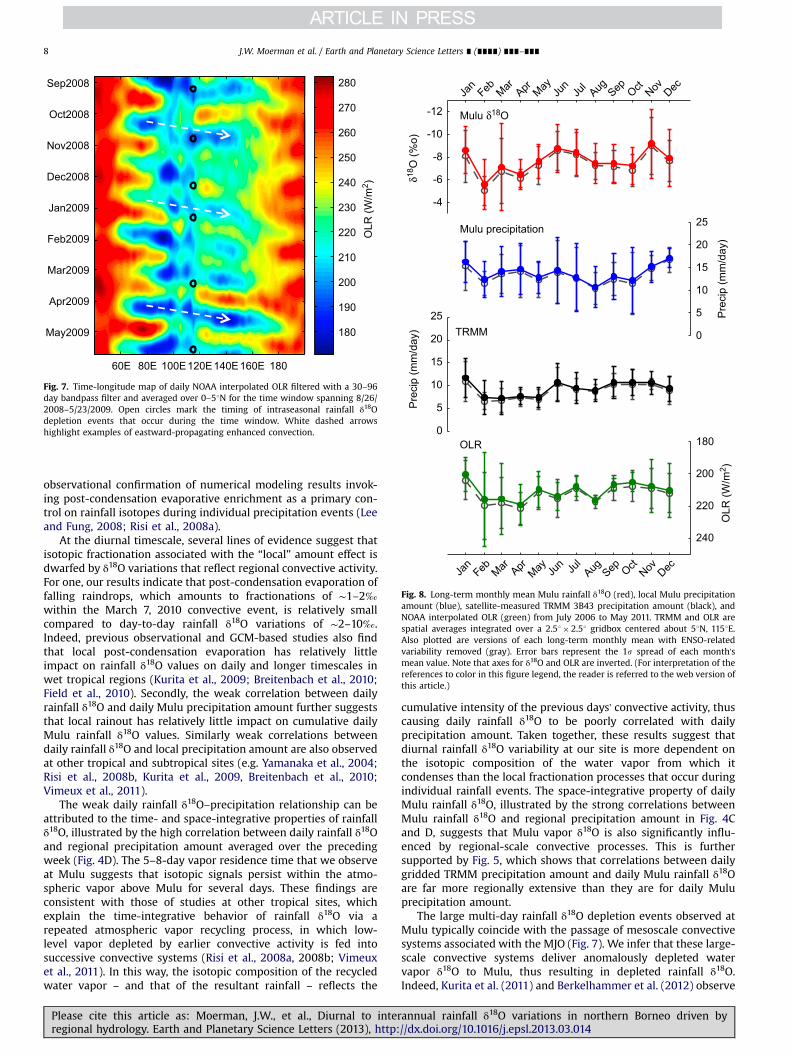
amount, and OLR across the duration of these events (Fig. 6). Rainfall!18O becomes gradually more depleted in the three days leading up tothe minimum !18O value of −15.472.4‰ (1s) on ‘Day 0’ in Fig. 6, andgradually returns to average values three days after peak !18Odepletion. Local Mulu precipitation amount, however, is characterizedby a more abrupt transition to above average precipitation rates, with
a near doubling of the long-term average precipitation amount fourdays prior to the minimum rainfall !18O value. Precipitation ratesremain anomalously high until ‘Day 0’, after which they abruptly dropto below average rates for 6 days. The temporal evolution of OLRacross a rainfall !18O depletion event falls somewhere between that ofrainfall !18O and local Mulu precipitation.
Fig. 3. (top) Timeseries of daily Mulu rainfall !18O (gray circles), plotted with a 2-month running mean (red line). Note that the 2-month running mean value plotted for December2006 represents a linear interpolation of monthly values for November 2006 and January 2007. Intraseasonal rainfall !18O depletion events identified with our statistical filter (seeSection 3.2.2) are denoted by black triangles along the upper x-axis. (middle) Daily NOAA interpolated OLR at 51N, 1151E (black line), plotted with a 2-month running mean (red line).Axes for !18O and OLR are inverted. (bottom) Daily local Mulu precipitation amount (blue line), plotted with a 2-month running mean (red line, plotted on the right-hand y-axis). Notethat one of the daily precipitation entries (300 mm) exceeds the scale plotted here, and is flagged accordingly. Correlations among the 2-month running means of the three timeseriesare also provided. (For interpretation of the references to color in this figure legend, the reader is referred to the web version of this article.)
J.W. Moerman et al. / Earth and Planetary Science Letters ∎ (∎∎∎∎) ∎∎∎–∎∎∎ 5
Please cite this article as: Moerman, J.W., et al., Diurnal to interannual rainfall !18O variations in northern Borneo driven byregional hydrology. Earth and Planetary Science Letters (2013), http://dx.doi.org/10.1016/j.epsl.2013.03.014i
The systematic relationships between Mulu rainfall !18O, localMulu precipitation, and OLR across the large rainfall !18O deple-tion events imply that they share a common origin. Indeed, aHovmöller diagram of OLR confirms that the rainfall !18O deple-tion events occur during or immediately after the passage oforganized regional convective activity from west to east (Fig. 7).The spatio-temporal signature of these OLR anomalies stronglyresembles that of the MJO. Indeed, the majority of rainfall !18Odepletion events do coincide with defined active (i.e. wet) phasesof the MJO (Table S1). We conclude that the MJO stronglyinfluences the intraseasonal variability of Mulu rainfall !18O andcontributes to a “regional” amount effect relationship at intrasea-sonal timescales, as inferred by Cobb et al. (2007). In this case, the“regional” amount effect derives from the advection of depletedwater vapor from regions to the west (upstream) of Mulu.
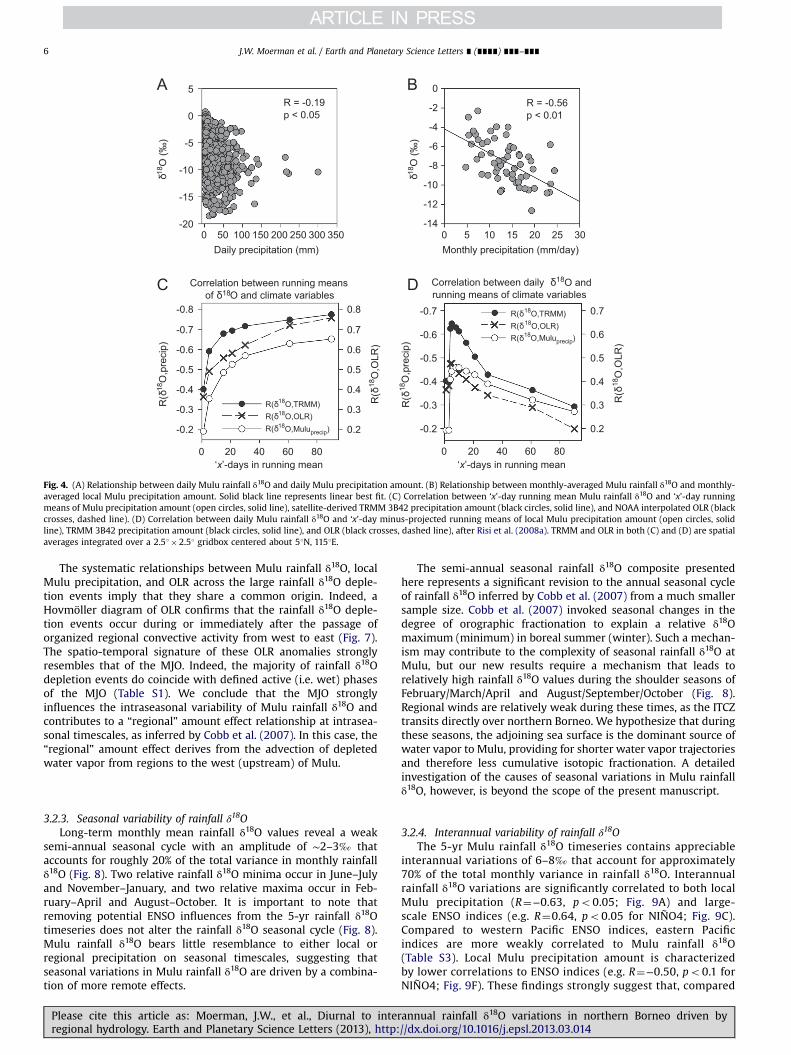
3.2.3. Seasonal variability of rainfall !18OLong-term monthly mean rainfall !18O values reveal a weak
semi-annual seasonal cycle with an amplitude of ∼2–3‰ thataccounts for roughly 20% of the total variance in monthly rainfall!18O (Fig. 8). Two relative rainfall !18O minima occur in June–Julyand November–January, and two relative maxima occur in Feb-ruary–April and August–October. It is important to note thatremoving potential ENSO influences from the 5-yr rainfall !18Otimeseries does not alter the rainfall !18O seasonal cycle (Fig. 8).Mulu rainfall !18O bears little resemblance to either local orregional precipitation on seasonal timescales, suggesting thatseasonal variations in Mulu rainfall !18O are driven by a combina-tion of more remote effects.
The semi-annual seasonal rainfall !18O composite presentedhere represents a significant revision to the annual seasonal cycleof rainfall !18O inferred by Cobb et al. (2007) from a much smallersample size. Cobb et al. (2007) invoked seasonal changes in thedegree of orographic fractionation to explain a relative !18Omaximum (minimum) in boreal summer (winter). Such a mechan-ism may contribute to the complexity of seasonal rainfall !18O atMulu, but our new results require a mechanism that leads torelatively high rainfall !18O values during the shoulder seasons ofFebruary/March/April and August/September/October (Fig. 8).Regional winds are relatively weak during these times, as the ITCZtransits directly over northern Borneo. We hypothesize that duringthese seasons, the adjoining sea surface is the dominant source ofwater vapor to Mulu, providing for shorter water vapor trajectoriesand therefore less cumulative isotopic fractionation. A detailedinvestigation of the causes of seasonal variations in Mulu rainfall!18O, however, is beyond the scope of the present manuscript.
3.2.4. Interannual variability of rainfall !18OThe 5-yr Mulu rainfall !18O timeseries contains appreciable
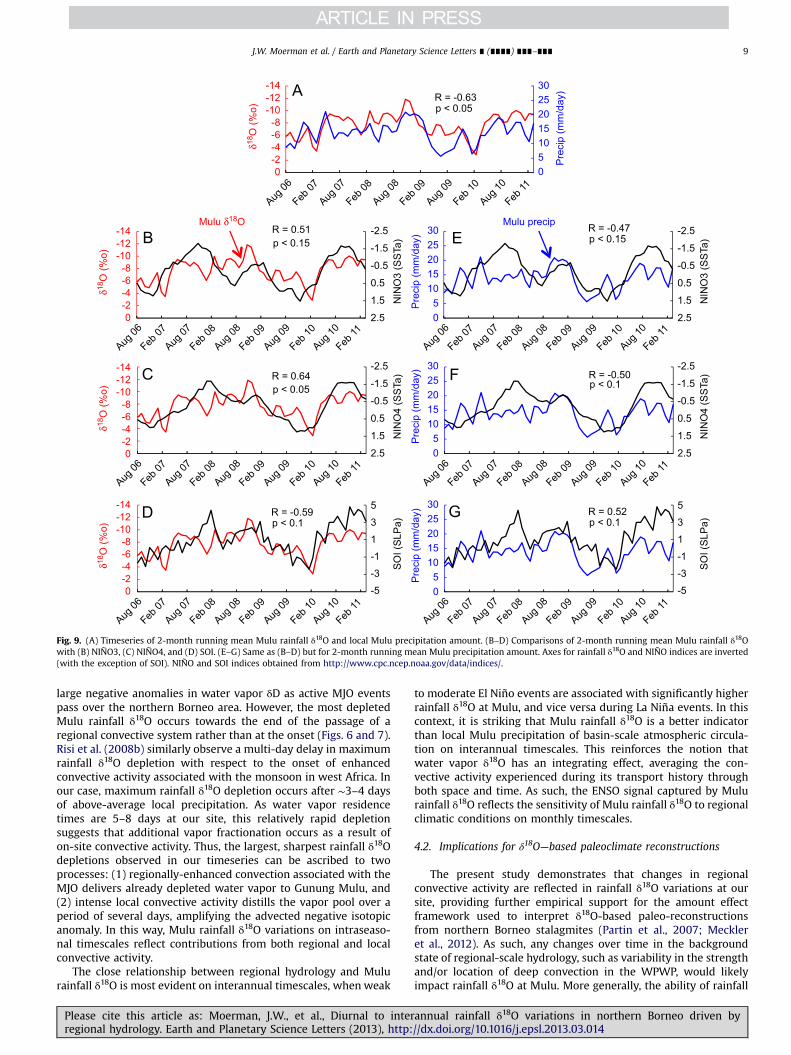
interannual variations of 6–8‰ that account for approximately70% of the total monthly variance in rainfall !18O. Interannualrainfall !18O variations are significantly correlated to both localMulu precipitation (R"−0.63, po0.05; Fig. 9A) and large-scale ENSO indices (e.g. R"0.64, po0.05 for NIÑO4; Fig. 9C).Compared to western Pacific ENSO indices, eastern Pacificindices are more weakly correlated to Mulu rainfall !18O(Table S3). Local Mulu precipitation amount is characterizedby lower correlations to ENSO indices (e.g. R"−0.50, po0.1 forNIÑO4; Fig. 9F). These findings strongly suggest that, compared
Correlation between daily 18O and running means of climate variables
Correlation between running means of 18O and climate variables
-0.8
-0.7
-0.6
-0.5
-0.4
-0.3
-0.2
0.8
0.7
0.6
0.5
0.4
0.3
0.2
-0.7
-0.6
-0.5
-0.4
-0.3
-0.2
0.7
0.6
0.5
0.4
0.3
0.2
0 20 40 60 80 0 20 40 60 80 ‘x’-days in running mean ‘x’-days in running mean
R(
18O
,pre
cip)
R(
18O
,pre
cip)
R(
18O
,OLR
)
R(
18O
,OLR
)
R( 18O,Muluprecip) R( 18O,OLR) R( 18O,TRMM)
R( 18O,Muluprecip) R( 18O,OLR) R( 18O,TRMM)
5
0
-5
-10
-15
-200 50 100 150 200 250 300 350
18O
(‰)
18O
(‰)
Daily precipitation (mm) Monthly precipitation (mm/day)
R = -0.19p < 0.05
R = -0.56p < 0.01
0
-2
-4
-6
-8
-10
-12
-140 5 10 15 20 25 30
Fig. 4. (A) Relationship between daily Mulu rainfall !18O and daily Mulu precipitation amount. (B) Relationship between monthly-averaged Mulu rainfall !18O and monthly-averaged local Mulu precipitation amount. Solid black line represents linear best fit. (C) Correlation between ‘x’-day running mean Mulu rainfall !18O and ‘x’-day runningmeans of Mulu precipitation amount (open circles, solid line), satellite-derived TRMM 3B42 precipitation amount (black circles, solid line), and NOAA interpolated OLR (blackcrosses, dashed line). (D) Correlation between daily Mulu rainfall !18O and ‘x’-day minus-projected running means of local Mulu precipitation amount (open circles, solidline), TRMM 3B42 precipitation amount (black circles, solid line), and OLR (black crosses, dashed line), after Risi et al. (2008a). TRMM and OLR in both (C) and (D) are spatialaverages integrated over a 2.51#2.51 gridbox centered about 51N, 1151E.
J.W. Moerman et al. / Earth and Planetary Science Letters ∎ (∎∎∎∎) ∎∎∎–∎∎∎6
Please cite this article as: Moerman, J.W., et al., Diurnal to interannual rainfall !18O variations in northern Borneo driven byregional hydrology. Earth and Planetary Science Letters (2013), http://dx.doi.org/10.1016/j.epsl.2013.03.014i
to Mulu precipitation, Mulu rainfall !18O is a better tracer ofENSO variability, owing to its time- and space-integrativeproperties.
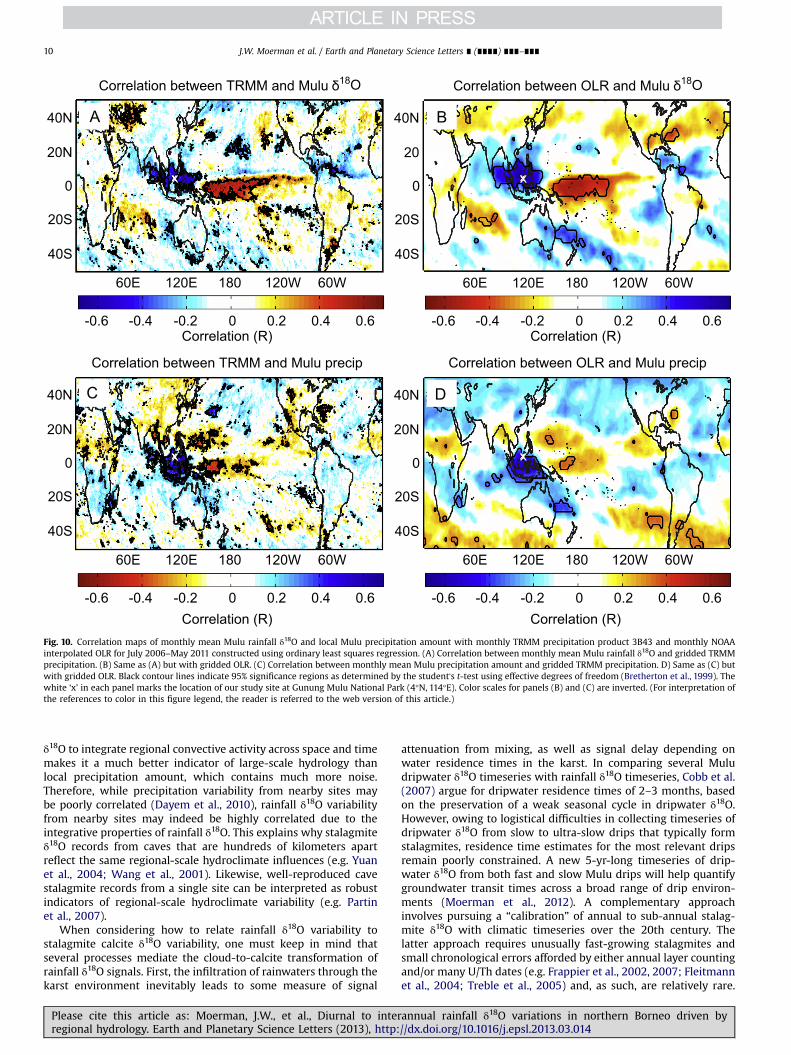
Regression maps of Mulu rainfall !18O and basin-scale pre-cipitation (Fig. 10A) and OLR (Fig. 10B) reveal significant correla-tions that extend from the western to central Pacific. The spatialpattern of these correlations strongly resembles the first EOF ofglobal precipitation, which is attributed to ENSO variability (e.g.Fig. 1 of Furtado et al., 2009). These results support the existenceof a strong “regional” amount effect associated with ENSOvariability, whereby regionally suppressed convection in thewestern Pacific leads to higher rainfall isotopes during El Niñoconditions, and vice versa during La Niña events. It is worthnoting that these statistically robust relationships wereextracted from a time series that contained only one “strong”ENSO event (i.e. the 2010/2011 La Niña), thus underscoring thesensitivity of rainfall !18O at our site to small/moderate changesin the ENSO state.
In contrast to Mulu rainfall !18O, which closely tracks basin-scale ocean–atmosphere interactions associated with ENSO, Muluprecipitation amount is correlated to regional precipitation in amuch smaller area (Figs. 10C, D). The fact that Mulu rainfall !18O ismore sensitive than Mulu precipitation amount to basin-scaleENSO variability indicates that the rainfall !18O–ENSO relationshipis primarily transmitted through regional-scale, rather than local,convective activity. In other words, interannual variations in theoverall convective state of the WPWP imprint water vapor with anisotopic ENSO signal prior to the vapor's arrival at northernBorneo, while ENSO-related changes in convective activity at oursite may subsequently serve to amplify the far-field ENSO signal inrainfall !18O.
4. Discussion
4.1. Spatial and temporal signatures of the amount effect
Across nearly all timescales studied, Mulu rainfall !18O isinversely related to precipitation variability, consistent with thetropical amount effect. While we find evidence for a “local”amount effect across a single convective event, we demonstratethat rainfall !18O variability on diurnal to interannual timescales atMulu is tied to a “regional” amount effect.
Within an individual storm, we find evidence that localprocesses, specifically below-cloud evaporation of falling rain-drops, cause the observed inverse correlation between rainfall!18O and precipitation rate. This relationship arises because thedegree of kinetic fractionation during the evaporation of a rain-drop depends on the humidity of the atmosphere through which itfalls, with higher humidity suppressing evaporative enrichment(Dansgaard, 1964; Stewart, 1975). The response of rainfall !18O tochanges in the efficiency of below-cloud evaporation is essentiallyinstantaneous at the intra-storm timescale. These findings provide
10S
0
10N
20N
90E 120E 150E 180 150W 120W 90W
-0.3 -0.2 -0.1 0 0.1 0.2 0.3 Correlation (R)
x
10S
0
10N
20N
90E 120E 150E 180 150W 120W 90W
-0.3 -0.2 -0.1 0 0.1 0.2 0.3 Correlation (R)
Daily Mulu precip regressed on daily TRMM
x
18O regressed on daily TRMM Daily Mulu
Fig. 5. Correlation maps of daily Mulu rainfall !18O and local Mulu precipitationamount with daily TRMM precipitation product 3B42 for July 2006–May 2011constructed using ordinary least squares regression. (A) Correlation between dailyMulu rainfall !18O and gridded TRMM precipitation. (B) Same as (A) but with dailylocal Mulu precipitation amount. The red ‘x’ in each panel marks the location of ourstudy site at Gunung Mulu National Park (41N, 1141E).
Mulu precipitation
Mulu 18
18
O
OLR
-12 -8 -4 0 4 8 12
-12 -8 -4 0 4 8 12
O (‰
)
Prec
ip (m
m/d
ay)
OLR
(W/m
2 )
Day
Day
80
60
20
40
0
140
180
220
260
-20
-15
-10
-5
0
Fig. 6. Composites of (top) daily Mulu precipitation amount, (middle) daily Mulurainfall !18O, and (bottom) daily OLR at 51N, 1151E during the eighteen intrasea-sonal rainfall !18O depletion events centered about Day ‘0’, which represents theminimum rainfall !18O value of the depletion events. Error bars reflect the 1sspread for each daily average. Dashed horizontal lines represent the long-termdaily average value of each parameter over the 5-yr study period (13.8723.2 mm/day [1s] for local Mulu precipitation, −7.873.6‰ [1s] for Mulu rainfall !18O, and210.7730.4 Wm−2 [1s] for OLR). Note that axes for !18O and OLR are inverted.
J.W. Moerman et al. / Earth and Planetary Science Letters ∎ (∎∎∎∎) ∎∎∎–∎∎∎ 7
Please cite this article as: Moerman, J.W., et al., Diurnal to interannual rainfall !18O variations in northern Borneo driven byregional hydrology. Earth and Planetary Science Letters (2013), http://dx.doi.org/10.1016/j.epsl.2013.03.014i
observational confirmation of numerical modeling results invok-ing post-condensation evaporative enrichment as a primary con-trol on rainfall isotopes during individual precipitation events (Leeand Fung, 2008; Risi et al., 2008a).
At the diurnal timescale, several lines of evidence suggest thatisotopic fractionation associated with the “local” amount effect isdwarfed by !18O variations that reflect regional convective activity.For one, our results indicate that post-condensation evaporation offalling raindrops, which amounts to fractionations of ∼1–2‰within the March 7, 2010 convective event, is relatively smallcompared to day-to-day rainfall !18O variations of ∼2–10‰.Indeed, previous observational and GCM-based studies also findthat local post-condensation evaporation has relatively littleimpact on rainfall !18O values on daily and longer timescales inwet tropical regions (Kurita et al., 2009; Breitenbach et al., 2010;Field et al., 2010). Secondly, the weak correlation between dailyrainfall !18O and daily Mulu precipitation amount further suggeststhat local rainout has relatively little impact on cumulative dailyMulu rainfall !18O values. Similarly weak correlations betweendaily rainfall !18O and local precipitation amount are also observedat other tropical and subtropical sites (e.g. Yamanaka et al., 2004;Risi et al., 2008b, Kurita et al., 2009, Breitenbach et al., 2010;Vimeux et al., 2011).
The weak daily rainfall !18O–precipitation relationship can beattributed to the time- and space-integrative properties of rainfall!18O, illustrated by the high correlation between daily rainfall !18Oand regional precipitation amount averaged over the precedingweek (Fig. 4D). The 5–8-day vapor residence time that we observeat Mulu suggests that isotopic signals persist within the atmo-spheric vapor above Mulu for several days. These findings areconsistent with those of studies at other tropical sites, whichexplain the time-integrative behavior of rainfall !18O via arepeated atmospheric vapor recycling process, in which low-level vapor depleted by earlier convective activity is fed intosuccessive convective systems (Risi et al., 2008a, 2008b; Vimeuxet al., 2011). In this way, the isotopic composition of the recycledwater vapor – and that of the resultant rainfall – reflects the
cumulative intensity of the previous days' convective activity, thuscausing daily rainfall !18O to be poorly correlated with dailyprecipitation amount. Taken together, these results suggest thatdiurnal rainfall !18O variability at our site is more dependent onthe isotopic composition of the water vapor from which itcondenses than the local fractionation processes that occur duringindividual rainfall events. The space-integrative property of dailyMulu rainfall !18O, illustrated by the strong correlations betweenMulu rainfall !18O and regional precipitation amount in Fig. 4Cand D, suggests that Mulu vapor !18O is also significantly influ-enced by regional-scale convective processes. This is furthersupported by Fig. 5, which shows that correlations between dailygridded TRMM precipitation amount and daily Mulu rainfall !18Oare far more regionally extensive than they are for daily Muluprecipitation amount.
The large multi-day rainfall !18O depletion events observed atMulu typically coincide with the passage of mesoscale convectivesystems associated with the MJO (Fig. 7). We infer that these large-scale convective systems deliver anomalously depleted watervapor !18O to Mulu, thus resulting in depleted rainfall !18O.Indeed, Kurita et al. (2011) and Berkelhammer et al. (2012) observe
60E 80E 100E120E140E160E 180
Sep2008
Oct2008
Nov2008
Dec2008
Jan2009
Feb2009
Mar2009
Apr2009
May2009
OLR
(W/m
2 )
180
190
200
210
220
230
240
250
260
270
280
Fig. 7. Time-longitude map of daily NOAA interpolated OLR filtered with a 30–96day bandpass filter and averaged over 0–51N for the time window spanning 8/26/2008–5/23/2009. Open circles mark the timing of intraseasonal rainfall !18Odepletion events that occur during the time window. White dashed arrowshighlight examples of eastward-propagating enhanced convection.
-12
-10
-8
-6
-4
!18O
(%o)
Mulu precipitation
25
20
15
10
5
0
Prec
ip (m
m/d
ay)
Prec
ip (m
m/d
ay)
TRMM
OLR
Jan
Feb Mar Apr May Jun Ju
lAug Sep Oct
Nov Dec
Jan
Feb Mar Apr May Jun
Jul
Aug Sep Oct Nov Dec
25
20
15
10
5
0
180
200
220
240
OLR
(W/m
2 )
Mulu !18O
Fig. 8. Long-term monthly mean Mulu rainfall !18O (red), local Mulu precipitationamount (blue), satellite-measured TRMM 3B43 precipitation amount (black), andNOAA interpolated OLR (green) from July 2006 to May 2011. TRMM and OLR arespatial averages integrated over a 2.51#2.51 gridbox centered about 51N, 1151E.Also plotted are versions of each long-term monthly mean with ENSO-relatedvariability removed (gray). Error bars represent the 1s spread of each month'smean value. Note that axes for !18O and OLR are inverted. (For interpretation of thereferences to color in this figure legend, the reader is referred to the web version ofthis article.)
J.W. Moerman et al. / Earth and Planetary Science Letters ∎ (∎∎∎∎) ∎∎∎–∎∎∎8
Please cite this article as: Moerman, J.W., et al., Diurnal to interannual rainfall !18O variations in northern Borneo driven byregional hydrology. Earth and Planetary Science Letters (2013), http://dx.doi.org/10.1016/j.epsl.2013.03.014i
large negative anomalies in water vapor !D as active MJO eventspass over the northern Borneo area. However, the most depletedMulu rainfall !18O occurs towards the end of the passage of aregional convective system rather than at the onset (Figs. 6 and 7).Risi et al. (2008b) similarly observe a multi-day delay in maximumrainfall !18O depletion with respect to the onset of enhancedconvective activity associated with the monsoon in west Africa. Inour case, maximum rainfall !18O depletion occurs after ∼3–4 daysof above-average local precipitation. As water vapor residencetimes are 5–8 days at our site, this relatively rapid depletionsuggests that additional vapor fractionation occurs as a result ofon-site convective activity. Thus, the largest, sharpest rainfall !18Odepletions observed in our timeseries can be ascribed to twoprocesses: (1) regionally-enhanced convection associated with theMJO delivers already depleted water vapor to Gunung Mulu, and(2) intense local convective activity distills the vapor pool over aperiod of several days, amplifying the advected negative isotopicanomaly. In this way, Mulu rainfall !18O variations on intraseaso-nal timescales reflect contributions from both regional and localconvective activity.
The close relationship between regional hydrology and Mulurainfall !18O is most evident on interannual timescales, when weak
to moderate El Niño events are associated with significantly higherrainfall !18O at Mulu, and vice versa during La Niña events. In thiscontext, it is striking that Mulu rainfall !18O is a better indicatorthan local Mulu precipitation of basin-scale atmospheric circula-tion on interannual timescales. This reinforces the notion thatwater vapor !18O has an integrating effect, averaging the con-vective activity experienced during its transport history throughboth space and time. As such, the ENSO signal captured by Mulurainfall !18O reflects the sensitivity of Mulu rainfall !18O to regionalclimatic conditions on monthly timescales.
4.2. Implications for !18O—based paleoclimate reconstructions
The present study demonstrates that changes in regionalconvective activity are reflected in rainfall !18O variations at oursite, providing further empirical support for the amount effectframework used to interpret !18O-based paleo-reconstructionsfrom northern Borneo stalagmites (Partin et al., 2007; Meckleret al., 2012). As such, any changes over time in the backgroundstate of regional-scale hydrology, such as variability in the strengthand/or location of deep convection in the WPWP, would likelyimpact rainfall !18O at Mulu. More generally, the ability of rainfall
-14-12-10-8-6-4-20
!18O
(%o)
-14-12-10
-8-6-4-20
!18O
(%o)
-14-12-10
-8-6-4-20
!18O
(%o)
-14-12-10
-8-6-4-20
!18O
(%o)
Aug 06
Feb 07
Aug 07
Feb 08
Aug 08
Feb 09
Aug 09
Feb 10
Aug 10
Feb 11
Aug 06
Feb 07
Aug 07
Feb 08
Aug 08
Feb 09
Aug 09
Feb 10
Aug 10
Feb 11
Aug 06
Feb 07
Aug 07
Feb 08
Aug 08
Feb 09
Aug 09
Feb 10
Aug 10
Feb 11
Aug 06
Feb 07
Aug 07
Feb 08
Aug 08
Feb 09
Aug 09
Feb 10
Aug 10
Feb 11
Aug 06
Feb 07
Aug 07
Feb 08
Aug 08
Feb 09
Aug 09
Feb 10
Aug 10
Feb 11
Aug 06
Feb 07
Aug 07
Feb 08
Aug 08
Feb 09
Aug 09
Feb 10
Aug 10
Feb 11
Aug 06
Feb 07
Aug 07
Feb 08
Aug 08
Feb 09
Aug 09
Feb 10
Aug 10
Feb 11
302520151050
3025201510
50
3025201510
50
3025201510
50
Prec
ip (m
m/d
ay)R = -0.63
p < 0.05
R = 0.51p < 0.15
R = -0.47p < 0.15
R = -0.50p < 0.1
R = 0.64p < 0.05
R = -0.59p < 0.1
R = 0.52p < 0.1
-2.5-1.5-0.50.51.52.5
NIN
O3
(SST
a)
-2.5-1.5-0.50.51.52.5
NIN
O4
(SST
a)
531-1-3-5
SOI (
SLPa
)
-2.5-1.5-0.50.51.52.5
NIN
O3
(SST
a)
-2.5-1.5-0.50.51.52.5
NIN
O4
(SST
a)
531-1-3-5
SOI (
SLPa
)
Prec
ip (m
m/d
ay)
Prec
ip (m
m/d
ay)
Prec
ip (m
m/d
ay)
Mulu !18O Mulu precip
Fig. 9. (A) Timeseries of 2-month running mean Mulu rainfall !18O and local Mulu precipitation amount. (B–D) Comparisons of 2-month running mean Mulu rainfall !18Owith (B) NIÑO3, (C) NIÑO4, and (D) SOI. (E–G) Same as (B–D) but for 2-month running mean Mulu precipitation amount. Axes for rainfall !18O and NIÑO indices are inverted(with the exception of SOI). NIÑO and SOI indices obtained from http://www.cpc.ncep.noaa.gov/data/indices/.
J.W. Moerman et al. / Earth and Planetary Science Letters ∎ (∎∎∎∎) ∎∎∎–∎∎∎ 9
Please cite this article as: Moerman, J.W., et al., Diurnal to interannual rainfall !18O variations in northern Borneo driven byregional hydrology. Earth and Planetary Science Letters (2013), http://dx.doi.org/10.1016/j.epsl.2013.03.014i
!18O to integrate regional convective activity across space and timemakes it a much better indicator of large-scale hydrology thanlocal precipitation amount, which contains much more noise.Therefore, while precipitation variability from nearby sites maybe poorly correlated (Dayem et al., 2010), rainfall !18O variabilityfrom nearby sites may indeed be highly correlated due to theintegrative properties of rainfall !18O. This explains why stalagmite!18O records from caves that are hundreds of kilometers apartreflect the same regional-scale hydroclimate influences (e.g. Yuanet al., 2004; Wang et al., 2001). Likewise, well-reproduced cavestalagmite records from a single site can be interpreted as robustindicators of regional-scale hydroclimate variability (e.g. Partinet al., 2007).
When considering how to relate rainfall !18O variability tostalagmite calcite !18O variability, one must keep in mind thatseveral processes mediate the cloud-to-calcite transformation ofrainfall !18O signals. First, the infiltration of rainwaters through thekarst environment inevitably leads to some measure of signal
attenuation from mixing, as well as signal delay depending onwater residence times in the karst. In comparing several Muludripwater !18O timeseries with rainfall !18O timeseries, Cobb et al.(2007) argue for dripwater residence times of 2–3 months, basedon the preservation of a weak seasonal cycle in dripwater !18O.However, owing to logistical difficulties in collecting timeseries ofdripwater !18O from slow to ultra-slow drips that typically formstalagmites, residence time estimates for the most relevant dripsremain poorly constrained. A new 5-yr-long timeseries of drip-water !18O from both fast and slow Mulu drips will help quantifygroundwater transit times across a broad range of drip environ-ments (Moerman et al., 2012). A complementary approachinvolves pursuing a “calibration” of annual to sub-annual stalag-mite !18O with climatic timeseries over the 20th century. Thelatter approach requires unusually fast-growing stalagmites andsmall chronological errors afforded by either annual layer countingand/or many U/Th dates (e.g. Frappier et al., 2002, 2007; Fleitmannet al., 2004; Treble et al., 2005) and, as such, are relatively rare.
60E 120E 180 120W 60W
40N
20
0
20S
40S
Correlation (R)
Correlation between OLR and Mulu 18O
0 0.2 0.4 0.6 -0.6 -0.4 -0.2
60E 120E 180 120W 60W
40N
20N
0
20S
40S
Correlation (R)
Correlation between OLR and Mulu precip
0 0.2 0.4 0.6 -0.6 -0.4 -0.2
60E 120E 180 120W 60W
40N
20N
0
20S
40S
Correlation (R)
Correlation between TRMM and Mulu 18O
0 0.2 0.4 0.6 -0.6 -0.4 -0.2
60E 120E 180 120W 60W
40N
20N
0
20S
40S
Correlation (R)
Correlation between TRMM and Mulu precip
0 0.2 0.4 0.6 -0.6 -0.4 -0.2
A B
C D
x
x x
x
Fig. 10. Correlation maps of monthly mean Mulu rainfall !18O and local Mulu precipitation amount with monthly TRMM precipitation product 3B43 and monthly NOAAinterpolated OLR for July 2006–May 2011 constructed using ordinary least squares regression. (A) Correlation between monthly mean Mulu rainfall !18O and gridded TRMMprecipitation. (B) Same as (A) but with gridded OLR. (C) Correlation between monthly mean Mulu precipitation amount and gridded TRMM precipitation. D) Same as (C) butwith gridded OLR. Black contour lines indicate 95% significance regions as determined by the student's t-test using effective degrees of freedom (Bretherton et al., 1999). Thewhite ‘x’ in each panel marks the location of our study site at Gunung Mulu National Park (4°N, 114°E). Color scales for panels (B) and (C) are inverted. (For interpretation ofthe references to color in this figure legend, the reader is referred to the web version of this article.)
J.W. Moerman et al. / Earth and Planetary Science Letters ∎ (∎∎∎∎) ∎∎∎–∎∎∎10
Please cite this article as: Moerman, J.W., et al., Diurnal to interannual rainfall !18O variations in northern Borneo driven byregional hydrology. Earth and Planetary Science Letters (2013), http://dx.doi.org/10.1016/j.epsl.2013.03.014i
Such calibrations generally confirm the interpretation of stalag-mite !18O reconstructions as hydroclimate reconstructions, buthighlight key uncertainties surrounding the cloud-to-calcite trans-formation of rainfall !18O signals.
Our study suggests that as records of paleo-rainfall !18O,stalagmite !18O records reflect changes in regional convectiveactivity, which in turn is related to a variety of climatic processesoperating across a range of timescales. The Mulu rainfall !18Otimeseries exhibits variability at intraseasonal, seasonal, andinterannual timescales, each linked to a distinct climatic phenom-enon. Therefore, low-frequency stalagmite !18O signals at Mulucould conceivably represent a change in the frequency and/oramplitude of MJO-related variability, a change in the seasonalrainfall cycle (i.e. the ITCZ), and/or a change in the tropical Pacific'szonal SST gradient (i.e. ENSO). This ambiguity illustrates the needto transition from reliance on single-site stalagmite !18O recon-structions to networks of paleoclimate records that span thegeographic range of the climatic phenomenon of interest. Indeed,small networks of stalagmite !18O records have recently beenapplied to investigate changes in the ITCZ by Griffiths et al. (2009)with a north-south transect from southeast Asia to Indonesia. Suchan approach could be used to investigate changes in the zonalconvective gradient across the equatorial tropical Pacific. Networkssuch as these would provide important benchmarks for newlyavailable paleoclimate simulations of coupled GCMs, some ofwhich are equipped with water isotope modules (e.g. LeGrandeet al., 2006; Sturm et al., 2010; Risi et al., 2010). Such data-modelcomparisons provide an opportunity to advance our understand-ing of the mechanisms of global climate change on decadal tomillennial timescales and how well these processes are repre-sented in state-of-the-art climate models.
5. Conclusions
Our analyses demonstrate that the inverse relationshipbetween rainfall !18O and precipitation amount, known as theamount effect, is a strong control on the oxygen isotopiccomposition of rainfall in northern Borneo over the majorityof the timescales examined. Studying a single precipitationevent at high temporal resolution, we find evidence for localfractionation processes driving intra-storm rainfall !18O varia-bility, whereas the majority of diurnal to interannual rainfall!18O variability originates from regional-scale hydrological pro-cesses. Daily rainfall !18O variations best reflect cumulativeregional precipitation occurring over the preceding week. Intra-seasonal rainfall !18O variability, which is particularly large atour site with up to ∼16‰ shifts, is closely associated with theMJO – the dominant mode of intraseasonal climatic variabilityin the tropics – and exhibits influences from both local and far-field fractionation processes. Interannual rainfall !18O variabilityat Mulu is significantly correlated to ENSO, whereby a basin-scale reorganization of atmospheric circulation patterns duringEl Niño and La Niña events affects regional convective activityand in turn the regional isotopic composition of the atmo-spheric water vapor. In this context, Mulu rainfall !18O issuperior to local Mulu precipitation amount as a proxy for ENSOvariability.
Our study documents a robust amount effect relationshipbetween regional precipitation and Mulu rainfall !18O that is mostevident at intraseasonal and interannual timescales. Our resultslend strong support to the interpretation of !18O-based recon-structions from northern Borneo stalagmites as regional hydro-climate proxies, with significant influences from intraseasonal andinterannual variability, and to a lesser extent, seasonal variability.More generally, our study illustrates that the processes governing
the climate–rainfall !18O relationship are space- and time-dependent. As such, our results support the generation of multi-year, daily-resolved timeseries of rainfall isotopes in order toidentify the dynamical controls on rainfall !18O variability at siteswhere accurate interpretations of paleoclimate !18O reconstruc-tions are especially critical.
Acknowledgments
The authors gratefully acknowledge the Mulu MeteorologicalStation staff for overseeing the collection of the daily rainfallsamples, as well as Jenny Malang, Syria Lejau, and the staff atGunung Mulu National Park for their dedicated assistance duringfieldtrips. Permits for this work were granted by the MalaysianEconomic Planning Unit, the Sarawak State Planning Unit, and theSarawak Forestry Department. We also thank Aaron van Pelt ofPicarro, Inc., Bruce Vaughn of INSTARR at UC Boulder, and KrystleStewart for their invaluable assistance during sample analysis andDr. Emanuele Di Lorenzo for his assistance with the TRMM dataset.This research was supported by NSF Grant 0645291 to KMC, andJWM was funded by a NSF Graduate Research Fellowship.
Appendix A. Supporting information
Supplemental Section and full Mulu rainfall !18O dataset can befound in the online version at http://dx.doi.org/10.1016/j.epsl.2013.03.014. The full Mulu rainfall !18O dataset may also be retrievedfrom the Global Network of Isotopes in Precipitation (GNIP),available via IAEA's WISER database at http://www.iaea.org/water.
References
Aggarwal, P., Frohlich, K., Kulkarni, K., Gourcy, L., 2004. Stable isotope evidence formoisture sources in the Asian summer monsoon under present and pastclimate regimes. Geophys. Res. Lett. 31, L08203.
Araguas-Araguas, L., Froehlich, K., Rozanski, K., 1998. Stable isotope composition ofprecipitation over southeast Asia. J. Geophys. Res. Atmos. 103, 28721–28742.
Arkin, P.A., Ardanuy, P.E., 1989. Estimating climatic-scale precipitation from space: areview. J. Clim. 2, 1229–1238.
Bar-Matthews, M., Ayalon, A., Kaufman, A., 1997. Late Quaternary paleoclimate inthe Eastern Mediterranean region from stable isotope analysis of speleothemsat Soreq Cave. Isr. Quat. Res 47, 155–168.
Bell, G.D., Halpert, M.S., 1998. Climate assessment for 1997. Bull. Am. Meteorol. Soc.79 1014–1014.
Berkelhammer, M., Risi, C., Kurita, N., Noone, D., 2012. The moisture source andsequence for the Madden–Julian Oscillation as derived from satellite retrievalsof HDO and H2O. J. Geophys. Res 117, D03106.
Breitenbach, S., Adkins, J., Meyer, H., Marwan, N., Kumar, K., Haug, G., 2010.Strong influence of water vapor source dynamics on stable isotopes inprecipitation observed in Southern Meghalaya, NE India. Earth Planet. Sci. Lett.292, 212–220.
Bretherton, C.S., Widmann, M., Dymnikov, V.P., Wallace, J.M., Bladè, I., 1999.Effective number of degrees of freedom of a spatial field. J. Clim. 12, 1990–2009.
Burns, S.J., Matter, A., Frank, N., Mangini, A., 1998. Speleothem-based paleoclimaterecord from northern Oman. Geology 26 (6), 499–502.
Carolin, S.A., Cobb, K.M., Adkins, J.F., Clark, B., Conroy, J.L., Lejau, S., Malang, J., Tuen,A.A., Varied response of western Pacific hydrology to climate forcings over thelast glacial period. Science, in press.
Celle-Jeanton, H., Gonfiantini, R., Travi, Y., Sol, B., 2004. Oxygen-18 variations ofrainwater during precipitation: application of the Rayleigh model to selectedrainfalls in southern France. J. Hydrol. 289, 165–177.
Cobb, K.M., Adkins, J.F., Partin, J.W., Clark, B., 2007. Regional-scale climateinfluences on temporal variations of rainwater and cave dripwater oxygenisotopes in northern Borneo. Earth Planet. Sci. Lett. 263, 207–220.
Conroy, J.L., Cobb, K.M., Noone, D., Comparison of precipitation isotope variabilityacross the tropical Pacific in observations and SWING2 model simulations.J. Geophys. Res. Atmos., http://dx.doi.org/10.1002/jgrd.50412, in press.
Craig, H., 1961. Isotopic variations in meteoric waters. Science 133, 1702–1703.Dansgaard, W., 1964. Stable isotopes in precipitation. Tellus 16 (4), 436–468.Dayem, K., Molnar, P., Battisti, D., Roe, G., 2010. Lessons learned from oxygen
isotopes in modern precipitation applied to interpretation of speleothemrecords of paleoclimate from eastern Asia. Earth Planet. Sci. Lett. 295, 219–230.
J.W. Moerman et al. / Earth and Planetary Science Letters ∎ (∎∎∎∎) ∎∎∎–∎∎∎ 11
Please cite this article as: Moerman, J.W., et al., Diurnal to interannual rainfall !18O variations in northern Borneo driven byregional hydrology. Earth and Planetary Science Letters (2013), http://dx.doi.org/10.1016/j.epsl.2013.03.014i
Dykoski, C.A., Edwards, R.L., Cheng, H., Yuan, D.X., Cai, Y.J., Zhang, M.L., Lin, Y.S.,Qing, J.M., An, Z.S., Revenaugh, J., 2005. A high-resolution, absolute-datedHolocene and deglacial Asian monsoon record from Dongge Cave, China. EarthPlanet. Sci. Lett. 233, 71–86.
Field, R., Jones, D., Brown, D., 2010. Effects of postcondensation exchange on theisotopic composition of water in the atmosphere. J. Geophys. Res. 115, D24305.
Fleitmann, D., Burns, S.J., Neff, U., Mudelsee, M., Mangini, A., Matter, A., 2004.Palaeoclimatic interpretation of high-resolution oxygen isotope profiles derivedfrom annually laminated speleothems from Southern Oman. Quat. Sci. Rev. 23,935–945.
Frappier, A., Sahagian, D., Gonzalez, L.A., Carpenter, S.J., 2002. El Niño eventsrecorded by stalagmite carbon isotopes. Science 298, 565.
Frappier, A., Sahagian, D., Carpenter, S., Gonzalez, L., Frappier, B., 2007. Stalagmitestable isotope record of recent tropical cyclone events. Geology 35 (2), 111–114.
Furtado, J.C., Di Lorenzo, E., Cobb, K.M., Bracco, A., 2009. Paleoclimate reconstruc-tions of tropical sea surface temperatures from precipitation proxies: methods,uncertainties, and nonstationarity. J. Clim 22, 1104–1123.
Gao, J., Masson-Delmotte, V., Yao, T., Tian, L., Risi, C., Hoffmann, G., 2011. Precipita-tion water stable isotopes in the south Tibetan plateau: observations andmodeling. J. Clim. 24, 3161–3178.
Gat, J.R., 1996. Oxygen and hydrogen isotopes in the hydrologic cycle. Annu. Rev.Earth Planet. Sci. 24, 225–262.
Griffiths, M., Drysdale, R., Gagan, M., Zhao, J.-x., Ayliffe, L., Hellstrom, J., Hantoro, W.,Frisia, S., Feng, Y.-x., Cartwright, I., St. Pierre, E., Fischer, M., Suwargadi, B., 2009.Increasing Australian-Indonesian monsoon rainfall linked to early Holocenesea-level rise. Nat. Geosci. 2, 636–639.
Hoffmann, G., Werner, M., Heimann, M., 1998. Water isotope module of the ECHAMatmospheric general circulation model: a study on timescales from days toseveral years. J. Geophys. Res. Atmos. 103, 16871–16896.
Hoffmann, G., Ramirez, E., Taupin, J., Francou, B., Ribstein, P., Delmas, R., Dürr, H.,Gallaire, R., Simões, J., Schotterer, U., Stievenard, M., Werner, M., 2003. Coherentisotope history of Andean ice cores over the last century. Geophys. Res. Lett. 30(4), 1179.
Huffman, G., Adler, R., Bolvin, D., Gu, G., Nelkin, E., Bowman, K., Hong, Y., Stocker, E.,Wolff, D., 2007. The TRMM multisatellite precipitation analysis (TMPA): Quasi-global, multiyear, combined-sensor precipitation estimates at fine scales. J.Hydrometeorol. 8, 38–55.
International Atomic Energy Agency, 2006. Isotope Hydrology Information System.The ISOHIS Database. Available from: !http://isohis.iaea.org".
Joussaume, S., Sadourny, R., Jouzel, J., 1984. A general-circulation model of waterisotope cycles in the atmosphere. Nature 311, 24–29.
Jouzel, J., Russell, G.L., Suozzo, R.J., Koster, R.D., White, J.W.C., Broecker, W.S., 1987.Simulations of the HDO and H2 O-18 atmospheric cycles using the NASA GISSgeneral-circulation model—the seasonal cycle for present-day conditions. J.Geophys. Res. Atmos. 92 (D12), 14739–14760.
Kurita, N., Ichiyanagi, K., Matsumoto, J., Yamanaka, M., Ohata, T., 2009. Therelationship between the isotopic content of precipitation and precipitationamount in tropical regions. J. Geochem. Explor. 102, 113–122.
Kurita, N., Noone, D., Risi, C., Schmidt, G.A., Yamada, H., Yoneyama, K., 2011.Intraseasonal isotopic variation associated with the Madden–Julian Oscillation.J. Geophys. Res. 116, D24101.
Lawrence, J., Gedzelman, S., 1996. Low stable isotope ratios of tropical cyclone rains.Geophys. Res. Lett. 23 (5), 527–530.
Lawrence, J.R., Gedzelman, S.D., Dexheimer, D., Cho, H.K., Carrie, G.D., Gasparini, R.,Anderson, C.R., Bowman, K.P., Biggerstaff, M.I., 2004. Stable isotopic composi-tion of water vapor in the tropics. J. Geophys. Res. Atmos. 109, D06115.
Lee, J.-E., Fung, I., DePaolo, D., Henning, C., 2007. Analysis of the global distributionof water isotopes using the NCAR atmospheric general circulation model. J.Geophys. Res. 112, D16306.
Lee, J.-E., Fung, I., 2008. “Amount effect” of water isotopes and quantitative analysisof post-condensation processes. Hydrol. Processes 22, 1–8.
Lee, J.-E., Johnson, K., Fung, I., 2009. Precipitation over South America during theLast Glacial Maximum: an analysis of the “amount effect” with a water isotope-enabled general circulation model. Geophys. Res. Lett. 36, L19701.
LeGrande, A., Schmidt, G., Shindell, D., Field, C., Miller, R., Koch, D., Faluvegi, G.,Hoffmann, G., 2006. Consistent simulations of multiple proxy responses to anabrupt climate change event. Proc. Natl. Acad. Sci. 103, 837–842.
LeGrande, A., Schmidt, G., 2009. Sources of Holocene variability of oxygen isotopesin paleoclimate archives. Clim. Past 5, 441–445.
Lewis, S., LeGrande, A., Kelley, M., Schmidt, G., 2010. Water vapor source impacts onoxygen isotope variability in tropical precipitation during Heinrich events.Clim. Past 6, 325–340.
Liebmann, B, Smith, C., 1996. Description of a complete (interpolated) outgoinglongwave radiation dataset. Bull. Am. Meteorol. Soc. 77, 1275–1277.
Madden, R.A., Julian, P.R., 1972. Description of global-scale circulation cells intropics with a 40–50day period. J. Atmos. Sci. 29, 1109–1123.
Meckler, A., Clarkson, M., Cobb, K., Sodemann, H., Adkins, J., 2012. Interglacialhydroclimate in the tropical west Pacific through the late Pleistocene. Science336, 1301–1304.
Moerman, J.W., Cobb, K.M., Adkins, J.F., Sodemann, H., Clark, B., Tuen, A.A., 2012.Local and regional climatic controls on high-resolution rainfall and cave
dripwater oxygen isotopes in northern Borneo. Abstract PP33A-2094 presentedat 2012 Fall Meeting American Geophysical Union, San Francisco, CA, 3–7 Dec.
Noone, D., Simmonds, I., 2002. Associations between delta O-18 of water andclimate parameters in a simulation of atmospheric circulation for 1979–95. J.Clim. 15, 3150–3169.
Partin, J.W., Cobb, K.M., Adkins, J.F., Fernandez, D.P., Clark, B., 2007. Millennial-scaletrends in West Pacific Warm Pool hydrology from the Last Glacial Maximum topresent. Nature 499, 452–455.
Rasmusson, E.M., Wallace, J.M., 1983. Meteorological aspects of the El Niño/Southern Oscillation. Science 222, 1195–1202.
Reynolds, R.W., Rayner, N.A., Smith, T.M., Stokes, D.C., Wang, W., 2002. An improvedin situ and satellite SST analysis for climate. J. Clim. 15, 1609–1625.
Risi, C., Bony, S., Vimeux, F., 2008a. Influence of convective processes on the isotopiccomposition (!18O and !D) of precipitation and water vapor in the Tropics, Part2: physical interpretation of the amount effect. J. Geophys. Res. 113, D19306.
Risi, C., Bony, S., Vimeux, F., Descroix, L., Boubacar, I., Lebreton, E., Mamadou, I.,Sultan, B., 2008b. What controls the isotopic composition of the Africanmonsoon precipitation? Insights from event-based precipitation collectedduring the 2006 AMMA field campaign. Geophys. Res. Lett. 35, L24808.
Risi, C., Bony, S., Vimeux, F., Jouzel, J., 2010. Water-stable isotopes in the LMDZ4general circulation model: model evaluation for present-day and past climatesand applications to climatic interpretations of tropical isotopic records. J.Geophys. Res 115, D12118.
Rindsberger, M., Jaffe, S., Rahamim, S., Gat, J., 1990. Patterns of the isotopiccomposition of precipitation in time and space: data from the Israeli stormcollection program. Tellus 42B, 263–271.
Rozanski, K., Araguas-Araguas, L., Gonfiantini, R., 1993. Isotopic patterns in modernglobal precipitation. In: Swart, P.K., Lohmann, K.C., McKenzie, J. (Eds.), ClimateChange in Continental Isotopic Records. Geophysical Monograph, vol. 78.American Geophysical Union, Washington, DC, pp. 1–36.
Sachs, J., Sachse, D., Smittenberg, R., Zhang, Z., Battisti, D., Golubic, S., 2009.Southward movement of the Pacific intertropical convergence zone AD 1400–1850. Nat. Geosci. 2, 519–525.
Schmidt, G., LeGrande, A., Hoffman, 2007. Water isotope expressions of intrinsicand forced variability in a coupled ocean–atmosphere model. J. Geophys. Res.112, D10103.
Stewart, M., 1975. Stable isotope fractionation due to evaporation and isotopicexchange of falling waterdrops: applications to atmospheric processes andevaporation of lakes. J. Geophys. Res 80 (9), 1133–1146.
Sturm, C., Vimeux, F., Krinner, G., 2007. Intraseasonal variability in South Americarecorded in stable water isotopes. J. Geophys. Res. 112, D20118.
Sturm, C., Zhang, Q., Noone, D., 2010. An introduction to stable water isotopes inclimate models: benefits of forward proxy modeling for paleoclimatology. Clim.Past 6, 115–129.
Tian, L., Yao, T., MacClune, K., White, J., Schilla, A., Vaughn, B., Vachon, R., Ichiyanagi,K., 2007. Stable isotope variations in west China: a consideration of moisturesources. J. Geophys. Res. 112, D10112.
Tierney, J., Oppo, D., Rosenthal, Y., Russell, J., Linsley, B., 2010. Coordinatedhydrological regimes in the Indo-Pacific region during the past two millennia.Paleoceanography 25, PA1102.
Tindall, J., Valdes, P., Sime, L., 2009. Stable water isotopes in HadCM3: Isotopicsignature of El Niño Southern Oscillation and the tropical amount effect. J.Geophys. Res. Atmos. 114, D04111.
Treble, P.C., Chappell, J., Gagan, M.K., McKeegan, K.D., Harrison, T.M., 2005. In situmeasurement of seasonal delta O-18 variations and analysis of isotopic trendsin a modem speleothem from southwest Australia. Earth Planet. Sci. Lett. 233,17–32.
Tremoy, G., Vimeux, F., Mayaki, S., Souley, I., Cattani, O., Risi, C., Favreau, G., Oi, M.,2012. A 1-year long !18O record of water vapor in Niamey (Niger) revealsinsightful atmospheric processes at different timescales. Geophys. Res. Lett. 39,L08805.
Vimeux, F., Ginot, P., Schwikowski, M., Vuille, M., Hoffmann, G., Thompson, L.G.,Schotterer, U., 2009. Climate variability during the last 1000 years inferred fromAndean ice cores: a review of methodology and recent results. Palaeogeogr.Palaeoclimatol. Palaeoecol. 281, 229–241.
Vimeux, F., Tremoy, G., Risi, C., Gallaire, R., 2011. A strong control of the SouthAmerican SeeSaw on the intra-seasonal variability of the isotopic compositionof precipitation in the Bolivian Andes. Earth Planet. Sci. Lett 307, 47–58.
Vuille, M., Werner, M., Bradley, R.S., Keimig, F., 2005. Stable isotopes in precipitationin the Asian monsoon region. J. Geophys. Res. 110, D23108.
Wang, Y.J., Cheng, H., Edwards, R.L., An, Z.S., Wu, J.Y., Shen, C.C., Dorale, J.A., 2001. Ahigh-resolution absolute-dated Late Pleistocene monsoon record from HuluCave, China. Science 294, 2345–2348.
Yamanaka, T., Shimada, J., Hamada, Y., Tanaka, T., Yang, Y.H., Zhang, W.J., Hu, C.S.,2004. Hydrogen and oxygen isotopes in precipitation in the northern part ofthe north china plain: climatology and interstorm variability. Hydrol. Processes18 (12), 2211–2222.
Yuan, D.X., Cheng, H., Edwards, R.L., Dykoski, C.A., Kelly, M.J., Zhang, M.L., Qing, J.M.,Lin, Y.S., Wang, Y.J., Wu, J.Y., Dorale, J.A., An, Z.S., Cai, Y.J., 2004. Timing, durationand transition of the last interglacial Asian Monsoon. Science 304, 575–578.
Zhang, C., 2005. Madden–Julian Oscillation. Rev. Geophys. 43, RG2003.
J.W. Moerman et al. / Earth and Planetary Science Letters ∎ (∎∎∎∎) ∎∎∎–∎∎∎12
Please cite this article as: Moerman, J.W., et al., Diurnal to interannual rainfall !18O variations in northern Borneo driven byregional hydrology. Earth and Planetary Science Letters (2013), http://dx.doi.org/10.1016/j.epsl.2013.03.014i