Earnings management by ordinary and interim CEOs in Nordic countries
52
Stockholm School of Economics Bachelor’s Thesis Department of Accounting Tutor: Torkel Strömsten May 2013 Earnings management by ordinary and interim CEOs in Nordic countries Felix Bratell Ψ Gustav Toresson π Abstract: Earnings management theory predicts that incoming CEOs manipulate earnings in association with succession processes. Using data on 311 CEO changes in 217 listed firms in four Nordic countries, we examine this relationship with econometric methods, distinguishing between ordinary and interim CEOs. First, we find significant evidence for that firms on average manage earnings by 6.0% of total assets per year. Second, we present evidence indicating that incoming ordinary CEOs engage in income decreasing earnings management in the year of the change, to a magnitude of 1.5% of total assets. Third, we fail to find support in our data for that incoming ordinary CEOs manage earnings upward in the year following the transition year. Finally, we are also unsuccessful in providing evidence for the hypothesis that incoming interim CEOs engage in income increasing earnings management in the transition year. Keywords: Earnings management, CEO changes, interim CEO Ψ [email protected] π [email protected]
Transcript of Earnings management by ordinary and interim CEOs in Nordic countries

0
Stockholm School of Economics
Bachelor’s Thesis
Department of Accounting
Tutor: Torkel Strömsten
May 2013
Earnings management by ordinary and interim CEOs in Nordic countries
Felix BratellΨ Gustav Toresson
π
Abstract:
Earnings management theory predicts that incoming CEOs manipulate earnings in
association with succession processes. Using data on 311 CEO changes in 217 listed
firms in four Nordic countries, we examine this relationship with econometric
methods, distinguishing between ordinary and interim CEOs. First, we find significant
evidence for that firms on average manage earnings by 6.0% of total assets per year.
Second, we present evidence indicating that incoming ordinary CEOs engage in
income decreasing earnings management in the year of the change, to a magnitude of
1.5% of total assets. Third, we fail to find support in our data for that incoming
ordinary CEOs manage earnings upward in the year following the transition year.
Finally, we are also unsuccessful in providing evidence for the hypothesis that
incoming interim CEOs engage in income increasing earnings management in the
transition year.
Keywords: Earnings management, CEO changes, interim CEO

1
Acknowledgements
We want to express our gratitude to our tutor Torkel Strömsten, Associate Professor at
the Department of Accounting at the Stockholm School of Economics, for support
and guidance throughout the process of writing this thesis. We would also like to
thank Markus Ederwall and Fabian Bratell for insightful remarks regarding our
statistical analysis and for valuable comments on our drafts.
2
Table of Contents
1. INTRODUCTION .............................................................................................................................. 3
1.1 BACKGROUND .................................................................................................................................... 3
1.2 PURPOSE AND RESEARCH QUESTIONS ...................................................................................................... 6
1.3 DELIMITATIONS .................................................................................................................................. 7
2. LITERATURE REVIEW ...................................................................................................................... 8
2.1 THEORY ............................................................................................................................................ 8
2.2 COMPARABLE STUDIES ....................................................................................................................... 16
2.3 HYPOTHESIS FORMULATION ................................................................................................................ 19
3. EMPIRICAL APPROACH ................................................................................................................. 20
3.1 DATA SOURCES ................................................................................................................................. 20
3.2 SAMPLE .......................................................................................................................................... 20
3.3 OPERATIONALISATION OF DEPENDENT VARIABLE ..................................................................................... 22
3.4 OPERATIONALISATION OF INDEPENDENT VARIABLES ................................................................................. 24
3.5 ECONOMETRIC MODEL ....................................................................................................................... 28
4. RESULTS AND ANALYSIS ............................................................................................................... 30
4.1 EXISTENCE OF EARNINGS MANAGEMENT ................................................................................................ 30
4.2 EARNINGS MANAGEMENT AND CEO CHANGES ........................................................................................ 31
4.3 VALIDITY OF RESULTS ......................................................................................................................... 38
5. CONCLUSION AND SUGGESTIONS FOR FUTURE RESEARCH .......................................................... 42
REFERENCES ..................................................................................................................................... 44
APPENDIX ........................................................................................................................................ 49
3
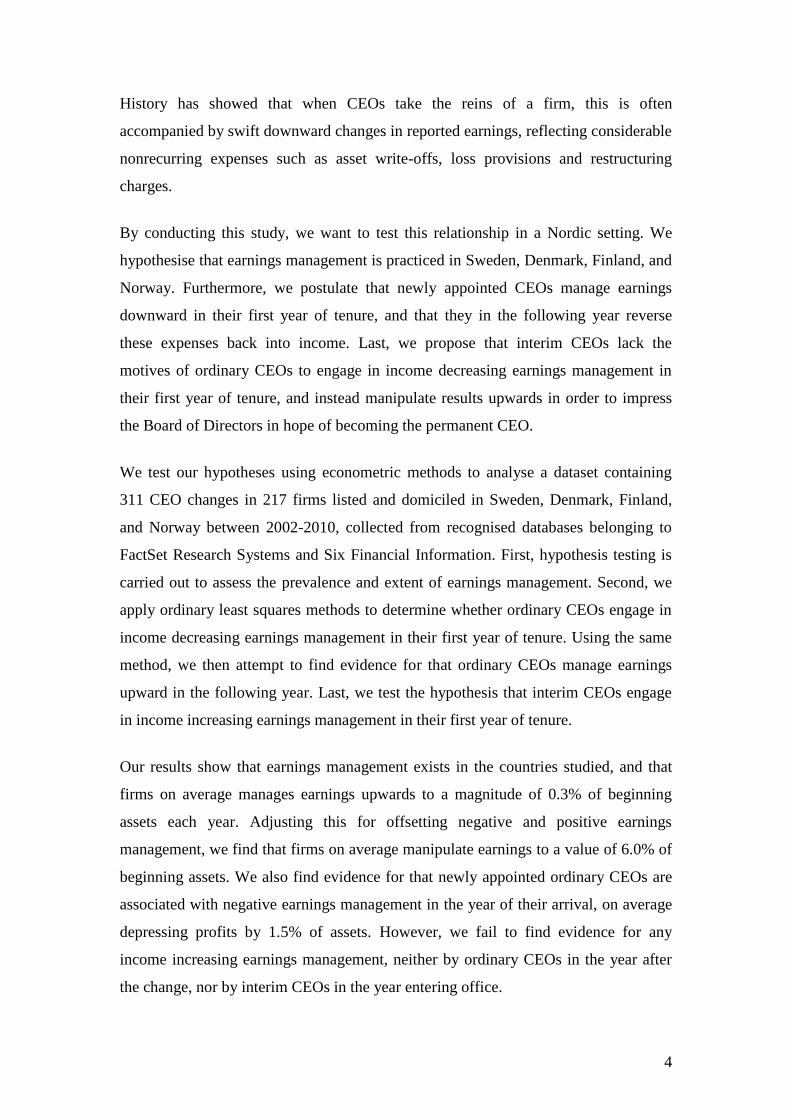
1. Introduction
In this section, we provide a background of the concept of earnings management,
present our purpose and research questions, and state the delimitations of our study.
1.1 Background
What is Lesson One in the ‘New CEO Playbook’?
During your first few weeks on the job, announce some bold initiatives to clean up the
mess left by your predecessor and try to look like a strong, decisive leader with a
solid grip on the details. Oh, and be sure to announce a streamlining of operations
and a large write-down of assets (often called a “big bath”)—the larger the write-
down, the better. Investors will be impressed, and, of course, it makes showing
earnings growth in future periods infinitely easier; you just lowered the bar by
shifting those future expenses into today’s charge. Include in your announcement the
need to write off bloated inventory and plant assets. Investors won’t even penalize the
company for the near-term loss, since it will all be packaged below the line. When
tomorrow comes, you will report much improved profits, since many of tomorrow’s
costs have already been written off as part of the special charge. (Schilit, 2002)
The single most important item in company reporting is earnings. A large and positive
bottom line indicates a sound business model, efficient operations and managerial
skill. For publicly traded firms, this often translates into a soaring stock price and
satisfied shareholders. For CEOs, large earnings are usually rewarded with large pay
checks and excellent reputation.
Given the importance of earnings, the fact that managers sometimes undertake
unconventional methods to increase them is no surprise. While most financial
reporting is subject to detailed rules and standards, a certain degree of subjective
judgements and estimations is required each year, influencing profits just as much as
notes and coins. When managers use these opportunities for their own personal gain,
it is called engaging in earnings management.
This thesis will explore the concept of earnings management. In particular, we are
interested in the association between earnings management and CEO successions.
4
History has showed that when CEOs take the reins of a firm, this is often
accompanied by swift downward changes in reported earnings, reflecting considerable
nonrecurring expenses such as asset write-offs, loss provisions and restructuring
charges.
By conducting this study, we want to test this relationship in a Nordic setting. We
hypothesise that earnings management is practiced in Sweden, Denmark, Finland, and
Norway. Furthermore, we postulate that newly appointed CEOs manage earnings
downward in their first year of tenure, and that they in the following year reverse
these expenses back into income. Last, we propose that interim CEOs lack the
motives of ordinary CEOs to engage in income decreasing earnings management in
their first year of tenure, and instead manipulate results upwards in order to impress
the Board of Directors in hope of becoming the permanent CEO.
We test our hypotheses using econometric methods to analyse a dataset containing
311 CEO changes in 217 firms listed and domiciled in Sweden, Denmark, Finland,
and Norway between 2002-2010, collected from recognised databases belonging to
FactSet Research Systems and Six Financial Information. First, hypothesis testing is
carried out to assess the prevalence and extent of earnings management. Second, we
apply ordinary least squares methods to determine whether ordinary CEOs engage in
income decreasing earnings management in their first year of tenure. Using the same
method, we then attempt to find evidence for that ordinary CEOs manage earnings
upward in the following year. Last, we test the hypothesis that interim CEOs engage
in income increasing earnings management in their first year of tenure.
Our results show that earnings management exists in the countries studied, and that
firms on average manages earnings upwards to a magnitude of 0.3% of beginning
assets each year. Adjusting this for offsetting negative and positive earnings
management, we find that firms on average manipulate earnings to a value of 6.0% of
beginning assets. We also find evidence for that newly appointed ordinary CEOs are
associated with negative earnings management in the year of their arrival, on average
depressing profits by 1.5% of assets. However, we fail to find evidence for any
income increasing earnings management, neither by ordinary CEOs in the year after
the change, nor by interim CEOs in the year entering office.

5
Our findings are stable across various model specifications and prove to be robust in
four out of five sensitivity tests challenging our econometric method.
The remainder of this paper is structured as follows. Following the introduction in
Section 1, Section 2 outlines relevant theories and literature. Section 3 describes the
data and method, while Section 4 contains the analysis of our results and a discussion
of their validity. Section 5 concludes by presenting the insights from our paper,
discussing the implications of our findings and providing suggestions for future
research.

6
1.2 Purpose and research questions
The overarching purpose of this study is to enlighten actors on a number of Nordic
stock markets on the prevalence of earnings management in connection to CEO
change processes. By being aware of the issue, equity investors, creditors, and
financial analysts can improve their decision-making, leading to more efficient
resource-allocations. We also hope that this study can be used as a scientific
foundation in discussions of stricter standard setting with regards to accruals. In
addition, our aim is to provide accounting researchers with a better understanding of
differences between newly appointed ordinary and interim CEOs and their incentives
to engage in earnings management.
More specifically, our first step is to investigate if earnings management exists among
firms listed on four Nordic stock exchanges. Second, we wish to study how CEO
changes affect earnings management behaviour in the year of the change. Third, we
want to dig deeper into how earnings management is reversed in the year following an
ordinary CEO change. Finally, we aim to provide an understanding about differences
in earnings management behaviour between ordinary and interim CEOs in association
to CEO changes. Our research questions are formalised as follows:
I. Does earnings management exist among listed Nordic firms?
II. Do newly appointed ordinary CEOs engage in income
decreasing earnings management in the year of the change?
III. Do newly appointed ordinary CEOs engage in income increasing
earnings management in the year following the change?
IV. Do newly appointed interim CEOs engage in income increasing
earnings management in the year of the change?

7
1.3 Delimitations
1.3.1 Time dimension
An important consideration when studying earnings management in association to
CEO changes is to define which of the periods surrounding the change to focus on.
This paper will exclusively study the year of the change (from here on referred to as
the transition year), and the first full financial year immediately following the change
(the post-transition year). Our intention is to study the behaviour of the incoming
CEO rather than that of the outgoing, and will thus not include the year prior to the
transition year in our study (the pre-transition year).
The study will be carried out on annual data because of two reasons. First, this
enables comparison to a larger amount of previous studies, since a majority of these
have used yearly data. Second, accruals models are usually not well specified to
detect earnings management in quarterly data (Jeter and Shivakumar, 1999).
1.3.2 Geographical dimension
The study will cover firms domiciled and listed in Sweden, Denmark, Finland and
Norway. We consider the countries culturally and institutionally similar to each other.
Moreover, all listed firms in each of these countries are required to report their
consolidated accounts according to IFRS1. Henceforth, we will refer to this
geographical region as “the Nordics”2. The purpose of the study is not to analyse
inter-country differences and therefore the countries will be treated as a region.
1.3.3 Firm dimension
Since large amounts of accounting data is needed to carry out this study, only listed
firms were included in the sample to safeguard data availability. While prior studies
usually focus on the Large Cap market segment, we include firms of all sizes to be
able to generalise our results. The study will, however, not address differences in
earnings management behaviour between firm sizes.
1 PwC: ”IFRS Adoption by Country” (2013-05-15)
2 Traditionally, Iceland is considered a part of the Nordics. However, due to the last years' economic turmoil, we decided to exclude Iceland from our study.
8
2. Literature review
This section takes a closer look at the concept of earnings management and outlines
the theories underpinning the association of earnings management and CEO changes.
It then presents a number of comparable studies, leading up to our hypotheses.
2.1 Theory
2.1.1 Principal-agent theory
Previous research commonly attempts to explain and predict accounting decisions
made by executives through the framework of the principal-agent theory (Ross,
1973; Jensen and Meckling, 1976; Fama, 1980; Eisenhardt, 1989). In the agency
literature, there is typically a principal (firm owner) concerned with inducing the
agent (CEO) to take the action the principal would take. Since the individuals are
assumed to be utility-maximising, and information asymmetry prevails because of
monitoring costs, there is a risk for moral hazard in that the CEO acts in his or her
own interests rather than in the principal’s. Closely linked to principal-agent theory is
the Positive Accounting theory, which also includes the assumptions of the principal-
agent theory to foresee accounting decisions made by firms. The theory recognises
that the CEO might engage in opportunistic behaviour for personal motives (Watts
and Zimmerman, 1990). In this framework, there is reason to believe that CEOs might
manage earnings in order to maximise the financial rewards from accounting number-
based bonus plans. Assuming the manager’s utility is also a function of non-pecuniary
benefits (such as prestige), a wish to gain a favourable reputation with the firms
stakeholders might further incentivise the CEO to engage in earnings management.
2.1.2 Earnings management
Earnings management is a term with several different definitions. In an attempt to
capture what we perceive as earnings management, we choose to define it as “a
purposeful intervention in the external financial reporting process, with the intent of
obtaining some private gain” (Schipper, 1989).
9
Financial reporting requires judgment and estimates. Due to the difficulty for an
outsider to question these subjective opinions, a firm might use its discretion over
accounting numbers to manage earnings upward or downward, depending on the
situation. This particular type of earnings management is said to be accruals-based.
Other types of earnings management include falsifying (Bruns and Merchant, 1990),
switching accounting procedures (Healy, 1985) and real earnings management
(undertaking actions impacting the underlying business activities of the firm) (Gunny,
2005). However, these fall outside of the scope of this study. Henceforth, the term
earnings management will refer to accruals-based earnings management only.
Since the cash flows of a firm must equal accounting earnings in the long run – and
accruals consequently must sum to zero over time – engaging in earnings
management in theory refers to managers shifting the timing of revenues and
expenses between periods. These shifts can be both income increasing and income
decreasing. However, due to natural reversing of accruals, earnings cannot be
continuously managed in one direction (Defond and Park, 2001). Earnings
management is also limited to influencing items that are subject to managerial
discretion, for example asset impairment, provisions for future losses, restructuring
charges and revenue recognition. The aggregation of these items is usually referred to
as discretionary accruals, which will be the proxy of earnings management in this
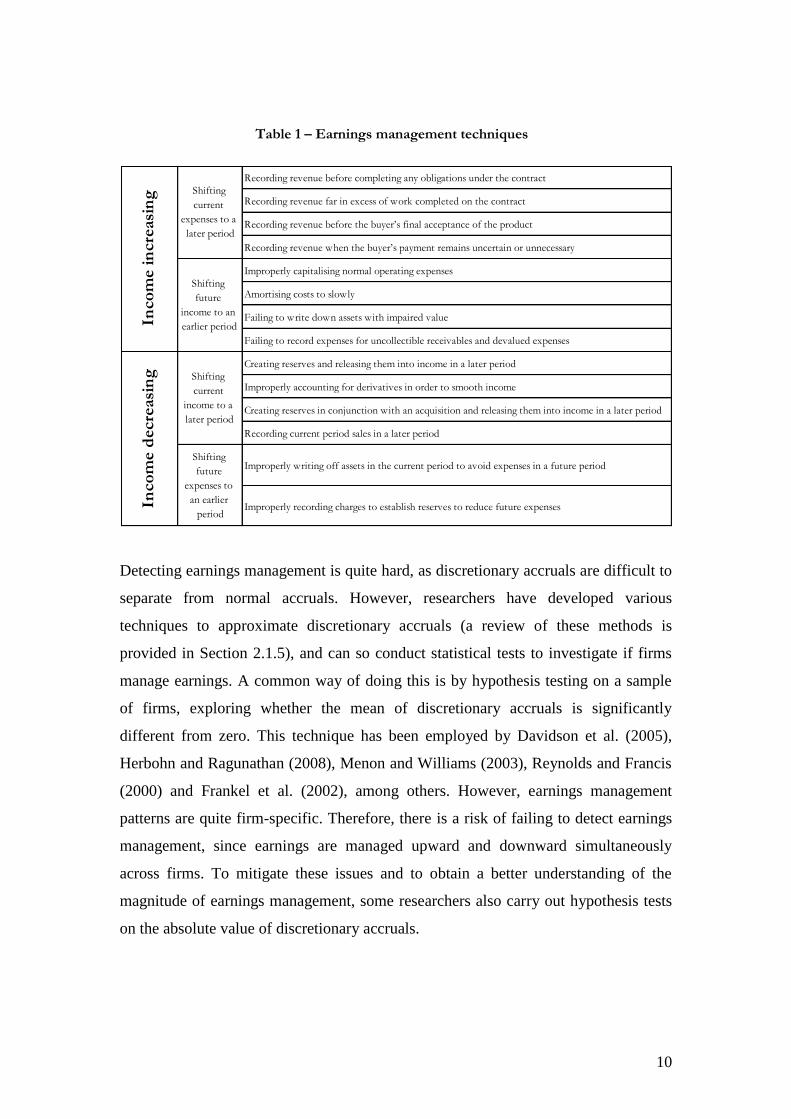
study. Table 1 outlines common earnings management techniques according to Schilit
(2002).
10
Recording revenue before completing any obligations under the contract
Recording revenue far in excess of work completed on the contract
Recording revenue before the buyer’s final acceptance of the product
Recording revenue when the buyer’s payment remains uncertain or unnecessary
Improperly capitalising normal operating expenses
Amortising costs to slowly
Failing to write down assets with impaired value
Failing to record expenses for uncollectible receivables and devalued expenses
Creating reserves and releasing them into income in a later period
Improperly accounting for derivatives in order to smooth income
Creating reserves in conjunction with an acquisition and releasing them into income in a later period
Recording current period sales in a later period
Improperly writing off assets in the current period to avoid expenses in a future period
Improperly recording charges to establish reserves to reduce future expenses
Inco
me i
ncre
asi
ng Shifting
current
expenses to a
later period
Shifting
future
income to an
earlier period
Inco
me d
ecre
asi
ng Shifting
current
income to a
later period
Shifting
future
expenses to
an earlier
period
Detecting earnings management is quite hard, as discretionary accruals are difficult to
separate from normal accruals. However, researchers have developed various
techniques to approximate discretionary accruals (a review of these methods is
provided in Section 2.1.5), and can so conduct statistical tests to investigate if firms
manage earnings. A common way of doing this is by hypothesis testing on a sample
of firms, exploring whether the mean of discretionary accruals is significantly
different from zero. This technique has been employed by Davidson et al. (2005),
Herbohn and Ragunathan (2008), Menon and Williams (2003), Reynolds and Francis
(2000) and Frankel et al. (2002), among others. However, earnings management
patterns are quite firm-specific. Therefore, there is a risk of failing to detect earnings
management, since earnings are managed upward and downward simultaneously
across firms. To mitigate these issues and to obtain a better understanding of the
magnitude of earnings management, some researchers also carry out hypothesis tests
on the absolute value of discretionary accruals.
Table 1 – Earnings management techniques
11
2.1.3 The link between earnings management and CEO changes
Incentives for CEOs to manage earnings include both financial and non-financial
rewards. A financial incentive for the CEO is maximising the payoff from variable
compensation contracts3 (bonus programs) over time. The payoff is usually
determined as a portion of earnings, as a function of other accounting items or stock
price, or through a subjective judgment passed by the Board of Directors (Bång and
Waldenström, 2009). By linking compensation to accounting numbers, shareholders
align the CEO’s interests with their own in an attempt to overcome the agency
problem (Garen, 1994). Even so, as reporting is only a proxy for firm performance, a
CEO can attain the same reward from managing earnings as from actually increasing
firm profitability.
Non-financial motives of earnings management are focused on opinions of the CEO’s
ability to create value for shareholders by achieving satisfying financial results. What
the public thinks may in turn lead to a more favourable position on the managerial
labour market. This means, that even in the complete absence of a bonus plan, CEOs
still have incentives to manage earnings.
CEO change processes provide a number of windows for earnings management,
including the pre-transition, transition and post-transition year (Wells, 2002). Both the
outgoing and the incoming CEO are consequently able to engage in earnings
management, although motives and predicted behaviour differ.
Murphy and Zimmerman (1993) puts forward two theories of earnings management
behaviour by the outgoing CEO, both of them hinging on that outgoing CEOs place
little value on future earnings compared to current period earnings. The horizon
problem predicts that outgoing CEOs will manage earnings upward in order to boost
accounting-based bonuses as much as possible before leaving the firm. The longer the
notice before they are replaced, the more outgoing CEOs can engage in this type of
activity. The cover-up hypothesis states that CEOs terminated against their will are
inclined to exercise income-increasing earnings management to regain the trust of the
shareholders and stay on the job. Both of the hypotheses regarding outgoing CEOs
thus expect earnings to be managed upward before the CEO turnover.
3 Since the purpose of our study is not to link bonus programs to earnings management, we will assume that the firms studied use
accounting-based variable compensation contracts for CEOs to an extent that affects decision-making. For evidence on Swedish firms, see Bång and Waldenström (2009).

12
In relation to CEO changes, organisational reshuffling, dismissals, and change in
strategies are carried out to reflect a new management style and to create the
impression of that the firm is “starting over” (Coyle, 2007). Literature has also
showed that new management is inclined to terminate old projects and to initiate new
programs (Elliot and Shaw, 1988). While the measures above are likely to have cash
flow effects, another important element of the succession process is a review of the
firm’s accounting numbers. This primarily involves ensuring that book values relate
to the true market value of assets, and a reassessment of risks for future losses
(Moore, 1973).
The big bath hypothesis explains the earnings management behaviour of incoming
CEOs in their first year of tenure. Generally, this year is less relevant to CEO welfare
than subsequent years. Elliot and Shaw (1988) argue that firm stakeholders generally
hold incoming CEOs less accountable than outgoing CEOs for financial performance
in the transition year. In addition to this, earnings-based bonus programs tend to only
come into operation in the first full financial year of tenure (Wells 2002). Reducing
earnings in the transition year might also lower the accounting benchmark that the
bonus is based on, letting the CEO off with less difficult standards in following years.
The view that outgoing CEOs are to blame for transition year results, and the structure
of earnings-based bonus programs, incentivises the incoming CEO to shift as much
losses as possible to the year of the change. Therefore, CEOs are often quite
pessimistic when reviewing the accounts of the firm they are entering, and record
asset impairments, provisions and other income-decreasing accruals. Future income is
then relieved of unavoidable depreciation charges, and write-backs of provisions may
be released in the years following the change, further positively affecting future
earnings. The firm can then report an improved earnings trend, attributable to the
performance of the incoming CEO. Also, these earnings are now reported in years
where earnings-based bonus programs are in full operation, maximising CEO
compensation.
In summary, because of a wish to gain a favourable reputation with firm stakeholders
and a desire to maximise the payoff from earnings-based bonus programs, we believe
that incoming CEOs will engage in income decreasing earnings management in the
transition year, and engage in income increasing earnings management in the first full
financial year following the transition year.
13
2.1.4 Interim CEOs
The circumstances surrounding CEO changes are believed to impact how and to what
extent CEOs manage earnings. Researchers of earnings management in association
with CEO changes usually contrast between different types of changes in their
studies. A common way of doing this is separating routine from non-routine changes4
(Pourciau, 1992; Murphy Zimmerman, 1993; Wells, 2002; Bengtsson et al., 2008).
The identification of routine/non-routine changes requires manual collection of
information regarding the circumstances surrounding the CEO change from company
reports, press releases and news articles. The process involves a degree of subjectivity
when reporting regarding the change is vague. Also, since firms are often reluctant to
disclose the true reason for the change, especially surrounding non-routine changes,
the sample is likely to be biased. This paper adopts a new and alternative
classification of CEO changes, which can be applied objectively, focusing on whether
the incoming CEO is classified as interim.
Ballinger and Marcel (2010) defines an interim CEO succession as when the position
as CEO is vacated by the incumbent, and the Board of Directors are yet to name a
permanent successor, but instead chooses to appoint an “interim CEO”, “acting CEO”
or “CEO until a permanent successor is named”. The position as interim CEO is by
definition temporary, and tenures are naturally on average shorter than for their
permanent counterpart.
Interim CEOs are usually recruited from inside the firm. For example, it is common
that the Chief Financial Officer (CFO), or the Chairman of the Board, steps up in
between permanent CEOs. Another recruiting channel is hiring an experienced
professional from an interim CEO consulting firm.
Interim CEOs represent an anomaly among CEOs in connection to earnings
management. While ordinary CEOs expect tenure of at least a number of years,
interim CEOs take the position knowing that the firm intends to replace him or her in
the near future. However, anecdotal evidence shows that firms may hire the interim
CEO on a permanent basis if they are satisfied with his or her performance. A famous
example is that of Apple’s former CEO, Steve Jobs, who started off as an interim
4 Examples of other ways of partitioning CEO changes include retirement/non-retirement (Butler and Newman 1989) and changes where an insider was hired/changes where an outsider was hired (Geiger and North 2006).
14
CEO, but went to become the permanent CEO of Apple and carried out what is
considered one of the greatest corporate turnarounds in U.S. history (Markoff, 2011).
While incoming permanent CEOs engage in income decreasing earnings management
because they know they can reap the fruits in coming years, the interim CEO only has
a limited time to impress the Board of Directors and firm stakeholders. While the
directors have some insight into the firm’s operations, they are unlikely to be able to
monitor each accounting decision as closely as the CEO, and may so be susceptible to
earnings management deception. However, the current state of knowledge of interim
CEO bonus schemes is limited. Therefore we will not analyse any financial
implications of earnings management for interim CEOs.
The incentives for earnings management are similar to those under the cover-up
hypothesis, but are now applied to the incoming CEO rather than to the outgoing
CEO. This leads us to believe that a wish of receiving an offer to stay on as permanent
CEO induces interim CEOs to engage in income increasing earnings management in
the transition year.
2.1.5 Discretionary accruals estimation techniques
Since earnings management cannot be directly observed, it needs to be estimated.
McNichols’s (2001) review of research designs gives an overview of the landscape of
estimation techniques. According to the author, there are three types of earnings
management estimation models: “aggregate discretionary accruals” models that set
out to capture total discretionary accruals, “specific accruals” models that use single
discretionary income statement items (such as asset impairment and provisions), and
“frequency distribution” models that examine the statistical properties of earnings to
identify behaviour that influences them. The author mentions models developed by
Healy (1985), DeAngelo (1986), Jones (1991), Dechow et al. (1995), and Kang and
Sivaramakrishnan (1995) as the most influential within aggregate discretionary
accruals approaches. Among successful specific accruals approaches the author lists
McNichols and Wilson (1988), Petroni (1992), Beaver and Engel (1996), Beneish
(1997) and Beaver and McNichols (1998). As to the frequency distribution approach,
it was developed by Burgstahler and Dichev (1997) and Degeorge et al. (1999). A
compilation of studies between 1993-1999 shows that the aggregate discretionary
15
accruals approach is the most common in earnings management studies in that time
period.
Aggregate discretionary accruals approaches are separated into two strands:
regression models and non-regression models (the Healy model and the DeAngelo
model). The assumption of stationarity in non-discretionary accruals over time
required in non-regression models is challenged by Jones (1991), who developed the
first aggregate discretionary accruals regression model to control for changing
economic circumstances for a firm. In an attempt to find a better specified and more
powerful model, Dechow et al. (1995) alter the original Jones into the Modified Jones
model, controlling for firms that exercise discretion over revenue by adjusting
changes in revenue by changes in receivables. While their modification to the model
proved successful as to the power of the proxy, they find that accruals models
generally are misspecified for samples with firms exhibiting extreme financial
performance. This is because earnings performance might be correlated with the test
variable (in our case CEO change) in earnings management tests.
Kothari et al. (2005) tested several estimation models adjusted for firm performance,
attempting to find a solution to the problem. Among the most successful ones was one
that added a term to the regression model, since then used by influential
earnings management and CEO change studies such as Wilson and Wang (2010).
This study will use this approach, referred to as the performance-adjusted Modified
Jones model, to estimate discretionary accruals.
Originally, the Jones models were always estimated through a time series regression,
where firm-specific coefficients were estimated in an estimation period. However, this
technique has suffered major criticism. Jeter and Shivakumar (1999) points out that
by requiring a long time series of data before the event period, sample sizes are often
reduced and the representativeness of the data becomes questionable due to
survivorship bias. McNichols (2001) agrees with this criticism, and adds that one
should also be careful of making the assumption that data is stationary over such a
long period. Instead, she recommends a cross-sectional approach, as first used by
Defond and Jiambalvo (1994). While the time series approach used historical accruals
to identify “normal” accruals for each firm, the cross-sectional approach puts a firm’s
accruals in relation to its industry. This introduces a limitation of the cross-sectional
16
approach, namely that it is unable to detect intra-industry contemporaneously
correlated earnings management (Peasnell et al., 1999). The approach should
consequently not be used when studying earnings management in relation to industry-
wide shocks (an example is Jones, 1991, who studies earnings management during
import relief investigations). However, this study uses the cross-sectional approach
when estimating discretionary accruals.
2.2 Comparable studies
The existence of earnings management and the link to CEO changes was presented in
the previous section. This section presents related works and digs deeper into three
studies that in different ways attempted to explore how earnings management
behaviour may vary depending on the circumstances surrounding the change.
Together with theory, these comparable studies will help us form our hypotheses,
presented in the subsequent section.
In a pioneering study, Moore (1973) examined and found discretionary income
reductions in the form of write-downs and provisions to occur more often in newly
appointed managers’ first year of tenure. The findings of new managers taking an
“earnings bath” by managing accruals were confirmed by subsequent research, which
also found the effect to be more prominent when the new manager was hired from
outside the firm (Strong and Meyer, 1987; Elliot and Shaw, 1988). Since Moore’s
study, the accounting academia have also covered scopes such as proxy contests for
board seats (DeAngelo, 1986), CEOs improving short-term earnings during their final
year in office (Butler and Newman, 1989; Dechow and Sloan, 1991), and
management buyout offers (Perry and Williams, 1994). Three studies focusing on
earnings management surrounding executive turnovers have been selected as the most
comparable to this paper and will be reviewed in detail.
Wells (2002) – “Earnings management surrounding CEO changes”
With a sample of 77 CEO turnovers in Australia during the period 1984-1994, Wells
(2002) investigated earnings management surrounding CEO changes, distinguishing
between routine and non-routine successions. Using the time series modified Jones
model to estimate discretionary accruals, Wells examined the pre-transition, transition
and the two years after the CEO change. With predictions of finding income
17
increasing earnings management in the pre-transition and post-transition year,
parametric and non-parametric tests only revealed weak empirical evidence. On the
contrary, the period following CEO changes actually revealed income decreasing
earnings management. In the transition year, the big bath hypothesis was supported
with strongest evidence in the group of non-routine CEOs, where the incoming CEO
most often is not associated with past decisions. Wells discusses that outgoing CEOs
not remaining at any position in the firm, may be limited to affect the incoming CEOs
decisions to take make large income reducing write-offs. Further, due to weaknesses
with the Modified Jones Model, Wells suggests an incorporation of lagged accruals to
the models to increase explanatory power.
While Wells study has showed a difference between routine and non-routine changes,
our paper will use a similar reasoning but focus on a different partitioning. We expect
to find differences between interim and ordinary incoming CEOs and also control for
lagged accruals in our model specifications.
Godfrey et al. (2003) – “Earnings and impression management in financial
reports: the case of CEO changes”
Godfrey et al. (2003) examined both earnings management and the presentational
format of graphs in financial reports during CEO changes. The study found strong
evidence for income-increasing earnings management in the post-transition year.
Moreover, the proxy for discretionary accruals was estimated as the change in total
accruals from one year to another, which may be considered a noisy measurement
(Wilson and Wang, 2010). By focusing on 63 firms between the years 1992-1998, the
strongest results in the sample were found in the subsample where the CEO resigned.
Godfrey et al. (2003) also interviewed six managers with first-hand experience from
Australian executive turnovers, in order to understand the extent of the phenomena.
They stated that “clearing the decks” is normal and expected during times of CEO
changes and that such activities occur even if the new CEO is an internal appointee.
In our study, we will use a more refined method than Godfrey et al. (2003) used to
estimate discretionary accruals. Further, discussions will be held regarding the
period when earnings management is predicted to be income increasing.
18
Wilson and Wang (2010) – “Earnings management following chief executive
officer changes: the effect of contemporaneous chairperson and chief financial
officer appointments”.
Arguing that the cross-sectional modified Jones model adjusted for performance
provides a more sophisticated technique to detect discretionary accruals than other
methods, Wilson and Wang (2010) study the association between earnings
management and concurrent changes in Chairman and CFO positions. When
excluding abnormal items from the estimation of accruals, they fail to provide
evidence of earnings management in the transition and post-transition year
surrounding a newly appointed CEO. When adding abnormal items to the estimation,
support was found for the big bath hypothesis in the transition year. However, when a
CEO change was accompanied by a change in Chairman, significant income-
decreasing earnings management was revealed in the transition year, whether
abnormals were included or not. The authors discuss that concurrent CEO and
Chairman appointments can be observed objectively, in contrast to routine and non-
routine changes, which is argued to require a subjective judgment. Instead, Wilson
and Wang states that their approach to a classifying CEO changes only requires data
on hiring dates.
In line with Wilson and Wang (2010), we introduce a new classification scheme for
types of incoming CEOs. We believe that annual reports provide more reliable
statements regarding if the incoming CEO is interim or not, compared to if the
turnover was classified as routine or not.
All in all, the current state of knowledge from prior research is mainly based on U.S.
and Australian papers. Differences in research design can mainly be seen in the
classification of the CEO change, the research method, and what years surrounding
the change that was studied.
19
2.3 Hypothesis formulation
As can be concluded from the literature and studies presented, ordinary CEOs are
believed to engage in income decreasing earnings management in the year of a change
and income increasing in the following year. Conversely, interim CEOs are expected
to pursue a permanent CEO position and therefore show income increasing earnings
management already in their first year of office due to expectations of short tenure.
However, to show differences between types of earnings management in years of
executive turnovers, the predicted existence of earnings management first needs to be
established. This reasoning has led us to the following hypotheses:
Hypothesis 1: Earnings management exists among listed Nordic firms.
Hypothesis 2: Newly appointed ordinary CEOs engage in income decreasing earnings
management in the transition year.
Hypothesis 3: Newly appointed ordinary CEOs engage in income increasing earnings
management in the post-transition year.
Hypothesis 4: Newly appointed interim CEOs engage in income increasing earnings
management in the transition year.
20
3. Empirical approach
In this section, we describe our sample and explain the process of estimating
discretionary accruals. Furthermore, we operationalise our independent variables
and outline the econometric models used to test our hypotheses.
3.1 Data sources
The data used in this paper was provided by FactSet Financial Information and Six
Financial Information. Financial data and firm information such as industry
classifications, exchange listings, and filing dates was collected from the FactSet
database. Data on CEO changes was supplied by Six Financial Information. All data
has been subject to a randomised double checking process, carried out through
examining annual reports, press releases and news articles.
3.2 Sample
Our initial data set comprised all Small Cap, Mid Cap and Large Cap firms listed on
the OMX Stockholm, OMX Copenhagen, OMX Helsinki and Oslo Stock Exchange.
The data collected on these firms was from the years 2002-2010. The industry
categorisation was made according to ICB5 standards, classifying firms into ten
different industries.
The elimination process was conducted step-by-step in line with prior research in the
earnings management field. First, all firms that did not have financial data available
for the full period were excluded. Then, we eliminated all firms that did not change
CEO once in the period 2002-2010. Furthermore, we decided to exclude firms with a
fiscal year end other than December, due to difficulties in data handling in connection
to CEO change dates. All firms belonging to the industry classification Financials
were then deleted, due to differences in regulation and reporting. Since our
discretionary accruals model requires more than 15 firms in an industry to provide an
accurate estimate, we eliminated all firms classified in industries with fewer than 15
firms. These were Utilities, Oil and Gas, and Telecommunications.
In line with Wilson and Wang (2010), we excluded firms with negative equity, firms
with revenue below 1% of total assets and firms with an absolute value of accruals
5 Industry Classification Benchmark is an industry classification taxonomy owned by FTSE International.
21
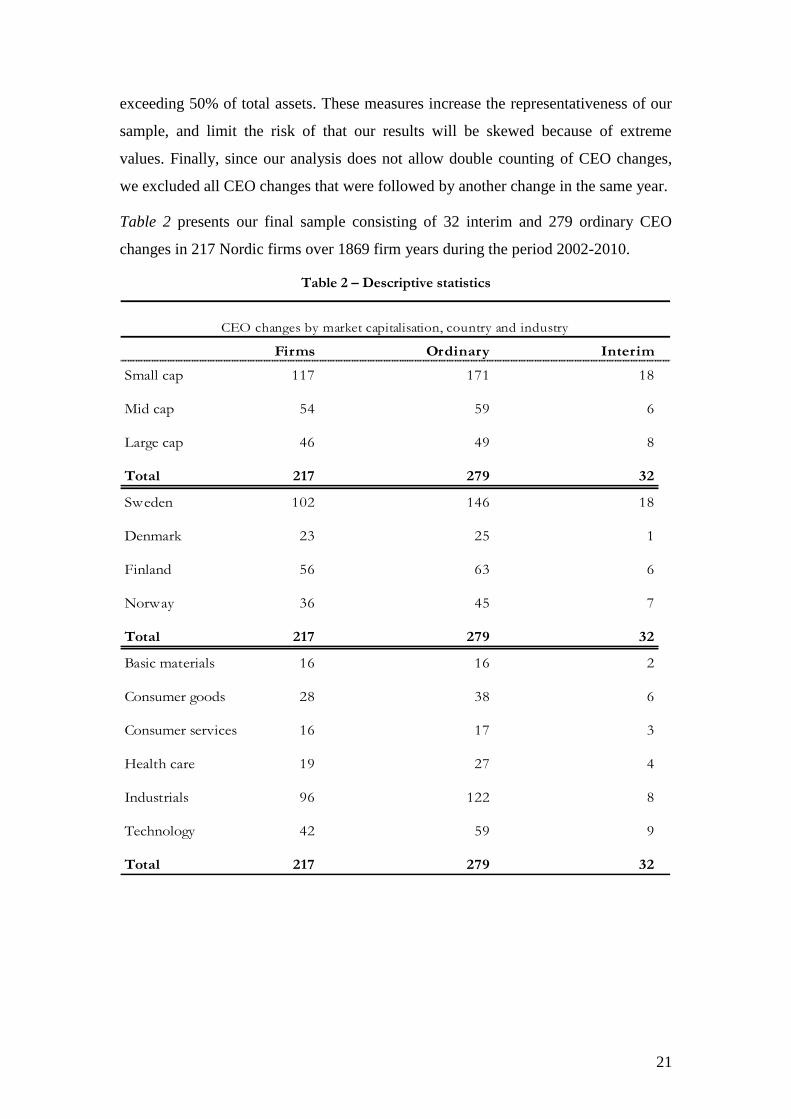
Firms Ordinary Interim
Small cap 117 171 18
Mid cap 54 59 6
Large cap 46 49 8
Total 217 279 32
Sweden 102 146 18
Denmark 23 25 1
Finland 56 63 6
Norway 36 45 7
Total 217 279 32
Basic materials 16 16 2
Consumer goods 28 38 6
Consumer services 16 17 3
Health care 19 27 4
Industrials 96 122 8
Technology 42 59 9
Total 217 279 32
CEO changes by market capitalisation, country and industry
exceeding 50% of total assets. These measures increase the representativeness of our
sample, and limit the risk of that our results will be skewed because of extreme
values. Finally, since our analysis does not allow double counting of CEO changes,
we excluded all CEO changes that were followed by another change in the same year.
Table 2 presents our final sample consisting of 32 interim and 279 ordinary CEO
changes in 217 Nordic firms over 1869 firm years during the period 2002-2010.
Table 2 – Descriptive statistics
22
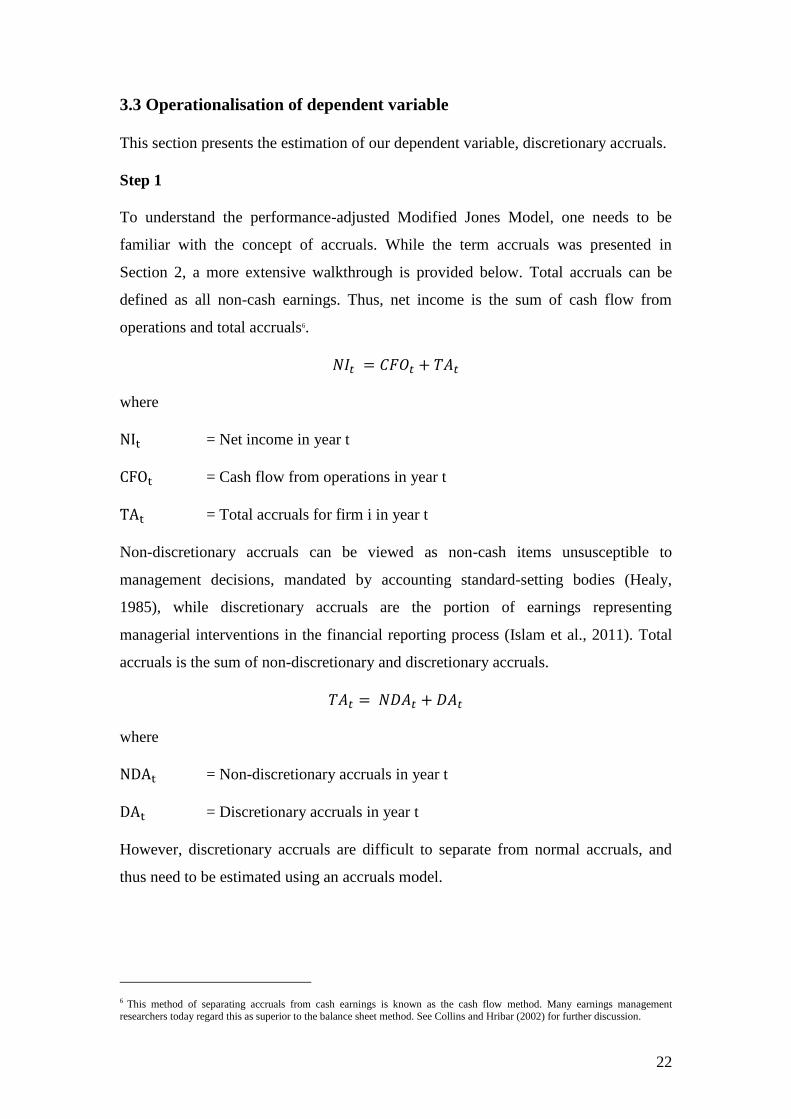
3.3 Operationalisation of dependent variable
This section presents the estimation of our dependent variable, discretionary accruals.
Step 1
To understand the performance-adjusted Modified Jones Model, one needs to be
familiar with the concept of accruals. While the term accruals was presented in
Section 2, a more extensive walkthrough is provided below. Total accruals can be
defined as all non-cash earnings. Thus, net income is the sum of cash flow from
operations and total accruals6.
where
= Net income in year t
= Cash flow from operations in year t
= Total accruals for firm i in year t
Non-discretionary accruals can be viewed as non-cash items unsusceptible to
management decisions, mandated by accounting standard-setting bodies (Healy,
1985), while discretionary accruals are the portion of earnings representing
managerial interventions in the financial reporting process (Islam et al., 2011). Total
accruals is the sum of non-discretionary and discretionary accruals.
where
= Non-discretionary accruals in year t
= Discretionary accruals in year t
However, discretionary accruals are difficult to separate from normal accruals, and
thus need to be estimated using an accruals model.
6 This method of separating accruals from cash earnings is known as the cash flow method. Many earnings management researchers today regard this as superior to the balance sheet method. See Collins and Hribar (2002) for further discussion.

23
Step 2
By regressing total accruals on the independent variables in the model for every firm-
year in our final sample using standard OLS we can derive the industry-specific
coefficients:
(
) (
) (
) (
) ( )
where
= Constant term7
= Total assets for firm i in year t-1
= Change in revenues for firm i between year t-1 and year t
= Change in receivables for firm i between year t-1 and year t
= Gross property, plant and equipment for firm i in year t
= Return on assets8 for firm i for year t-1
= Error term for firm i in year t
Step 3
Non-discretionary accruals are then computed by multiplying the firm variables in the
model with the coefficient of the industry to which the firm belongs, denoted by
, and adding a constant term .
(
) (
) (
) (
) ( )
7 The original and Modified Jones models do not contain a constant term. However, the performance-adjusted Modified Jones model includes the intercept to provide further control for heteroskedasticity and to make the model more symmetric. For further
discussion, please see Kothari et al. (2005).
8 Return on assets coefficient added to control for financial performance by Kothari et al. (2005). Return on assets has a number
of different definitions across practitioners. This study uses the definition recommended by the Swedish Society of Financial
Analysts:
where is the sum of operating income and financial income (or the sum of pretax income and
financial expenses).
24
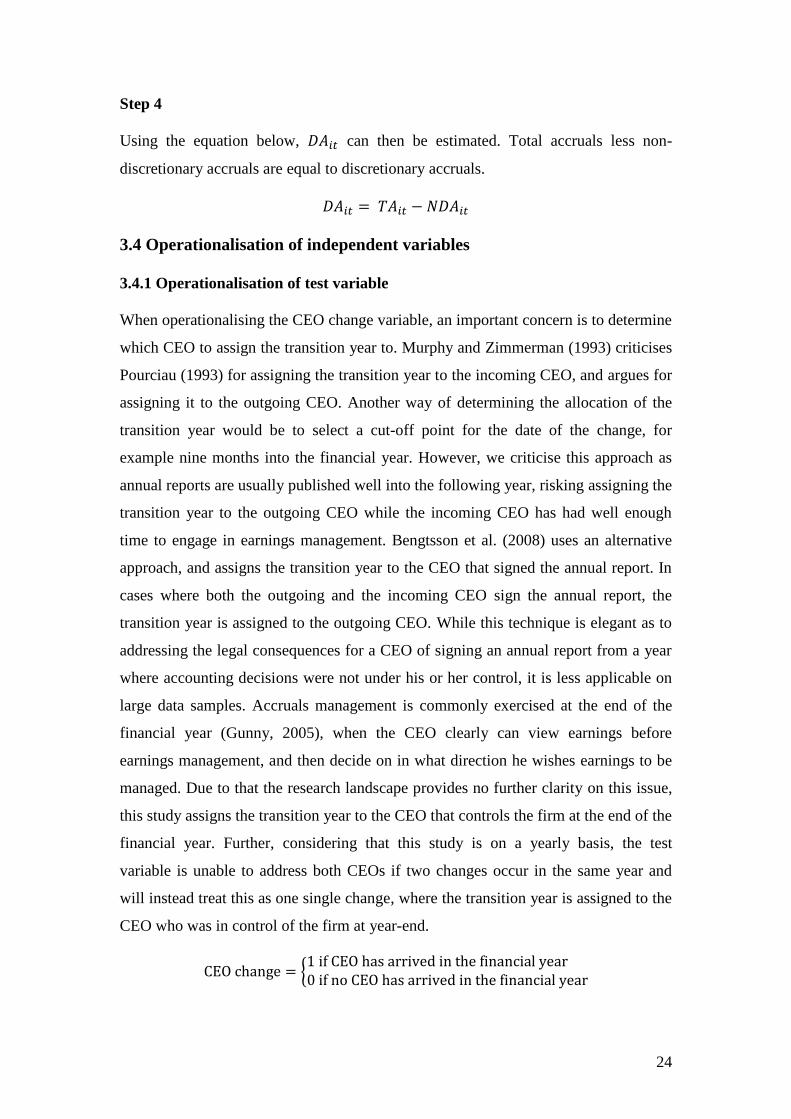
Step 4
Using the equation below, can then be estimated. Total accruals less non-
discretionary accruals are equal to discretionary accruals.
3.4 Operationalisation of independent variables
3.4.1 Operationalisation of test variable
When operationalising the CEO change variable, an important concern is to determine
which CEO to assign the transition year to. Murphy and Zimmerman (1993) criticises
Pourciau (1993) for assigning the transition year to the incoming CEO, and argues for
assigning it to the outgoing CEO. Another way of determining the allocation of the
transition year would be to select a cut-off point for the date of the change, for
example nine months into the financial year. However, we criticise this approach as
annual reports are usually published well into the following year, risking assigning the
transition year to the outgoing CEO while the incoming CEO has had well enough
time to engage in earnings management. Bengtsson et al. (2008) uses an alternative
approach, and assigns the transition year to the CEO that signed the annual report. In
cases where both the outgoing and the incoming CEO sign the annual report, the
transition year is assigned to the outgoing CEO. While this technique is elegant as to
addressing the legal consequences for a CEO of signing an annual report from a year
where accounting decisions were not under his or her control, it is less applicable on
large data samples. Accruals management is commonly exercised at the end of the
financial year (Gunny, 2005), when the CEO clearly can view earnings before
earnings management, and then decide on in what direction he wishes earnings to be
managed. Due to that the research landscape provides no further clarity on this issue,
this study assigns the transition year to the CEO that controls the firm at the end of the
financial year. Further, considering that this study is on a yearly basis, the test
variable is unable to address both CEOs if two changes occur in the same year and
will instead treat this as one single change, where the transition year is assigned to the
CEO who was in control of the firm at year-end.
{
25
3.4.2 Operationalisation of control variables
Earnings management has been proved to correlate with a number of different factors
in previous studies. The factors we have chosen to control for and their definitions are
outlined below.
Leverage
DeFond & Jiambalvo (1994) found evidence that companies with high leverage use
accruals strategies to manipulate reported earnings to stay within the terms of their
debt covenant agreements. Therefore, high leverage is expected to correlate positively
with discretionary accruals.
This paper will base the leverage variable on book value rather than market value
mainly because of three reasons. First, market values of debt tend to be difficult to
find for a large number of firms in our sample. Second, book values are more stable
over time, providing a more representative view of a firm’s financial position at a
given point in time. Last, the theory surrounding earnings management and leverage
are tied to debt covenants, which are commonly based on book values rather than
market values. The variable is defined as the ratio of book value of interest-bearing
liabilities to the book value of equity.
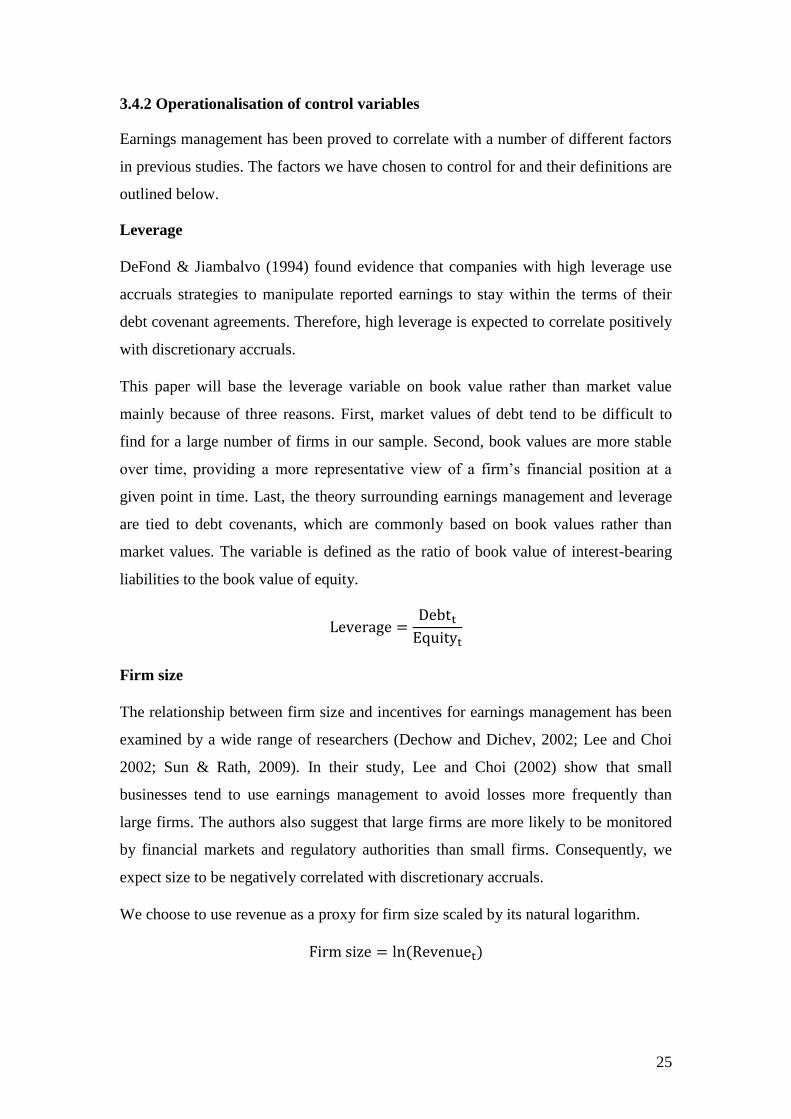
Firm size
The relationship between firm size and incentives for earnings management has been
examined by a wide range of researchers (Dechow and Dichev, 2002; Lee and Choi
2002; Sun & Rath, 2009). In their study, Lee and Choi (2002) show that small
businesses tend to use earnings management to avoid losses more frequently than
large firms. The authors also suggest that large firms are more likely to be monitored
by financial markets and regulatory authorities than small firms. Consequently, we
expect size to be negatively correlated with discretionary accruals.
We choose to use revenue as a proxy for firm size scaled by its natural logarithm.
( )
26
Lagged accruals
Following Geiger and North (2006) and Wilson & Wang (2010) we control for the
natural reversing of accruals. This is because of the likelihood that large discretionary
accruals are followed by reversed discretionary accruals the following year. The
variable controlling for lagged accruals is designed as lagged accruals scaled by
lagged assets.
Cash flow from operations
Dechow and Dichev (2002) found that cash flow from operations is to be negatively
correlated with short-term discretionary accruals in the form of working capital. They
argue that firms with high cash flows have a reduced need for positive accruals. This
finding has been confirmed in later studies (Menon and Williams 2004; Wilson &
Wang 2010) and will therefore also be controlled for in this study.
Business cycle
We argue that firms’ stakeholders have lower expectations on reported earnings
during recessions. Therefore, we believe that managers might shift future expenses to
the current period, and blame the poor performance on the business cycle. We choose
to control for fluctuations in the economy by defining a control variable as the
Industrial Production Index (IPI) with the base in 2010, weighted with country
population.
27
IFRS
Aussenegg et al. (2008) examined the impact of IFRS on earnings management in
Europe and noted no difference in the level of earnings management. In a later study,
Callao and Jarne (2010) found that earnings management actually increased in Europe
after the introduction of IFRS. Judging by their findings, we expect the introduction
of IFRS to be positively correlated with discretionary accruals.
We will control for the impact of the introduction of IFRS on earnings management
with a dummy variable, indicating 1 if the year is 2005 or later and 0 if otherwise.
IFRS {
Earnings bath
Previous studies have found that when managers recognise that their firm will take a
loss, they take further income decreasing accounting actions because the incremental
loss of shifting more expenses to the current period is low (Healy 1985). This is
commonly referred to as an earnings bath9. In the absence of a consensus in prior
literature regarding the design of the variable controlling for earnings baths, we have
chosen our own definition. If a firm’s return on assets before discretionary accruals
(ROABD) is lower than -5%, the value is assigned to the variable. Otherwise it takes
the value of zero.
{
9 The term “earnings bath” or “big-bath” is also used to describe the income-decreasing actions taken by new CEOs in the transition year.
28
Positive earnings
Burgstahler & Dichev (1997) provide evidence for that when firms are just below
zero earnings, they engage in income increasing earnings management to avoid
reporting a loss. We choose to measure this as when return on assets before
discretionary accruals is below 0%, but not so far below that the firm decides to take
an earnings bath. The variable takes the value of return on assets before discretionary
accruals if between -5% and 0%. Otherwise it takes the value of zero.
{
Fixed effects
Wooldridge (2006) suggests that model specifications where the dependent variable is
likely to be affected by unobserved, time-invariant factors should be run as fixed
effects regressions to control for these effects. Our dataset contains a number of
variables that need to be controlled for by fixed effects, namely year, industry, firm
and country. An example of this could be that some firms inherently manage earnings
more than others due to corporate culture. For this reason, we will control for fixed
effects in our model.
3.5 Econometric model
The existence of earnings management and its association with CEO changes are
analysed using recognised methods widely applied in previous earnings management
studies. As the sample sizes of the respective model specifications exceed 30,
discretionary accruals are approximately normally distributed according to the central
limit theorem (Newbold, 2007), allowing for hypothesis testing using a t-test.
Hypothesis 1, predicting that earnings management exists among listed Nordic firms,
is tested by carrying out a two-sided t-test of that the population mean of discretionary
accruals does not equal zero on conventional significance levels. Since the hypothesis
disregards the sign of the mean, a complimentary t-test is done on the absolute value
of discretionary accruals. The same rejection rule applies to this test.
Hypothesis 2-4, stating the link between earnings management and CEO changes, is
tested by employing a series of ordinary least squares (OLS) regression models. Using
this technique, we can examine the statistical significance of the correlation between
29
discretionary accruals and CEO changes. Regression analysis allows us to hold a
number of control variables fixed to disentangle the unbiased (unaffected by other
variables) association between earnings management and CEO changes. While OLS
is a powerful tool when establishing relationships between variables, one should be
cautious with assuming causality. Rather, a discussion needs to be held to provide
arguments for as to why the association does not suffer from problems such as
spurious correlation or reverse causality.
In order to carefully trail the effects of our control variables on the estimated
correlation coefficient, a four-step framework is used to test each hypothesis. First, we
apply a baseline regression without any control variables. Second, we add a set of
initial controls, including leverage, firm size, cash flow from operations, lagged
accruals, business cycle and IFRS. The third step adds benchmark controls, which are
earnings bath, and positive earnings. Last, we add fixed effects variables to control
for time-invariant factors. These are year effects, industry effects, firm-specific effects
and country effects. The four steps are labeled Model specifications 1-4. For detailed
specifications, see Appendix.
As this study is limited to studying the effects of CEO changes on earnings
management, we are only interested in the coefficient on the CEO change variable.
While coefficients from all specifications will be analysed, the final conclusions will
be drawn from Specification (4), as this specification is least likely to be biased. For
Hypothesis 2, a significantly negative coefficient, will lead us to reject the null
hypothesis. For Hypothesis 3 and 4, however, we reject the null hypothesis if the
coefficient is significantly positive.
30
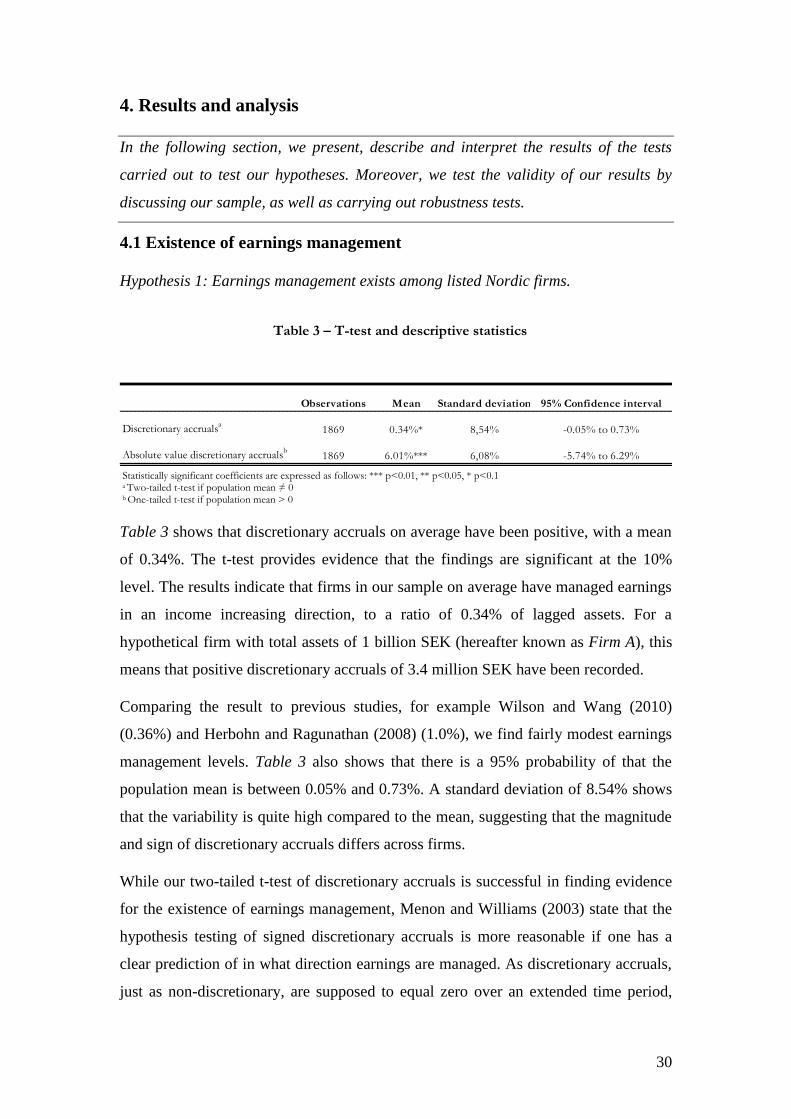
Table 3 – T-test and descriptive statistics
4. Results and analysis
In the following section, we present, describe and interpret the results of the tests
carried out to test our hypotheses. Moreover, we test the validity of our results by
discussing our sample, as well as carrying out robustness tests.
4.1 Existence of earnings management
Hypothesis 1: Earnings management exists among listed Nordic firms.
Table 3 shows that discretionary accruals on average have been positive, with a mean
of 0.34%. The t-test provides evidence that the findings are significant at the 10%
level. The results indicate that firms in our sample on average have managed earnings
in an income increasing direction, to a ratio of 0.34% of lagged assets. For a
hypothetical firm with total assets of 1 billion SEK (hereafter known as Firm A), this
means that positive discretionary accruals of 3.4 million SEK have been recorded.
Comparing the result to previous studies, for example Wilson and Wang (2010)
(0.36%) and Herbohn and Ragunathan (2008) (1.0%), we find fairly modest earnings
management levels. Table 3 also shows that there is a 95% probability of that the
population mean is between 0.05% and 0.73%. A standard deviation of 8.54% shows
that the variability is quite high compared to the mean, suggesting that the magnitude
and sign of discretionary accruals differs across firms.
While our two-tailed t-test of discretionary accruals is successful in finding evidence
for the existence of earnings management, Menon and Williams (2003) state that the
hypothesis testing of signed discretionary accruals is more reasonable if one has a
clear prediction of in what direction earnings are managed. As discretionary accruals,
just as non-discretionary, are supposed to equal zero over an extended time period,
Observations Mean Standard deviation 95% Confidence interval
Discretionary accrualsa
1869 0.34%* 8,54% -0.05% to 0.73%
Absolute value discretionary accrualsb
1869 6.01%*** 6,08% -5.74% to 6.29%
Statistically significant coefficients are expressed as follows: *** p<0.01, ** p<0.05, * p<0.1
a Two-tailed t-test if population mean ≠ 0
b One-tailed t-test if population mean > 0
31
income increasing and income decreasing discretionary accruals from a sample with
firms with heterogeneous motives of earnings management may offset each other and
prevent detection. Therefore, along with Reynolds and Francis (2000) and Menon and
Williams (2003), we conduct a t-test on the absolute value of discretionary accruals in
order to shine further light on the issue.
The results of the one-sided t-test show a sample mean of 6.01%, significant at a 1%
level. This means that a firm with 1 billion SEK total assets records discretionary
accruals to a value of SEK 60.1 million, regardless the direction of earnings
management. This may be compared to the studies previously mentioned, where both
Menon and Williams (2003) (10.36%) and Reynolds and Francis (2000) (8.72%) find
larger discretionary accruals.
Our results are consistent with the Positive Accounting Theory, predicting that
executives make opportunistic accounting decisions in their own interests.
The null hypothesis of no earnings management in Nordic countries can be rejected
on a 10% significance level.
4.2 Earnings management and CEO changes
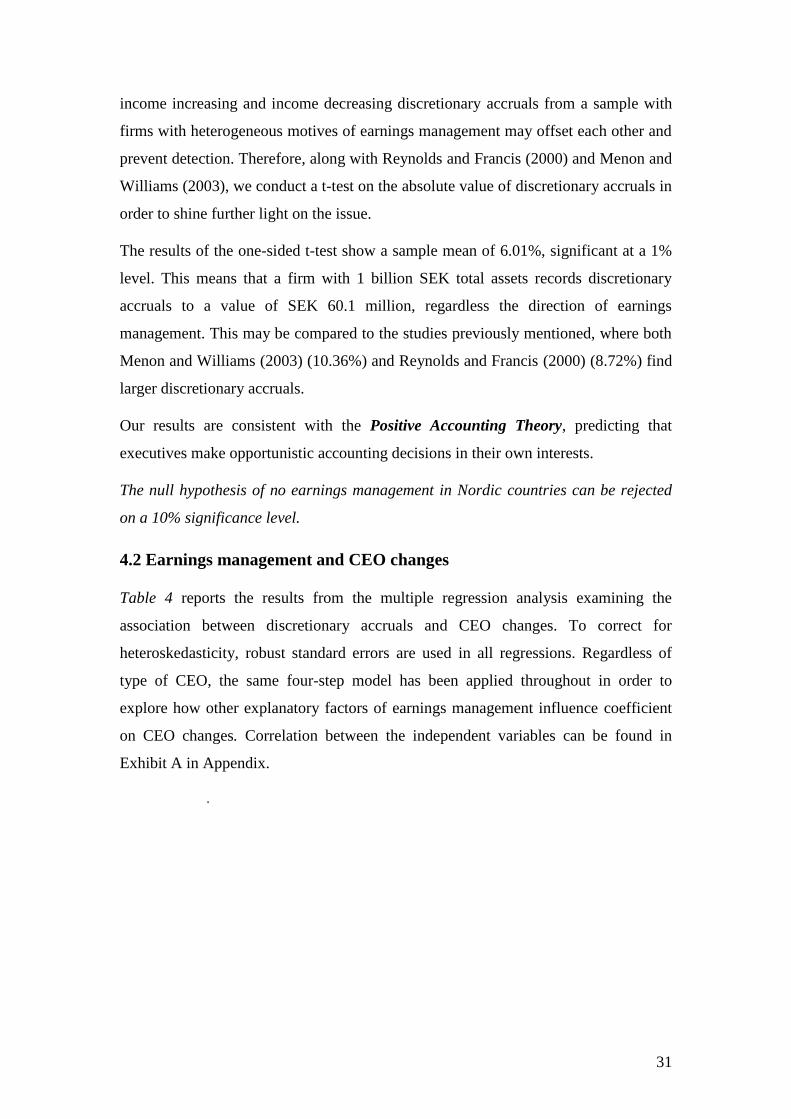
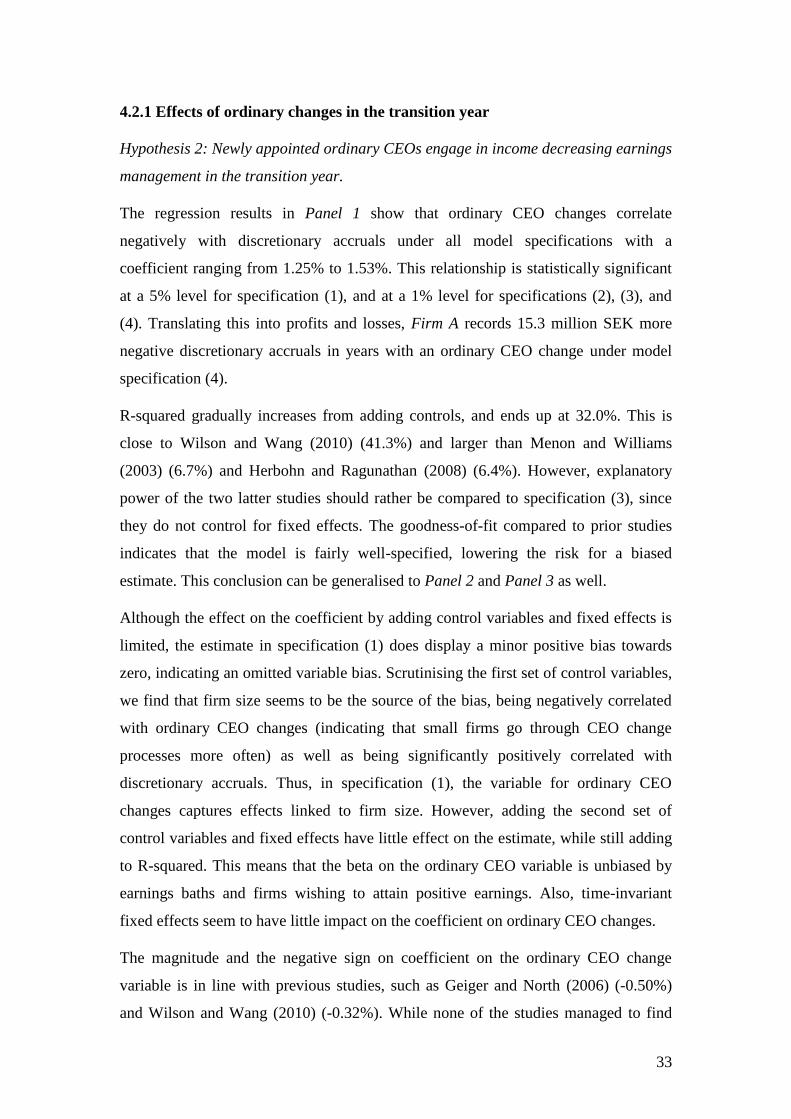
Table 4 reports the results from the multiple regression analysis examining the
association between discretionary accruals and CEO changes. To correct for
heteroskedasticity, robust standard errors are used in all regressions. Regardless of
type of CEO, the same four-step model has been applied throughout in order to
explore how other explanatory factors of earnings management influence coefficient
on CEO changes. Correlation between the independent variables can be found in
Exhibit A in Appendix.
.
32
Model specification (1) (2) (3) (4)
Baseline x x x x
Controlsa
x x x
Benchmark controlsb
x x
Fixed effectsc
x
Panel 1
Ordinary CEO - Transition year -1.25%** -1.51%*** -1.53%*** -1.53%***
Robust standard errors 0.60% 0.58% 0.56% 0.56%
Observations 1869 1868 1868 1868
R-squared 0.3% 8.4% 14.3% 32.0%
Panel 2
Ordinary CEO - Post-transition year 0.14% 0.36% 0.22% 0.38%
Robust standard errors 0.72% 0.68% 0.68% 0.65%
Observations 1862 1861 1861 1861
R-squared 0.0% 6.8% 19.5% 38.4%
Panel 3
Interim CEO - Transition year 1.37% 0.70% 0.57% 0.59%
Robust standard errors 1.88% 1.69% 1.50% 1.63%
Observations 1869 1868 1868 1868
R-squared 0.0% 8.0% 13.9% 25.2%
Discretionary accruals
Ordinary least squares: Controls and Fixed effects
Table 4 – Regression results
Note: Ordinary least squares for 2002-2010. Regressions of discretionary accruals on CEO changes (% of beginning assets). Statistically significant coefficients are expressed as follows: *** p<0.01, ** p<0.05, * p<0.1 aControls: Leverage, Firm size, Cash flow from operations, Lagged accruals, IFRS, Business cycle bBenchmark controls: Earnings bath, Positive earnings cFixed effects: Year, Industry, Firm and Country
33
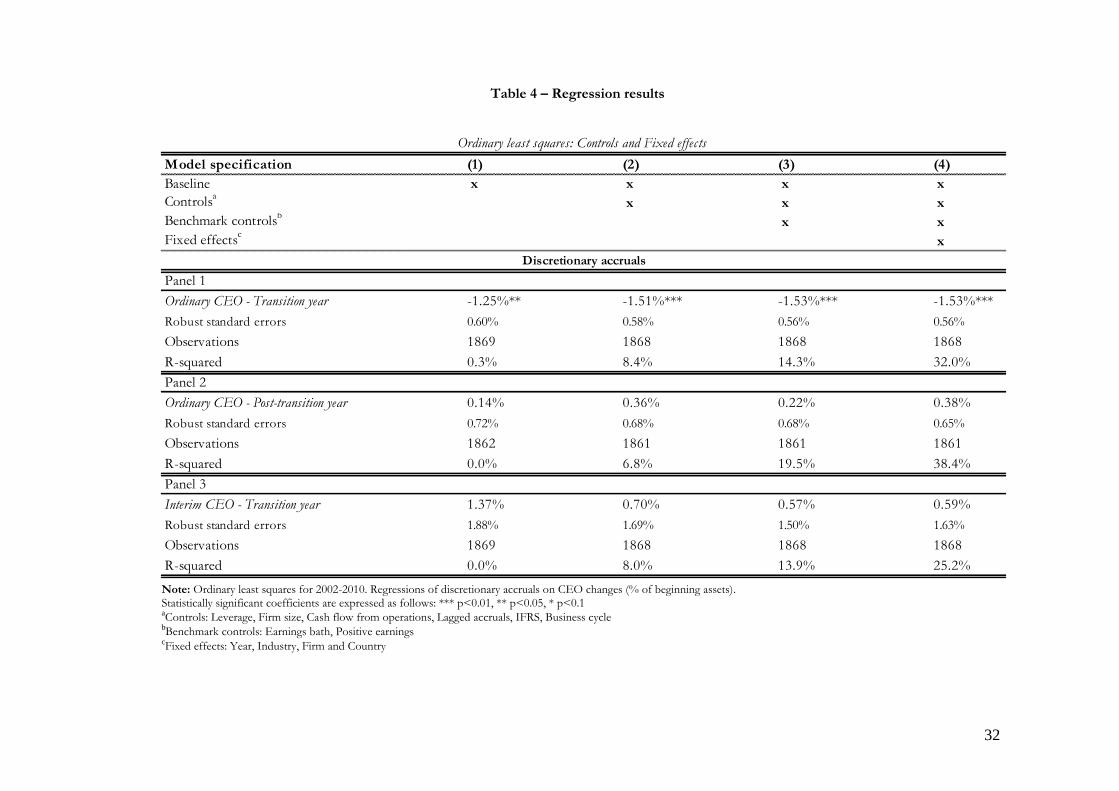
4.2.1 Effects of ordinary changes in the transition year
Hypothesis 2: Newly appointed ordinary CEOs engage in income decreasing earnings
management in the transition year.
The regression results in Panel 1 show that ordinary CEO changes correlate
negatively with discretionary accruals under all model specifications with a
coefficient ranging from 1.25% to 1.53%. This relationship is statistically significant
at a 5% level for specification (1), and at a 1% level for specifications (2), (3), and
(4). Translating this into profits and losses, Firm A records 15.3 million SEK more
negative discretionary accruals in years with an ordinary CEO change under model
specification (4).
R-squared gradually increases from adding controls, and ends up at 32.0%. This is
close to Wilson and Wang (2010) (41.3%) and larger than Menon and Williams
(2003) (6.7%) and Herbohn and Ragunathan (2008) (6.4%). However, explanatory
power of the two latter studies should rather be compared to specification (3), since
they do not control for fixed effects. The goodness-of-fit compared to prior studies
indicates that the model is fairly well-specified, lowering the risk for a biased
estimate. This conclusion can be generalised to Panel 2 and Panel 3 as well.
Although the effect on the coefficient by adding control variables and fixed effects is
limited, the estimate in specification (1) does display a minor positive bias towards
zero, indicating an omitted variable bias. Scrutinising the first set of control variables,
we find that firm size seems to be the source of the bias, being negatively correlated
with ordinary CEO changes (indicating that small firms go through CEO change
processes more often) as well as being significantly positively correlated with
discretionary accruals. Thus, in specification (1), the variable for ordinary CEO
changes captures effects linked to firm size. However, adding the second set of
control variables and fixed effects have little effect on the estimate, while still adding
to R-squared. This means that the beta on the ordinary CEO variable is unbiased by
earnings baths and firms wishing to attain positive earnings. Also, time-invariant
fixed effects seem to have little impact on the coefficient on ordinary CEO changes.
The magnitude and the negative sign on coefficient on the ordinary CEO change
variable is in line with previous studies, such as Geiger and North (2006) (-0.50%)
and Wilson and Wang (2010) (-0.32%). While none of the studies managed to find
34
support in data for a statistically significant correlation between firm years with CEO
changes and discretionary accruals, one should note that the comparability of this
study to their’s is incomplete due to measurement differences. Wilson and Wang
(2010) for instance adjusts their discretionary accruals estimate for extraordinary
items. This is likely to give the study a smaller coefficient, since earnings
management during CEO changes often take the form of large one-time asset
impairments. However, the scope of our study is to capture these one-offs, and thus
these are included in our proxy for earnings management.
While successful in proving correlation, further discussion is needed to infer a causal
relationship. We believe that our model is well-specified in controlling for other
factors that influence earnings management. However, we cannot totally rule out
spurious correlation. It might be the case that write-downs and provisions for future
losses are not caused by the CEO change per se, but rather is a new, accurate
judgement of the benefits expected to flow from a firm’s assets, in light of the poor
financial performance that brings about the CEO change. While financial performance
is controlled for in our estimation of discretionary accruals, we do recognise that this
method may not capture all aspects. Even so, we argue that the problems of spurious
correlation are limited and should not change our conclusions. Another issue is that of
reverse causality. One could contend that large negative discretionary accruals is what
causes the CEO change, leading us to wrongly infer that CEOs manage earnings.
Since our definition of CEO changes makes sure that changes occur prior to closing
the books of a financial year, we believe that the probability of this being the case is
low. To conclude, while we are aware of the difficulties of claiming causality, we
argue that our findings indicate a causal association between ordinary CEO changes
and earnings management.
The results provide significant evidence for that the big-bath hypothesis is accurate in
its predictions that incoming CEOs manage earnings downward in the transition year.
The null hypothesis that newly appointed ordinary CEOs do not engage in income
decreasing earnings management in the transition year can be rejected in all model
specifications.
35
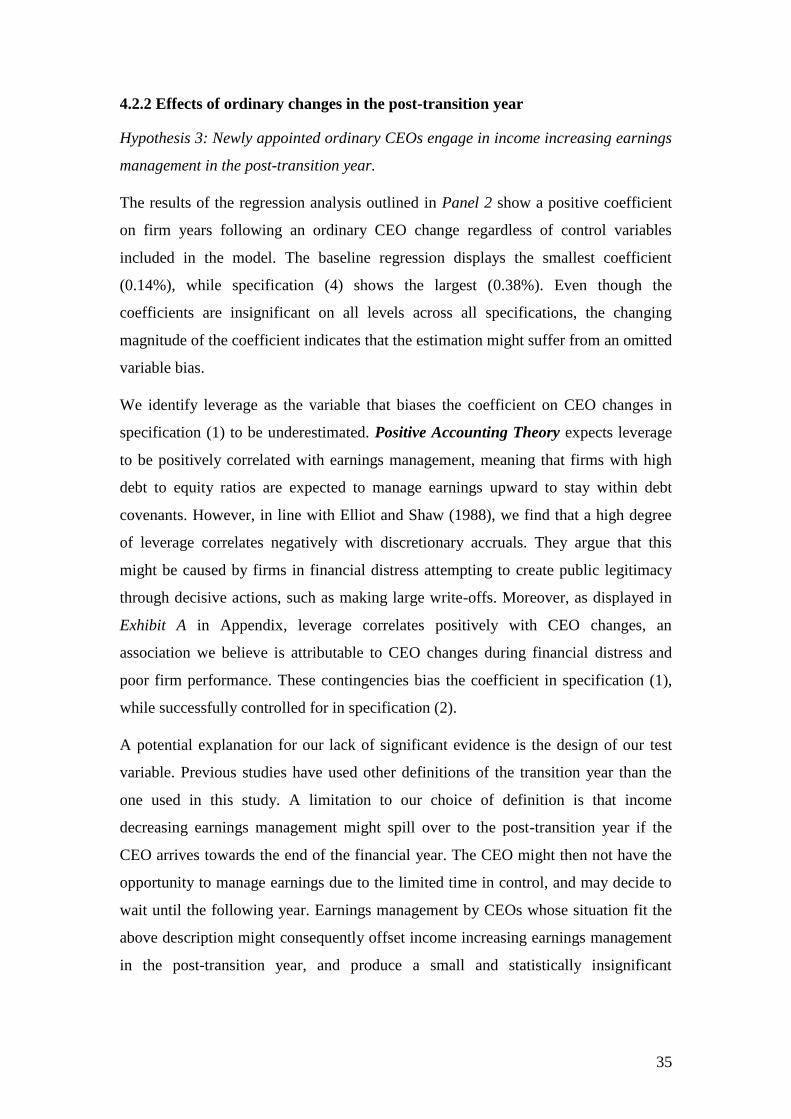
4.2.2 Effects of ordinary changes in the post-transition year
Hypothesis 3: Newly appointed ordinary CEOs engage in income increasing earnings
management in the post-transition year.
The results of the regression analysis outlined in Panel 2 show a positive coefficient
on firm years following an ordinary CEO change regardless of control variables
included in the model. The baseline regression displays the smallest coefficient
(0.14%), while specification (4) shows the largest (0.38%). Even though the
coefficients are insignificant on all levels across all specifications, the changing
magnitude of the coefficient indicates that the estimation might suffer from an omitted
variable bias.
We identify leverage as the variable that biases the coefficient on CEO changes in
specification (1) to be underestimated. Positive Accounting Theory expects leverage
to be positively correlated with earnings management, meaning that firms with high
debt to equity ratios are expected to manage earnings upward to stay within debt
covenants. However, in line with Elliot and Shaw (1988), we find that a high degree
of leverage correlates negatively with discretionary accruals. They argue that this
might be caused by firms in financial distress attempting to create public legitimacy
through decisive actions, such as making large write-offs. Moreover, as displayed in
Exhibit A in Appendix, leverage correlates positively with CEO changes, an
association we believe is attributable to CEO changes during financial distress and
poor firm performance. These contingencies bias the coefficient in specification (1),
while successfully controlled for in specification (2).
A potential explanation for our lack of significant evidence is the design of our test
variable. Previous studies have used other definitions of the transition year than the
one used in this study. A limitation to our choice of definition is that income
decreasing earnings management might spill over to the post-transition year if the
CEO arrives towards the end of the financial year. The CEO might then not have the
opportunity to manage earnings due to the limited time in control, and may decide to
wait until the following year. Earnings management by CEOs whose situation fit the
above description might consequently offset income increasing earnings management
in the post-transition year, and produce a small and statistically insignificant
36
coefficient. Furthermore, this reversing of accruals might be extended to several
years, and dilute the coefficient magnitude in the post-transition year.
Another reason that might explain why we fail to find a significant correlation could
be that we focus on the type of CEO, rather than on the type of change. Pourciau
(1993), partitioning between routine and non-routine CEO changes, provides evidence
for earnings management in the post-transition year after non-routine changes,
indicating that a similar division might have helped us in proving our hypothesis.
However, Godfrey et al. (2003) finds support for income increasing earnings
management in the post-transition year with no such distinction. Wells (2002) does
the same division of CEO changes as Pourciau (1993) does, but actually finds
significantly negative discretionary accruals in the post-transition year. It is evident
that previous literature does not provide a clear view on earnings management in the
year after CEO changes. However, we do regard the decision not to partition CEO
changes into routine and non-routine as a possible explanation as to why we cannot
arrive at significant findings.
In summary, theory predicts natural reversing of accruals, which is when an ordinary
CEOs manages earnings upward in the post-transition year. Stakeholders now hold
them accountable for financial results, and bonus programs have come into full
operation, leaving the CEO with both a non-financial and a financial upside.
However, our results fail to show any significant evidence for CEOs engaging in
income increasing earnings management in the post-transition year.
The null hypothesis that newly appointed ordinary CEOs do not engage in income
increasing earnings management in the post-transition year cannot be rejected in any
model specification.
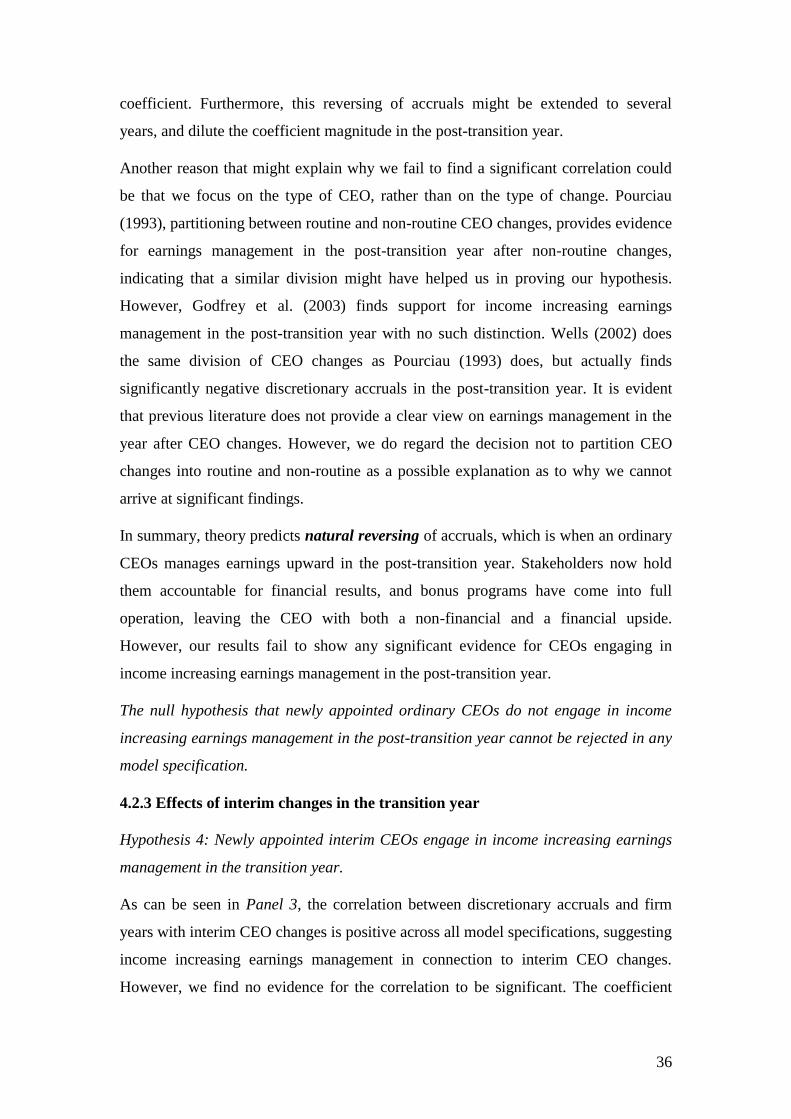
4.2.3 Effects of interim changes in the transition year
Hypothesis 4: Newly appointed interim CEOs engage in income increasing earnings
management in the transition year.
As can be seen in Panel 3, the correlation between discretionary accruals and firm
years with interim CEO changes is positive across all model specifications, suggesting
income increasing earnings management in connection to interim CEO changes.
However, we find no evidence for the correlation to be significant. The coefficient
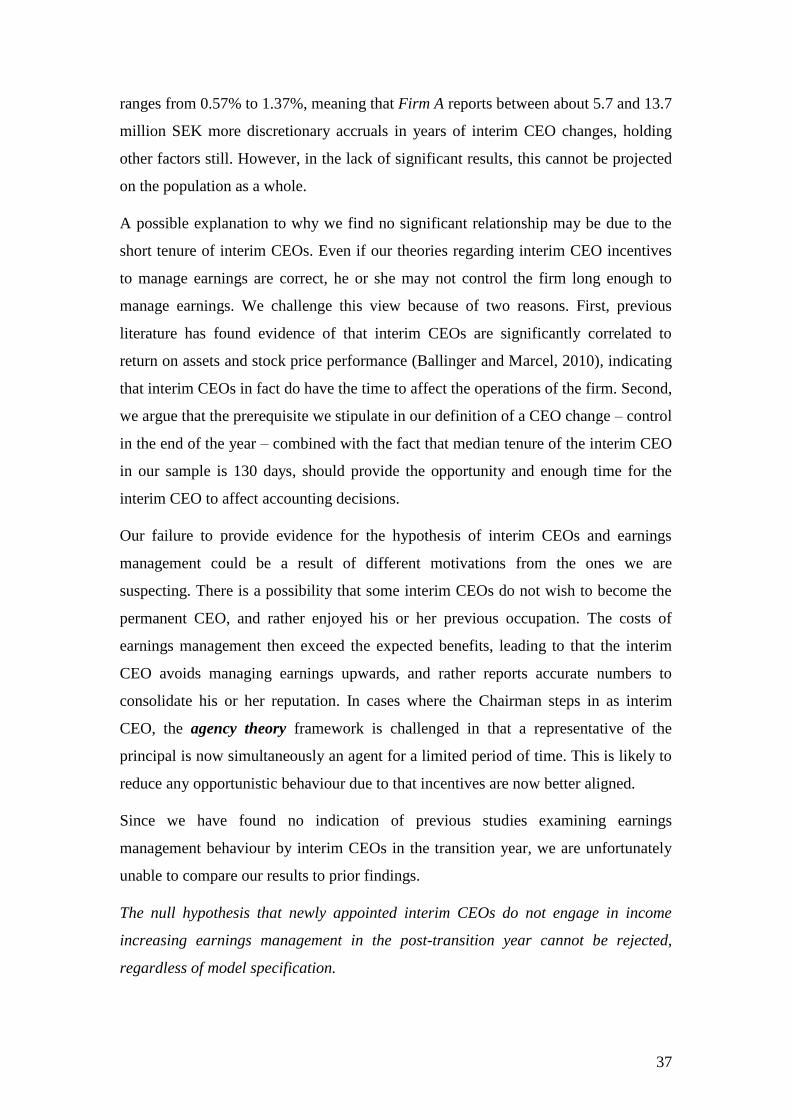
37
ranges from 0.57% to 1.37%, meaning that Firm A reports between about 5.7 and 13.7
million SEK more discretionary accruals in years of interim CEO changes, holding
other factors still. However, in the lack of significant results, this cannot be projected
on the population as a whole.
A possible explanation to why we find no significant relationship may be due to the
short tenure of interim CEOs. Even if our theories regarding interim CEO incentives
to manage earnings are correct, he or she may not control the firm long enough to
manage earnings. We challenge this view because of two reasons. First, previous
literature has found evidence of that interim CEOs are significantly correlated to
return on assets and stock price performance (Ballinger and Marcel, 2010), indicating
that interim CEOs in fact do have the time to affect the operations of the firm. Second,
we argue that the prerequisite we stipulate in our definition of a CEO change – control
in the end of the year – combined with the fact that median tenure of the interim CEO
in our sample is 130 days, should provide the opportunity and enough time for the
interim CEO to affect accounting decisions.
Our failure to provide evidence for the hypothesis of interim CEOs and earnings
management could be a result of different motivations from the ones we are
suspecting. There is a possibility that some interim CEOs do not wish to become the
permanent CEO, and rather enjoyed his or her previous occupation. The costs of
earnings management then exceed the expected benefits, leading to that the interim
CEO avoids managing earnings upwards, and rather reports accurate numbers to
consolidate his or her reputation. In cases where the Chairman steps in as interim
CEO, the agency theory framework is challenged in that a representative of the
principal is now simultaneously an agent for a limited period of time. This is likely to
reduce any opportunistic behaviour due to that incentives are now better aligned.
Since we have found no indication of previous studies examining earnings
management behaviour by interim CEOs in the transition year, we are unfortunately
unable to compare our results to prior findings.
The null hypothesis that newly appointed interim CEOs do not engage in income
increasing earnings management in the post-transition year cannot be rejected,
regardless of model specification.
38
4.3 Validity of results
4.3.1 Sample critique
Due to the data eliminations made to arrive at our final sample, there is a risk that our
sample is unrepresentative. For example, about half of our final sample consists of
Small Cap firms. Since small firms have been proved to exercise earnings
management to a larger extent than large firms, this may bias our results.
As we excluded firms belonging to the Utilities, Oil and Gas, and
Telecommunications industries because of sample size issues, there is a risk of that
our results are biased towards particular industries. While we regard this as a
limitation to our study, these exclusions were necessary and unavoidable.
Since we eliminated firms with a fiscal year end other than December, our sample is
skewed towards firms with regular financial years. We find it hard to believe that
choice of financial year-end correlates with earnings management behaviour, and
therefore consider this elimination randomised.
Since we only included firms that were listed during the entire time period studied,
there is a risk for survivorship bias. Commonly, survivorship biases skew samples
toward large, mature firms. In our case, however, a substantial portion of our sample
is consists of Small Cap firms, and thus we regard the risk for survivorship bias as
low.
When selecting what time period to study, we made sure to include both years of
booms and recessions to make sure that our results would not be biased by the
economic cycle. Therefore, we argue that there is no time window bias in our sample,
and that our results can be generalised across time periods.
4.3.2 Statistical considerations
Multicollinearity
According to Wooldridge (2009), multicollinearity exists when two or more
explanatory variables in a multiple regression model are highly, but not perfectly,
correlated. Presence of multicollinearity does not violate any of the underlying
assumption of OLS models nor harm the power of the model as a whole. However,
high correlation between estimators may invalidate the results of an individual
39
predictor. Therefore, convention is to explore the extent of multicollinearity when
using regression models in order to detect whether our test variable is highly
correlated with any of the explanatory variables. Researchers can compute statistics
providing estimates of whether the multicollinearity between variables is severe, such
as VIF10
. However, Wooldridge (2009) criticises these methods, and claims that there
in fact exists no upper bound for when multicollinearity is “too high”. With this in
mind, we use Pearson’s bivariate correlation matrix to assess the issue through
judgement (Appendix, Exhibit A). In the matrix, we can see that correlation levels are
low, and should not be a problem.
Autocorrelation
An assumption behind fixed effects when applied to panel data is the absence of
autocorrelation. Wooldridge (2009) defines autocorrelation as when the error terms
from a regression are correlated over time. As autocorrelation causes underestimation
of the standard errors and thus overestimation of t-values, it increases the risk of
making a Type I error. We test autocorrelation through a test developed by Drukker
(2003). The results show that we are unable to reject the null hypothesis of no
autocorrelation. However, since a Kernel density estimation plot indicates that the
error terms of our regression models are normally distributed, the autocorrelation test
can be disregarded and the assumptions behind OLS still hold.
4.3.3 Robustness tests
In order to test our findings for sensitivity in methodology and assumptions, we have
carried out a number of robustness tests that one by one alters the design of our study.
The robustness tests only retest Hypothesis 1 and Hypothesis 2, where significant
results were found. The overall results of the robustness tests can be viewed in Exhibit
B in Appendix.
For all tests, each continuous variable (discretionary accruals, leverage, lagged
accruals and cash flow from operations) was winsorised with 1% in both tails to
adjust for extreme values. Out of the 1869 observations, 36 observations were
winsorised for discretionary accruals, lagged total accruals and cash flow from
operations, and 18 observations were winsorised for leverage. Robustness test (1) is
10 Variance inflation factor
40
done without using the winsorising technique. Results show that both Hypothesis 1
and 2 still hold after unwinsorising the variables.
Using OLS methods requires the presence of homoskedasticity (Wooldridge 2009).
Homoskedasticity means that the variance of the unobserved error, , should be
constant. If variances are different across subsamples, the assumption of
homoskedasticity does not hold. In the original regressions, heteroskedasticity has
been controlled for by heteroskedasticity-consistent standard errors. In robustness test
(2), we conduct our tests without this control to explore the existence of
heteroskedasticity. Only applicable in regression model, this is consequently not
tested for the t-test. As expected, the heteroskedasticity correction does not change
our results, and thus does not impact our analysis.
By examining the descriptive statistics in Table 1, one might notice that our sample is
skewed towards firms classified as Industrials. Although inherent differences across
industries are controlled for in one of our model specifications by fixed effects, we
find it necessary to test whether our results hold if using a subsample of our data,
excluding Industrials. From robustness test (3), we can conclude that while
Hypothesis 1 still holds, Hypothesis 2, predicting significant correlation between
earnings management and ordinary CEO changes in the transition year, is rejected on
all significance levels. We suspect that the loss of significance is attributable to the
elimination of observations, resulting in a too small sample size.
Robustness test (4) sets out to see if the results still hold when excluding Denmark
from the tests. Under these conditions, we reject the null hypothesis of Hypothesis 1
on a 10% significance level (signed), and on a 1% significance level (absolute). The
results from testing Hypothesis 2 still hold. As this study concerns the Nordic
countries as a collective, the weakening of results when excluding Denmark does not
invalidate our findings.
The need to estimate discretionary accruals for conducting earnings management tests
causes the studies to be inherently flawed. While regression models, such as the Jones
model, mitigate some of these issues, they are far from perfect in detecting earnings
management. For example, Jeter and Shivakumar (1999) find the power of the tests to
be relatively low. This is especially true for subtle cases of earnings management,
resulting in that large sample sizes are required for detection. Another limitation of
41
our accruals estimation is that the cross-sectional approach makes the assumption of
that all firms in the same industry generates normal accruals according to the same
pattern. Broad industry classifications ensure large samples, but reduce the accuracy
of the estimate. For example, the assumption that accruals patterns are the same
across an industry classification as diverse as Industrials can be considered bold, due
to the wide range of business models and products represented in the category. To test
the sensitivity of our findings to the choice of estimation model, robustness test (5)
estimates discretionary accruals by the Modified Jones model (unadjusted for
performance). The results from the tests are mixed. Regardless of estimation model,
Hypothesis 2 still holds. Although we are still able to reject the null hypothesis for
Hypothesis 1, the sign of the coefficient on non-absolute discretionary accruals
changes from slightly positive to strongly negative. This indicates that our
assumptions are fairly sensitive as to what estimation model is used. However, we
regard the performance-adjusted Modified Jones model as better specified and will
thus draw our conclusions on the results from our original model specifications.
42
5. Conclusion and suggestions for future research
In this section, we conclude our findings and their implications. We also give ideas
for future research.
We believe that this study has made a valuable contribution to the current state of
knowledge within the earnings management literature. Evidence has been found for
that Nordic firms systematically manage earnings to a value of 0.3% of beginning
assets each year. Adjusting this for offsetting income increasing and decreasing
earnings management, discretionary accruals affect earnings to an absolute value of
6.0% of total assets. For a firm with total assets of 1 billion SEK, this means earnings
management to a magnitude of 60 milllion. In our opinion, this is an economically
significant amount of earnings manipulation.
Support is found in data for a significantly negative correlation between earnings
management and ordinary CEO changes in the year of the transition. In a year with a
CEO change, firms on average record 1.5% more negative accruals than in normal
years. For the firm mentioned above, this translates into about 10.5 million SEK.
While we cannot say for sure without further tests, we argue that much indicates that
this relationship can be interpreted to be causal. We suggest that future researchers
investigate the possibility of introducing an instrumental variable, in order to control
for reverse causality.
With expectations of accruals to reverse in the subsequent year, our study fails to
establish any association between years following ordinary CEO changes and
earnings management. By continuing to refine the technique of how to assign the
transition year between the outgoing and incoming CEO, future research might have a
better chance at providing evidence for this activity.
We have found no significant evidence of that interim CEOs engage in income-
increasing earnings management in the transition year. We rather hope that our results
can be seen as an indication of differences in earnings management behaviour by
ordinary and interim CEOs in association with CEO changes, helping future
researchers to adjust for this in their studies, for example by excluding interim CEOs
from the data sample.

43
In our opinion, earnings management is a serious threat to the public’s faith in the
equity markets. Firms’ ability to raise funds at reasonable prices constantly needs to
be safeguarded, as it constitutes a vital part of a dynamic market economy. We hope
that our results can promote better decision-making in the investor community, and
help financial analysts to be more vigilant against earnings management and its
association with CEO changes.
44
References
Aussenegg, Wolfgang, Petra Inwinkl, and Georg Schneider. "Earnings management and local
vs. international accounting standards of European public firms." International Accounting
Standards of European Public Firms (September 1, 2008) (2008).
Ballinger, Gary A., and Jeremy J. Marcel. "The use of an interim CEO during succession
episodes and firm performance." Strategic Management Journal 31.3 (2010): 262-283.
Beaver, William H., and Ellen E. Engel. "Discretionary behaviour with respect to allowances
for loan losses and the behaviour of security prices." Journal of Accounting and Economics
22.1 (1996): 177-206.
Beaver, William H., and Maureen F. McNichols. "The characteristics and valuation of loss
reserves of property casualty insurers." Review of Accounting Studies 3.1-2 (1998): 73-95.
Beneish, Messod D. "Detecting GAAP violation: Implications for assessing earnings
management among firms with extreme financial performance."Journal of Accounting and
Public Policy 16.3 (1997): 271-309.
Bengtsson, Kristian, Clas Bergström, and Max Nilsson. "Earnings management and CEO
turnovers." Markets and Compensation for Executives in Europe (2008).
Bruns, W., and K. Merchant. "The dangerous morality of managing earnings."Management
Accounting 72.2 (1990): 22-25.
Burgstahler, David, and Ilia Dichev. "Earnings management to avoid earnings decreases and
losses." Journal of accounting and economics 24.1 (1997): 99-126.
Butler, Stephen A., and Harry A. Newman. "Agency control mechanism effectiveness and
decision making in an executive's final year with a firm."Journal of Institutional and Theoretical
Economics (JITE)/Zeitschrift für die gesamte Staatswissenschaft (1989): 451-464.
Bång. J, and Waldenström, D. ”Rörlig ersättning till VD – vad säger forskningen?” Ekonomisk
debatt nr 5 (2009): 41-56.
Callao, Susana, and José Ignacio Jarne. "Have IFRS affected earnings management in the
European Union?." Accounting in Europe 7.2 (2010): 159-189.
Collins, Daniel W., and Paul Hribar. "Errors in estimating accruals: Implications for empirical
research." Journal of Accounting research 40.1 (2002): 105-134.
Coyne, Kevin P., and Edward J. Coyne, Sr. "Surviving Your New CEO." Harvard Business
Review. N.p., May 2007. Web. 14 May 2013.
Davidson, Ryan, Jenny Goodwin‐Stewart, and Pamela Kent. "Internal governance structures
and earnings management." Accounting & Finance 45.2 (2005): 241-267.
DeAngelo, Linda Elizabeth. "Accounting numbers as market valuation substitutes: A study of
management buyouts of public stockholders."Accounting Review (1986): 400-420.
45
Dechow, Patricia M., and Richard G. Sloan. "Executive incentives and the horizon problem: An
empirical investigation." Journal of accounting and Economics 14.1 (1991): 51-89.
Dechow, Patricia M., Richard G. Sloan, and Amy P. Sweeney. "Detecting earnings
management." Accounting Review (1995): 193-225.
DeFond, Mark L., and Chul W. Park. "The reversal of abnormal accruals and the market
valuation of earnings surprises." The Accounting Review 76.3 (2001): 375-404.
DeFond, Mark L., and James Jiambalvo. "Debt covenant violation and manipulation of
accruals." Journal of accounting and economics 17.1 (1994): 145-176.
Degeorge, Francois, Jayendu Patel, and Richard Zeckhauser. "Earnings Management to Exceed
Thresholds*." The Journal of Business 72.1 (1999): 1-33.
Drukker, David M. "Testing for serial correlation in linear panel-data models."Stata Journal 3.2
(2003): 168-177.
Eisenhardt, Kathleen M. "Building theories from case study research."Academy of management
review (1989): 532-550.
Elliott, John A., and Wayne H. Shaw. "Write-offs as accounting procedures to manage
perceptions." Journal of accounting research 26 (1988): 91-119.
Fama, E. F., ‘Agency Problems and the Theory of the Firm’, Journal of Political Economy, Vol.
88, No. 2, 1980.
Favaro, Ken, Per-Ola Karlsson, and Gary Neilson. CEO Succession Report. Publication. Booz
& Company, n.d. Web. 14 May 2013.
Frankel, Richard M., Marilyn F. Johnson, and Karen K. Nelson. "The relation between auditors'
fees for nonaudit services and earnings management." The Accounting Review 77.s-1 (2002):
71-105.
Garen, John E. "Executive compensation and principal-agent theory." Journal of Political
Economy (1994): 1175-1199.
Geiger, Marshall A., and David S. North. "Does hiring a new CFO change things? An
investigation of changes in discretionary accruals." The Accounting Review 81.4 (2006): 781-
809.
Godfrey, Jayne, Paul Mather, and Alan Ramsay. "Earnings and impression management in
financial reports: the case of CEO changes." Abacus 39.1 (2003): 95-123.
Gunny, Katherine Ann. "What are the consequences of real earnings management?." (2005).
Jeanjean, Thomas, and Hervé Stolowy. "Do accounting standards matter? An exploratory
analysis of earnings management before and after IFRS adoption."Journal of accounting and
public policy 27.6 (2008): 480-494.
46
Healy, Paul M. "The effect of bonus schemes on accounting decisions." Journal of accounting
and economics 7.1 (1985): 85-107.
Healy, Paul M., and James M. Wahlen. "A review of the earnings management literature and its
implications for standard setting." Accounting horizons 13.4 (1999): 365-383.
Herbohn, Kathleen, and Vanitha Ragunathan. "Auditor reporting and earnings management:
some additional evidence." Accounting & Finance 48.4 (2008): 575-601.
IFRS Adoption by Country. Publication. PWC, n.d. Web. 14 May 2013.
Industry Structure and Definitions. Publication. Industry Classification Benchmark, n.d. Web.
14 May 2013.
Islam, Md Aminul, Ruhani Ali, and Zamri Ahmad. "Is Modified Jones Model Effective in
Detecting Earnings Management? Evidence from A Developing Economy." International
Journal of Economics and Finance 3.2 (2011): p116.
Jensen, Michael C., and William H. Meckling. "Theory of the firm: Managerial behavior,
agency costs and ownership structure." Journal of financial economics 3.4 (1976): 305-360.
Jeter, Debra C., and Lakshmanan Shivakumar. "Cross-sectional estimation of abnormal accruals
using quarterly and annual data: Effectiveness in detecting event-specific earnings
management." Accounting and Business Research 29.4 (1999): 299-319.
Jones, Jennifer J. "Earnings management during import relief investigations."Journal of
accounting research 29.2 (1991): 193-228.
Kang, Sok-Hyon, and K. Sivaramakrishnan. "Issues in testing earnings management and an
instrumental variable approach." Journal of Accounting Research 33.2 (1995): 353-367.
Kothari, Sagar P., Andrew J. Leone, and Charles E. Wasley. "Performance matched
discretionary accrual measures." Journal of accounting and economics 39.1 (2005): 163-197.
Leuz, Christian, Dhananjay Nanda, and Peter D. Wysocki. "Earnings management and investor
protection: an international comparison." Journal of financial economics 69.3 (2003): 505-527.
Lee, Brian B., and B. Choi. "Company size, auditor type, and earnings management." Journal of
Forensic Accounting 3 (2002): 27-50.
Markoff, John. "Steven P. Jobs, 1955-2011; Redefined the Digital Age As the Visionary of
Apple." The New York Times. The New York Times, 06 Oct. 2011. Web. 14 May 2013.
McNichols, Maureen F. "Research design issues in earnings management studies." Journal of
accounting and public policy 19.4 (2001): 313-345.
McNichols, Maureen, and G. Peter Wilson. "Evidence of earnings management from the
provision for bad debts." Journal of accounting research 26 (1988): 1-31.

47
Menon, Krishnagopal, and David D. Williams. "Former audit partners and abnormal accruals."
The Accounting Review 79.4 (2004): 1095-1118.
Moore, M. “Management changes and discretionary accounting decisions.” Journal of
Accounting Research 11 (1973): 100-107.
Murphy, Kevin J., and Jerold L. Zimmerman. "Financial performance surrounding CEO
turnover." Journal of Accounting and Economics 16.1 (1993): 273-315.
Newbold, Paul, William Lee Carlson, and Betty Thorne. "Statistics for business and
economics." (2007): 254
Peasnell, Kenneth V., Peter F. Pope, and Steven Young. "Board monitoring and earnings
management: do outside directors influence abnormal accruals?."Journal of Business Finance &
Accounting 32.7‐8 (2005): 1311-1346.
Perry, Susan E., and Thomas H. Williams. "Earnings management preceding management
buyout offers." Journal of Accounting and Economics 18.2 (1994): 157-179.
Petroni, Kathy Ruby. "Optimistic reporting in the property-casualty insurance industry." Journal
of Accounting and Economics 15.4 (1992): 485-508.
Pourciau, Susan. "Earnings management and nonroutine executive changes."Journal of
Accounting and Economics 16.1 (1993): 317-336.
Reynolds, J. Kenneth, and Jere R. Francis. "Does size matter? The influence of large clients on
office-level auditor reporting decisions." Journal of Accounting and Economics 30.3 (2000):
375-400.
Ross, Stephen A. "The economic theory of agency: The principal's problem."The American
Economic Review 63.2 (1973): 134-139.
Schipper, Katherine. "Commentary on earnings management." Accounting horizons 3.4 (1989):
91-102.
Schilit, H. "Financial Shenanigans." (2002).
Strong, John S., and John R. Meyer. "Asset writedowns: Managerial incentives and security
returns." The Journal of Finance 42.3 (1987): 643-661.
Swedish Society of Financial Analysts. “Hur du använder nyckeltal i din analys av företag”.
Publication. Linköpings Universitet, n.d. Web. 14 May 2013.
Watts, Ross, and Jerold Zimmerman. "Positive accounting theory." (1986).
Watts, Ross L., and Jerold L. Zimmerman. "Positive accounting theory: a ten year
perspective." Accounting review (1990): 131-156.
Wells, Peter. "Earnings management surrounding CEO changes." Accounting & Finance 42.2
(2002): 169-193.

48
Wilson, Mark, and Liang Wui Wang. "Earnings management following chief executive officer
changes: the effect of contemporaneous chairperson and chief financial officer appointments."
Accounting & Finance 50.2 (2010): 447-480.
Wooldridge, Jeffrey M. Introductory econometrics: a modern approach. South-Western Pub,
2009: 96, 350.
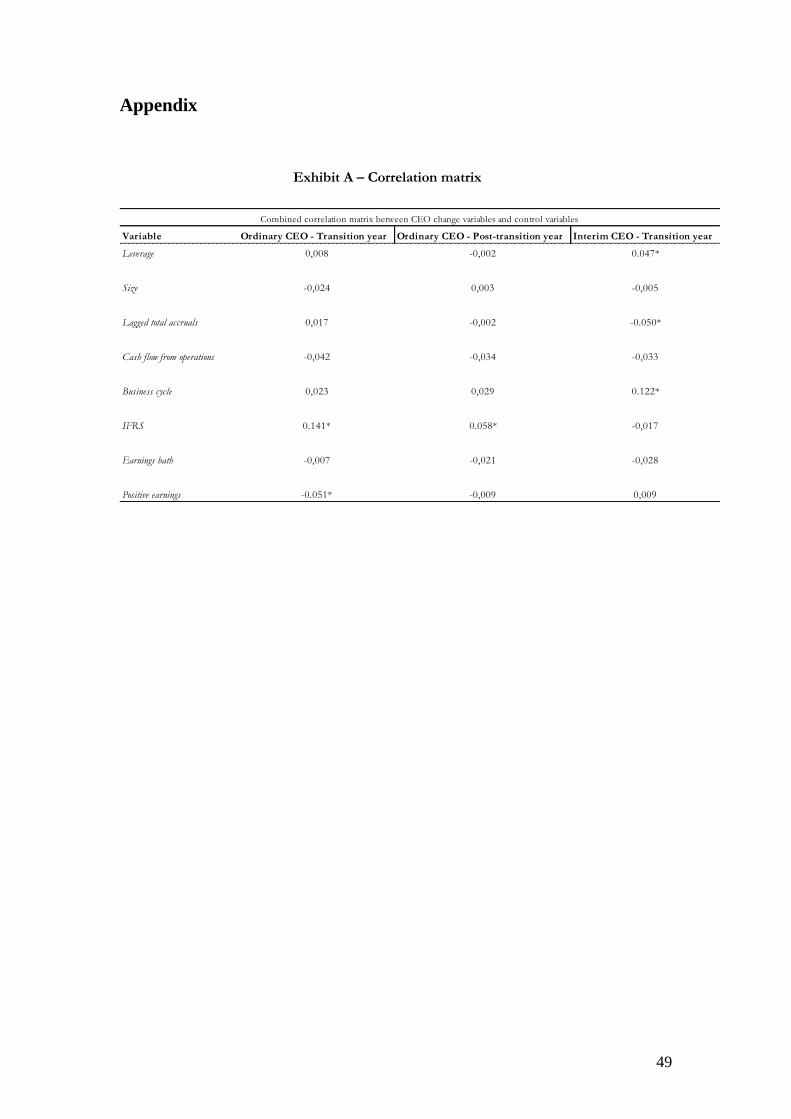
49
Appendix
Variable Ordinary CEO - Transition year Ordinary CEO - Post-transition year Interim CEO - Transition year
Leverage 0,008 -0,002 0.047*
Size -0,024 0,003 -0,005
Lagged total accruals 0,017 -0,002 -0.050*
Cash flow from operations -0,042 -0,034 -0,033
Business cycle 0,023 0,029 0.122*
IFRS 0.141* 0.058* -0,017
Earnings bath -0,007 -0,021 -0,028
Positive earnings -0.051* -0,009 0,009
Combined correlation matrix between CEO change variables and control variables
Exhibit A – Correlation matrix
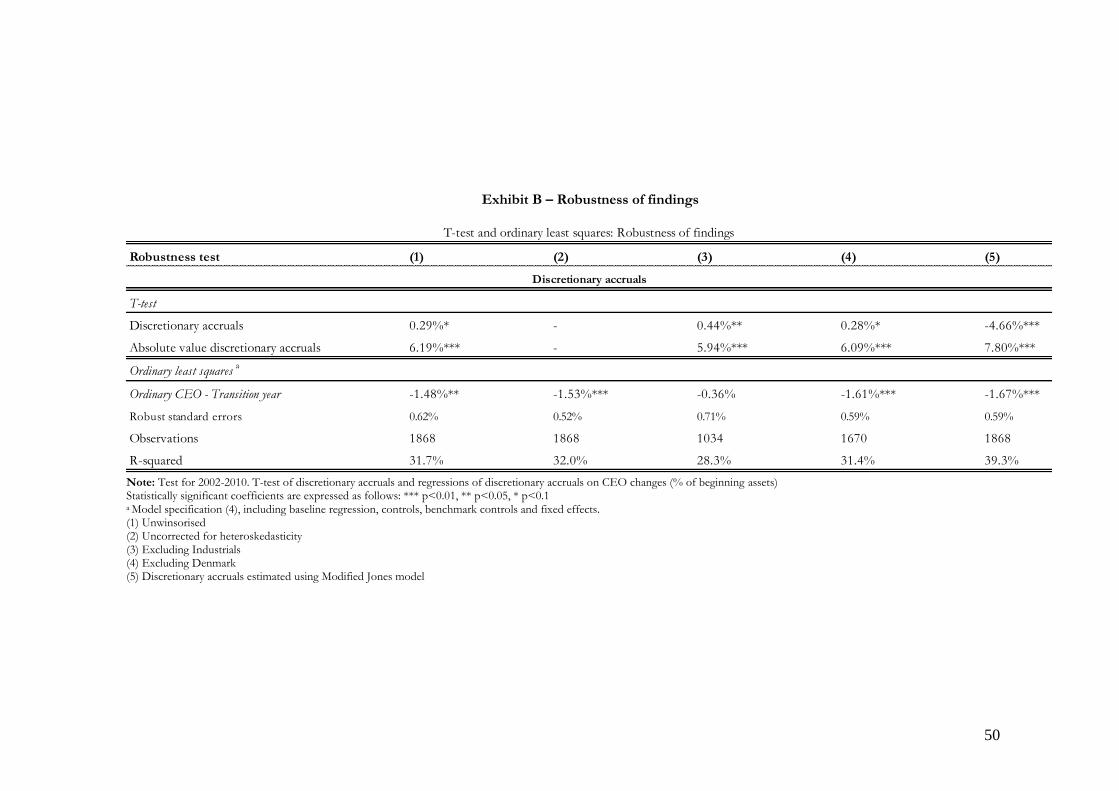
50
Robustness test (1) (2) (3) (4) (5)
T-test
Discretionary accruals 0.29%* - 0.44%** 0.28%* -4.66%***
Absolute value discretionary accruals 6.19%*** - 5.94%*** 6.09%*** 7.80%***
Ordinary least squaresa
Ordinary CEO - Transition year -1.48%** -1.53%*** -0.36% -1.61%*** -1.67%***
Robust standard errors 0.62% 0.52% 0.71% 0.59% 0.59%
Observations 1868 1868 1034 1670 1868
R-squared 31.7% 32.0% 28.3% 31.4% 39.3%
T-test and ordinary least squares: Robustness of findings
Discretionary accruals
Exhibit B – Robustness of findings
Note: Test for 2002-2010. T-test of discretionary accruals and regressions of discretionary accruals on CEO changes (% of beginning assets) Statistically significant coefficients are expressed as follows: *** p<0.01, ** p<0.05, * p<0.1 a Model specification (4), including baseline regression, controls, benchmark controls and fixed effects. (1) Unwinsorised (2) Uncorrected for heteroskedasticity (3) Excluding Industrials (4) Excluding Denmark (5) Discretionary accruals estimated using Modified Jones model

51
(2)
(1)
(3)
(4)
Exhibit C – Model specifications


![DISCOVERY OF NEW MORPHOLOGICAL STRUCTURES OF …NORDIC OPTICAL TELESCOPE: Narrow-band Hα, [N II] λ6583, and [O III] λ5007 images (Fig. 1) of NGC 6309 were acquired on 2009 July](https://static.fdocument.org/doc/165x107/5f7e1a1219d7094b083ca916/discovery-of-new-morphological-structures-of-nordic-optical-telescope-narrow-band.jpg)