Dynamic Mechanical Analysis (DMA) Basics and …ring/ChE 5655 Chip...
53
Dynamic Mechanical Analysis (DMA) Basics and Beyond Dr. Lin Li Thermal Analysis PerkinElmer Inc. April 2000 ε ∗ ω = Σ(∆ε β /1+ιωτ β )
Transcript of Dynamic Mechanical Analysis (DMA) Basics and …ring/ChE 5655 Chip...
Dynamic Mechanical Analysis (DMA) Basics and Beyond
Dr. Lin LiThermal AnalysisPerkinElmer Inc.
April 2000
ε∗ ω= Σ(∆εβ/1+ιωτβ)
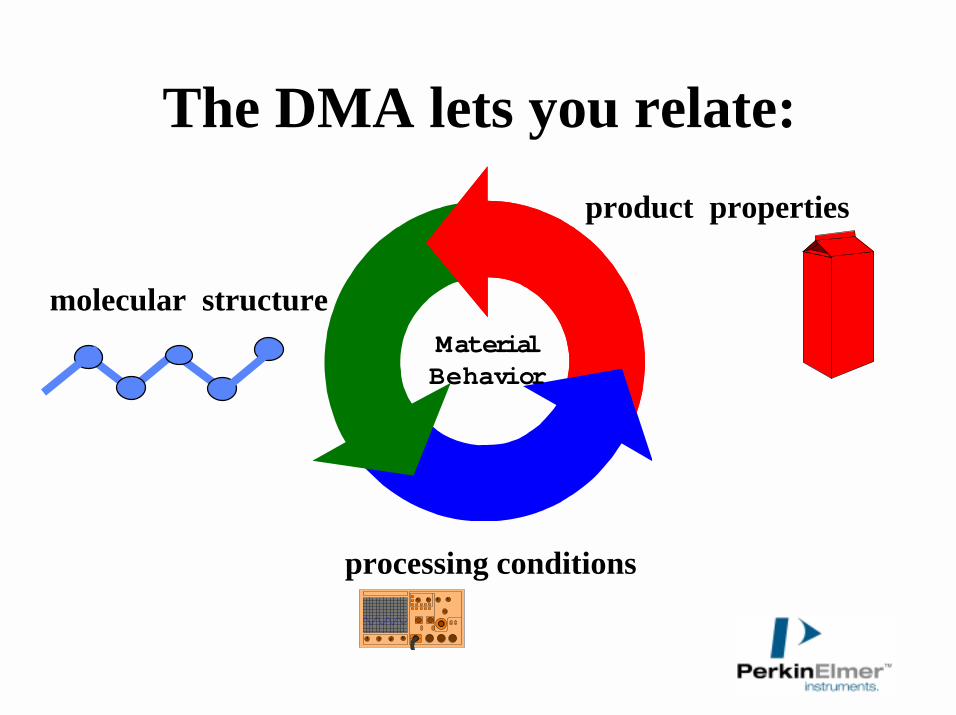
molecular structure
processing conditions
product properties
MaterialBehavior
The DMA lets you relate:
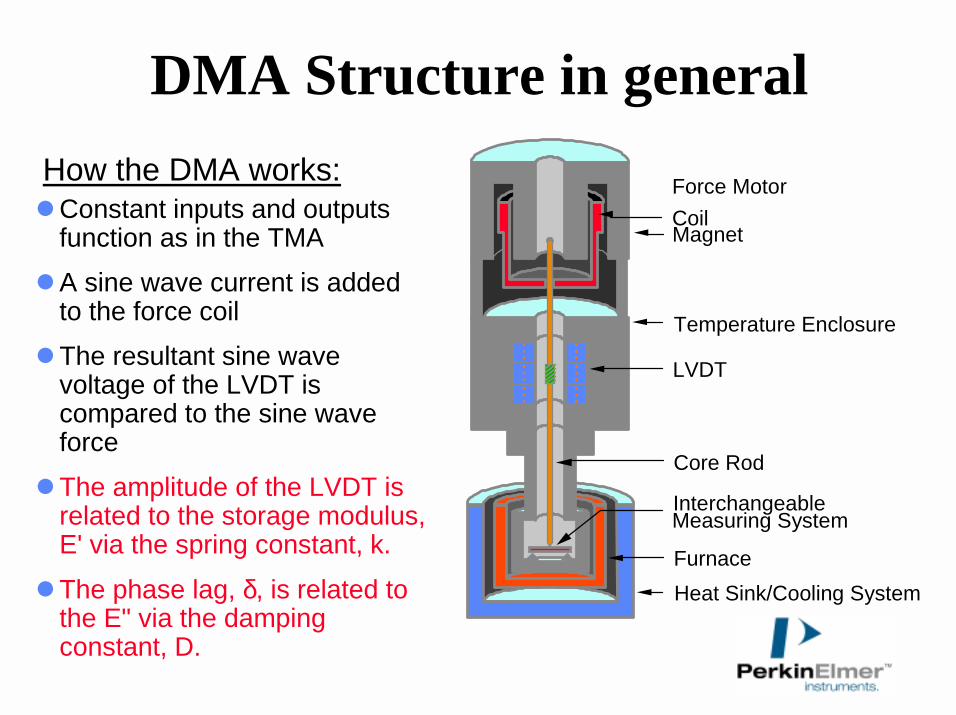
Force Motor
Temperature Enclosure
LVDT
Core Rod
Interchangeable
FurnaceHeat Sink/Cooling System
Measuring System
How the DMA works:
DMA Structure in general
CoilMagnet
!Constant inputs and outputs function as in the TMA
!A sine wave current is added to the force coil
!The resultant sine wave voltage of the LVDT is compared to the sine wave force
!The amplitude of the LVDT is related to the storage modulus, E' via the spring constant, k.
!The phase lag, δ, is related to the E" via the damping constant, D.
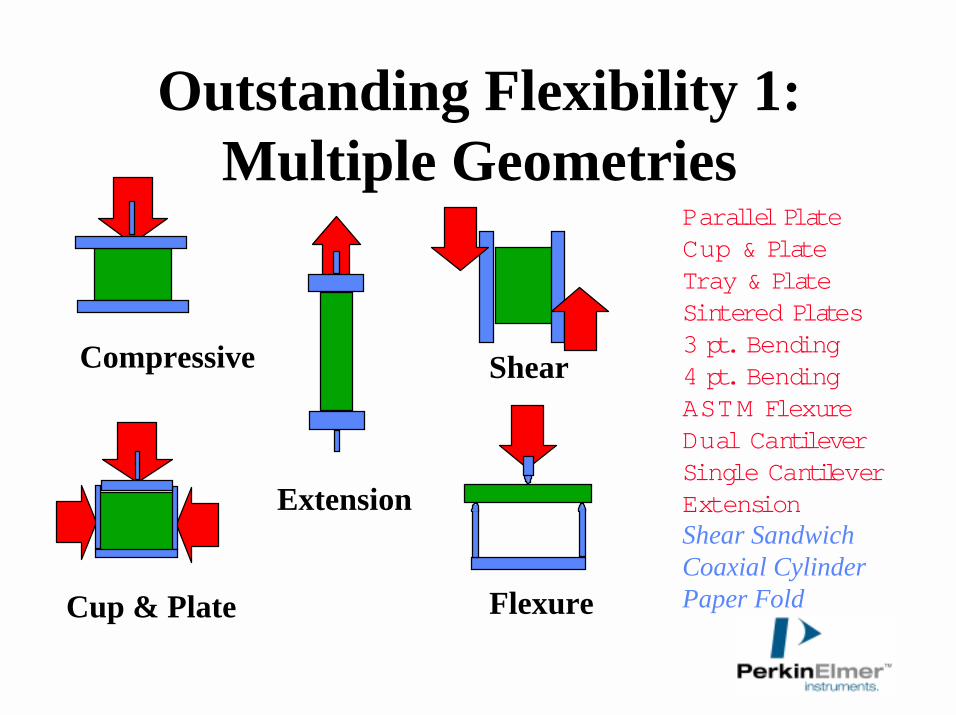
Outstanding Flexibility 1: Multiple Geometries
Extension
Compressive Shear
Flexure
Parallel PlateCup & PlateTray & PlateSintered Plates3 pt. Bending4 pt. BendingASTM FlexureDual CantileverSingle CantileverExtensionShear SandwichCoaxial CylinderPaper FoldCup & Plate
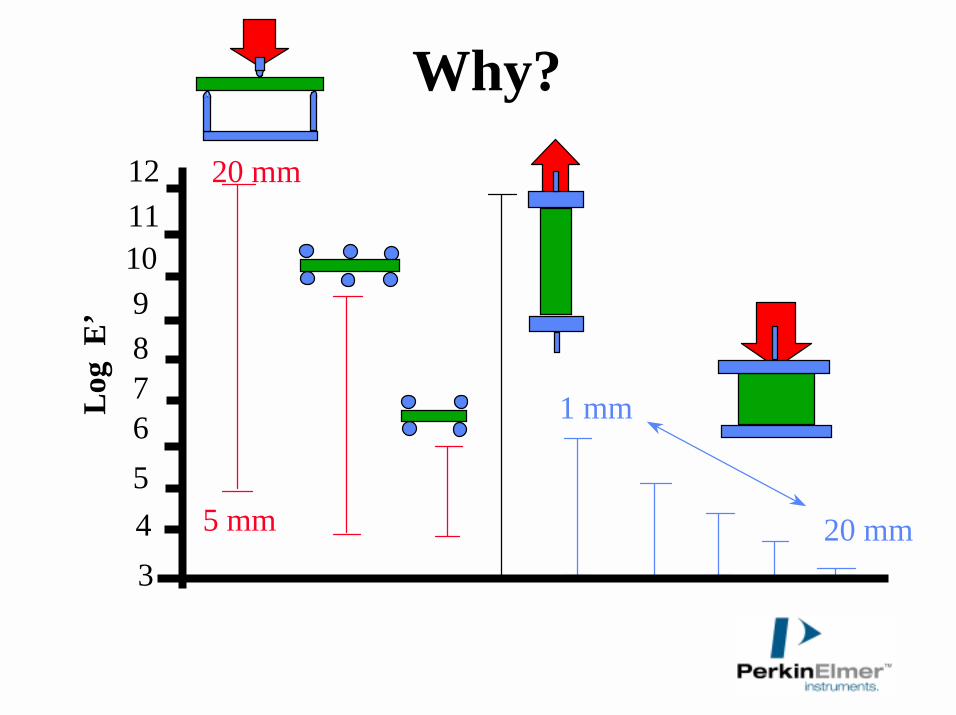
Why?
3456789101112
Log
E’
1 mm
20 mm
20 mm
5 mm
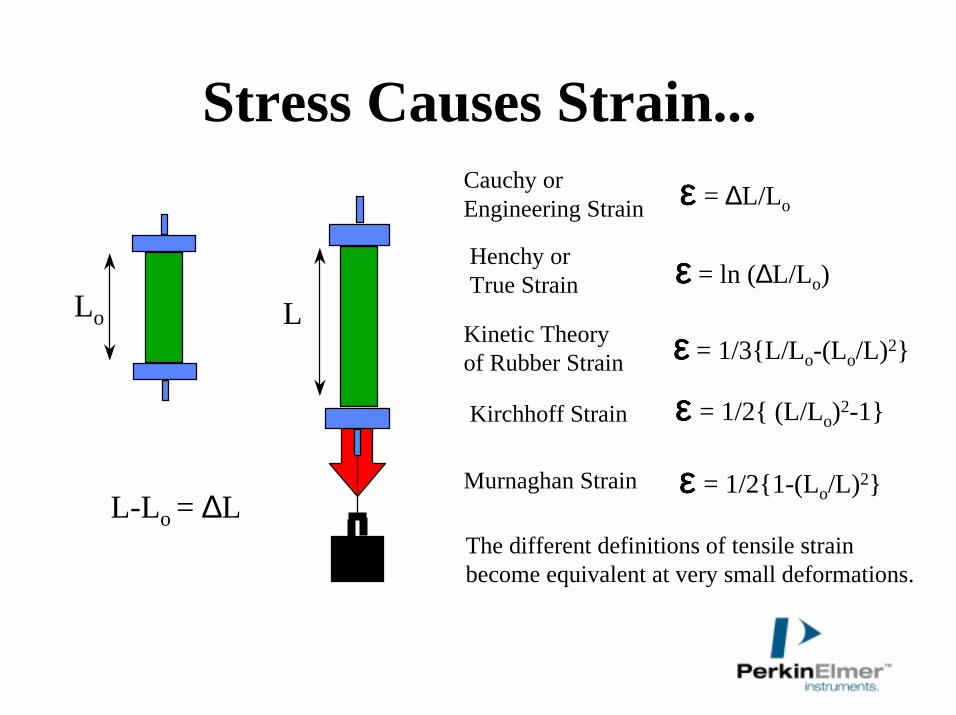
Stress Causes Strain...
Lo L
Cauchy orEngineering Strain
L-Lo = ∆L
Henchy or True Strain εεεε = ln (∆L/Lo)
εεεε = ∆L/Lo
Kinetic Theoryof Rubber Strain εεεε = 1/3{L/Lo-(Lo/L)2}
Kirchhoff Strain
Murnaghan Strain
εεεε = 1/2{ (L/Lo)2-1}
εεεε = 1/2{1-(Lo/L)2}
The different definitions of tensile strainbecome equivalent at very small deformations.
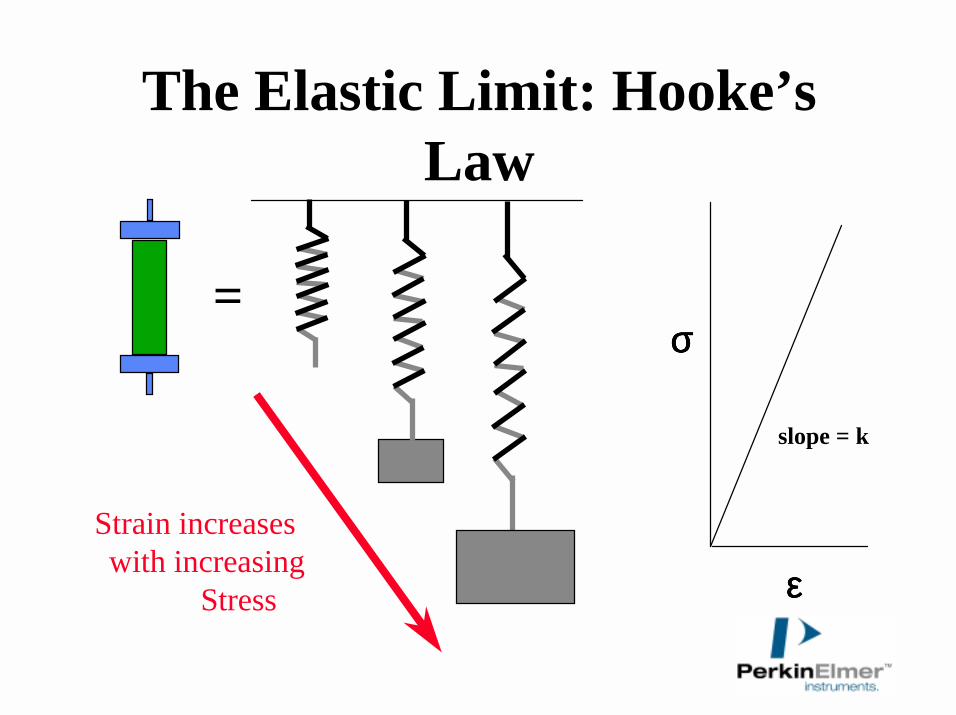
The Elastic Limit: Hooke’sLaw
=
Strain increaseswith increasing
Stress
σσσσ
ε ε ε ε
slope = k
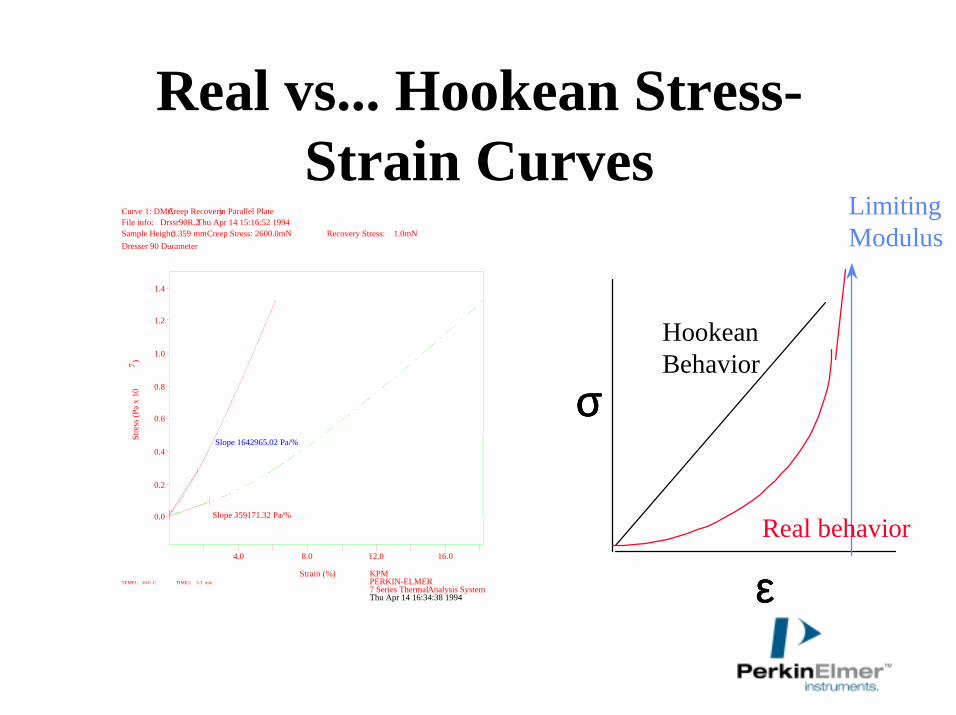
Real vs... Hookean Stress-Strain Curves
4.0 8.0 12.0 16.0
0.0
0.2
0.4
0.6
0.8
1.0
1.2
1.4
Thu Apr 14 16:34:38 1994
Slope 359171.32 Pa/%
Stre
ss (P
a x
107 )
KPMStrain (%)
Slope 1642965.02 Pa/%
Curve 1: DMA Creep Recoveryin Parallel PlateFile info: Drssr90R.2Thu Apr 14 15:16:52 1994Sample Height:3.359 mmCreep Stress: 2600.0mN Recovery Stress: 1.0mN Dresser 90 Durameter
PERKIN-ELMER7 Series ThermalAnalysis System
TEMP1: 20.0 C TIME1: 5.3 min
LimitingModulus
Real behavior
HookeanBehavior
σσσσ
εεεε
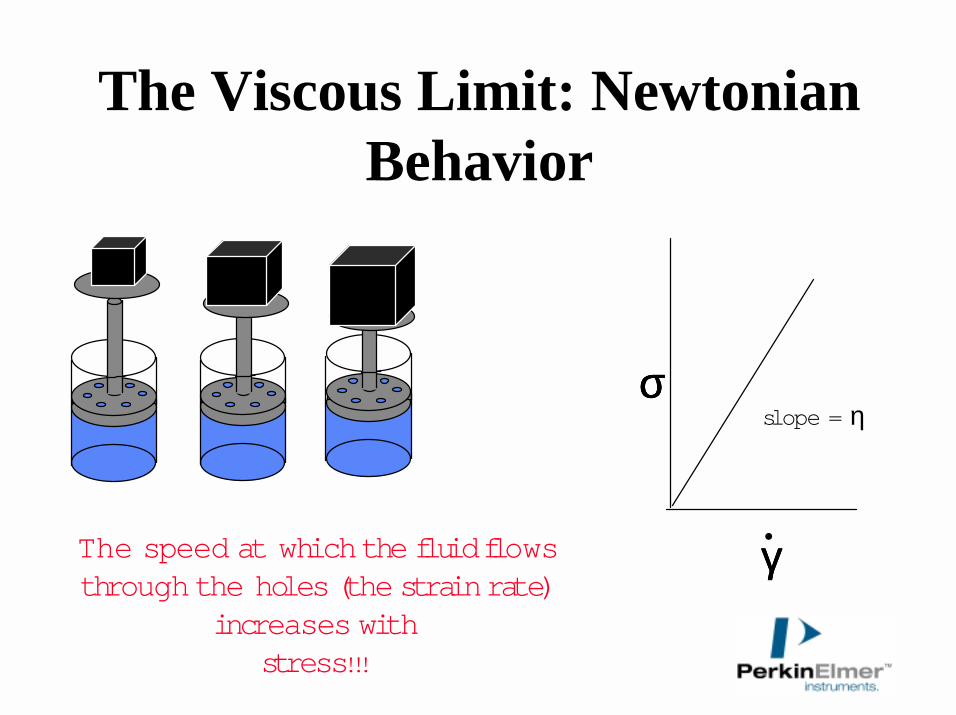
The Viscous Limit: NewtonianBehavior
σσσσ
γ γ γ γ .
The speed at which the fluid flows through the holes (the strain rate)
increases withstress!!!
slope = η
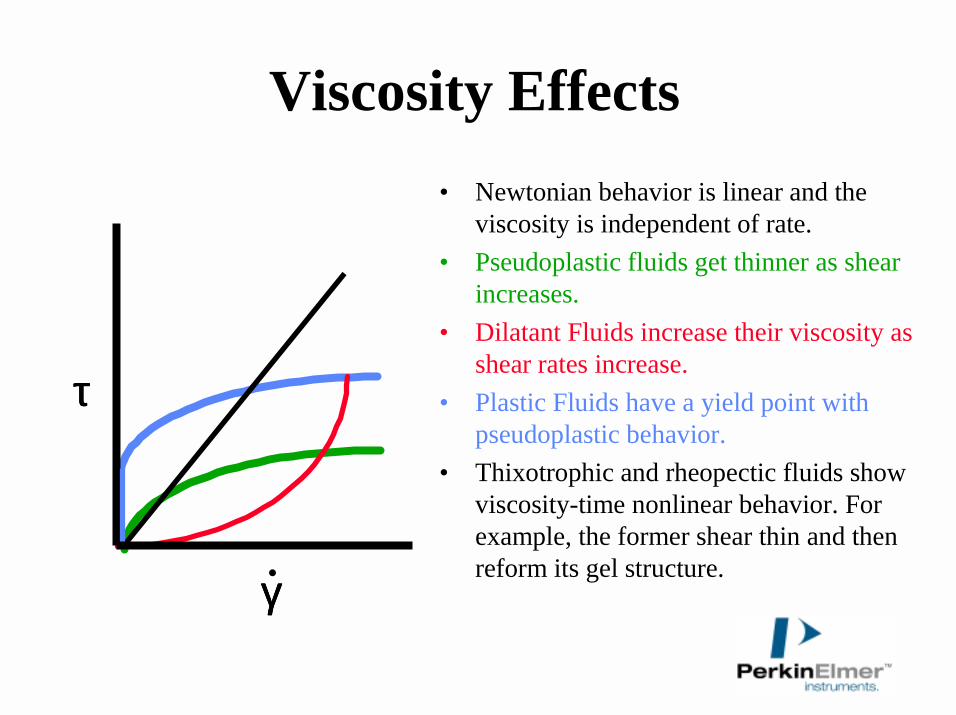
Viscosity Effects• Newtonian behavior is linear and the
viscosity is independent of rate.• Pseudoplastic fluids get thinner as shear
increases.• Dilatant Fluids increase their viscosity as
shear rates increase.• Plastic Fluids have a yield point with
pseudoplastic behavior.• Thixotrophic and rheopectic fluids show
viscosity-time nonlinear behavior. For example, the former shear thin and then reform its gel structure.
γ γ γ γ
ττττ
.
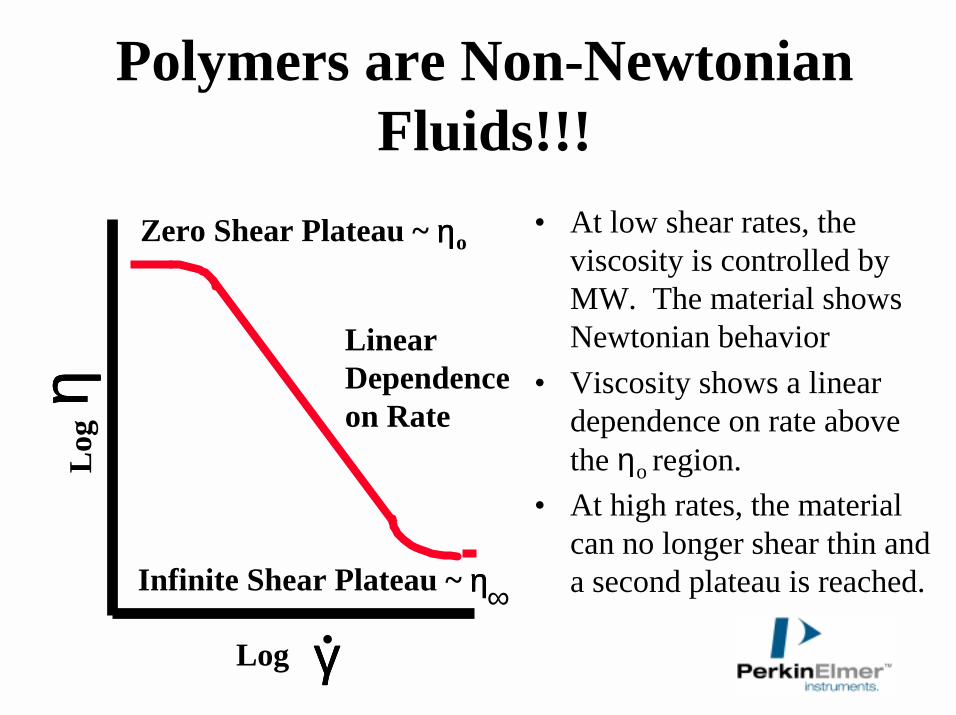
Polymers are Non-NewtonianFluids!!!
• At low shear rates, the viscosity is controlled by MW. The material showsNewtonian behavior
• Viscosity shows a linear dependence on rate above the ηo region.
• At high rates, the material can no longer shear thin and a second plateau is reached.
η ηηη
γγγγ.
Zero Shear Plateau ~ ηηηηo
Infinite Shear Plateau ~ ηηηη∞
Linear Dependenceon Rate
Log
Log
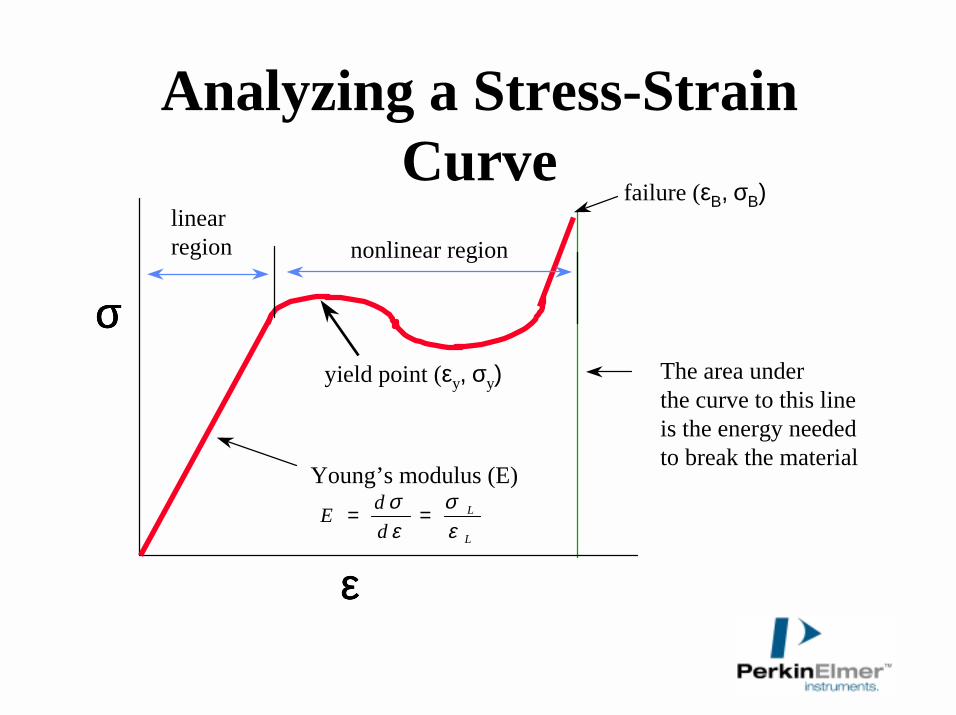
Analyzing a Stress-Strain Curve
σσσσ
εεεε
linearregion nonlinear region
failure (εΒ, σΒ)
yield point (εy, σy)
Young’s modulus (E)E d
dL
L
= =σε
σε
The area underthe curve to this lineis the energy neededto break the material

Under Continuos Loads: Creep Recovery
• Applying a constant load for long times and removing it from a sample.
• Allows one to see the distortion under constant load and also how well it recovers.
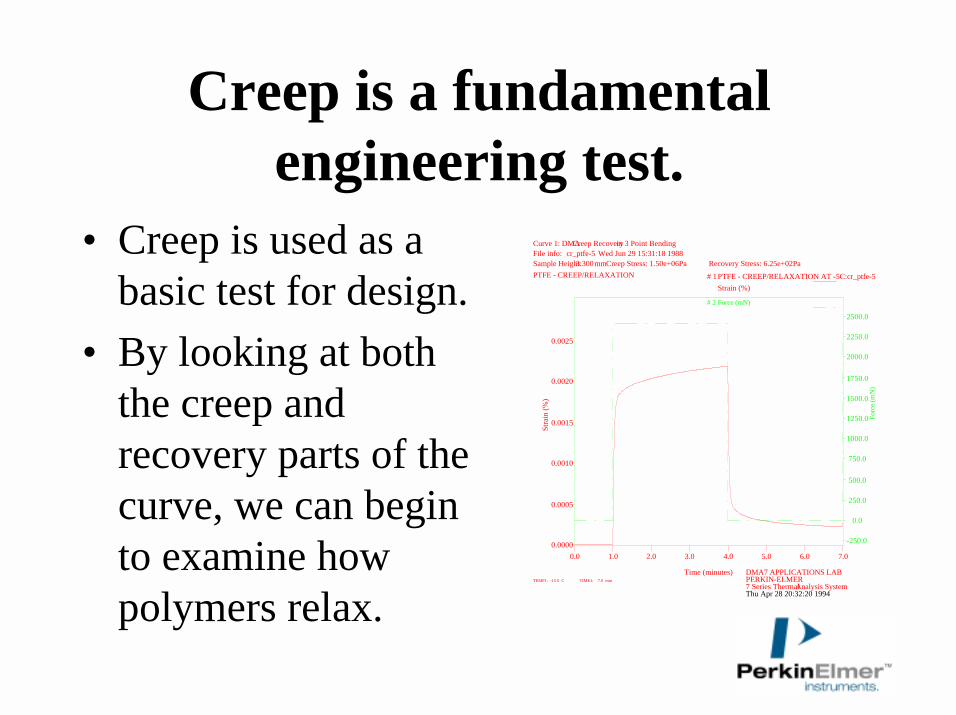
Creep is a fundamental engineering test.
• Creep is used as a basic test for design.
• By looking at both the creep and recovery parts of the curve, we can begin to examine how polymers relax.
0.0 1.0 2.0 3.0 4.0 5.0 6.0 7.00.0000
0.0005
0.0010
0.0015
0.0020
0.0025
-250.0
0.0
250.0
500.0
750.0
1000.0
1250.0
1500.0
1750.0
2000.0
2250.0
2500.0
Thu Apr 28 20:32:20 1994
Stra
in (%
)
DMA7 APPLICATIONS LABTime (minutes)
# 1 PTFE - CREEP/RELAXATION AT -5C:cr_ptfe-5Strain (%)
Curve 1: DMA Creep Recoveryin 3 Point BendingFile info: cr_ptfe-5 Wed Jun 29 15:31:18 1988Sample Height:3.300mmCreep Stress: 1.50e+06Pa Recovery Stress: 6.25e+02Pa PTFE - CREEP/RELAXATION
PERKIN-ELMER7 Series ThermalAnalysis System
TEMP1: -15.0 C TIME1: 7.0 min
Forc
e (m
N)
# 2 Force (mN)
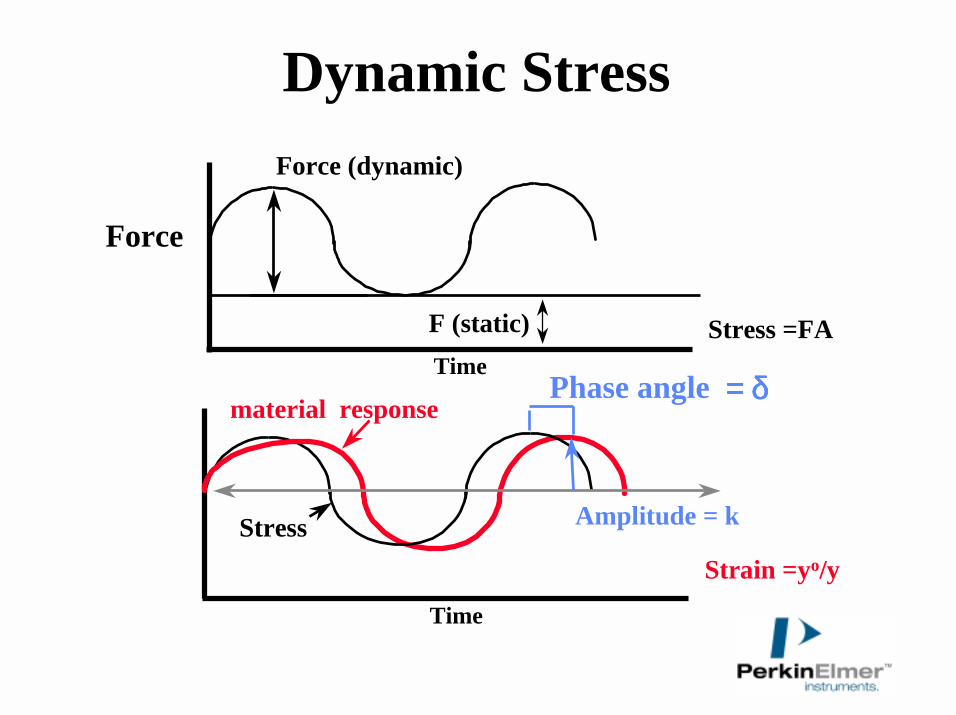
Dynamic Stress
F (static)
Force
Time
Force (dynamic)
Phase angle = δ= δ= δ= δ
Stress
Time
material response
Strain =yo/y
Amplitude = k
Stress =FA
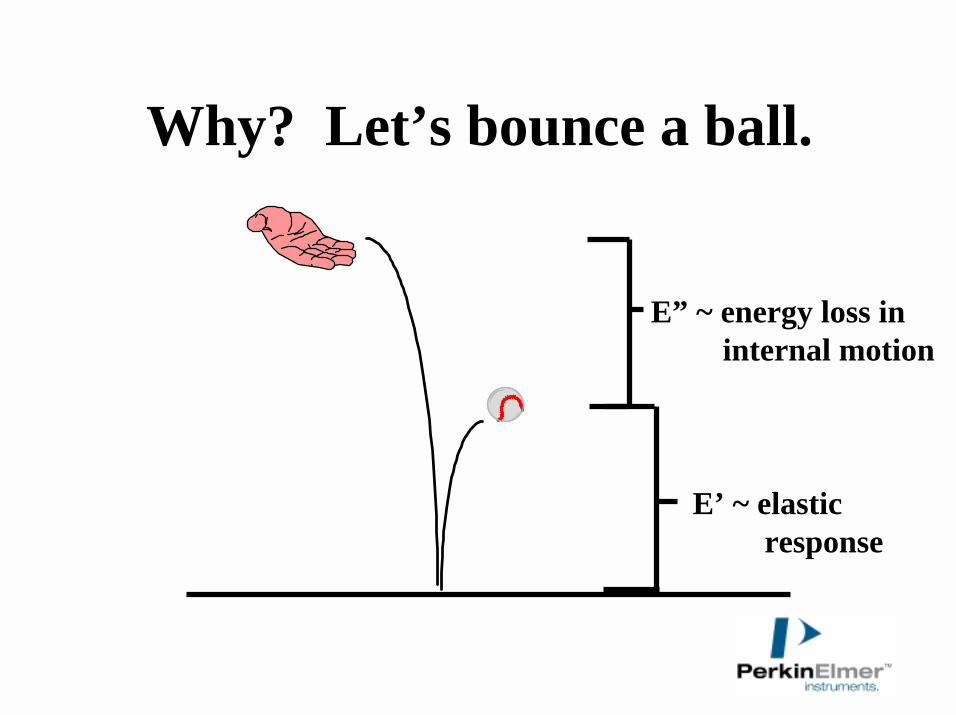
Why? Let’s bounce a ball.
E” ~ energy loss in internal motion
E’ ~ elasticresponse
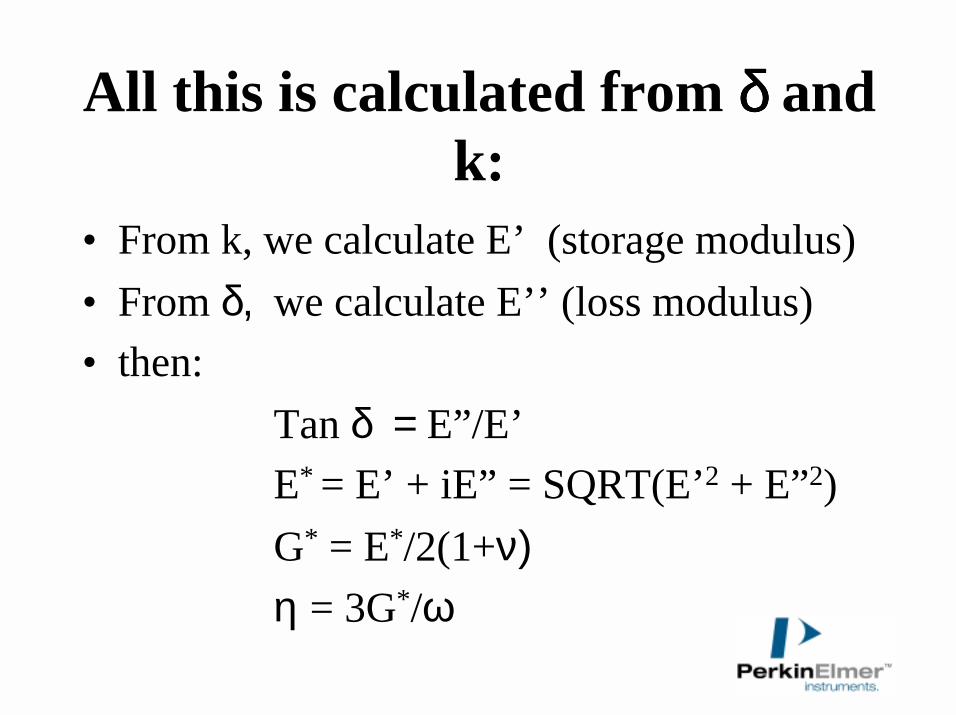
All this is calculated from δ δ δ δ and k:
• From k, we calculate E’ (storage modulus)• From δ, we calculate E’’ (loss modulus)• then:
Tan δ = E”/E’E* = E’ + iE” = SQRT(E’2 + E”2)G* = E*/2(1+ν)η = 3G*/ω
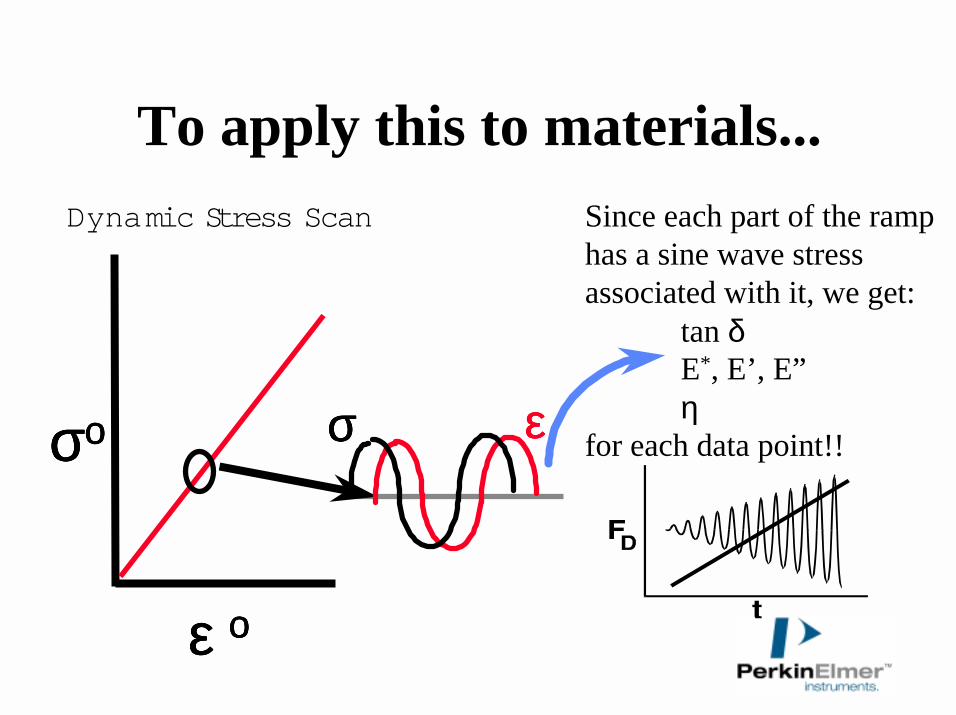
To apply this to materials...
σσσσοοοο
ε ε ε ε οοοο
Dynamic Stress Scan Since each part of the ramp has a sine wave stress associated with it, we get:
tan δE*, E’, E”η
for each data point!!εεεεσσσσ
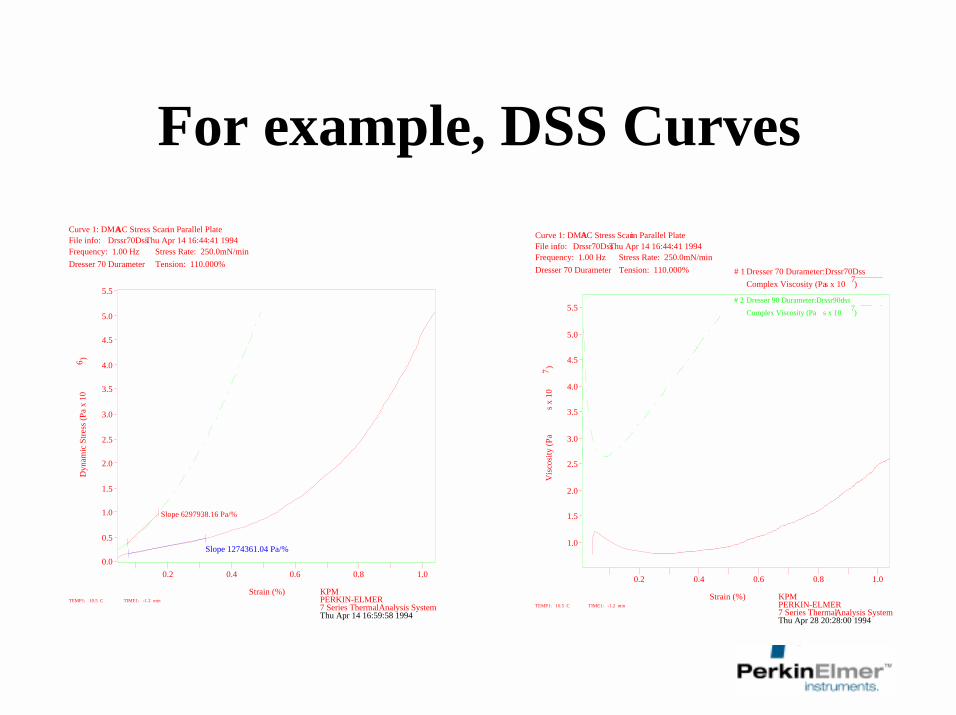
For example, DSS Curves
0.2 0.4 0.6 0.8 1.0
1.0
1.5
2.0
2.5
3.0
3.5
4.0
4.5
5.0
5.5
Thu Apr 28 20:28:00 1994
Vis
cosi
ty (P
a s
x 10
7 )
KPMStrain (%)
# 1 Dresser 70 Durameter:Drssr70DssComplex Viscosity (Pa s x 10 7)
Curve 1: DMA AC Stress Scanin Parallel PlateFile info: Drssr70DssThu Apr 14 16:44:41 1994Frequency: 1.00 Hz Stress Rate: 250.0mN/min
Tension: 110.000% Dresser 70 Durameter
PERKIN-ELMER7 Series ThermalAnalysis System
TEMP1: 10.5 C TIME1: -1.2 min
# 2 Dresser 90 Durameter:Drssr90dss
Complex Viscosity (Pa s x 10 7)
0.2 0.4 0.6 0.8 1.00.0
0.5
1.0
1.5
2.0
2.5
3.0
3.5
4.0
4.5
5.0
5.5
Thu Apr 14 16:59:58 1994
Dyn
amic
Stre
ss (P
a x
106 )
KPMStrain (%)
Slope 1274361.04 Pa/%
Curve 1: DMA AC Stress Scanin Parallel PlateFile info: Drssr70DssThu Apr 14 16:44:41 1994Frequency: 1.00 Hz Stress Rate: 250.0mN/min
Tension: 110.000% Dresser 70 Durameter
PERKIN-ELMER7 Series ThermalAnalysis System
TEMP1: 10.5 C TIME1: -1.2 min
Slope 6297938.16 Pa/%
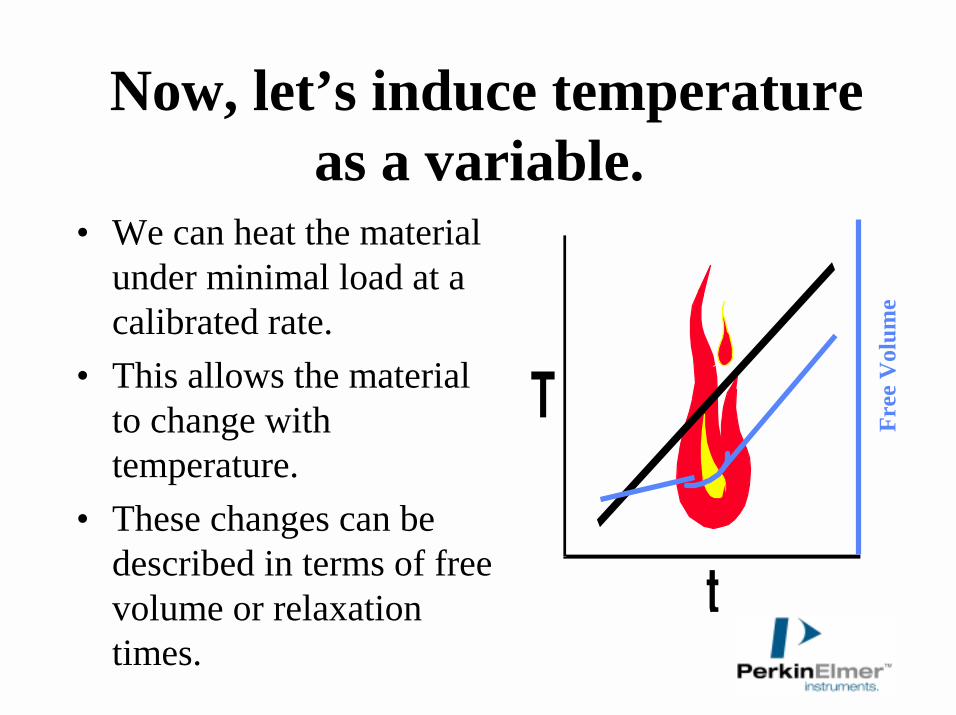
Now, let’s induce temperature as a variable.
• We can heat the material under minimal load at a calibrated rate.
• This allows the material to change with temperature.
• These changes can be described in terms of free volume or relaxation times.
Free
Vol
ume
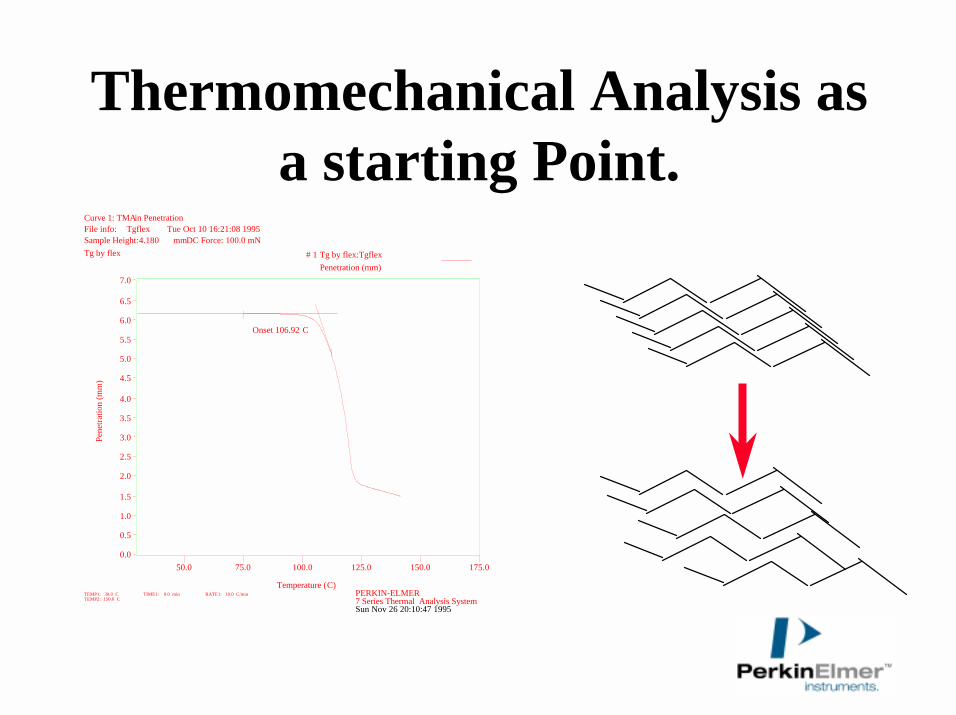
Thermomechanical Analysis as a starting Point.
50.0 75.0 100.0 125.0 150.0 175.00.0
0.5
1.0
1.5
2.0
2.5
3.0
3.5
4.0
4.5
5.0
5.5
6.0
6.5
7.0
Sun Nov 26 20:10:47 1995
Pene
tratio
n (m
m)
Temperature (C)
# 1 Tg by flex:TgflexPenetration (mm)
Onset 106.92 C
Curve 1: TMA in PenetrationFile info: Tgflex Tue Oct 10 16:21:08 1995
DC Force: 100.0 mNSample Height:4.180 mmTg by flex
PERKIN-ELMER7 Series Thermal Analysis System
TEMP1: 30.0 C TIME1: 0.0 min RATE1: 10.0 C/minTEMP2: 150.0 C
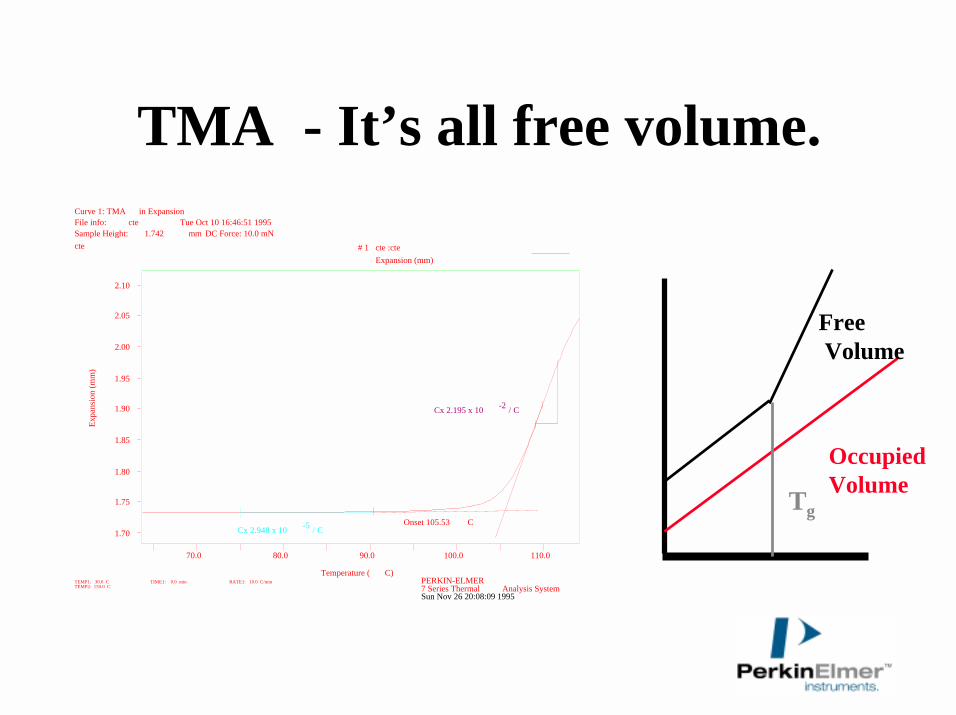
TMA - It’s all free volume.
70.0 80.0 90.0 100.0 110.0
1.70
1.75
1.80
1.85
1.90
1.95
2.00
2.05
2.10
Sun Nov 26 20:08:09 1995
Expa
nsio
n (m
m)
Temperature ( C)
# 1 cte :cteExpansion (mm)
Onset 105.53 CCx 2.948 x 10 -5 / C
Cx 2.195 x 10 -2 / C
Curve 1: TMA in ExpansionFile info: cte Tue Oct 10 16:46:51 1995
DC Force: 10.0 mNSample Height: 1.742 mmcte
PERKIN-ELMER7 Series Thermal Analysis System
TEMP1: 30.0 C TIME1: 0.0 min RATE1: 10.0 C/minTEMP2: 150.0 C
Tg
FreeVolume
Occupied Volume
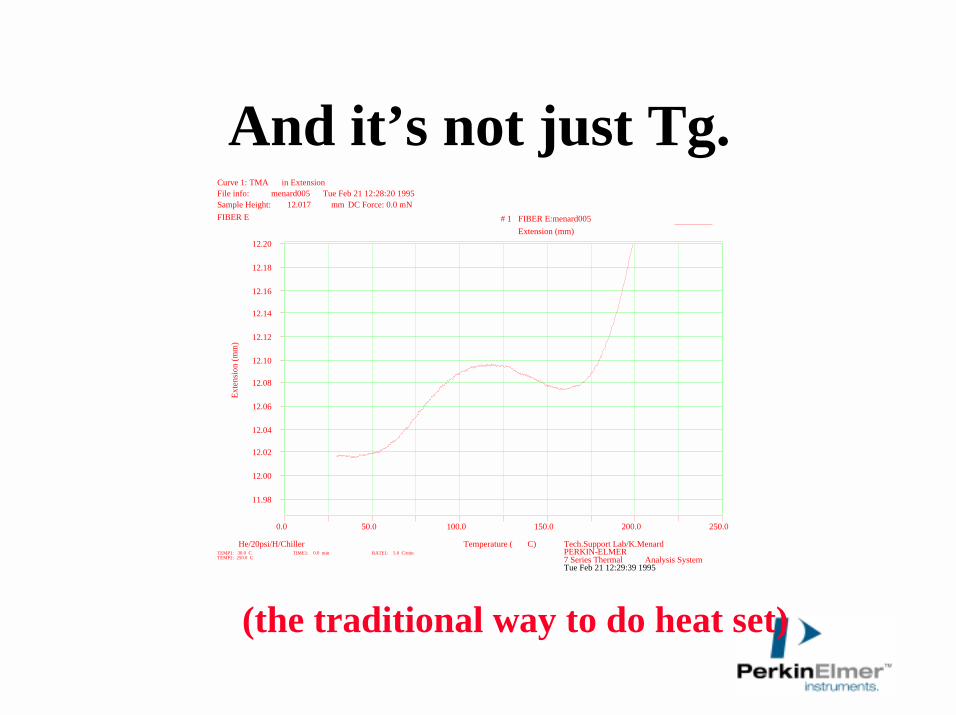
And it’s not just Tg.
0.0 50.0 100.0 150.0 200.0 250.0
11.98
12.00
12.02
12.04
12.06
12.08
12.10
12.12
12.14
12.16
12.18
12.20
Tue Feb 21 12:29:39 1995
Exte
nsio
n (m
m)
He/20psi/H/Chiller Tech.Support Lab/K.MenardTemperature ( C)
# 1 FIBER E:menard005Extension (mm)
Curve 1: TMA in ExtensionFile info: menard005 Tue Feb 21 12:28:20 1995
DC Force: 0.0 mNSample Height: 12.017 mmFIBER E
PERKIN-ELMER7 Series Thermal Analysis System
TEMP1: 30.0 C TIME1: 0.0 min RATE1: 5.0 C/minTEMP2: 250.0 C
(the traditional way to do heat set)
Time Temperature Scans at a Fixed Frequency
• hold frequency constant and vary temperature or time at temperature
• allows detection of transitions in material• allows one to study cures • most sensitive method for finding Tg• can also get changes in dimension (TMA)
while collecting DMA data• Best probe of polymer relaxations as function
of temperature
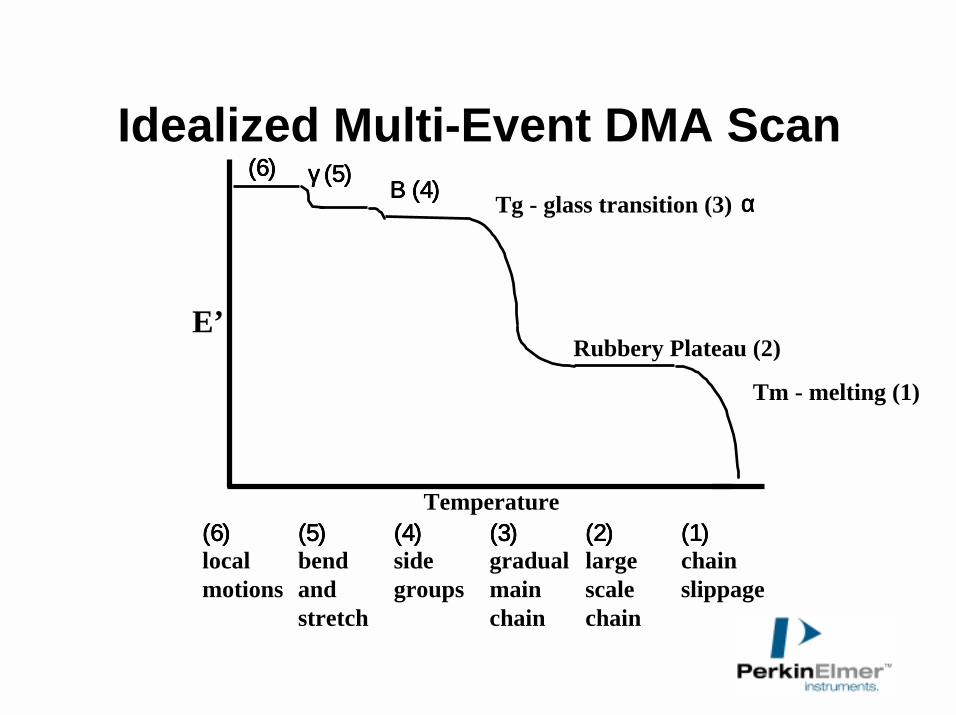
Idealized Multi-Event DMA Scan
E’
Temperature
Tm - melting (1)
Rubbery Plateau (2)
Tg - glass transition (3) ααααΒ (4)Β (4)Β (4)Β (4)
(6)(6)(6)(6) (5)(5)(5)(5) (4)(4)(4)(4) (3)(3)(3)(3) (2)(2)(2)(2) (1) (1) (1) (1) local bend side gradual large chainmotions and groups main scale slippage
stretch chain chain
γ (5)γ (5)γ (5)γ (5)(6)(6)(6)(6)
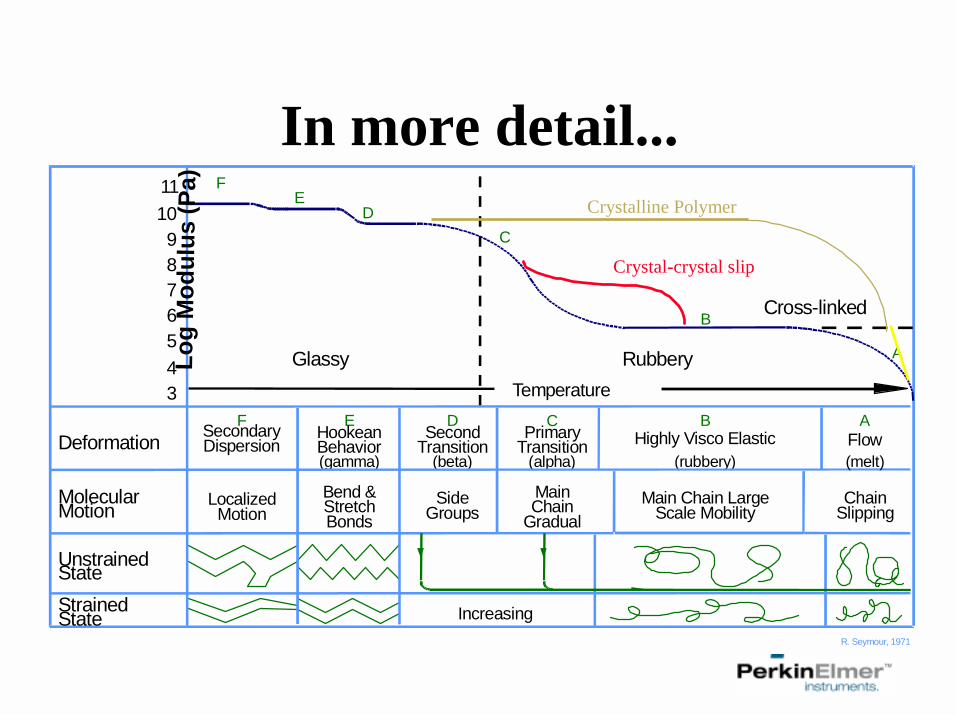
In more detail...
56789
10
Glassy Rubbery
Cross-linked
Temperature
A
B
CD
E
Deformation
MolecularMotion
UnstrainedStateStrainedState
E D C B AHookeanBehavior
SecondTransition
PrimaryTransition Highly Visco Elastic Flow
(rubbery)(gamma) (beta) (alpha)
Bend &StretchBonds
SideGroups
MainChain
GradualMain Chain Large
Scale MobilityChain
Slipping
Increasing
F
FSecondaryDispersion
LocalizedMotion
R. Seymour, 1971
(melt)
34
11Lo
gM
odul
us(P
a)
Crystal-crystal slip
Crystalline Polymer
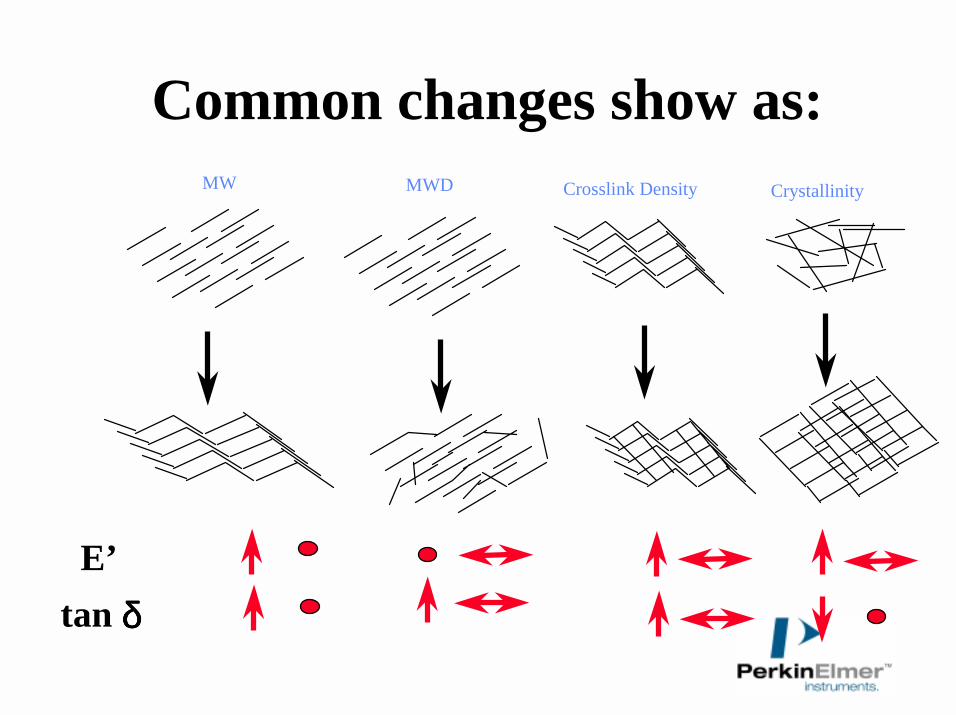
Common changes show as:
E’tan δδδδ
MW MWD Crosslink Density Crystallinity
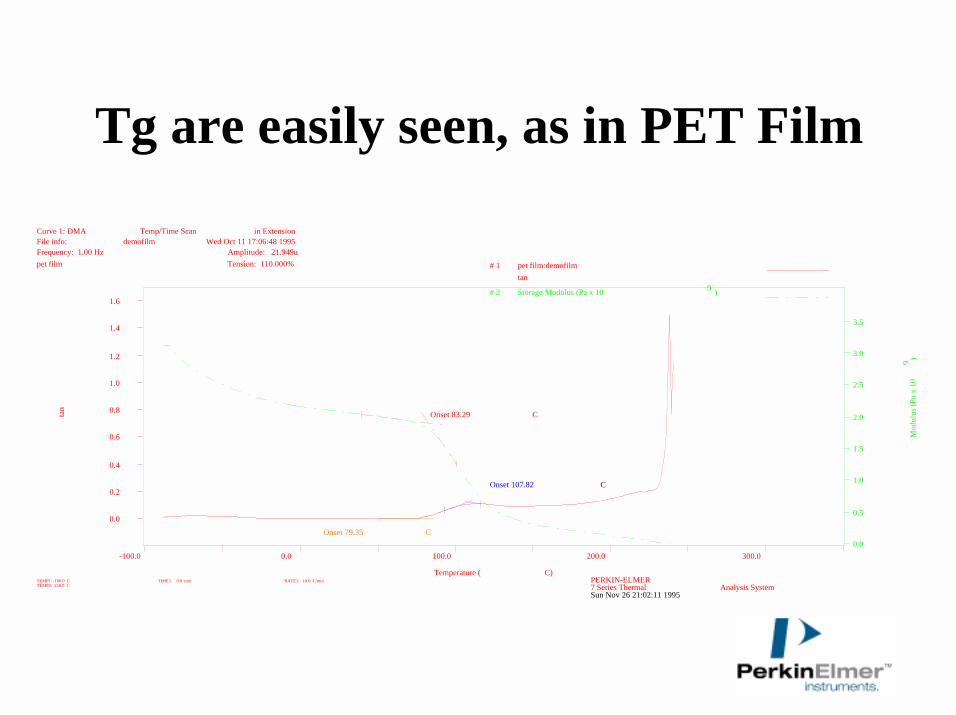
Tg are easily seen, as in PET Film
0.0
0.5
1.0
1.5
2.0
2.5
3.0
3.5
-100.0 0.0 100.0 200.0 300.0
0.0
0.2
0.4
0.6
0.8
1.0
1.2
1.4
1.6
Sun Nov 26 21:02:11 1995
Mod
ulus
(Pa
x 10
9 )
# 2 Storage Modulus (Pa x 10 9 )
Onset 83.29 Ctan
Temperature ( C)
# 1 pet film:demofilmtan
Onset 107.82 C
Onset 79.35 C
Curve 1: DMA Temp/Time Scan in ExtensionFile info: demofilm Wed Oct 11 17:06:48 1995Frequency: 1.00 Hz Amplitude: 21.949u
Tension: 110.000% pet film
PERKIN-ELMER7 Series Thermal Analysis System
TEMP1: -100.0 C TIME1: 0.0 min RATE1: 10.0 C/minTEMP2: 250.0 C
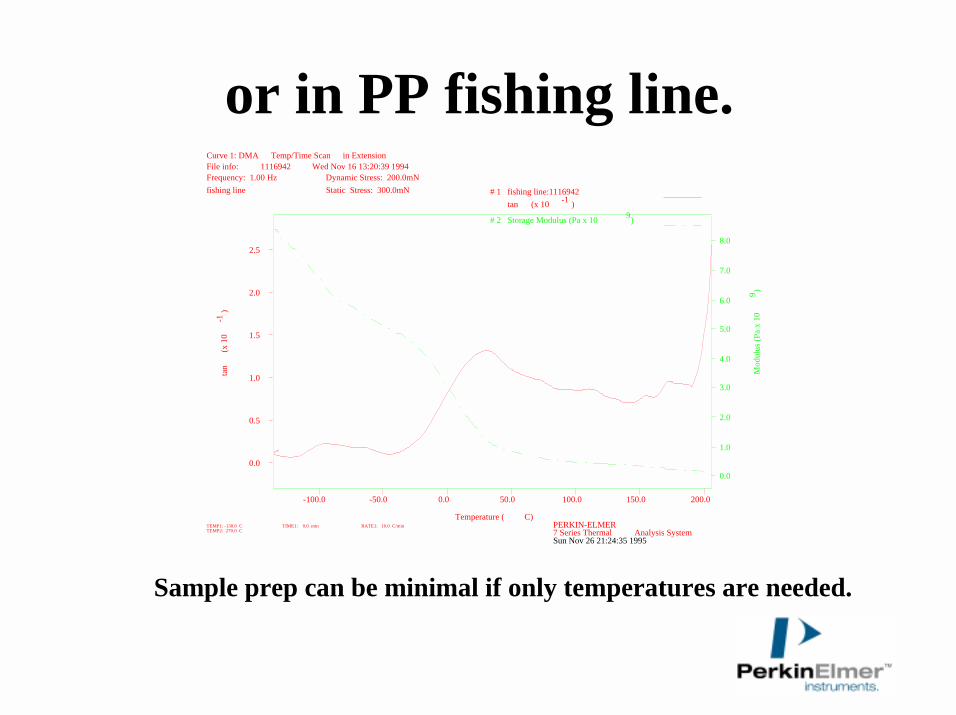
or in PP fishing line.
0.0
1.0
2.0
3.0
4.0
5.0
6.0
7.0
8.0
-100.0 -50.0 0.0 50.0 100.0 150.0 200.0
0.0
0.5
1.0
1.5
2.0
2.5
Sun Nov 26 21:24:35 1995
Mod
ulus
(Pa
x 10
9 )
# 2 Storage Modulus (Pa x 10 9) ta
n (x
10
-1)
Temperature ( C)
# 1 fishing line:1116942tan (x 10 -1 )
Curve 1: DMA Temp/Time Scan in ExtensionFile info: 1116942 Wed Nov 16 13:20:39 1994Frequency: 1.00 Hz Dynamic Stress: 200.0mN
Static Stress: 300.0mN fishing line
PERKIN-ELMER7 Series Thermal Analysis System
TEMP1: -130.0 C TIME1: 0.0 min RATE1: 10.0 C/minTEMP2: 270.0 C
Sample prep can be minimal if only temperatures are needed.
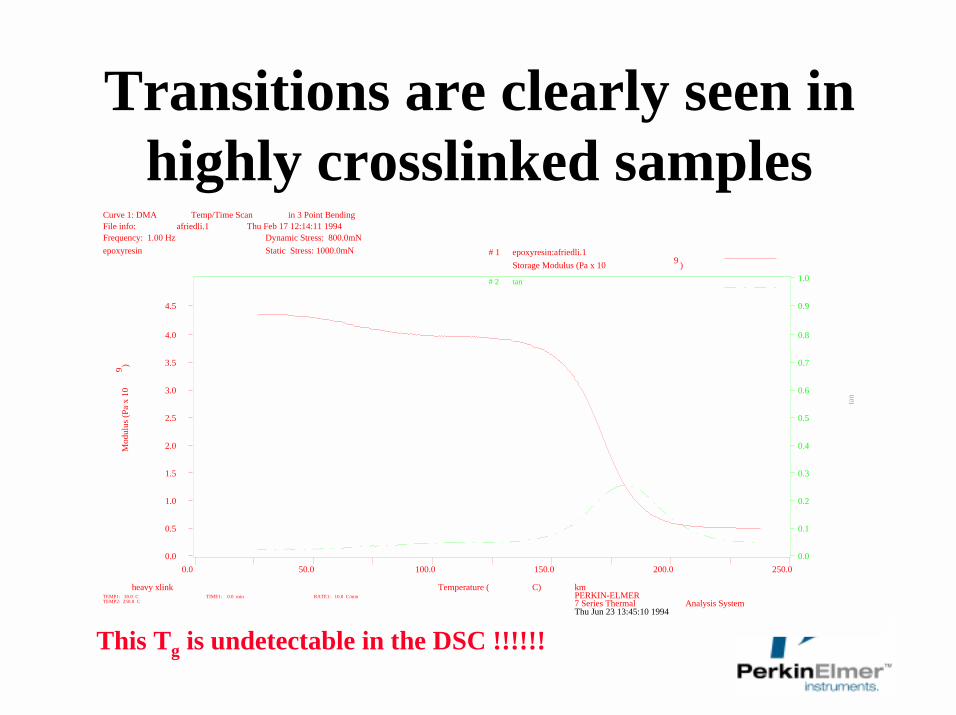
Transitions are clearly seen in highly crosslinked samples
0.0 50.0 100.0 150.0 200.0 250.00.0
0.5
1.0
1.5
2.0
2.5
3.0
3.5
4.0
4.5
0.0
0.1
0.2
0.3
0.4
0.5
0.6
0.7
0.8
0.9
1.0
Thu Jun 23 13:45:10 1994
Mod
ulus
(Pa
x 10
9 )
heavy xlink kmTemperature ( C)
# 1 epoxyresin:afriedli.1Storage Modulus (Pa x 10 9 )
Curve 1: DMA Temp/Time Scan in 3 Point BendingFile info: afriedli.1 Thu Feb 17 12:14:11 1994Frequency: 1.00 Hz Dynamic Stress: 800.0mN
Static Stress: 1000.0mN epoxyresin
PERKIN-ELMER7 Series Thermal Analysis System
TEMP1: 30.0 C TIME1: 0.0 min RATE1: 10.0 C/minTEMP2: 250.0 C
tan
# 2 tan
This Tg is undetectable in the DSC !!!!!!
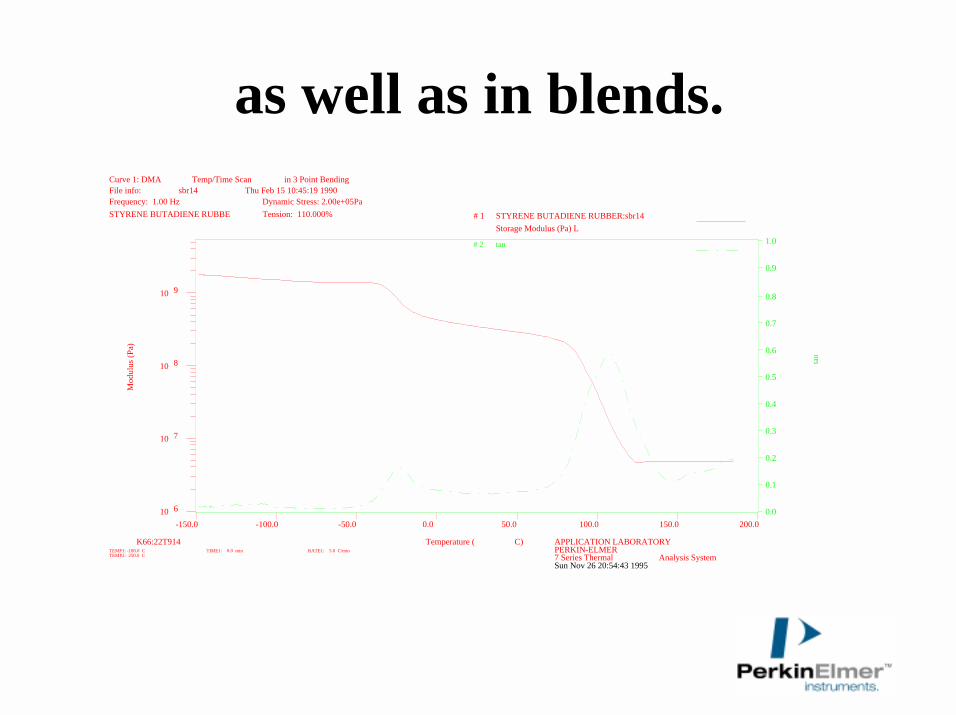
as well as in blends.
-150.0 -100.0 -50.0 0.0 50.0 100.0 150.0 200.010 6
10 7
10 8
10 9
0.0
0.1
0.2
0.3
0.4
0.5
0.6
0.7
0.8
0.9
1.0
Sun Nov 26 20:54:43 1995
Mod
ulus
(Pa)
K66:22T914 APPLICATION LABORATORYTemperature ( C)
# 1 STYRENE BUTADIENE RUBBER:sbr14Storage Modulus (Pa) L
Curve 1: DMA Temp/Time Scan in 3 Point BendingFile info: sbr14 Thu Feb 15 10:45:19 1990Frequency: 1.00 Hz Dynamic Stress: 2.00e+05Pa
Tension: 110.000% STYRENE BUTADIENE RUBBE
PERKIN-ELMER7 Series Thermal Analysis System
TEMP1: -180.0 C TIME1: 0.0 min RATE1: 5.0 C/minTEMP2: 250.0 C
tan
# 2 tan
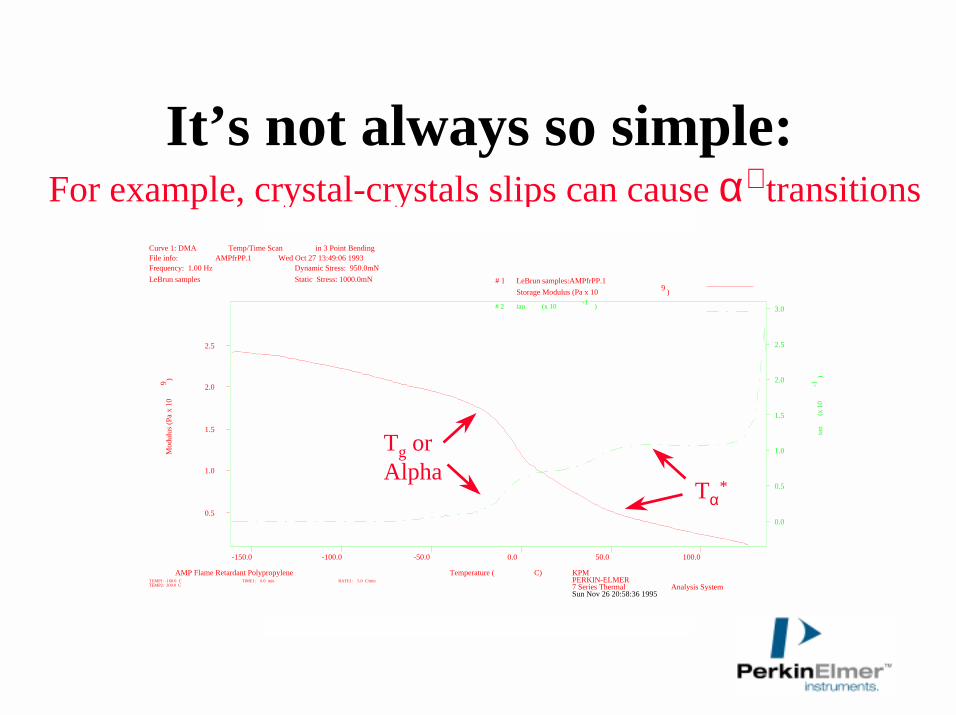
It’s not always so simple:For example, crystal-crystals slips can cause α∗ transitions
-150.0 -100.0 -50.0 0.0 50.0 100.0
0.5
1.0
1.5
2.0
2.5
0.0
0.5
1.0
1.5
2.0
2.5
3.0
Sun Nov 26 20:58:36 1995
Mod
ulus
(Pa
x 10
9 )
AMP Flame Retardant Polypropylene KPMTemperature ( C)
# 1 LeBrun samples:AMPfrPP.1Storage Modulus (Pa x 10 9 )
Curve 1: DMA Temp/Time Scan in 3 Point BendingFile info: AMPfrPP.1 Wed Oct 27 13:49:06 1993Frequency: 1.00 Hz Dynamic Stress: 950.0mN
Static Stress: 1000.0mN LeBrun samples
PERKIN-ELMER7 Series Thermal Analysis System
TEMP1: -160.0 C TIME1: 0.0 min RATE1: 5.0 C/minTEMP2: 300.0 C
tan
(x 1
0-1
)
# 2 tan (x 10 -1 )
Tg orAlpha
Tα*
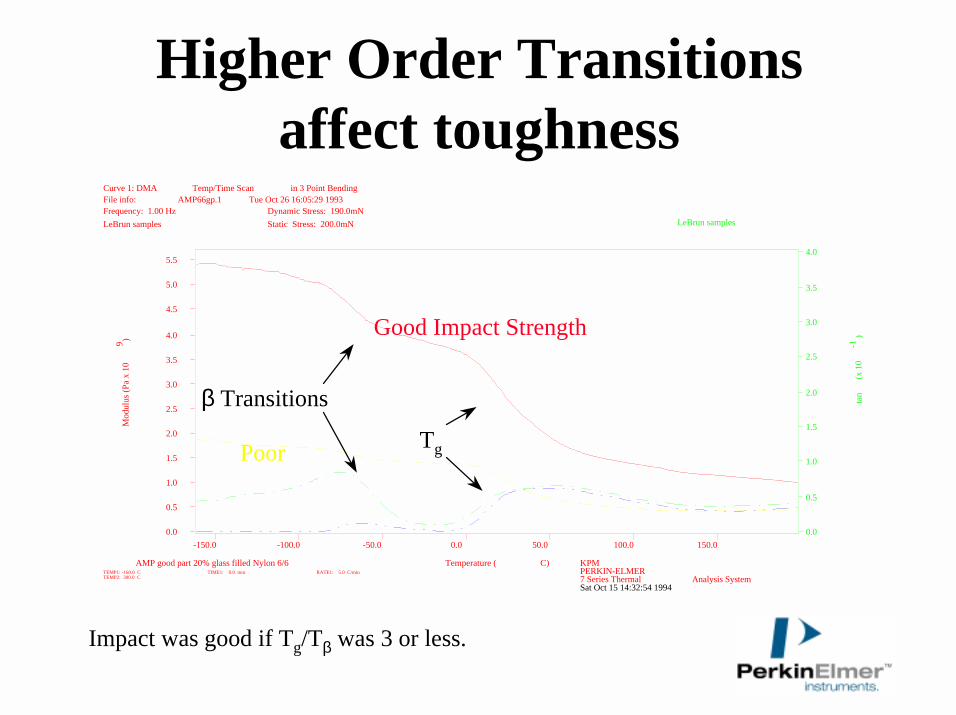
Higher Order Transitions affect toughness
0.0
0.5
1.0
1.5
2.0
2.5
3.0
3.5
4.0
-150.0 -100.0 -50.0 0.0 50.0 100.0 150.00.0
0.5
1.0
1.5
2.0
2.5
3.0
3.5
4.0
4.5
5.0
5.5
Sat Oct 15 14:32:54 1994
LeBrun samples
tan
(x 1
0-1
)
Mod
ulus
(Pa
x 10
9 )
AMP good part 20% glass filled Nylon 6/6 KPMTemperature ( C)
Curve 1: DMA Temp/Time Scan in 3 Point BendingFile info: AMP66gp.1 Tue Oct 26 16:05:29 1993Frequency: 1.00 Hz Dynamic Stress: 190.0mN
Static Stress: 200.0mN LeBrun samples
PERKIN-ELMER7 Series Thermal Analysis System
TEMP1: -160.0 C TIME1: 0.0 min RATE1: 5.0 C/minTEMP2: 300.0 C
β Transitions
Tg
Good Impact Strength
Poor
Impact was good if Tg/Tβ was 3 or less.
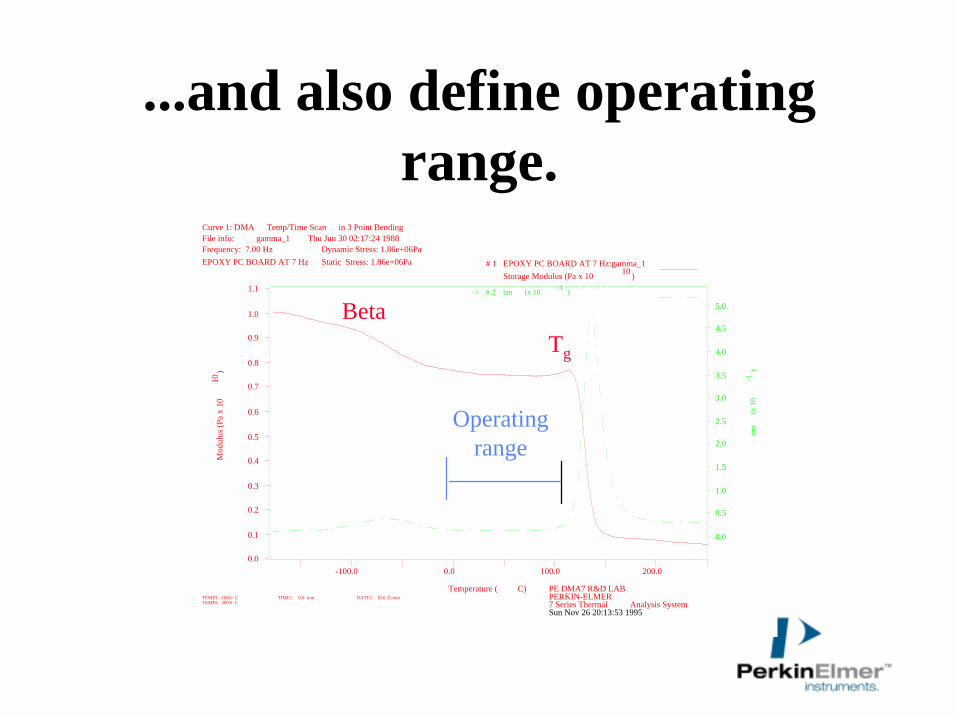
...and also define operating range.
-100.0 0.0 100.0 200.00.0
0.1
0.2
0.3
0.4
0.5
0.6
0.7
0.8
0.9
1.0
1.1
0.0
0.5
1.0
1.5
2.0
2.5
3.0
3.5
4.0
4.5
5.0
Sun Nov 26 20:13:53 1995
Mod
ulus
(Pa
x 10
10)
PE DMA7 R&D LABTemperature ( C)
# 1 EPOXY PC BOARD AT 7 Hz:gamma_1Storage Modulus (Pa x 10 10 )
Curve 1: DMA Temp/Time Scan in 3 Point BendingFile info: gamma_1 Thu Jun 30 02:17:24 1988Frequency: 7.00 Hz Dynamic Stress: 1.86e+06Pa
Static Stress: 1.86e+06Pa EPOXY PC BOARD AT 7 Hz
PERKIN-ELMER7 Series Thermal Analysis System
TEMP1: -180.0 C TIME1: 0.0 min RATE1: 10.0 C/minTEMP2: 300.0 C
tan
(x 1
0-1
)
-> # 2 tan (x 10 -1 )
BetaTg
Operatingrange
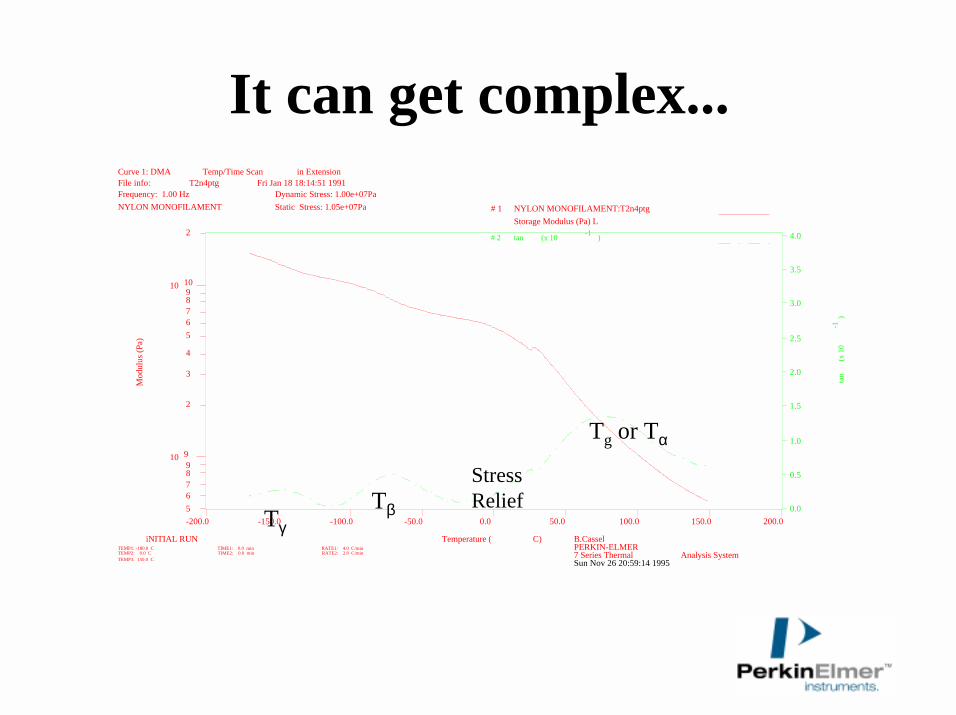
It can get complex...
-200.0 -150.0 -100.0 -50.0 0.0 50.0 100.0 150.0 200.056789
10 9
2
3
4
56789
10 10
2
0.0
0.5
1.0
1.5
2.0
2.5
3.0
3.5
4.0
Sun Nov 26 20:59:14 1995
Mod
ulus
(Pa)
iNITIAL RUN B.CasselTemperature ( C)
# 1 NYLON MONOFILAMENT:T2n4ptgStorage Modulus (Pa) L
Curve 1: DMA Temp/Time Scan in ExtensionFile info: T2n4ptg Fri Jan 18 18:14:51 1991Frequency: 1.00 Hz Dynamic Stress: 1.00e+07Pa
Static Stress: 1.05e+07Pa NYLON MONOFILAMENT
PERKIN-ELMER7 Series Thermal Analysis System
TEMP1: -180.0 C TIME1: 0.0 min RATE1: 4.0 C/minTEMP2: 0.0 C TIME2: 0.0 min RATE2: 2.0 C/minTEMP3: 150.0 C
tan
(x 1
0-1
)
# 2 tan (x 10 -1 )
Tg or Tα
StressReliefTβTγ
Curing of Thermosets
• can be studied at constant temperature or by a temperature ramp
• can get minimum viscosity, gelation point (time), vitrification point, and activation energies from DMA curve
• can adapt instrument to do simultaneous DEA-DMA to follow cure to completion
• cure studies are not limited to polymeric systems but include food products like cakes and cookies
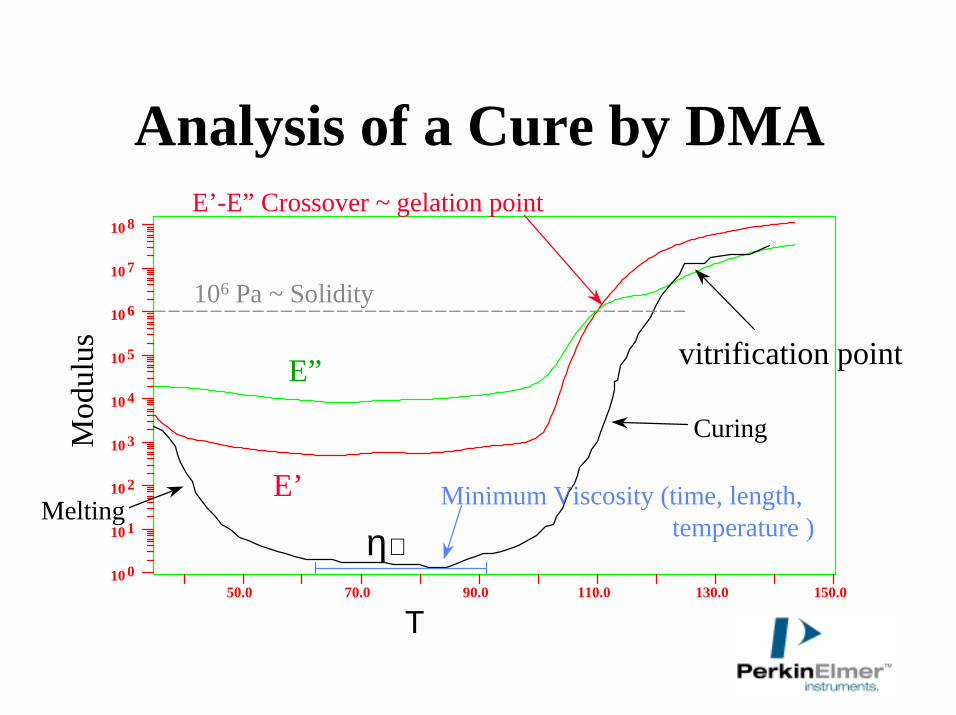
Analysis of a Cure by DMA
50.0 70.0 90.0 110.0 130.0 150.010 0
10 1
10 2
10 3
10 4
10 5
10 6
10 7
10 8
E’
E”
Mod
ulus
Τ
η∗
E’-E” Crossover ~ gelation point
vitrification point
Minimum Viscosity (time, length,temperature )
106 Pa ~ Solidity
Melting
Curing
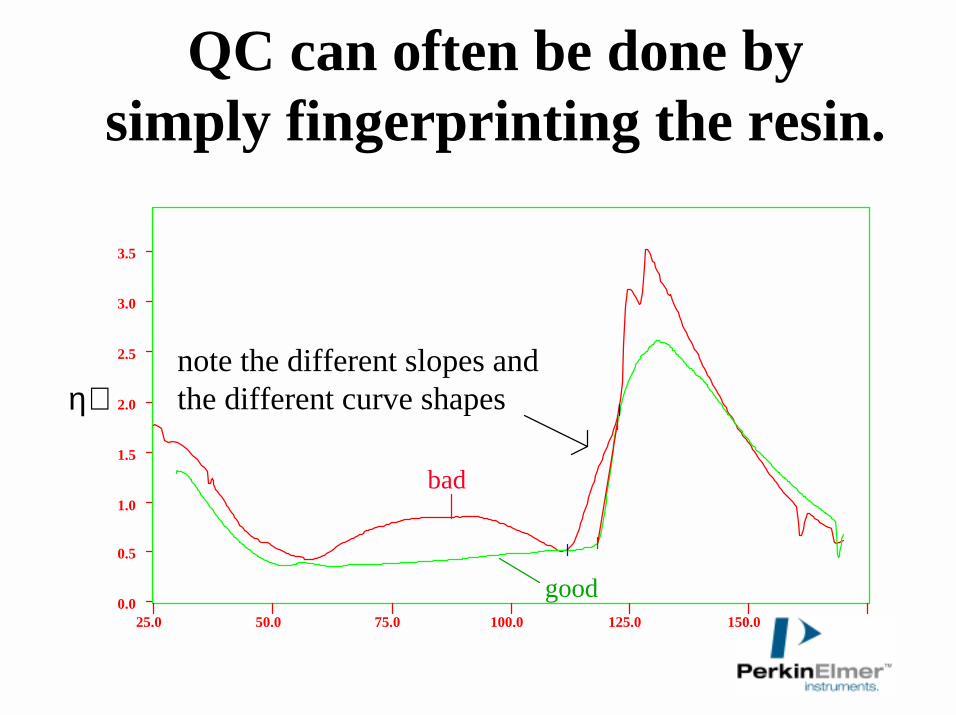
QC can often be done by simply fingerprinting the resin.
25.0 50.0 75.0 100.0 125.0 150.00.0
0.5
1.0
1.5
2.0
2.5
3.0
3.5
η∗note the different slopes andthe different curve shapes
good
bad
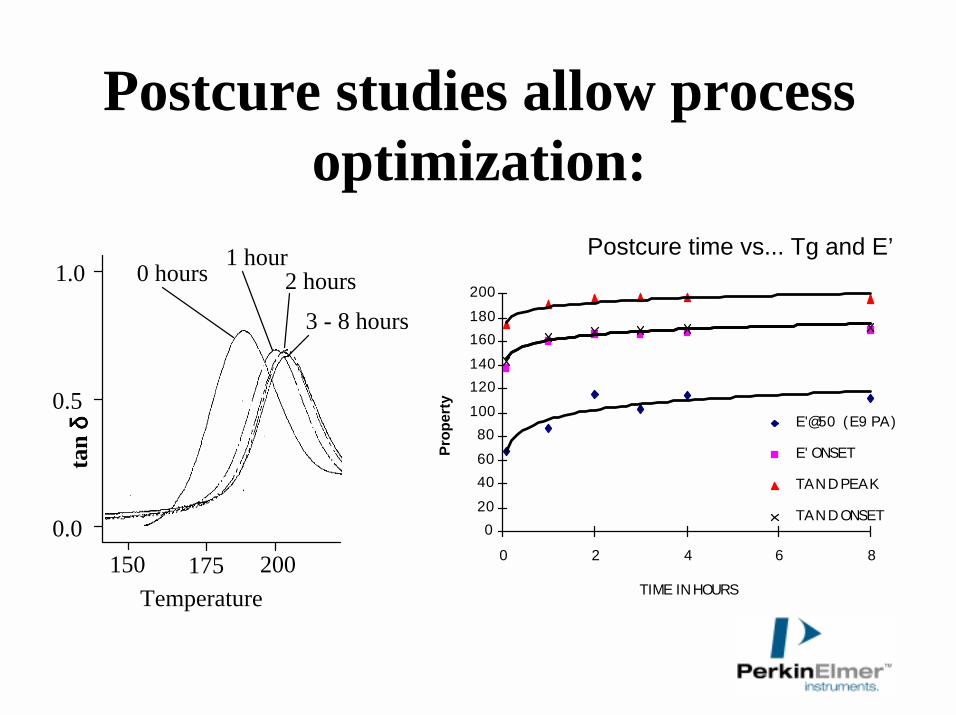
Postcure studies allow process optimization:
Prop
erty
Postcure time vs... Tg and E’
0
20
40
60
80
100
120
140
160
180
200
0 2 4 6 8
TIME IN HOURS
E'@50 (E9 PA)
E' ONSET
TAN D PEAK
TAN D ONSET
tan
δ δδδ
Temperature
1.0
0.5
0.0
0 hours1 hour
2 hours
3 - 8 hours
150 200175
Frequency Scans
• hold temperature constant and vary frequency• allows one to look at trends in material• can estimate changes in MW and MWD• looks at both tack-like and peel-like behavior• can use data for Time Temperature Superposition
to extend frequency range or predict age life.
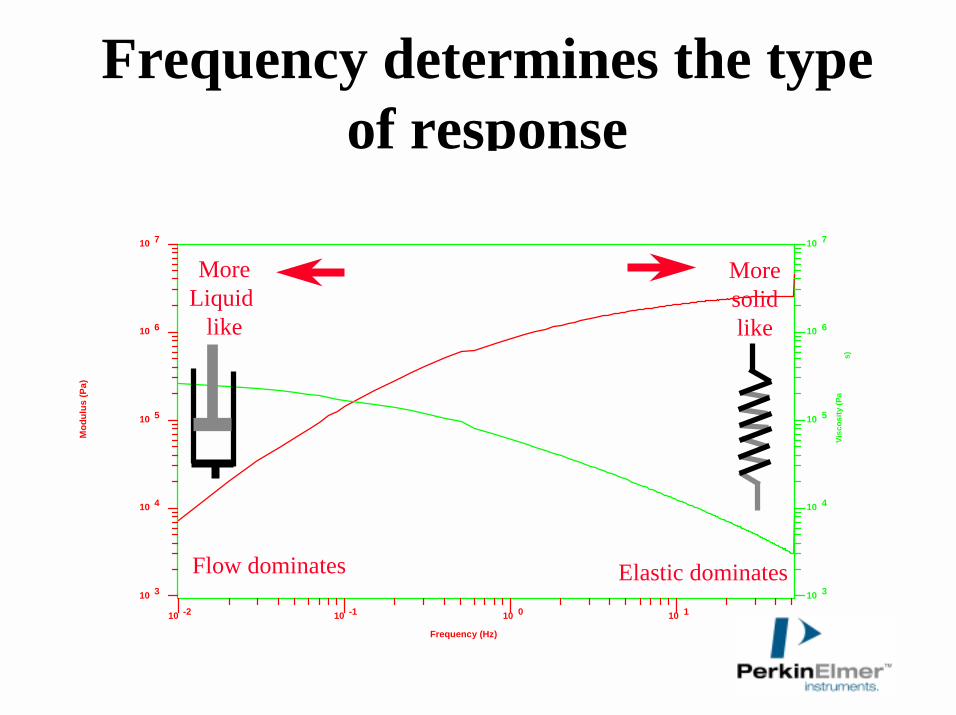
Frequency determines the type of response
10 -2 10 -1 10 0 10 110 3
10 4
10 5
10 6
10 7
10 3
10 4
10 5
10 6
10 7
Mod
ulus
(Pa)
Frequency (Hz)
Visc
osity
(Pa
s)
MoreLiquid
like
Moresolidlike
Flow dominates Elastic dominates
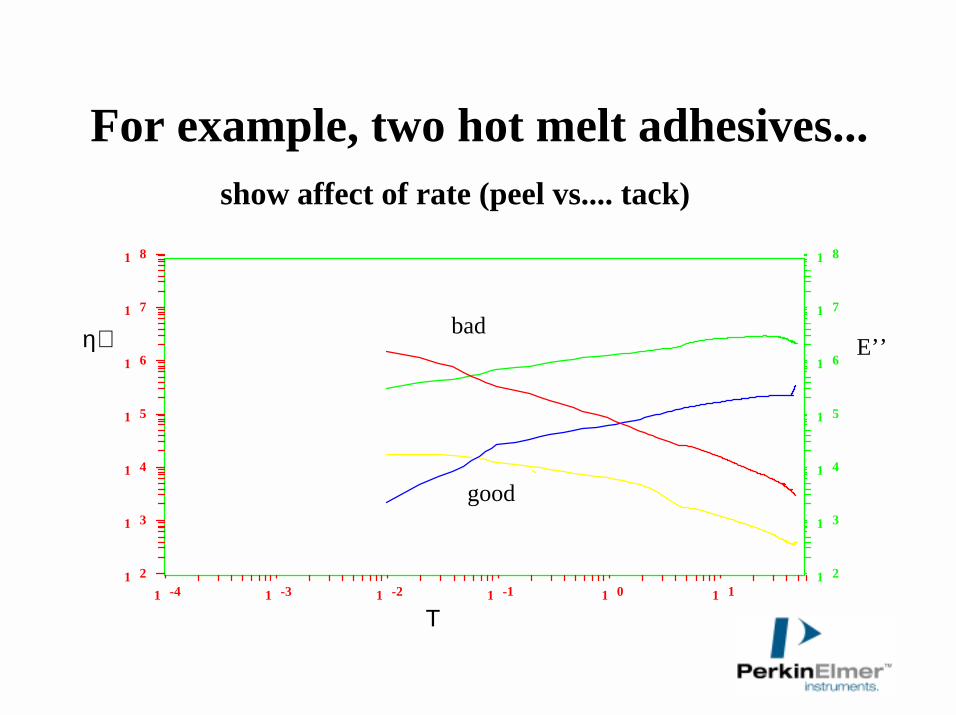
For example, two hot melt adhesives...
Τ
10 2
10 3
10 4
10 5
10 6
10 7
10 8
10 -4 10 -3 10 -2 10 -1 10 0 10 110 2
10 3
10 4
10 5
10 6
10 7
10 8
η∗ E’’
show affect of rate (peel vs.... tack)
good
bad
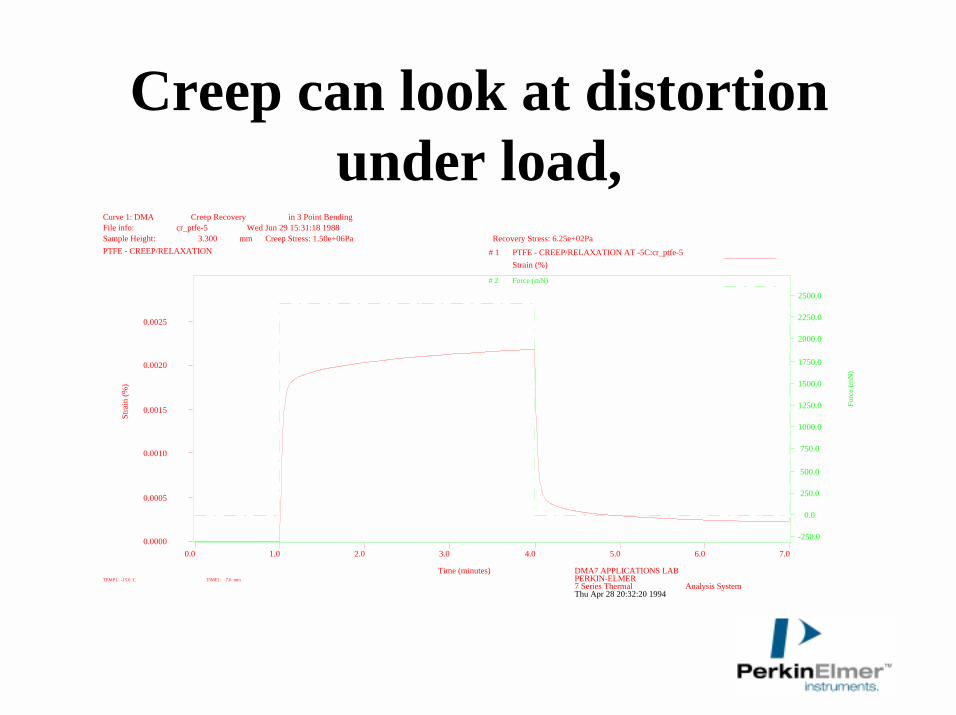
Creep can look at distortion under load,
0.0 1.0 2.0 3.0 4.0 5.0 6.0 7.00.0000
0.0005
0.0010
0.0015
0.0020
0.0025
-250.0
0.0
250.0
500.0
750.0
1000.0
1250.0
1500.0
1750.0
2000.0
2250.0
2500.0
Thu Apr 28 20:32:20 1994
Stra
in (%
)
DMA7 APPLICATIONS LABTime (minutes)
# 1 PTFE - CREEP/RELAXATION AT -5C:cr_ptfe-5Strain (%)
Curve 1: DMA Creep Recovery in 3 Point BendingFile info: cr_ptfe-5 Wed Jun 29 15:31:18 1988Sample Height: 3.300 mm Creep Stress: 1.50e+06Pa Recovery Stress: 6.25e+02Pa PTFE - CREEP/RELAXATION
PERKIN-ELMER7 Series Thermal Analysis System
TEMP1: -15.0 C TIME1: 7.0 min
Forc
e (m
N)
# 2 Force (mN)
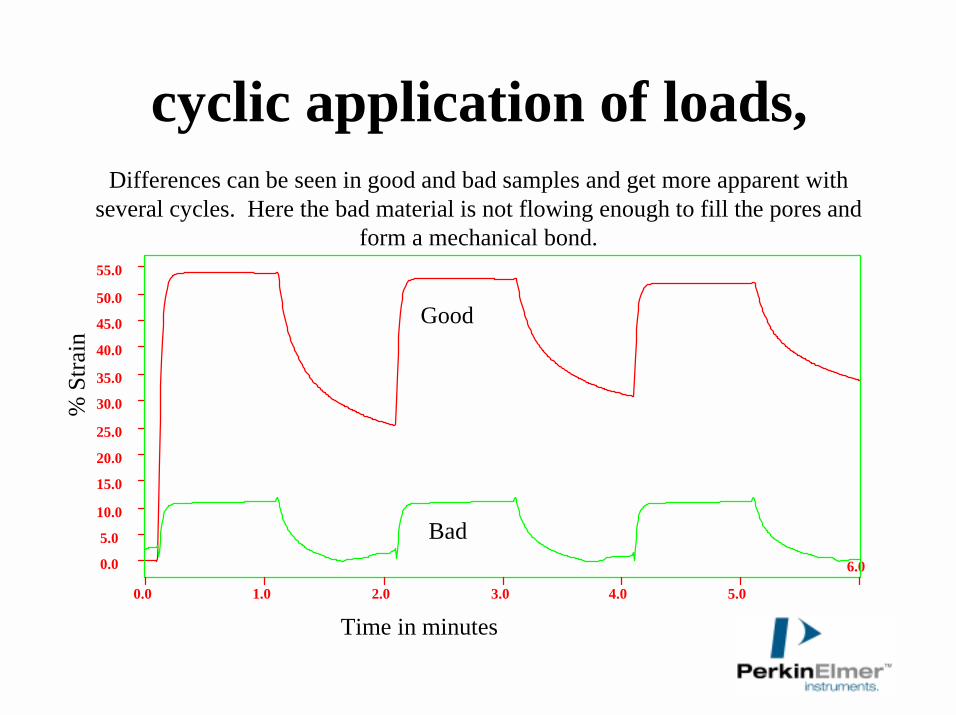
cyclic application of loads,
6.0
Time in minutes
% S
train
0.0 1.0 2.0 3.0 4.0 5.0
0.0
5.0
10.0
15.0
20.0
25.0
30.0
35.0
40.0
45.0
50.0
55.0
Good
Bad
Differences can be seen in good and bad samples and get more apparent with several cycles. Here the bad material is not flowing enough to fill the pores and
form a mechanical bond.
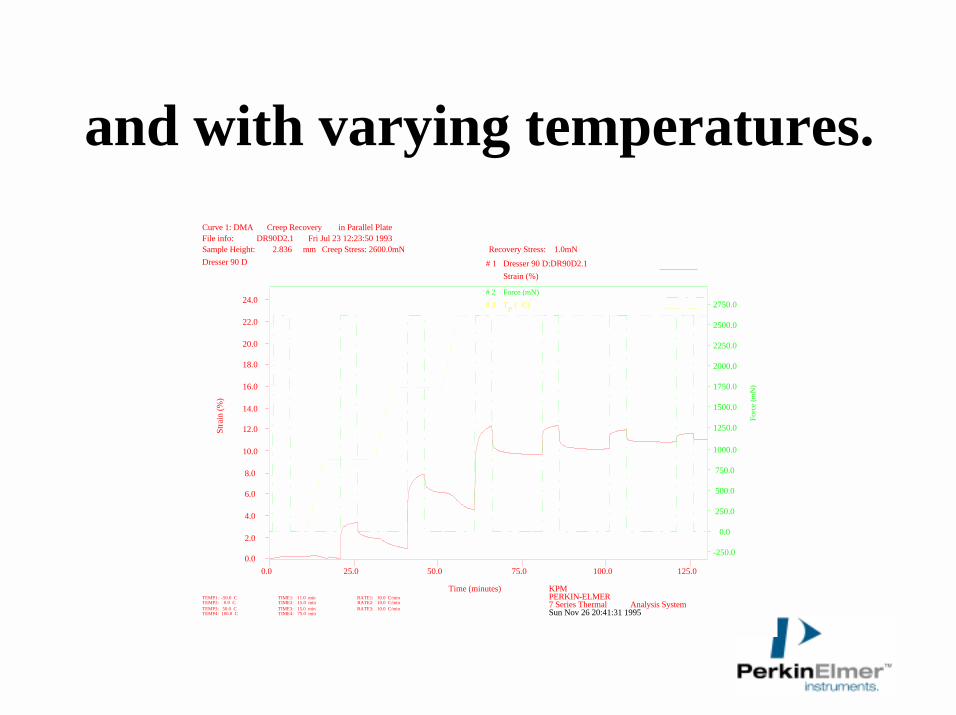
and with varying temperatures.
0.0 25.0 50.0 75.0 100.0 125.0 0.0
2.0
4.0
6.0
8.0
10.0
12.0
14.0
16.0
18.0
20.0
22.0
24.0
-250.0
0.0
250.0
500.0
750.0
1000.0
1250.0
1500.0
1750.0
2000.0
2250.0
2500.0
2750.0
Sun Nov 26 20:41:31 1995
Stra
in (%
)
KPMTime (minutes)
# 1 Dresser 90 D:DR90D2.1Strain (%)
Curve 1: DMA Creep Recovery in Parallel PlateFile info: DR90D2.1 Fri Jul 23 12:23:50 1993Sample Height: 2.836 mm Creep Stress: 2600.0mN Recovery Stress: 1.0mN Dresser 90 D
PERKIN-ELMER7 Series Thermal Analysis System
TEMP1: -50.0 C TIME1: 11.0 min RATE1: 10.0 C/minTEMP2: 0.0 C TIME2: 15.0 min RATE2: 10.0 C/minTEMP3: 50.0 C TIME3: 15.0 min RATE3: 10.0 C/minTEMP4: 100.0 C TIME4: 75.0 min
# 3 TP ( C)
Forc
e (m
N)
# 2 Force (mN)
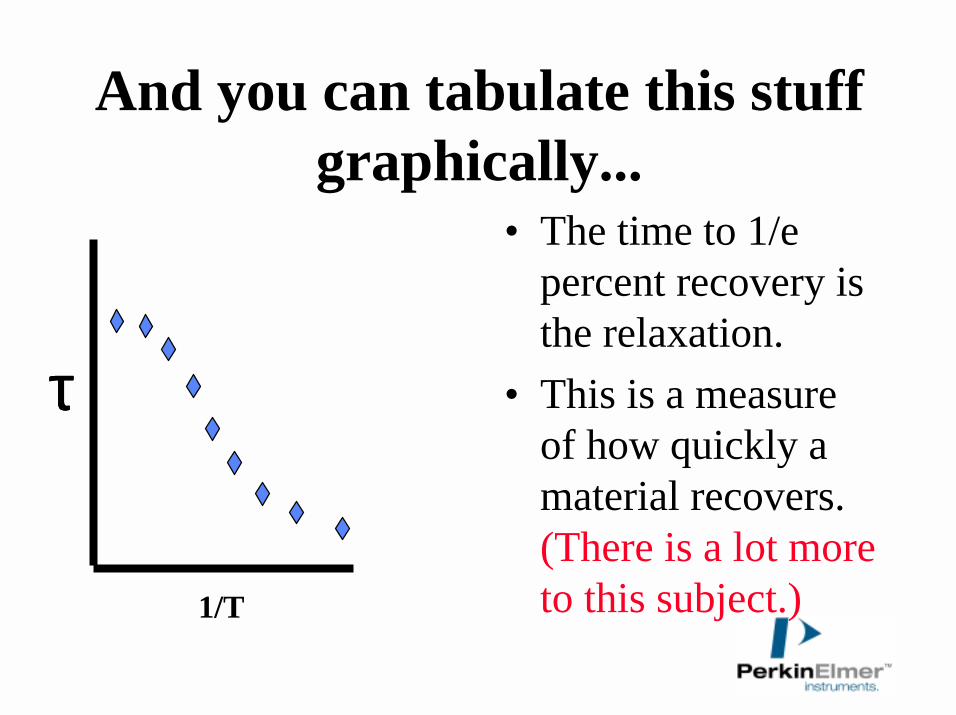
And you can tabulate this stuff graphically...
• The time to 1/e percent recovery is the relaxation.
• This is a measure of how quickly a material recovers. (There is a lot more to this subject.)1/T
ττττ
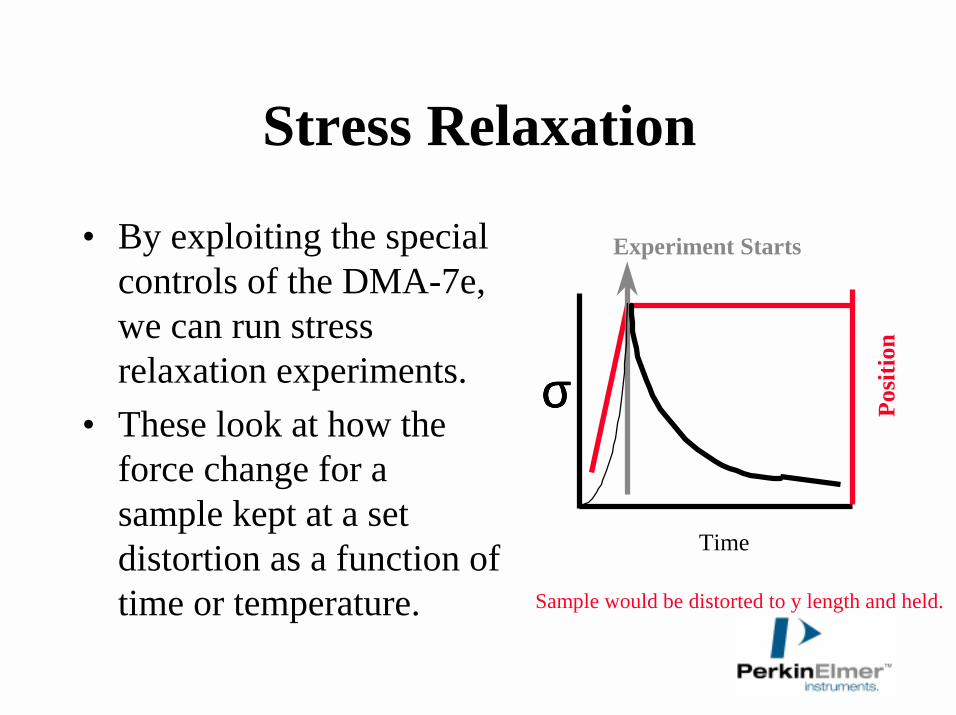
Stress Relaxation
• By exploiting the special controls of the DMA-7e, we can run stress relaxation experiments.
• These look at how the force change for a sample kept at a set distortion as a function of time or temperature.
Time
Posi
tion
Experiment Starts
σσσσ
Sample would be distorted to y length and held.
Don’t forget the DMA-7e also does Stress Scans
• can do either static or dynamic ramps• static scans calculate Young’s modulus and
stress-strain curves• dynamic scans give material response to
increasing oscillatory forces:– get complex viscosity and modulus for each data point– can look at changes in elasticity (E’) and lag (phase angle) with
increasing stress
• Both methods are fast tests for QC applications after the material has been fully characterized by other DMA modes.
Specialized Testing is Possible...
The design of the DMA-7e makes it possible to do:
Time-Temperature Superposition (TTS)DEA/DMA
Tests in SolutionMicroscopic DMA
Photo DMADMA-?
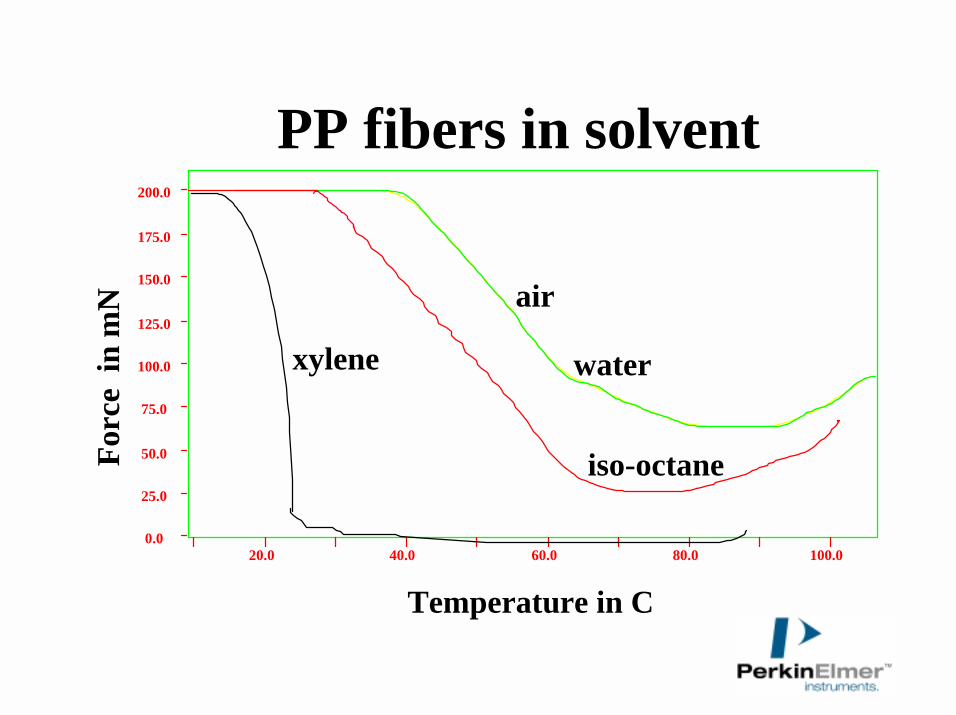
PP fibers in solvent
20.0 40.0 60.0 80.0 100.00.0
25.0
50.0
75.0
100.0
125.0
150.0
175.0
200.0
Forc
e in
mN
Temperature in C
xylene
iso-octane
air
water
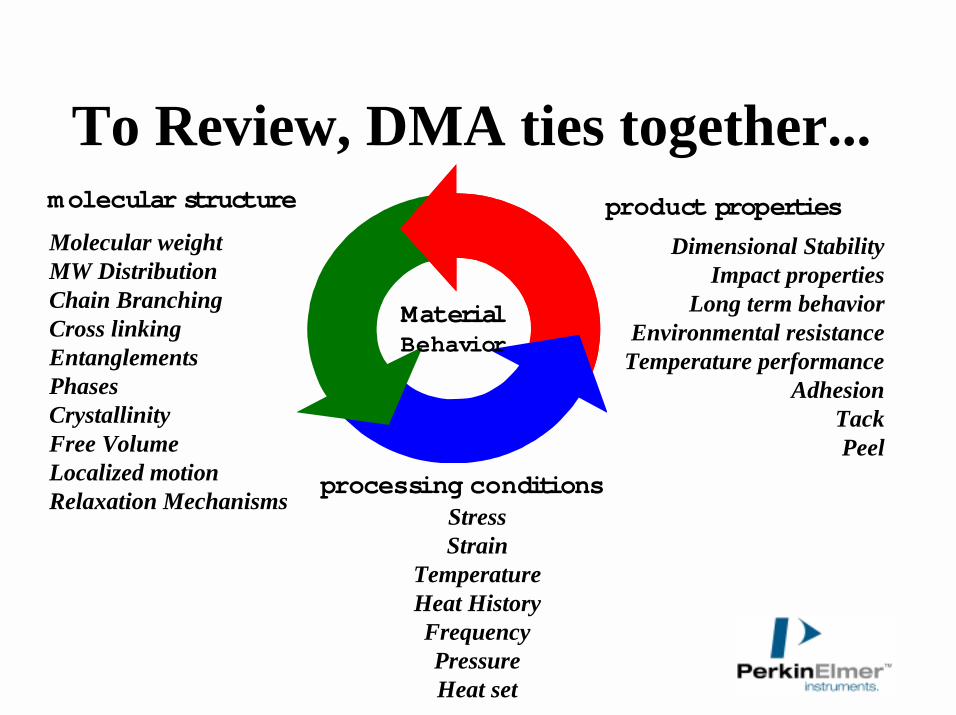
To Review, DMA ties together...molecular structure
processing conditions
product properties
Molecular weightMW DistributionChain BranchingCross linkingEntanglementsPhasesCrystallinityFree VolumeLocalized motionRelaxation Mechanisms Stress
StrainTemperatureHeat HistoryFrequencyPressureHeat set
MaterialBehavior
Dimensional StabilityImpact properties
Long term behaviorEnvironmental resistance
Temperature performanceAdhesion
TackPeel
Conclusions• DMA allows you to preform a wide range of
tests from sensitive probes of molecular structure to model studies.
• the DMA-7e allows operation as six different instruments to maximize flexibility.
• Data can be overlayed with DSC, TGA, TMA, and DTA for easier analysis.
References: Books• Menard, DMA: Introduction to the Technique, Its Applications and Theory,
CRC Press, 1999.• Brostow et a., Failure of Plastics, Hanser, 1986.• Ferry, Viscoelastic Properties of Polymers, Wiley, 1980.• Gordon et al., Computer Programs for Rheologists, Hanser, 1995.• Gol'dman, Prediction of Deformation Properties of Polymeric and Composite
Materials,, ACS, 1994.• Mascosko, Rheology, VCH, 1993.• Matsouka, Relaxation Phenomena in Polymers, Hanser, 1993.• McCrum et al, Anelastic and Dielectric Properties of Polymeric Solids, Dover,
1992 (reprint of 1967 edition).• Nielsen et al., Mechanical Properties of Polymers and Composites, Dekker,
1994.• Sperling, Introduction to Physical Polymer Science, Academic Press, 1994.• Ward et al., Introduction to Mechanical Properties of Solid Polymers, Wiley,
1993.