Dual data driven SIMCA as a one-class classifier
39
Dual data driven Dual data driven SIMCA as a one-class SIMCA as a one-class classifier classifier 20.02.14 1 WSC-9 Alexey Pomerantsev ICP RAS
-
Upload
gersemi-hannes -
Category
Documents
-
view
36 -
download
3
description
Dual data driven SIMCA as a one-class classifier. Alexey Pomerantsev ICP RAS. Target. Alternative. One-class classifier, e.g. SIMCA. Standard bi- variate normal distribution. Extremes and Outliers. =0.01 γ =0.05. α is Extreme significance. γ is Outlier significance. Extreme plot. A. - PowerPoint PPT Presentation
Transcript of Dual data driven SIMCA as a one-class classifier
Dual data driven SIMCA Dual data driven SIMCA as a one-class classifieras a one-class classifier
20.02.14 1WSC-9
Alexey PomerantsevICP RAS
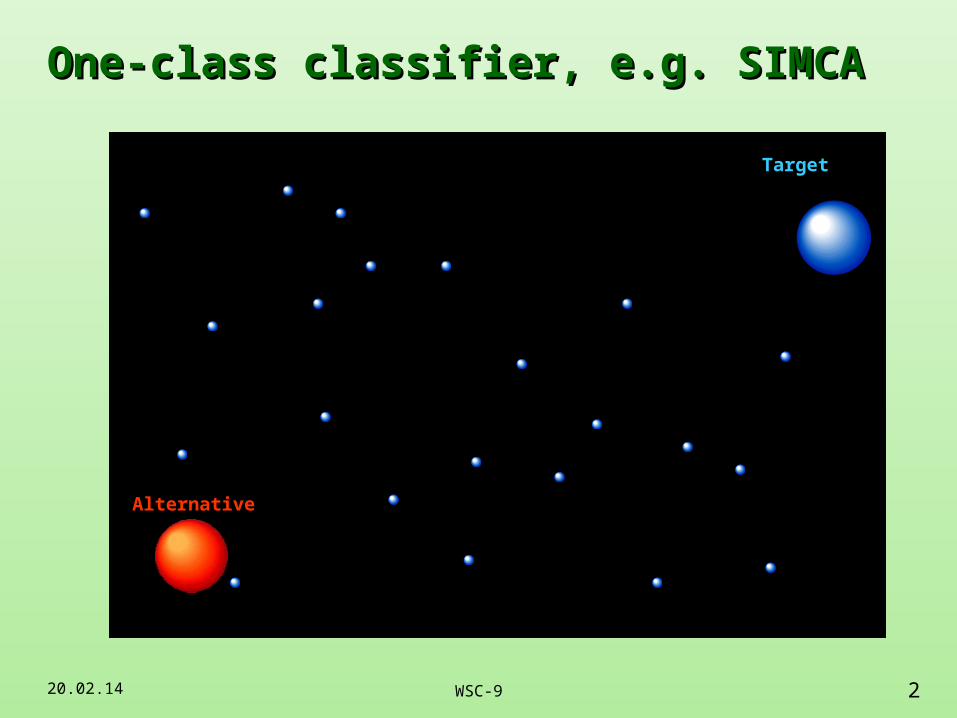
One-class classifier, e.g. SIMCAOne-class classifier, e.g. SIMCA
20.02.14 2WSC-9
Target
Alternative

Standard bi-variate normal distributionStandard bi-variate normal distribution
20.02.14 3WSC-9
)2(~
),(~
222
yx
Ny
xI0
Iyx 1222 )1(|2
)1|2(222 yx
20.02.14 4WSC-9
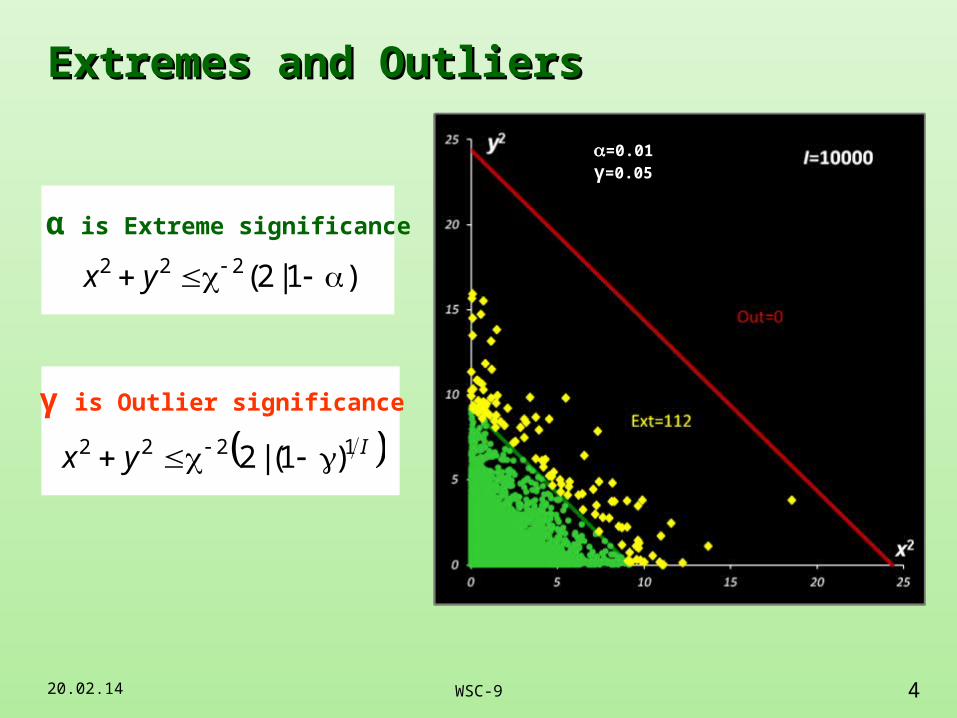
Extremes and OutliersExtremes and Outliers
α is Extreme significance
=0.01
γ=0.05
γ is Outlier significance
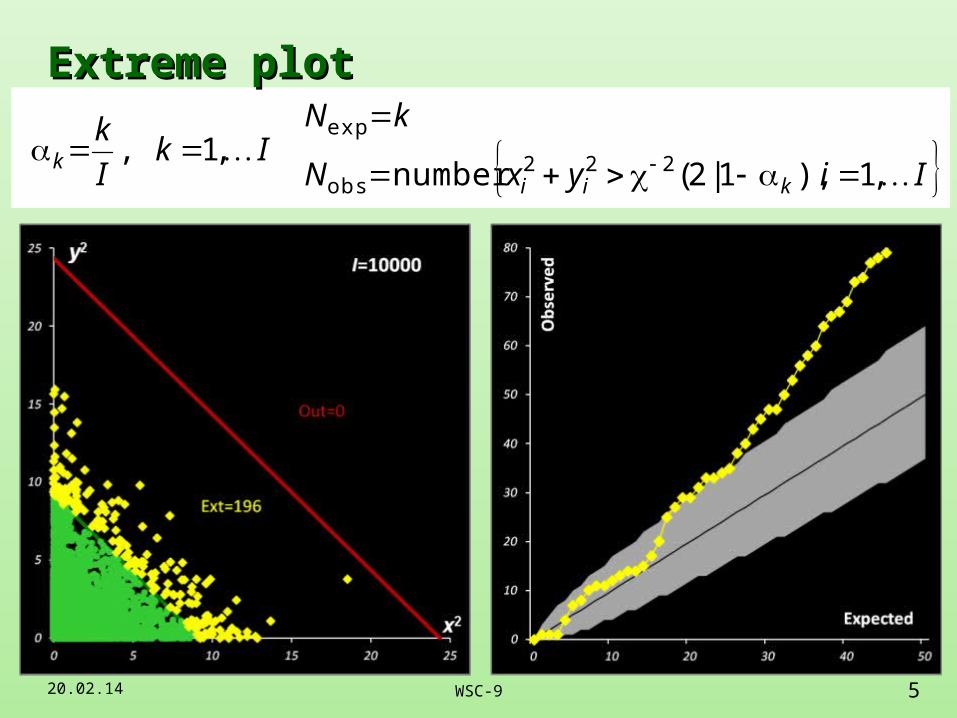
Extreme plotExtreme plot
20.02.14 5WSC-9
Ik
I
kk ,1,
IiyxN
kN
kii ,1),1|2(number 222obs
exp
20.02.14 6WSC-9
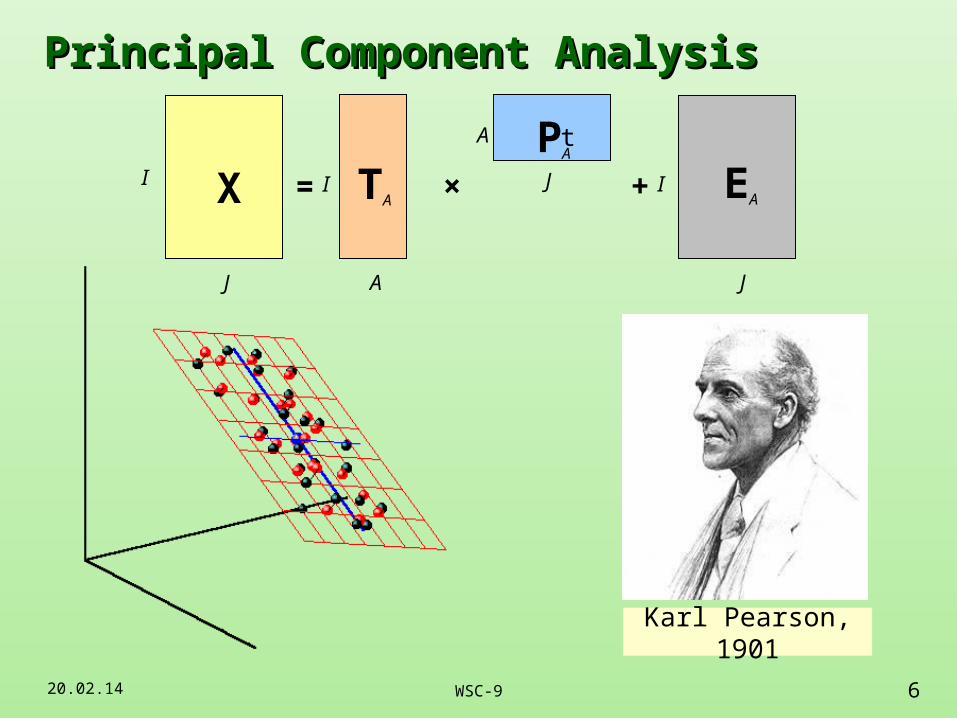
Principal Component AnalysisPrincipal Component Analysis
I
A
TA
A PA
EA+X I= × J
J
t
I
J
Karl Pearson, 1901

20.02.14 7WSC-9
Scores & Orthogonal DistancesScores & Orthogonal DistancesSD:distance within the model
A
a a
iaiii
th
1
21tt )( tTTt
OD:distance to the model
K
Aaia
J
jiji tev
1
2
1
2
ODSD
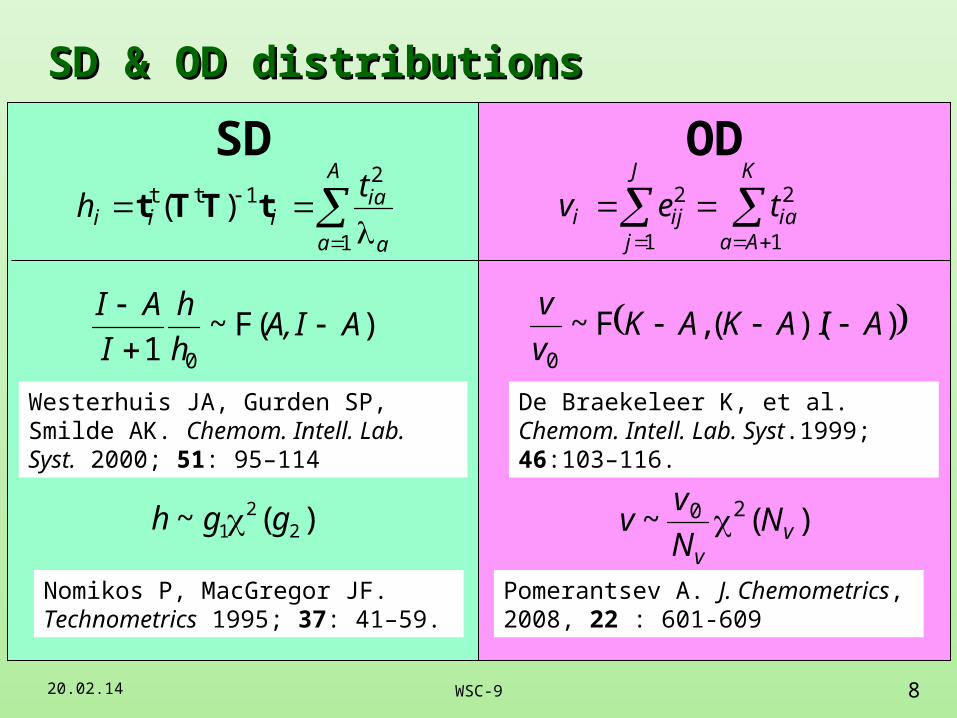
SD & OD distributionsSD & OD distributions
20.02.14 8WSC-9
A
a a
iaiii
th
1
21tt )( tTTt
K
Aaia
J
jiji tev
1
2
1
2
)(~ 22
1 ggh
Nomikos P, MacGregor JF. Technometrics 1995; 37: 41–59.
))((,F~0
AIAKAKv
v
De Braekeleer K, et al. Chemom. Intell. Lab. Syst.1999; 46:103–116.
)F(~
1 0
AIA,h
h
I
AI
Westerhuis JA, Gurden SP, Smilde AK. Chemom. Intell. Lab. Syst. 2000; 51: 95–114
)(~ 20
vv
NN
vv
Pomerantsev A. J. Chemometrics, 2008, 22 : 601-609
20.02.14 9WSC-9
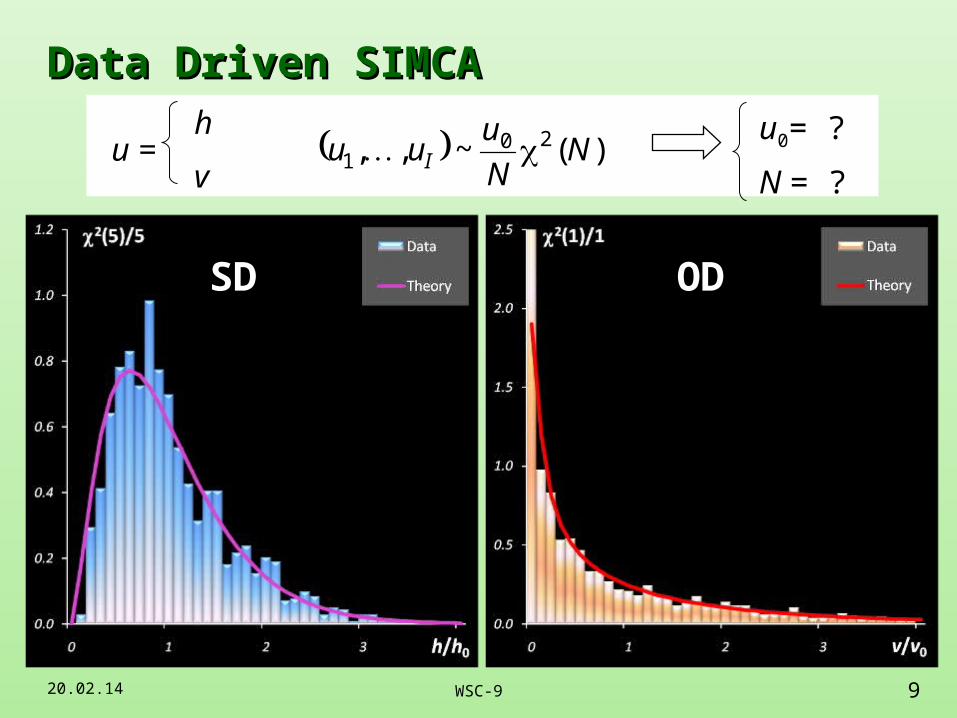
Data Driven SIMCAData Driven SIMCA
SD OD
hu = v
u0= ?
N = ?
)(~,, 201 N
N
uuu I
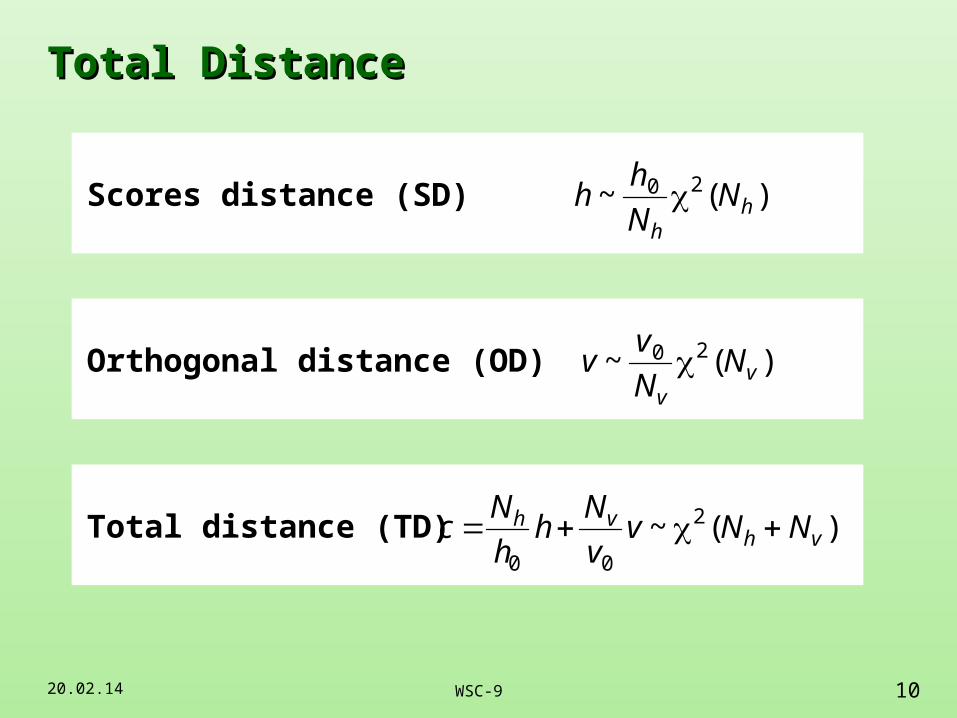
Total DistanceTotal Distance
20.02.14 10WSC-9
Scores distance (SD)
)(~ 20h
h
NN
hh
Orthogonal distance (OD)
)(~ 20v
v
NN
vv
Total distance (TD)
)(~ 2
00vh
vh NNvv
Nh
h
Nc
20.02.14 11WSC-9
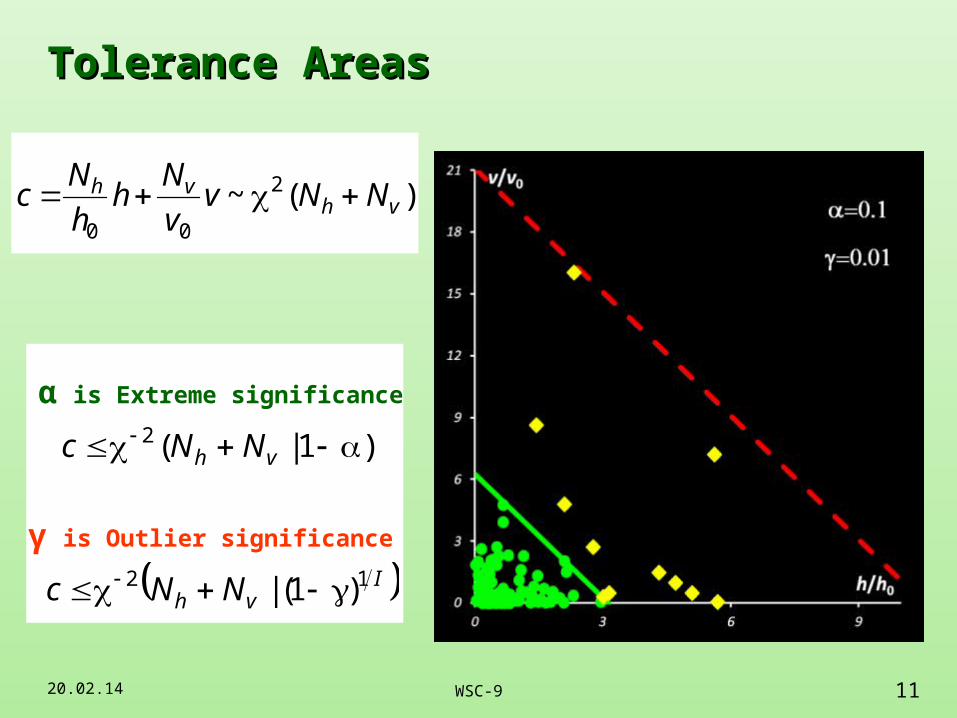
Tolerance AreasTolerance Areas
α is Extreme significance
γ is Outlier significance
Ivh NNc 12 )1(|
)1|(2 vh NNc
)(~ 2
00vh
vh NNvv
Nh
h
Nc
20.02.14 12WSC-9
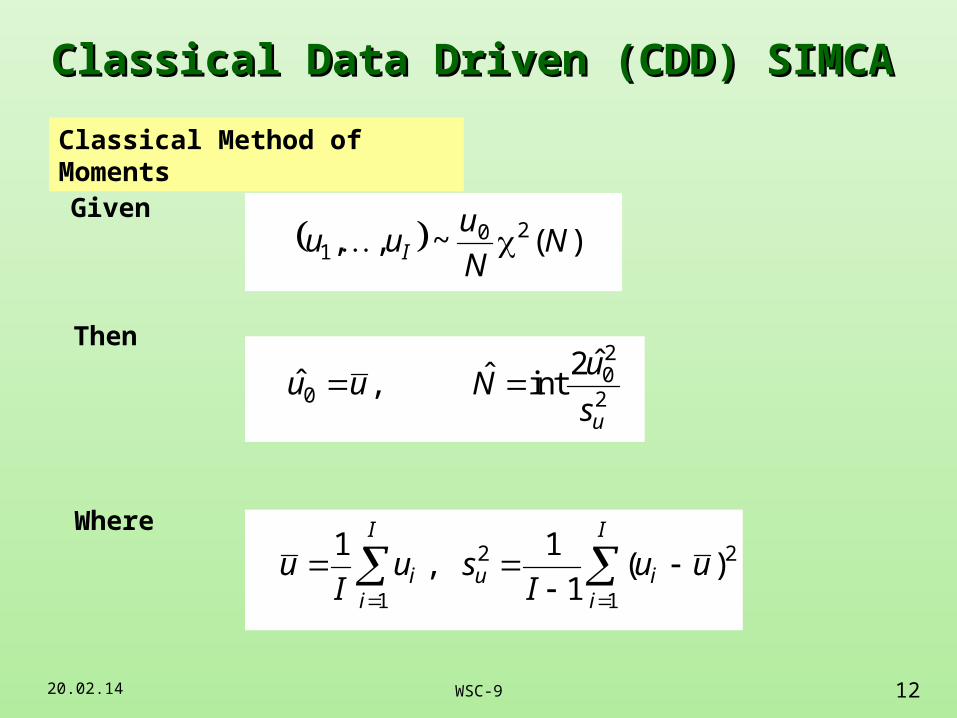
Classical Data Driven (CDD) SIMCA Classical Data Driven (CDD) SIMCA
Classical Method of Moments
2
20
0
ˆ2intˆ,ˆ
us
uNuu
I
iiu
I
ii uu
Isu
Iu
1
22
1
)(1
1,
1
Given
Then
Where
)(~,, 201 N
N
uuu I
20.02.14 13WSC-9
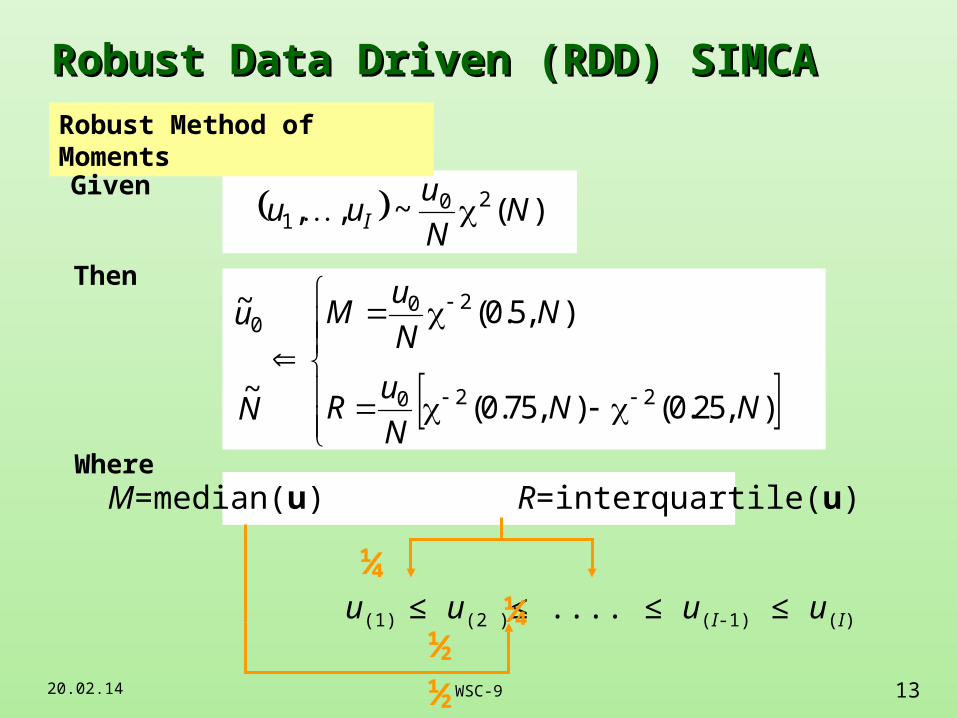
Robust Data Driven (RDD) SIMCA Robust Data Driven (RDD) SIMCA
Robust Method of Moments
M=median(u) R=interquartile(u)
Given
Then
Where
),25.0(),75.0(
),5.0(
~
~
220
200
NNN
uR
NN
uM
N
u
u(1) ≤ u(2 )≤ .... ≤ u(I-1) ≤ u(I)
½ ½
¼ ¼
)(~,, 201 N
N
uuu I
20.02.14 14WSC-9
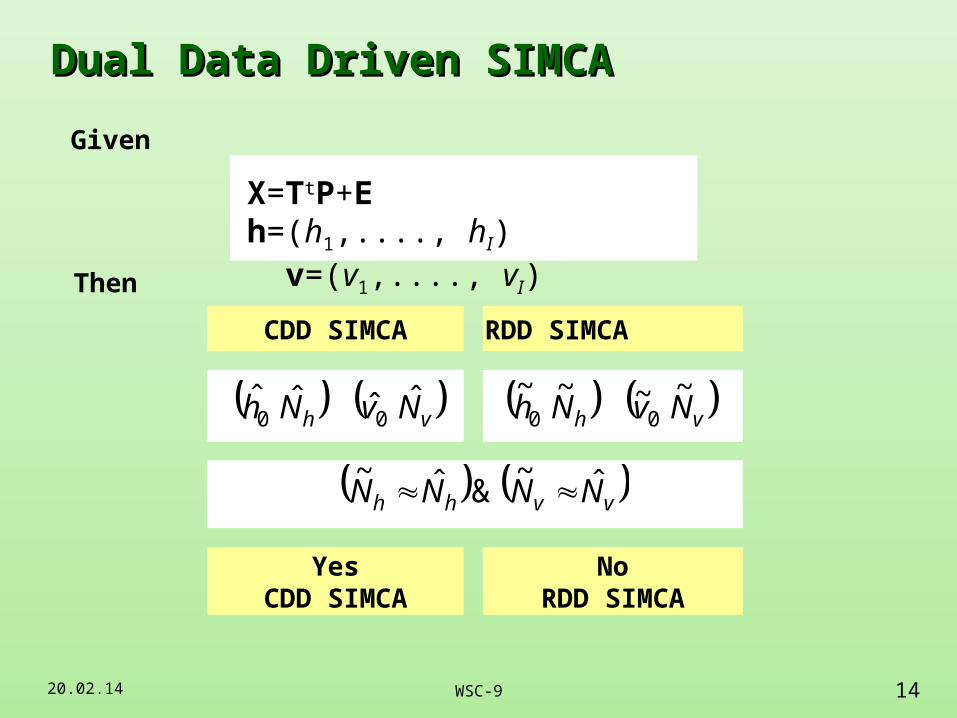
Dual Data Driven SIMCA Dual Data Driven SIMCA
Given
Then
X=TtP+E h=(h1,...., hI) v=(v1,...., vI)
CDD SIMCA RDD SIMCA
YesCDD SIMCA
NoRDD SIMCA
vh NvNh ˆˆˆˆ00
vh NvNh~~~~
00
vvhh NNNN ˆ~&ˆ~
20.02.14 15WSC-9
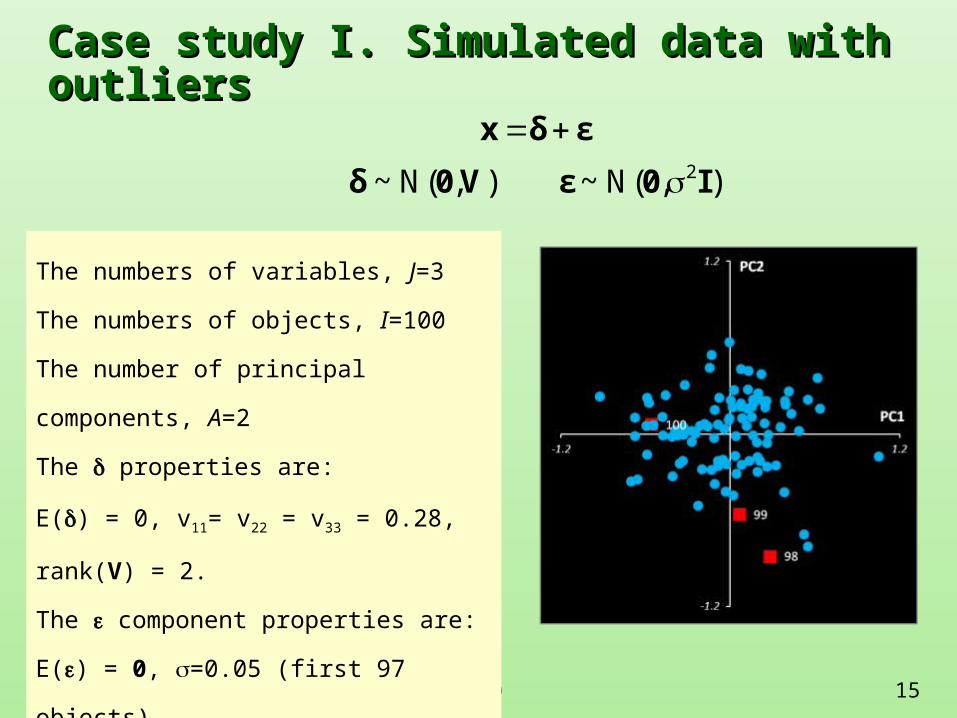
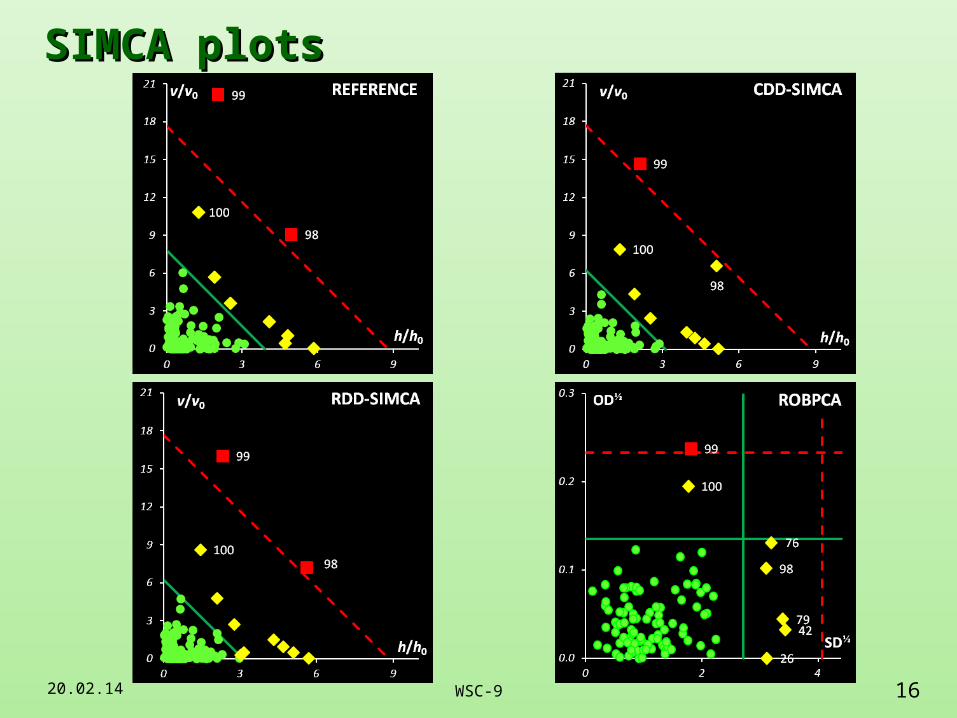
Case study I. Simulated data with outliersCase study I. Simulated data with outliers
The numbers of variables, J=3
The numbers of objects, I=100
The number of principal components, A=2
The properties are:
E() = 0, v11= v22 = v33 = 0.28, rank(V) = 2.
The component properties are:
E() = 0, =0.05 (first 97 objects)
E() = 0, =0.2 (last 3 objects)
),(N~),(N~ 2I0εV0δ
εδx
20.02.14 16WSC-9
SIMCA plotsSIMCA plots

20.02.14 17WSC-9
REFERENCE & RDD-SIMCAREFERENCE & RDD-SIMCA
20.02.14 18WSC-9
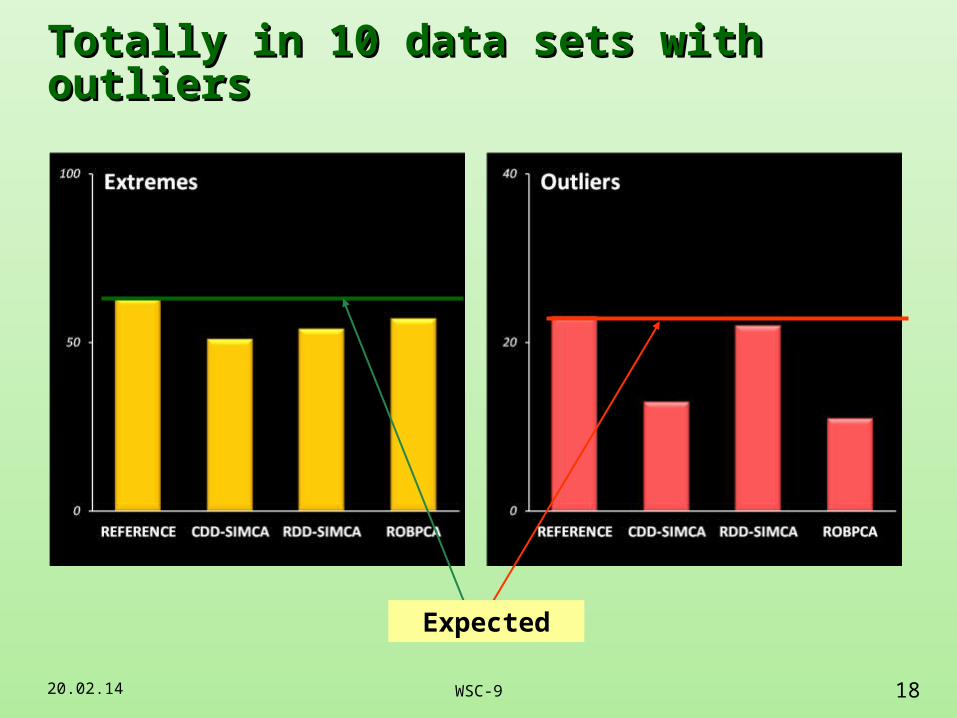
Totally in 10 data sets with outliersTotally in 10 data sets with outliers
Expected
20.02.14 19WSC-9
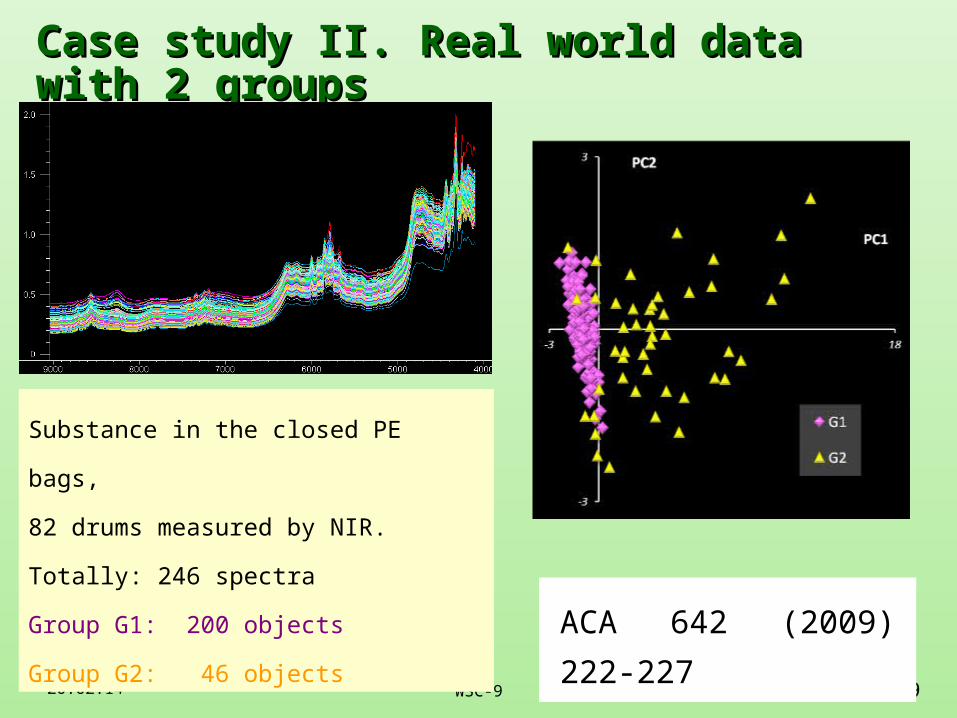
Case study II. Real world data with 2 groupsCase study II. Real world data with 2 groups
Substance in the closed PE bags,
82 drums measured by NIR.
Totally: 246 spectra
Group G1: 200 objects
Group G2: 46 objects ACA 642 (2009) 222-227
20.02.14 20WSC-9
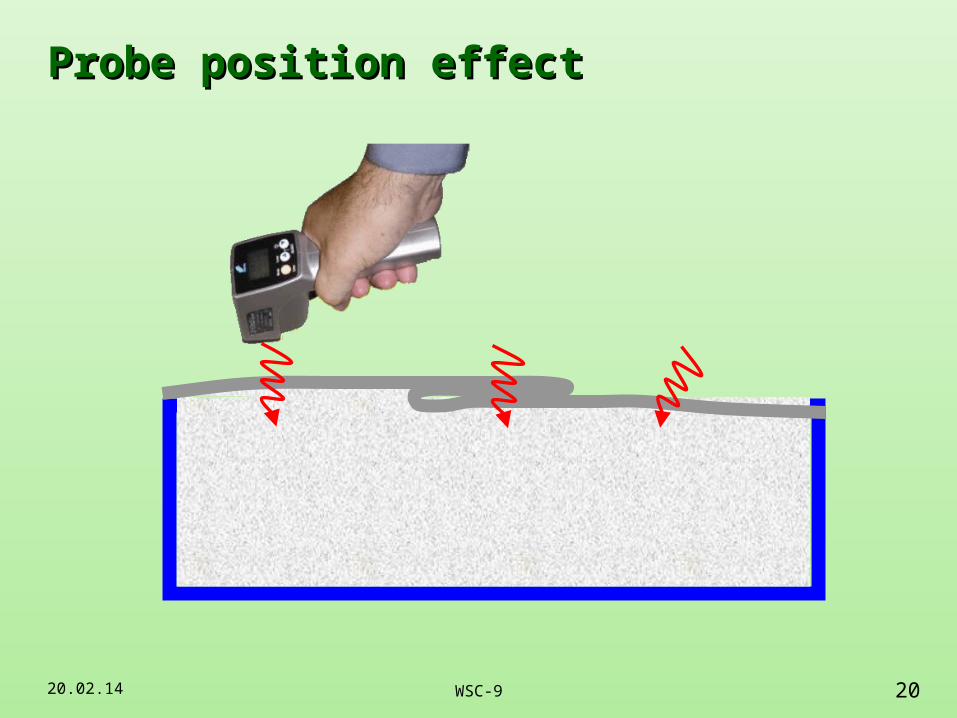
Probe position effectProbe position effect
20.02.14 21WSC-9
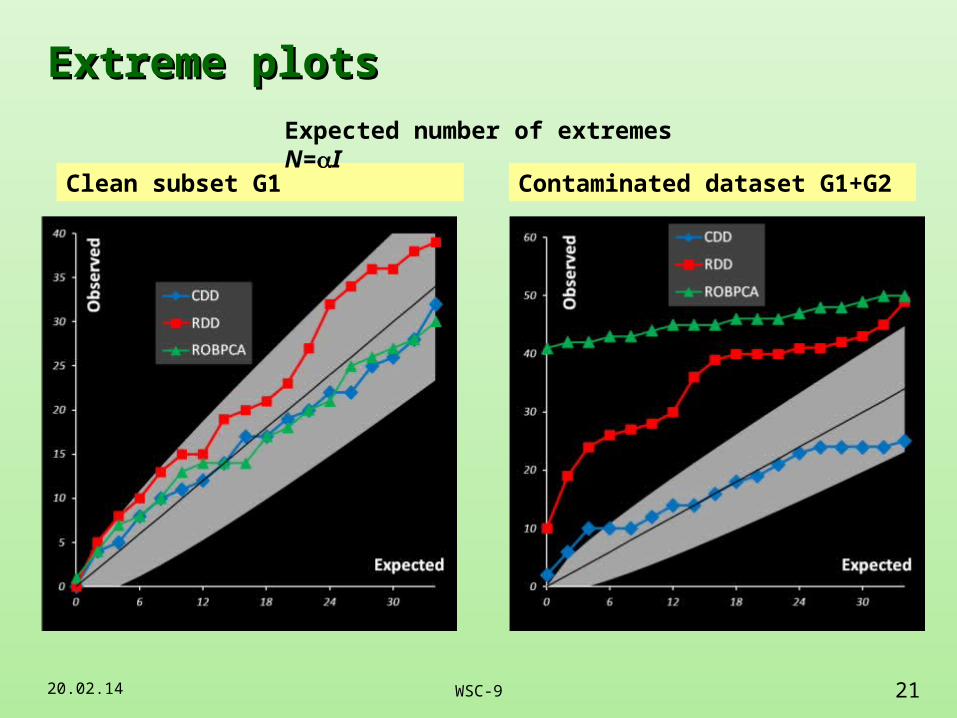
Extreme plotsExtreme plots
Clean subset G1 Contaminated dataset G1+G2
Expected number of extremes N=I
20.02.14 22WSC-9
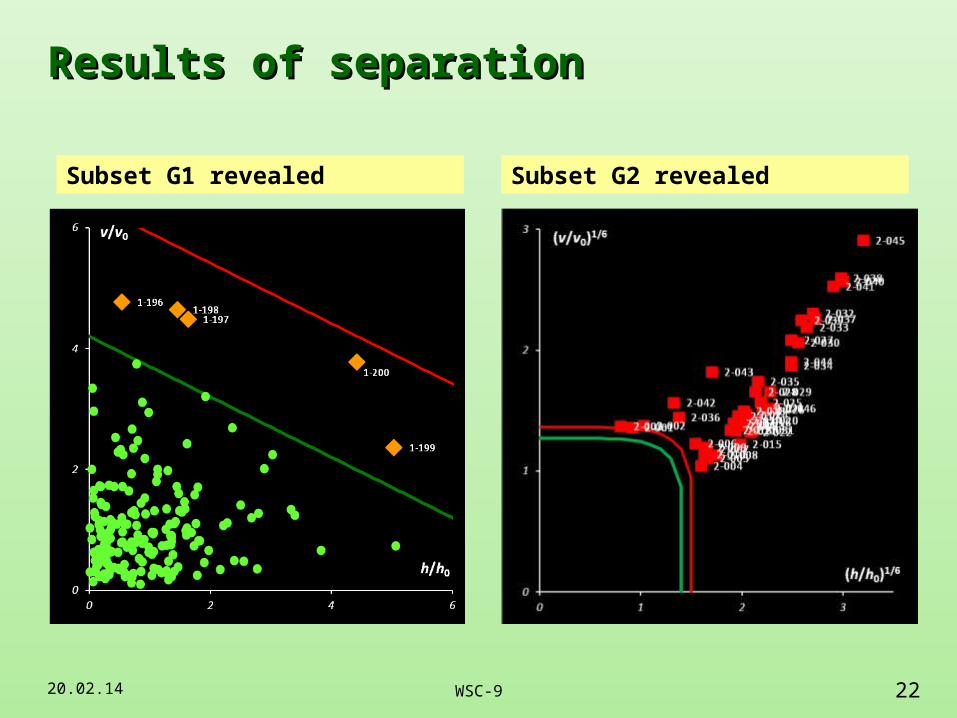
Results of separationResults of separation
Subset G1 revealed Subset G2 revealed
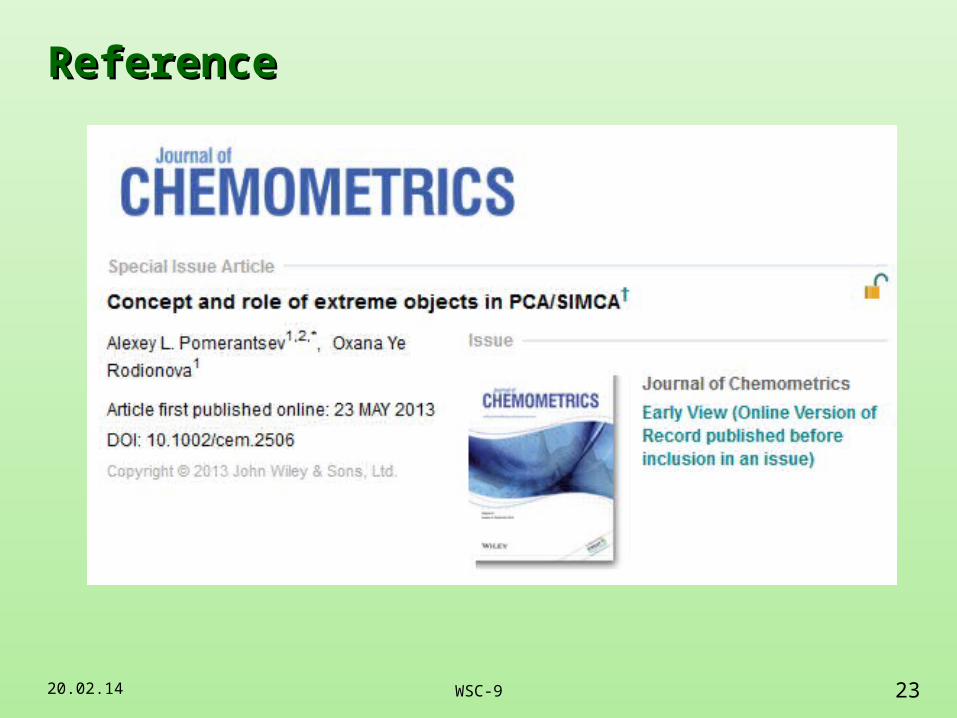
ReferenceReference
20.02.14 23WSC-9
One-class classificationOne-class classification
20.02.14 24WSC-9
Alternatives
Type II error =1− Type I error
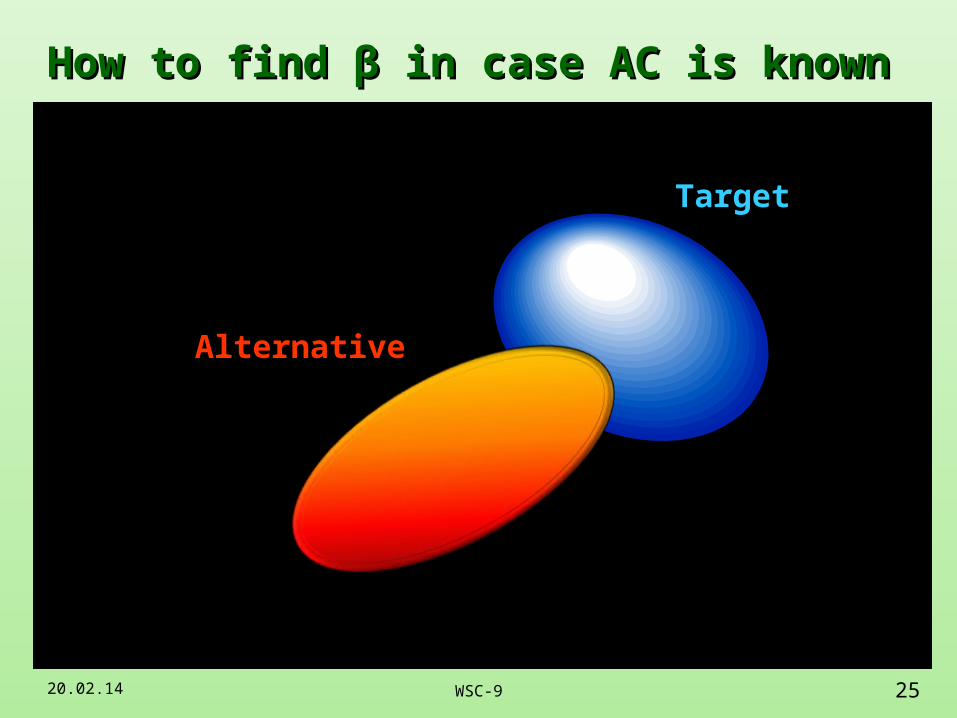
How to find How to find ββ in case AC is known in case AC is known
20.02.14 25WSC-9
Target
Alternative
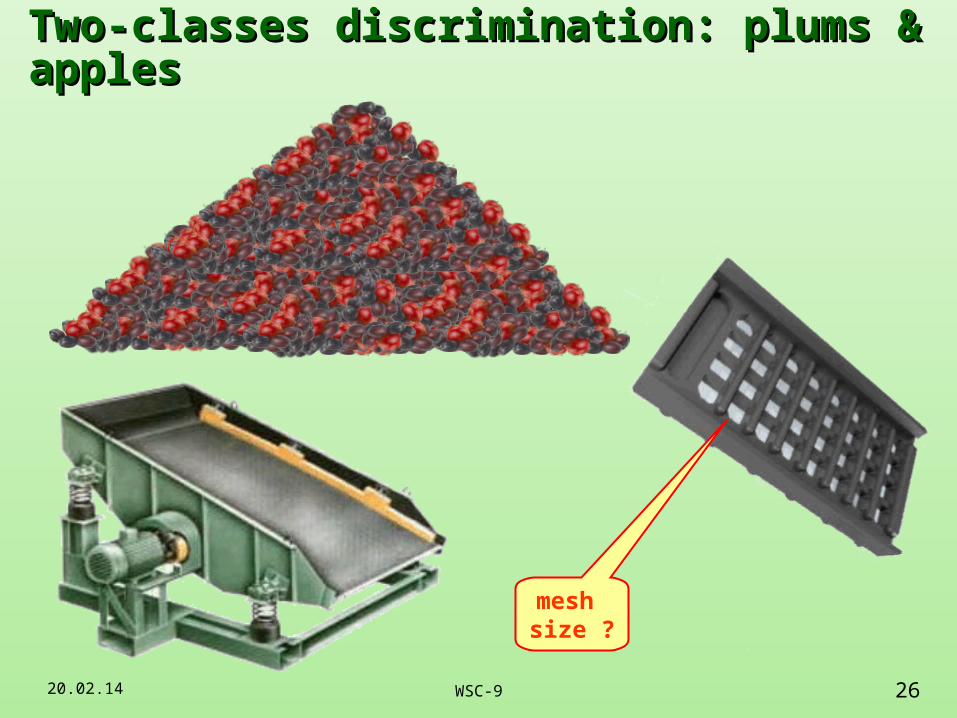
Two-classes discrimination: plums & applesTwo-classes discrimination: plums & apples
20.02.14 26WSC-9
mesh size ?
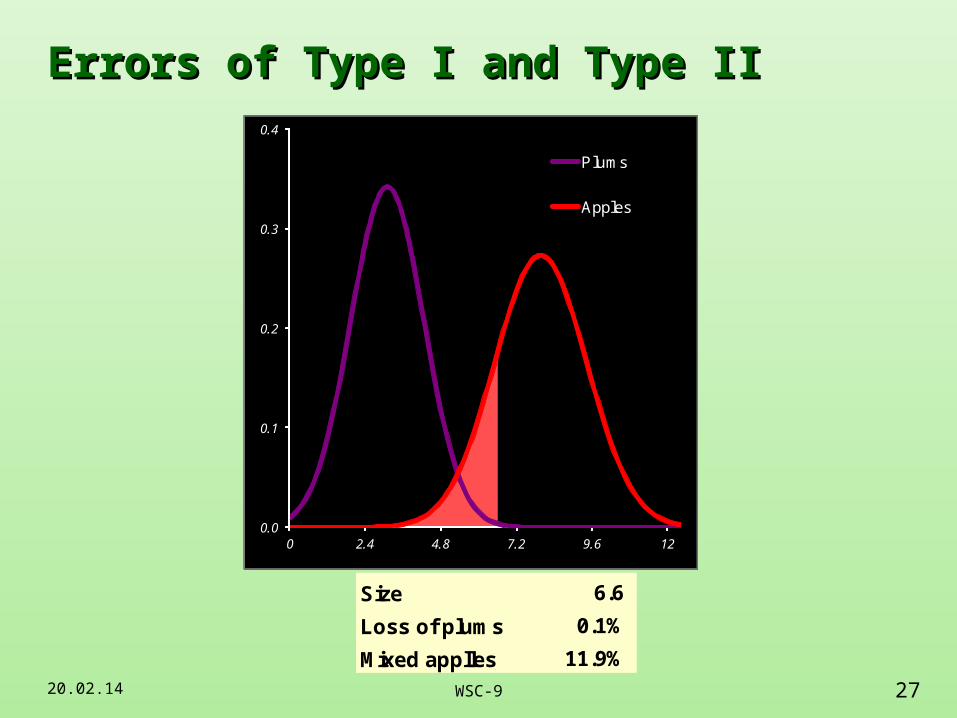
Errors of Type I and Type IIErrors of Type I and Type II
20.02.14 27WSC-9
Size
Loss of plums
Mixed applles
4.2
17.3%
0.1%
0.0
0.1
0.2
0.3
0.4
0 2.4 4.8 7.2 9.6 12
Plums
Apples
Size
Loss of plums
Mixed applles
5.6
1.6%
2.1%
0.0
0.1
0.2
0.3
0.4
0 2.4 4.8 7.2 9.6 12
Plums
Apples
Size
Loss of plums
Mixed applles
6.6
0.1%
11.9%
0.0
0.1
0.2
0.3
0.4
0 2.4 4.8 7.2 9.6 12
Plums
Apples
PC1
PC2
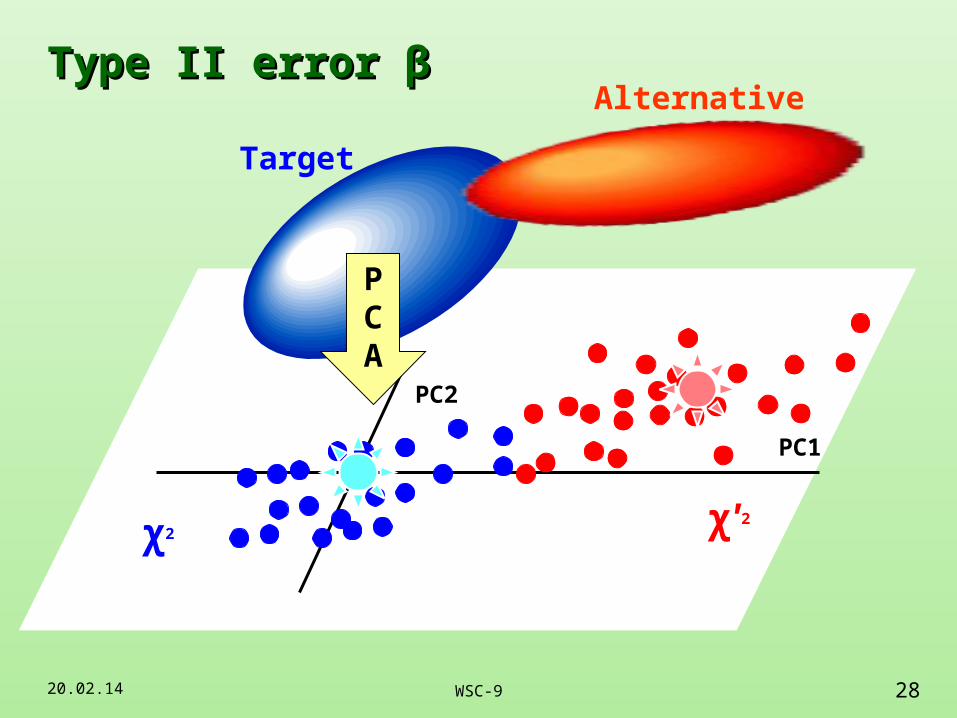
Type II error Type II error ββ
20.02.14 28WSC-9
Target
Alternative
PCA
χ'2
χ2
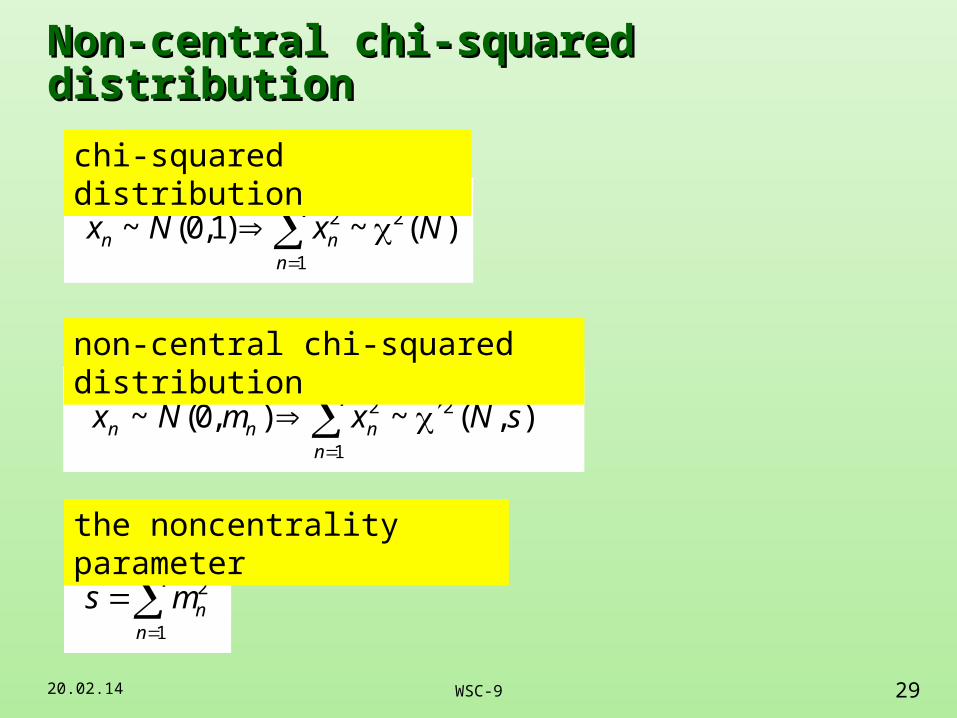
Non-central chi-squared distributionNon-central chi-squared distribution
20.02.14 29WSC-9
)(~)1,0(~ 2
1
2 NxNxN
nnn
),(~),0(~ 2
1
2 sNxmNxN
nnnn
N
nnms
1
2
the noncentrality parameter
chi-squared distribution
non-central chi-squared distribution

Calculation of Calculation of ββ
20.02.14 30WSC-9
Total distance of Target class (TC)
),1('Pr 2vh NNc
Type II error
h0=? ,v0=?, Nh=?, Nv=?
)(~ 2
00vh
vh NNvv
Nh
h
Nc
Total distance of Alternative class (AC)
??0 sc
),(~ 2
000
sNNcvv
Nh
h
Nc vhi
vi
hi
20.02.14 31WSC-9
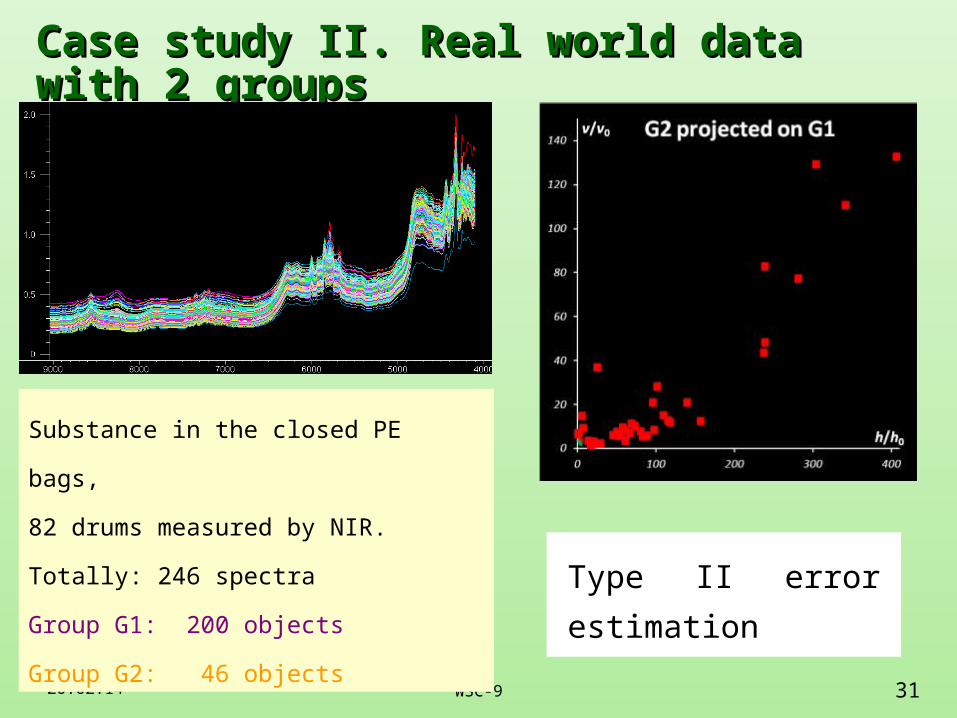
Case study II. Real world data with 2 groupsCase study II. Real world data with 2 groups
Substance in the closed PE bags,
82 drums measured by NIR.
Totally: 246 spectra
Group G1: 200 objects
Group G2: 46 objects
Type II error estimation

G2 = AC1 + AC2 + AC3 + AC4G2 = AC1 + AC2 + AC3 + AC4
20.02.14 32WSC-9
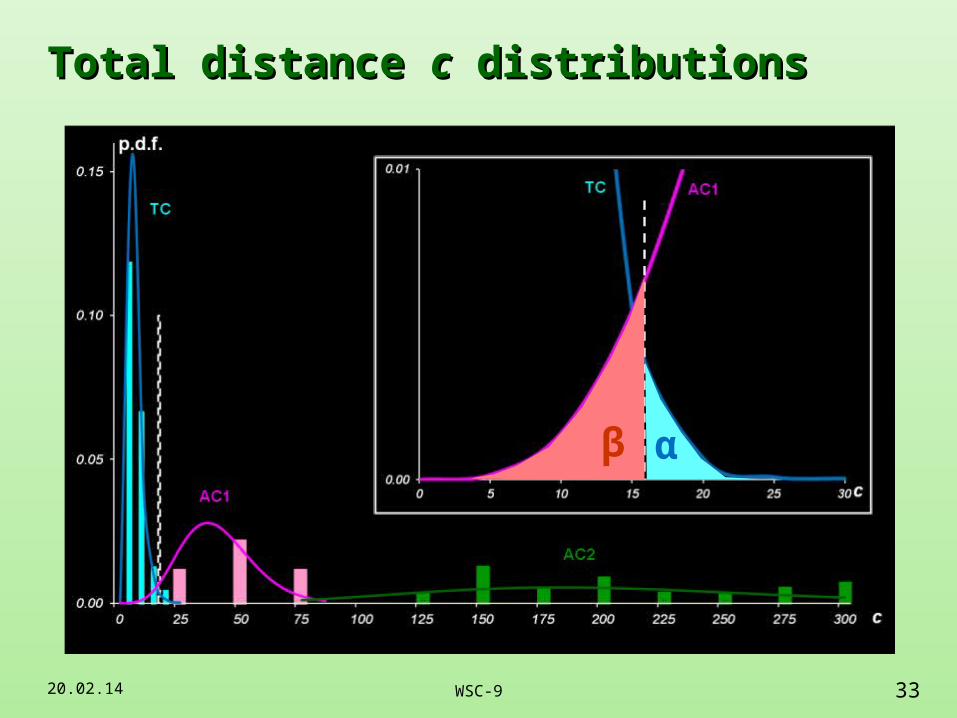
Total distance Total distance cc distributions distributions
20.02.14 33WSC-9
β α
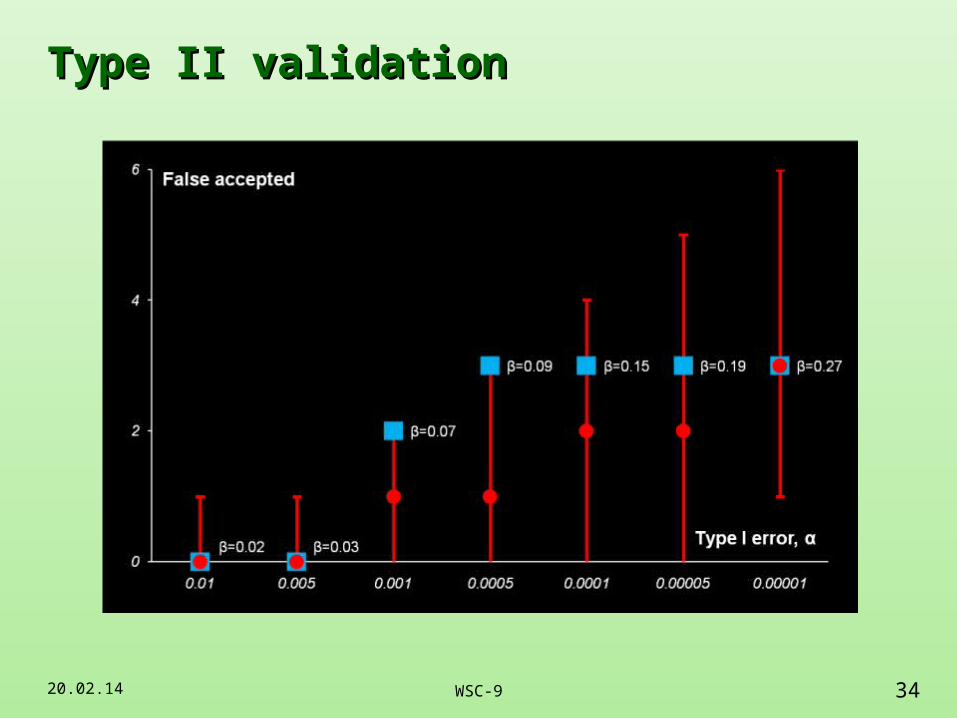
Type II validationType II validation
20.02.14 34WSC-9
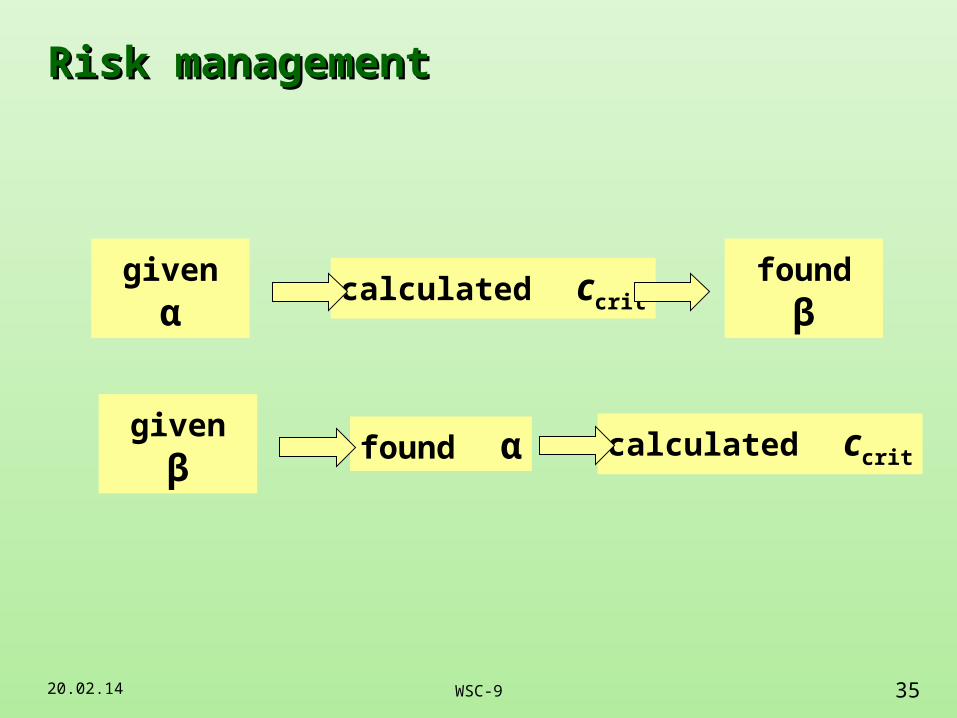
Risk managementRisk management
20.02.14 35WSC-9
given α calculated ccrit found β
given β found α calculated ccrit
20.02.14 36WSC-9
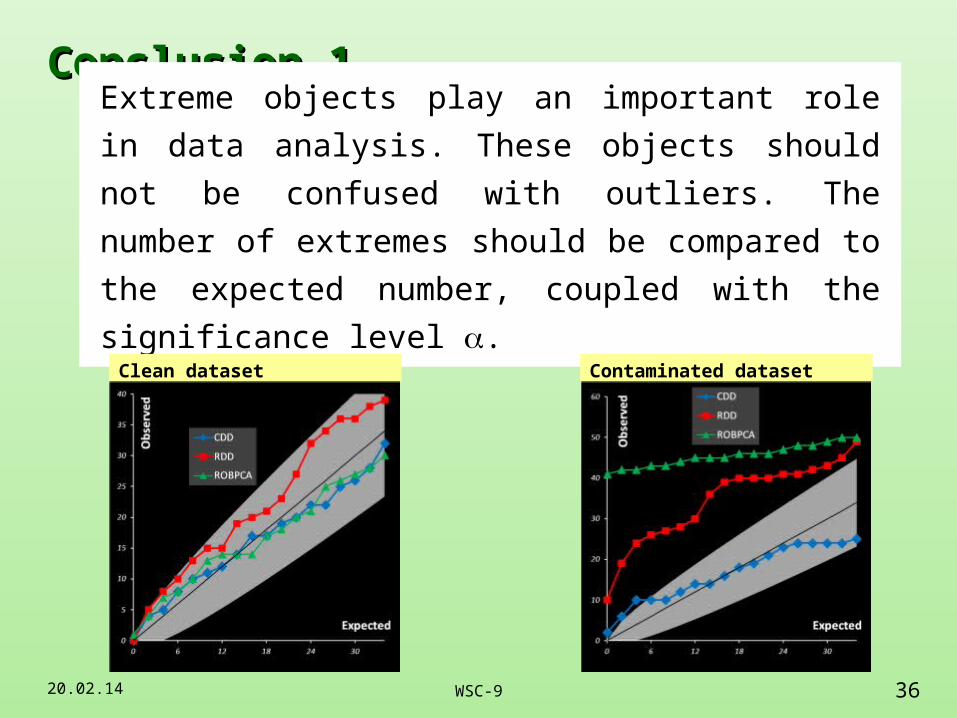
Conclusion 1Conclusion 1
Extreme objects play an important role in data analysis.
These objects should not be confused with outliers. The
number of extremes should be compared to the expected
number, coupled with the significance level .
Clean dataset Contaminated dataset
20.02.14 37WSC-9
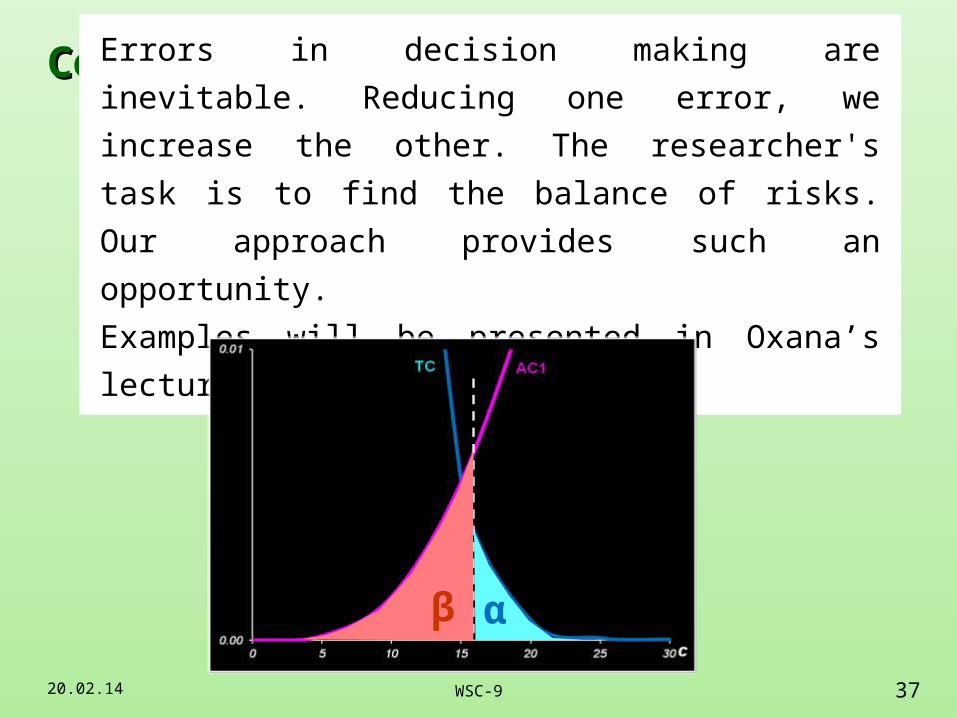
Conclusion 2Conclusion 2Errors in decision making are inevitable. Reducing one
error, we increase the other. The researcher's task is to find
the balance of risks. Our approach provides such an
opportunity.
Examples will be presented in Oxana’s lecture.
β α
20.02.14 38WSC-9
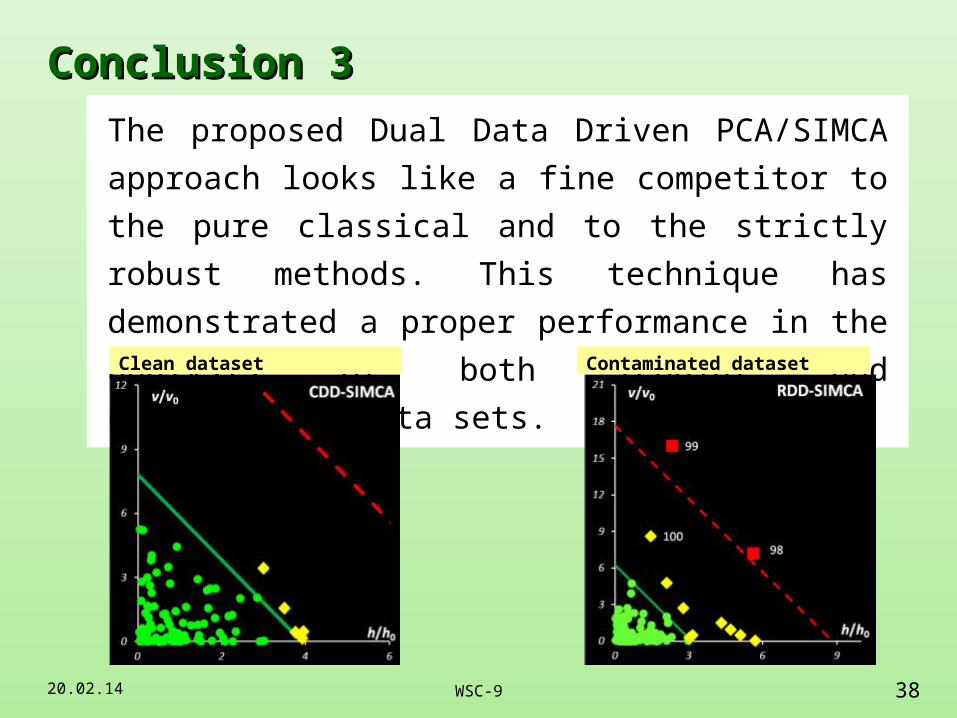
Conclusion 3Conclusion 3
The proposed Dual Data Driven PCA/SIMCA approach
looks like a fine competitor to the pure classical and to the
strictly robust methods. This technique has demonstrated a
proper performance in the analysis of both regular and
contaminated data sets.Clean dataset Contaminated dataset

20.02.14 39WSC-9
Thank you for Thank you for your attentionyour attention
A Lawyer’s Mistake