Doubly Fed Induction Generator models in PSS/E · PDF fileDoubly Fed Induction Generator...
24
1 2004-29-01 Workshop - Nordic TSOs SINTEF Energiforskning AS Doubly Fed Induction Generator models in PSS/E Ian Norheim SINTEF Energy Research January 2004
Transcript of Doubly Fed Induction Generator models in PSS/E · PDF fileDoubly Fed Induction Generator...
1
2004-29-01 Workshop - Nordic TSOs
SINTEF Energiforskning AS
Doubly Fed Induction Generator models in PSS/E
Ian Norheim
SINTEF Energy Research
January 2004
2
2004-29-01 Workshop - Nordic TSOs
SINTEF Energiforskning AS
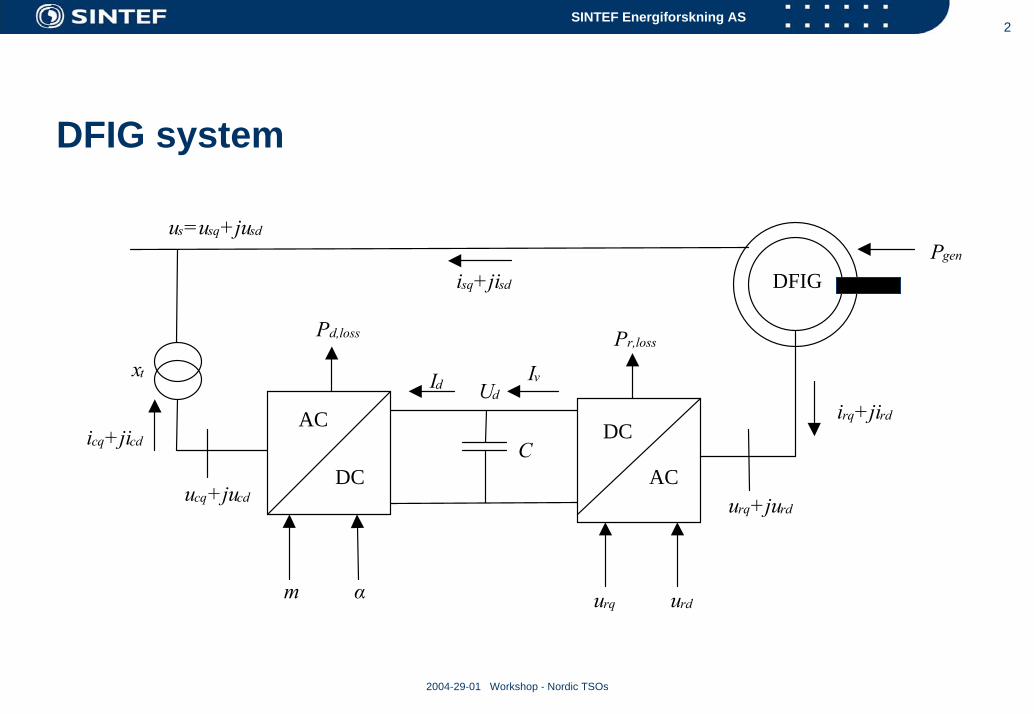
DFIG system
AC
DCAC
DC
us=usq+jusd
isq+jisd
irq+jird
ucq+jucd urq+jurd
icq+jicd
xt
m α urq urd
Pd,loss Pr,loss
IvId
C
Ud
DFIGPgen

3
2004-29-01 Workshop - Nordic TSOs
SINTEF Energiforskning AS
Some benefits of Doubly Fed InductionGenerators for Wind Turbines
1. Torque pulsations are reduced
2. The system efficiency is improved (?)
3. The acoustic noise at low power operation is lowered
4. Possible reactive compensation
5. Reduced requirements to the pitch controller

4
2004-29-01 Workshop - Nordic TSOs
SINTEF Energiforskning AS

5
2004-29-01 Workshop - Nordic TSOs
SINTEF Energiforskning AS
Implemented PSS/E model of DFIG
Programmed in FortranThird order model, i.e the stator transients due to the stator flux are neglectedInteracts with turbine models via the mechanical power and the speedThe transients due to the DC-link are neglected The active power flowing into the rotor circuit equals the active power drawn from the grid by the net side converterAn initialisation routine for the model has been implemented
6
2004-29-01 Workshop - Nordic TSOs
SINTEF Energiforskning AS
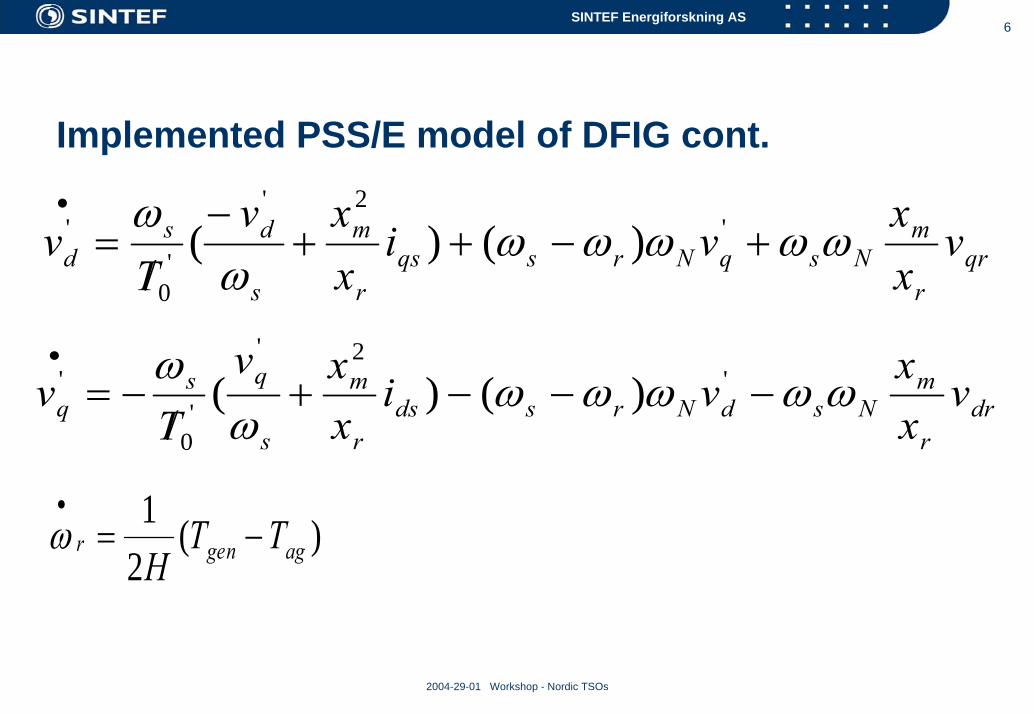
Implemented PSS/E model of DFIG cont.
qrr
mNsqNrsqs
r
m
s
dsd v
xx
vixxv
Tv ωωωωω
ωω
+−++−
/=
•'
2'
'0
' )()(
drr
mNsdNrsds
r
m
s
qsq v
xx
vixxv
Tv ωωωωω
ωω
−−−+/
−=•
'2'
'0
' )()(
)(21
aggenr TTH
−=•
ω
7
2004-29-01 Workshop - Nordic TSOs
SINTEF Energiforskning AS
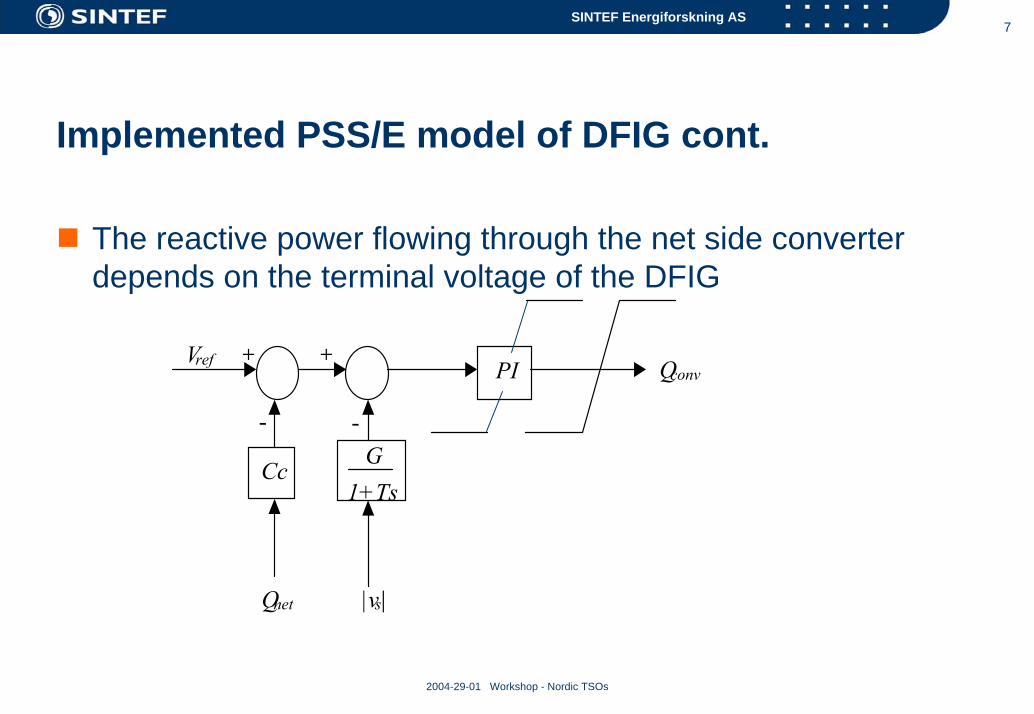
Implemented PSS/E model of DFIG cont.
The reactive power flowing through the net side converter depends on the terminal voltage of the DFIG
Vref
Cc
+
-
Qnet
G1+Ts
+
-
|vs|
PI Qconv
8
2004-29-01 Workshop - Nordic TSOs
SINTEF Energiforskning AS
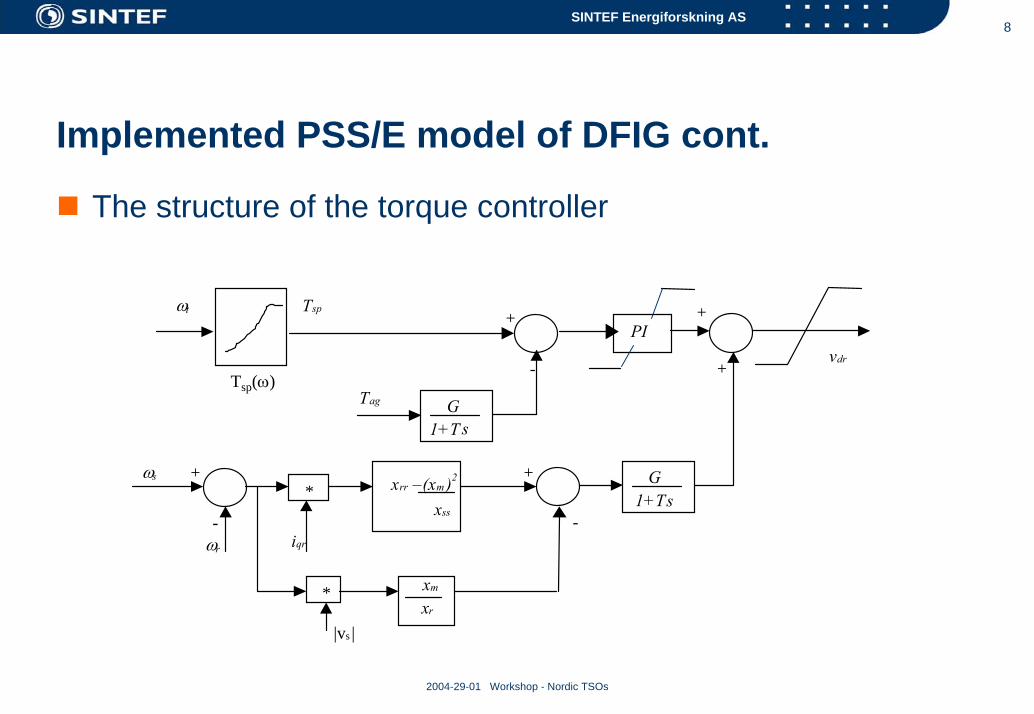
Implemented PSS/E model of DFIG cont.
The structure of the torque controller
ωt
PIvdr
Tsp(ω)
+
-
Tsp
G1+T s
Tag
*ωs
ωr iqr
+
-
xrr –(xm )2
xss
G1+Ts
*
|vs |
xm
xr
+
-
+
+
9
2004-29-01 Workshop - Nordic TSOs
SINTEF Energiforskning AS
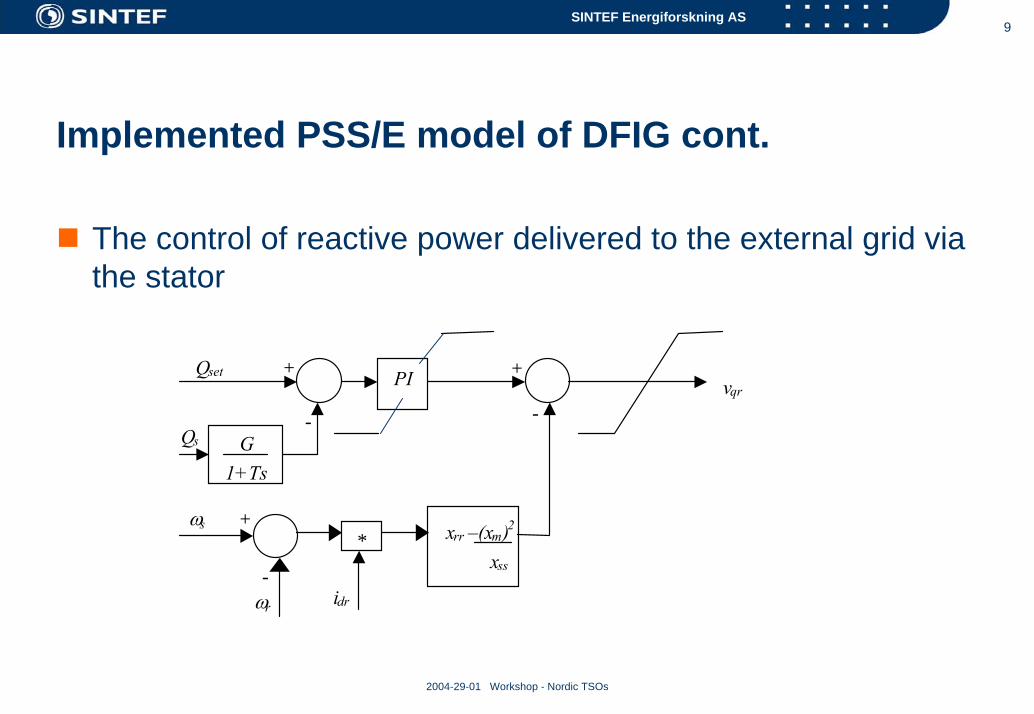
Implemented PSS/E model of DFIG cont.
The control of reactive power delivered to the external grid via the stator
G1+Ts
PI+Qset
-Qs
+
*
-
ωs
ωr idr
vqr
+
-
xrr –(xm)2
xss
10
2004-29-01 Workshop - Nordic TSOs
SINTEF Energiforskning AS
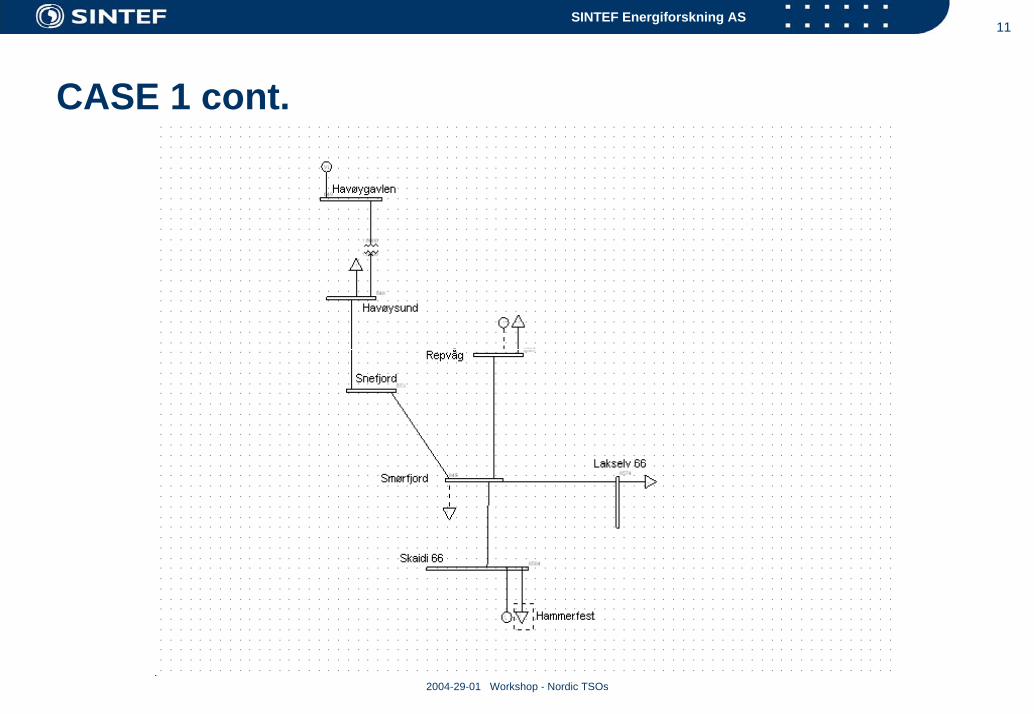
Simulation CASE 1In this case the DFIG model was used to represent the Havøygavlen wind farmA model of the Havøygavlen wind farm was placed into a detailed PSS/E model of the Nordic system The chosen load flow in the simulated case was built on measurements performed by Statnett/SINTEF in October 2003Disturbances in the grid were used to trigger the dynamic responses of the DFIGThe simulated dynamic responses of the wind farm are analysed and compared with the measured dynamic resposeThe turbine torque is assumed to be constant during the simulation. The shaft is modeled with a stiffness and a damping
11
2004-29-01 Workshop - Nordic TSOs
SINTEF Energiforskning AS
CASE 1 cont.
12
2004-29-01 Workshop - Nordic TSOs
SINTEF Energiforskning AS
CASE 1 cont.
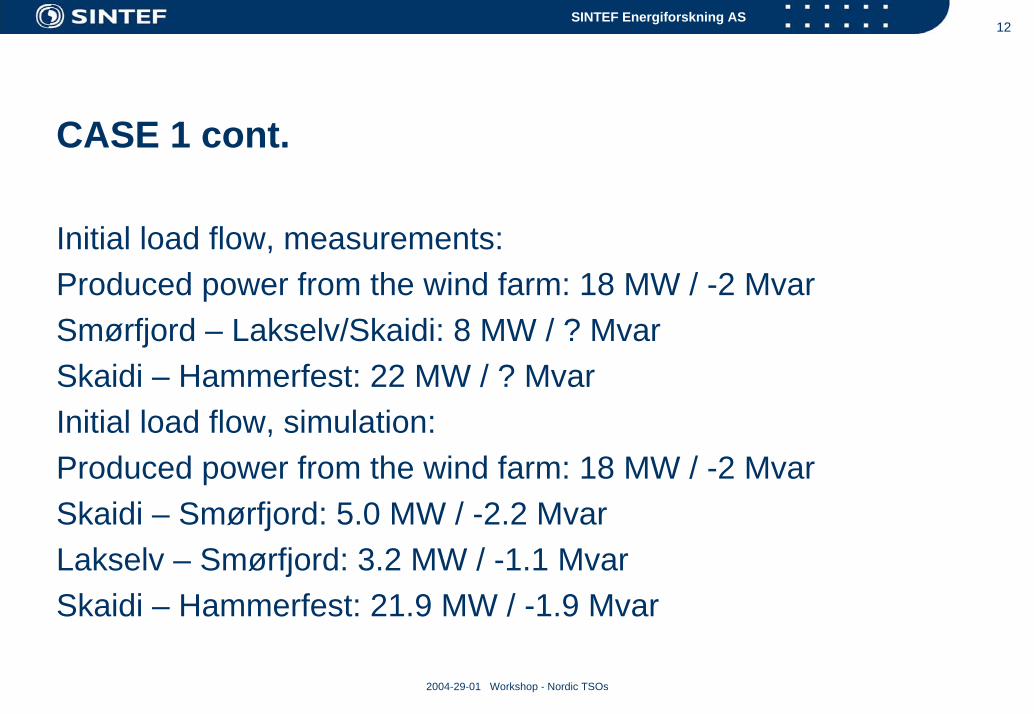
Initial load flow, measurements:Produced power from the wind farm: 18 MW / -2 MvarSmørfjord – Lakselv/Skaidi: 8 MW / ? MvarSkaidi – Hammerfest: 22 MW / ? MvarInitial load flow, simulation:Produced power from the wind farm: 18 MW / -2 MvarSkaidi – Smørfjord: 5.0 MW / -2.2 MvarLakselv – Smørfjord: 3.2 MW / -1.1 MvarSkaidi – Hammerfest: 21.9 MW / -1.9 Mvar
13
2004-29-01 Workshop - Nordic TSOs
SINTEF Energiforskning AS
CASE 1 cont.
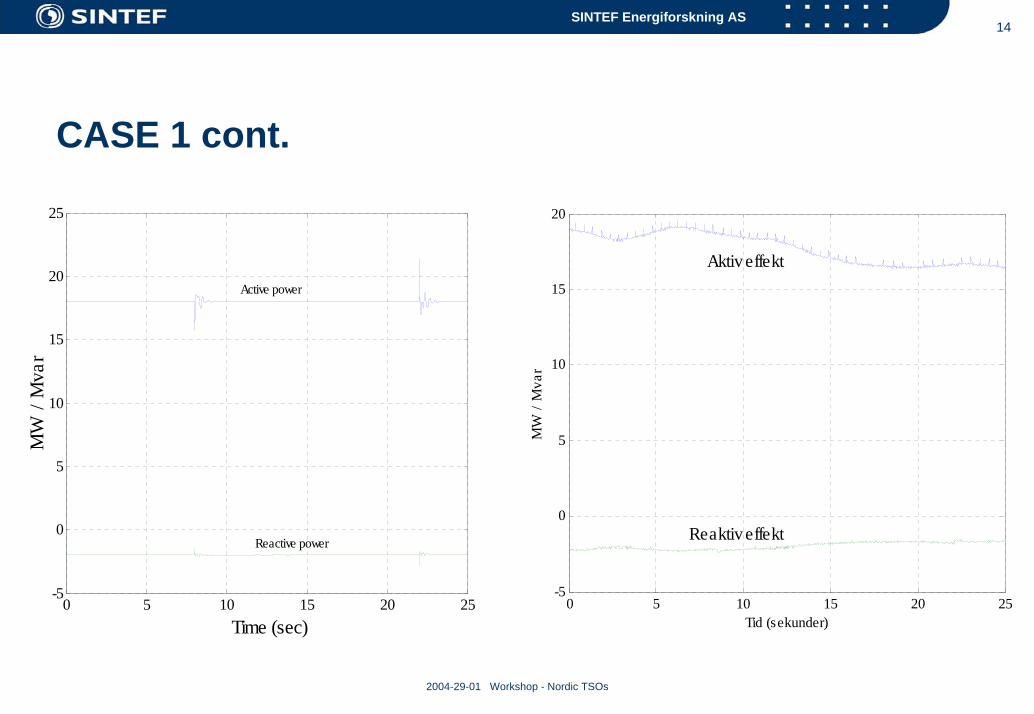
After 8 seconds of the simulation time the line Skaidi-Smørfjord was disconnected and after 22 seconds this line was reconnected. The wind farm’s active power, reactive power production, and terminal voltages were monitored in both the simulation and in the measurements
14
2004-29-01 Workshop - Nordic TSOs
SINTEF Energiforskning AS
CASE 1 cont.
0 5 10 15 20 25-5
0
5
10
15
20
Tid (sekunder)
MW
/ M
var
Aktiv effekt
Reaktiv effekt
0 5 10 15 20 25-5
0
5
10
15
20
25
Time (sec)
MW
/ M
var
Active power
Reactive power

15
2004-29-01 Workshop - Nordic TSOs
SINTEF Energiforskning AS
CASE 1 cont.
5 10 15 20 25
-3
-2.5
-2
-1.5
-1
-0.5
0
Tid (sekunder)
Rea
ktiv
effe
kt (M
var)
Utkobling av Skaidi-Smørfjord
Innkobling av Skaidi-Smørfjord
0 5 10 15 20 25-3
-2.5
-2
-1.5
-1
-0.5
0
Time (sec)
Mva
r

16
2004-29-01 Workshop - Nordic TSOs
SINTEF Energiforskning AS
CASE 1 cont.
0 5 10 15 20 2566
66.5
67
67.5
68
68.5
69
69.5
70
Tid (sekunder)
Linj
espe
nnin
ger (
kV)
0 5 10 15 20 2566
66.5
67
67.5
68
68.5
69
69.5
70
Time (sec)
Line
vol
tage
(kV
)

17
2004-29-01 Workshop - Nordic TSOs
SINTEF Energiforskning AS
CASE 1 cont.
The uncertainty due to the distibution of active power flow on the lines Smørfjord-Skaidi and Smørfjord-Lakselv may explain some of the large difference in the transient response in active powerAnother factor in this may be the difference in control strategyThe difference in the response of the line voltages are due to different load flow in the simulation and the measurementsThe chosen control strategy for the DFIG in the simulated case does work satisfactory
18
2004-29-01 Workshop - Nordic TSOs
SINTEF Energiforskning AS
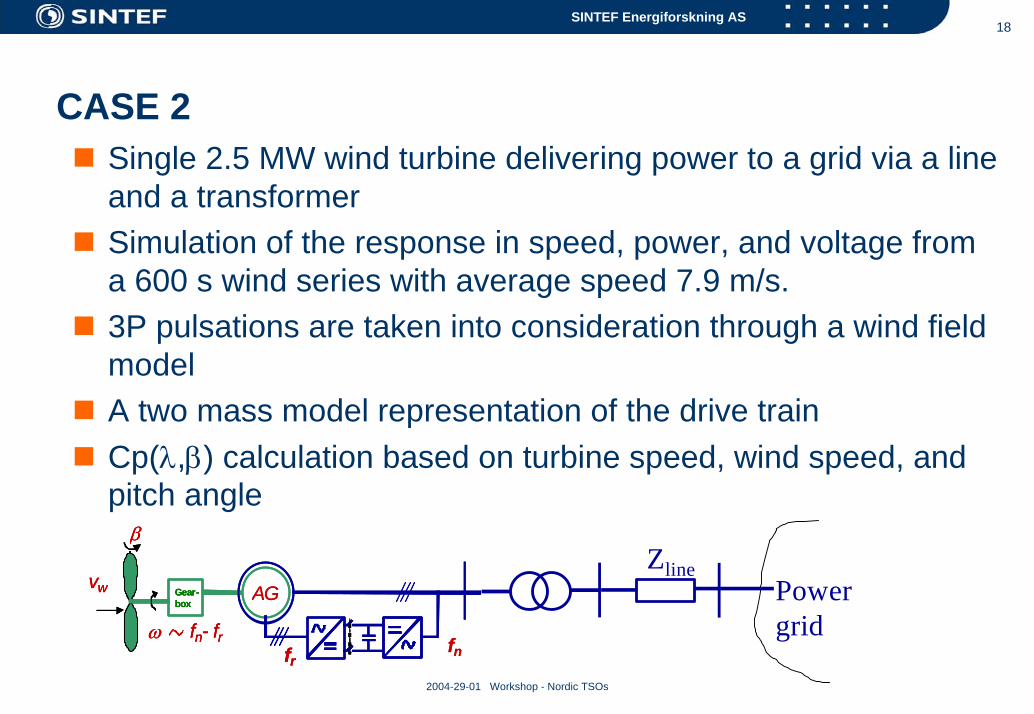
CASE 2Single 2.5 MW wind turbine delivering power to a grid via a line and a transformerSimulation of the response in speed, power, and voltage from a 600 s wind series with average speed 7.9 m/s. 3P pulsations are taken into consideration through a wind field modelA two mass model representation of the drive trainCp(λ,β) calculation based on turbine speed, wind speed, and pitch angle
f n
Gear - box
v w
β
AG
ω f n - f r f r
f n
Gear - box Gear - box
v w
β
v w
β
AG
ω f n - f r ω f n - f r f rf r
Powergrid
Zline
19
2004-29-01 Workshop - Nordic TSOs
SINTEF Energiforskning AS
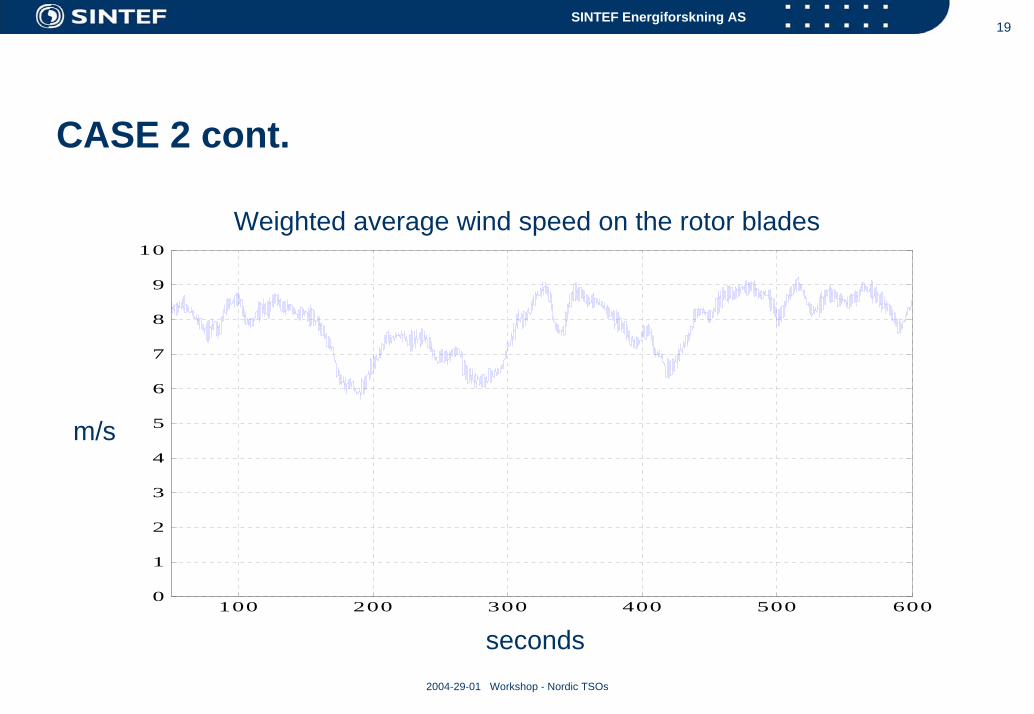
CASE 2 cont.
100 200 300 400 500 6000
1
2
3
4
5
6
7
8
9
10
m/s
seconds
Weighted average wind speed on the rotor blades

20
2004-29-01 Workshop - Nordic TSOs
SINTEF Energiforskning AS
CASE 2 cont.
100 200 300 400 500 6000.5
0.55
0.6
0.65
0.7
0.75
0.8
0.85
0.9
0.95
1Generator speed
pu
seconds

21
2004-29-01 Workshop - Nordic TSOs
SINTEF Energiforskning AS
CASE 2 cont.
100 200 300 400 500 6000
0.1
0.2
0.3
0.4
0.5
0.6
0.7
0.8
0.9
1
Active power delivered to the grid
MW
seconds

22
2004-29-01 Workshop - Nordic TSOs
SINTEF Energiforskning AS
CASE 2 cont.
100 200 300 400 500 600-0.1
-0.08
-0.06
-0.04
-0.02
0
0.02
0.04
0.06
0.08
Reactive power flowing from the stator to the grid
Mvar
seconds
23
2004-29-01 Workshop - Nordic TSOs
SINTEF Energiforskning AS
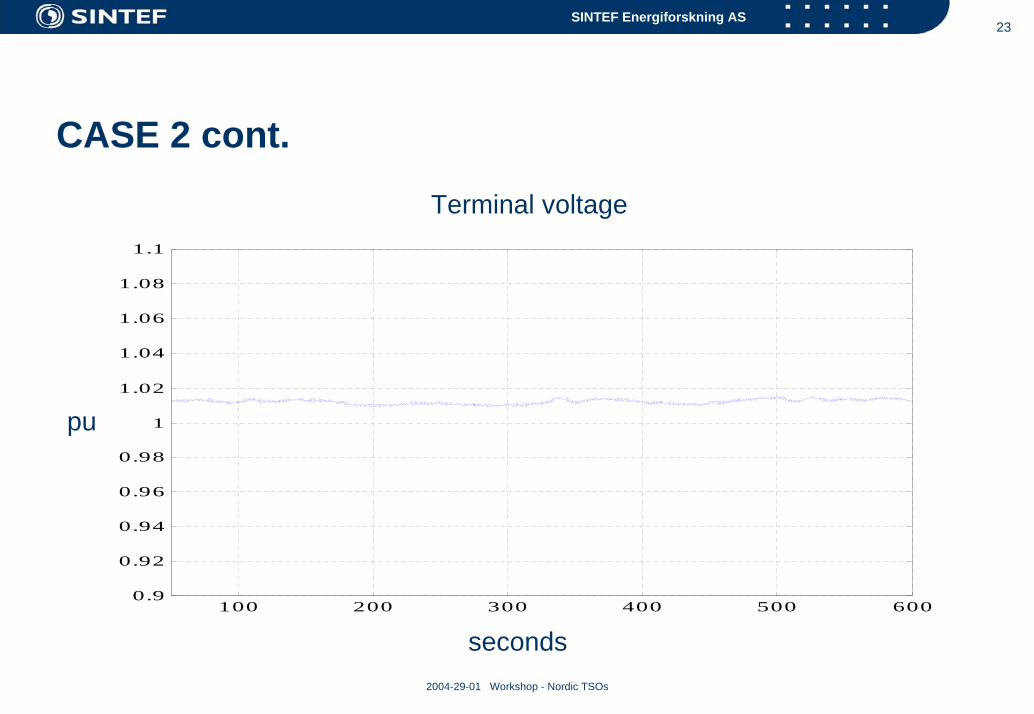
CASE 2 cont.
100 200 300 400 500 6000.9
0.92
0.94
0.96
0.98
1
1.02
1.04
1.06
1.08
1.1
Terminal voltage
pu
seconds

24
2004-29-01 Workshop - Nordic TSOs
SINTEF Energiforskning AS
Further work
Make the DFIG model more user friendly (put in warning messages etc.)Improve the documentation on how to use the modelPerform thorough test simulations with the DFIG model (Faults, 3P fluctuations, system damping)